
Abstract
Rice is a staple meal that helps people worldwide access sufficient food. However, this crop has several illnesses, significantly lowering its production and quality. Because of this, it is imperative to conduct early disease detection to halt the spread of infections. Because of this, it is desirable to develop an automatic system that will help agronomists, pathologists, and indeed growers in directly diagnosing rice diseases. This would allow for preventative measures to be done as quickly as feasible. In this day and age of artificial intelligence, researchers have experimented with various learning approaches to discover diseases that can affect rice plants. Deep learning has recently seen considerable use in many computer vision and image analysis fields, becoming one of the most prominent machine learning algorithms. Deep learning has also recently found substantial usage in many computer vision and picture analysis fields.
On the other hand, deep learning methods have seen very little application in plant disease recognition, except for some ongoing research centered on the problem and using a public dataset of pictures magnified to show plant leaves. Because of their high computational complexity, which requires a huge memory cost, and the complexity of experimental materials’ backgrounds, which makes it difficult to train an efficient model, deep learning methods have only seen limited use in plant disease recognition. This is due to several factors, including the following: The Inception module was improved to recognise and detect rice plant illnesses in this research by substituting the original convolutions with architecture based on modified-Xception (M-Xception). In addition, ResNet extracts features by prioritising logarithm calculations over softmax calculations to get more consistent classification outcomes. The model’s training utilised a two-stage transfer learning process to produce an effective model. The results of the experiments reveal that the suggested approach can achieve the specified level of performance, with an average recognition fineness of 99.73% on the public dataset and 98.05% on the domestic dataset, respectively. Our proposed work is better as per existing methods and models.
Introduction
Agriculture has been a vital contributor to the economic development, employment, food supply, infrastructure, trading, and other aspects of developing nations and nations that have already established themselves. In several nations still undergoing economic growth, agriculture is still responsible for a sizeable amount of the Gross Domestic Product (GDP). Because several African countries do not even allow any of their public finances to agriculture, the sector does not contribute anything to their countries’ overall gross domestic product [11]. Most of those living in abject poverty are employed in some capacity within the agricultural industry, which is their primary source of income. Rice output is anticipated to be boosted by forty percent by 2030 [17] to fulfil the challenge. If there is any chance of reaching food security on a worldwide scale, then the production of rice needs to be raised in an environmentally friendly manner. This increase in rice production could be made possible by making varieties with high yields and eliminating agricultural pests like bugs and diseases.
Fungi, bacteria, and viruses are the three pathogens most likely to cause rice plants to die. Because these diseases keep spreading, the total amount of rice grown eventually decreases. It causes Asia to lose between 10 and 15% of all the rice it grows [8]. Early detection of these diseases is crucial because it increases production and production quality, reduces pesticides used, and helps the economy grow. Traditional methods, such as manual or optical observation, are hard to do and require much work. However, they are the only ones that can be used. Because the diseases are so hard to figure out, even the most experienced agronomists and pathologists often fail to find the right cause. Because of this, traditional methods are often subjective, inaccurate, and require a lot of work. Because of this, it would be helpful to build an automatic system that would help agronomists, pathologists, and even farmers figure out what’s wrong with rice faster and take steps to stop it right away [28].
With the rise of smartphones and improved computer power, ML and image recognition methods have been used more and more in recent years. This includes fields as different as medical image disposal [21, 36]; biomimetics [22]; and food analysis [9, 20], and applications in industry. Identification of fingerprints: [19] and [18]. Some of them are [2, 14], and [37] all say that our performance in these areas is the best it can be. The way these methods work now is the same as how other methods work. Also, as computer-assisted disease diagnosis has improved, it has led to the development of computer vision algorithms and Convolutional Neural Networks (CNN), which are better at identifying and classifying objects. Recent studies, such as those by [1, 23], and [33]. Deep learning CNN has recently become the most popular way to determine what diseases occur in leaves. [31, 24], and [5] are some of the most recent people to write about this subject. Also, a classifier is often used to identify and group crop diseases, and this area of study has gotten some attention in recent years. [2, 31] discussed different ways to find rice diseases using machine and deep learning (transfer learning). Rice can get sick from the brown spot, bacterial blight, and rice blast. [35] developed a good way to diagnose and classify rice plant diseases based on lesions’ size, shape, and color on photos of the plant’s leaves [35]. The proposed model uses a way to divide a picture into two parts called “global thresholding,” which was invented by Otsu. This makes it possible to eliminate background noise in the original image. The author suggests using a CNN trained with 4,000 pictures of each damaged leaf and 4,000 pictures of healthy rice leaves to find these three diseases in rice. [15, 16] mostly named the diseases that hurt the different kinds of rice. Collecting visual information is the first step in determining what’s wrong with rice plants and how to treat them. Next, we divided this image data into Leaf Blast, Brown Spot, and Healthy leaf. The diseases that hurt the rice plants can be correctly diagnosed and treated. [28] Looked at the effectiveness of many pre-trained deep CNN models, such as AlexNet, Vgg16, ResNet152V2, InceptionV3, InceptionResNetV2, Xception, MobileNet, and InceptionResNetV2. The cutting-edge machine learning method deep learning (DL), specifically deep convolutional neural network (CNN), has quickly become the best way to solve problems of all sizes because it works well and breaks records. Because of this, deep learning is now the best way to handle tasks of different sizes, beating out other methods. [1, 32]. The increasing popularity of CNN techniques can be attributed to their capacity to automatically extract picture features and diagnose and classify plant diseases using a strategy that covers the full process from start to finish. Some examples of how models use images for classification: MobileNetV2, introduced by [25, 26], is a unique mobile architecture that improves the state-of-the-art performance of mobile models over a range of model sizes and across a variety of workloads and benchmarks. More than that, we have discussed some great ways to use these mobile models for object detection inside a special framework called SSD Lite. Mobile DeepLabv3, a condensed version of DeepLabv3, is introduced and used to demonstrate model construction for mobile semantic segmentation. For example, [25]. With their proof of concept, [29] show that joint scattering and group convolutions can be used on generic object image datasets. Separable convolutions, which operate similarly to rigid-motion convolutions, have been shown to increase the performance of convolutional networks. More than that, it is demonstrated that a non-invariant version of the rigid-motion scattering can achieve results on par with the output of the first layers of convolutional networks. [38] developed a new transferable search space. We coined “NASNet search space” to describe this brand-new indexing framework. Additionally, it uses the CIFAR-10 dataset to look for the optimal convolutional layer (or “cell”). To use it on the ImageNet dataset, we stack several more cells, each with its own set of parameters, to create a convolutional architecture we call the NASNet architecture. This structure is a convolutional model. In addition, we introduce Scheduled Drop Path, a novel regularisation technique. One of our contributions is a strategy that greatly improves generalisation in NASNet models. To develop a Convolution Neural Network (ConvNet), limiting the number of resources available is common practice. The accuracy of the ConvNets can be increased by scaling them up if more resources become available in the future. Model scaling was studied methodically by [34], who found that optimising the relationship between network depth, width, and resolution could boost performance. It’s based on a new approach to scaling. As a result, we’ve devised a technique for uniformly upscaling depth, width, and resolution using a compound coefficient that’s easy to implement and yields excellent results. Our results show that this method may efficiently scale up MobileNets and ResNet. Further, we build a new baseline network using neural architecture search. We next apply this network on a larger scale to produce a set of models we call Efficient Nets. Compared to previous ConvNets, these models are vastly superior in accuracy and efficiency.
Previous studies have used Deep Learning in feature extraction as a classification engine or a feature extractor in its purest form. Using InceptionV3 and various machine learning algorithms as classifiers, such as Random Forest, SVM, Logistic Regression, Naive Bayes, and Neural Network, the research team of [39] proposed a classification of plant diseases on private datasets with automatic feature extraction. This classification would be performed on plant diseases. This model gathered 2048 attributes, suggesting that it has an accuracy of 94% in distinguishing between diseased and healthy plants’ leaf surfaces [39]. During the preprocessing stage, the researchers eliminated the backdrop, which resulted in an increase in the brightness of the picture and a reduction in the data size. In light of this, it should be no surprise that the CNN algorithm and the ResNet model performed far better than the other four models (LeNet, AlexNet, VGGNet16, and VGGNet19) when it came to the classification task.
In specifically, [40] produced EfficientNet CNN models for plant disease classification using the Plant Village dataset as the test object. These models were applied to the Plant Village dataset. The suggested model obtained a higher average accuracy than AlexNet, VGGNet16, Inception-V3, and RestNet50, while having fewer parameters than other models. On the other hand, the data set distribution for training, validation, and testing comparison was quite radical (90 : 7:3, respectively). As a result, it calls for more verification, which should include more frequent training, validation, and dissemination of test data. Nevertheless, there is a risk that the model will be too accurate and will not function well if applied to a larger amount of test data. Conversely, the calculation time required by the recommended model is not noticeably quicker than that required by the AlexNet, VGGNet16, Inception-V3, and RestNet50 models.
In recent years, the idea of a modified MobileNetV2 has been floated. Similarly, [41] compared the MobileNetV2 and SSCNN models on a mobile platform for citrus leaf disease classification. They found that the MobileNetV2 model achieved reduced processing time and parameters, while the SSCN model achieved an accuracy of 99% and the MobileNetV2 model achieved an accuracy of 92%. Nevertheless, only citrus plant items were taken into consideration for this investigation. Consequently, the suggested model does not necessarily provide excellent results for other plant species because the leaves of other plants have distinct features. In addition, [42] used MobileNetV2 in conjunction with Soft Attention to identify small lesion characteristics. They achieved an accuracy of 99.71% for the Plant Village dataset and 99.13% for the local dataset, respectively. Lately, researchers have sought to increase the performance of individual CNN models by using CNN ensembles and concatenated models. Using the Turk-Plants dataset, which consists of 4447 photos categorised into 15 different groups, [43] suggested a CNN ensemble model for feature extraction and SVM as a classifier. Their models include AlexNet, ResNet18, GoogleNet, ResNet101, ResNet50, and DenseNet201. Despite the fact that numerous parameters were generated throughout the experiment, the findings suggest that the models achieved the highest possible average accuracy of 97.56%. Nevertheless, the accuracy did not considerably increase compared to the individual CNN models. [44] proposed an additional ensemble model for the diagnosis of brain tumours. This model would conduct multi-level feature extraction using the InceptionV3 and DenseNet201 models. Before moving to the classification layer, the previously extracted features from the chosen block layers are concurrently connected [44]. The multi-level feature extraction used by DenseNet201 was able to attain an average accuracy of 99.51% when distinguishing between healthy and unhealthy MRI pictures based on the trial’s findings. Because InceptionV3 and DenseNet201’s separate features were concatenated into a single model, the total number of parameters and the model size is more than it would have been otherwise. Compared to MobileNetV2 and Xception models, the number of parameters and the size of this model are increased. The next ensemble model was presented by [45], demonstrating that the five individual CNN models perform very well. The average recall values of the ResNeXt, DenseNet, SeResNeXt, Xception, and ResNet macro models were 88%, 91%, 89%, and 88%, respectively, for skin lesion classification. The ensemble model has a recall score of 94%, its greatest possible result [45]. The performance of the individual Xception model is much higher than that of the other four individual models. The suggested ensemble of five models leads to a large increase in the number of parameters and the model size. In general, CNN models have been used to extract features across various datasets autonomously. MobileNetV2 and SSCNN models were deployed on smartphone devices by [41], and these devices achieved an accuracy of 99% exclusively for citrus trees. [43] presented a CNN ensemble model for the Turkey plant dataset, which included AlexNet, GoogleNet, ResNet18, ResNet50, ResNet101, and DenseNet201. This model achieved an average accuracy of 97.56%, which did not significantly increase from the individual models proposed by other researchers. In addition, [44] presented the merging features in InceptionV3 and DenseNet201 models for MRI images, which accomplished an average accuracy of 99.51 percent. Despite this, the total number of parameters that the model included greatly grew. Meanwhile, [45] built an ensemble model consisting of ResNeXt, SeResNeXt, DenseNet, Xception, and ResNet. The results showed that an individual Xception model obtained a recall value of 91%, while the ensemble model reached a recall value of 94%. Because of this, a recall value demonstrates that the performance of the ensemble Xception model is much more satisfying.The authors stress the usefulness of quantitative tools in business decision-making. They explore the benefits of quantitative methods including statistical analysis, mathematical modeling, and data-driven decision-making. These methodologies enable objective risk assessment and alternative evaluation [48]. The paper examines corporate trends in quantitative decision-making. Organizational culture, managerial support, and data and resource availability impact these strategies, according to the authors. They also examine organizational obstacles to quantitative techniques [48]. This study recommends concatenating MobileNetV2 and Xception characteristics to enhance plant disease identification. MobileNetV2, Xception, and the ensemble model had 97.32%, 98.30%, and 99.10% accuracy on the Plant Village dataset. MobileNetV2 and Xception models’ accuracy increased 1.8% and 0.8%, respectively. Our model also catches 99.52% of all user-defined dataset metric scores. Our model outperformed the seven state-of-the-art CNN models individually and in ensemble. It integrates with mobile devices and has less parameters and model file size than MobileNetV2 with InceptionResnetV2, VGG19, and VGG16 [49].
Plant disease detection models mainly use the agricultural sector to improve yield, predict yield and recommend diseases curing medicine quickly based on plant images through various agricultural solutions that might be drones or robots. As research prospects reducing the false positive rate play a vital role if more plants are detected and highlighted wrongly that those suffering from diseases raise costs and may damage the crop fields if medicine were applied based on low precision modelling.
Referring to the abovementioned findings, this study proposed an ensemble of CNN MobileNetV2 and Xceptionmodels.Recent studies have shown that deep learning-based models can classify and find plant diseases despite many problems. In this study, we add new convolutional layers to the Xception module to help it recognise and diagnose diseases in rice plants. So, the already-trained ResNet was combined with the modified Xception (M-Xception) module to extract high-quality visual features of crop illness. The classification results are then made more stable by adding a logarithm to the softmax. In a nutshell, here are the most important contributions of this study. We have collected an image dataset of rice crops based on real-world, natural conditions. It is comprised of roughly 1,200 photos of different rice diseases that have been arranged into 12 categories. With the presumption that the data set that was collected is suitable for study on the classification of rice plant diseases. Current solutions rely on the Inception model, which cannot create space behaviour and extract feature maps from noisy areas. This is due to the significant number of false positives generated by the model, which, in the end, diminishes the model’s overall effectiveness. This is taken care of by the Xception architecture, which, in the model that has been proposed, basically pulls features from all noisy level portions while also enhancing the performance of the model in comparison to the one that came before it. Mobile net suffers from an overfitting problem due to a lack of regularisation, which produces flash results on an unseen dataset and causes model performance scores to decline. To overcome this problem, regularisation is used in the proposed model to improve scores and show that log functions work perfectly. The proposed model employs the Xception architecture as the backbone, adding an LPG-Spftmax layer to achieve robust classification over noisy and non-noisy images. Features are extracted from the images, and then Xception with 3D convolutional layers manages the classification. The features pass it as input into the last layer. After that, the log softmax layer computes probabilistic values for each image; the highest probabilistic value for a particular class gives the image category. The study’s findings outline the challenges that rice plant disease identification faces and some possible solutions, such as managing overfitting and neural networks for improved weighting of neural network nodes. Xception will perform well in identifying disease symptoms in rice plants due to its ability to extract high-level features from images. Training the Xception model on a large dataset of labelled images of healthy and diseased rice plants will lead to better performance in disease detection. The Xception model will be able to differentiate between different types of rice plant diseases based on each disease’s unique patterns and characteristics. During training, incorporating data augmentation techniques, such as rotation and flipping, will improve the Xception model’s ability to generalise to new images of rice plants. Fine-tuning the pre-trained Xception model on a smaller dataset of images specific to the region where the rice plants are grown will lead to better performance in disease detection in that particular region.
As real-time disease detection models for rice are primarily utilised, the model’s performance on real-time data is poor owing to overfitting, rendering it useless for usage in the real world. Thus, the model must be resilient to perform well on previously unknown data in the actual world.
The proposed model produces new applications in argitech based on experimental results; disease detection models generate false positives because of overlapping nature, as the same plant leaf may suffer from multiple diseases. These issues handled by the proposed model make disease detection more accurate.
Another application is in farming drones, as the frame are distributed while clipping images of plants from the air, which is allowed as an Xception network after changes proposed by the study and makes feature extraction easier for highly distributed images. Even the proposed study helps in the Amandine recommendations system for the farming sector as features were passed overall ping diseases, which recommends solutions which work effectively on plant suffering from multiple diseases as well.these are some potential applications where the proposed study consumed and makes the Artiech better.
This work conforms to general standards in the following ways: Section 2 describes. The explanations of the planned discussions can be found in section 3. The tests that were carried out on the findings gained in section 4. In the final part of this study, the findings are discussed in section 5.
Preliminaries
In this section, we will discuss a few different approaches that serve as the foundation for the algorithm we have developed.
Inception model
Convolution layer filter training is attempted in three dimensions. There are three dimensions in this space the two physical ones and the channel width and height. As a result, we may map spatial and cross-channel correlations simultaneously using a single convolution kernel. To simplify and improve the effectiveness of this process, the Inception module expressly breaks it down into a collection of procedures that would independently analyse cross-channel and spatial connections. The procedure would be more efficient as a result. This notion inspired the creation of the Inception module. For clarity, a typical Inception module will begin by examining cross-channel correlations using several 1x1 convolutions. This will transform the input data into three or four spaces, each smaller than the original. The module will then use common 3x3 or 5x5 convolutions to map all correlations in these smaller 3D regions.
Figure 1 depicts this scenario for the Inception model. The primary hypothesis underpinning Inception is that cross-channel and spatial correlations are sufficiently dissociated to the extent that it is desirable not to map them together.
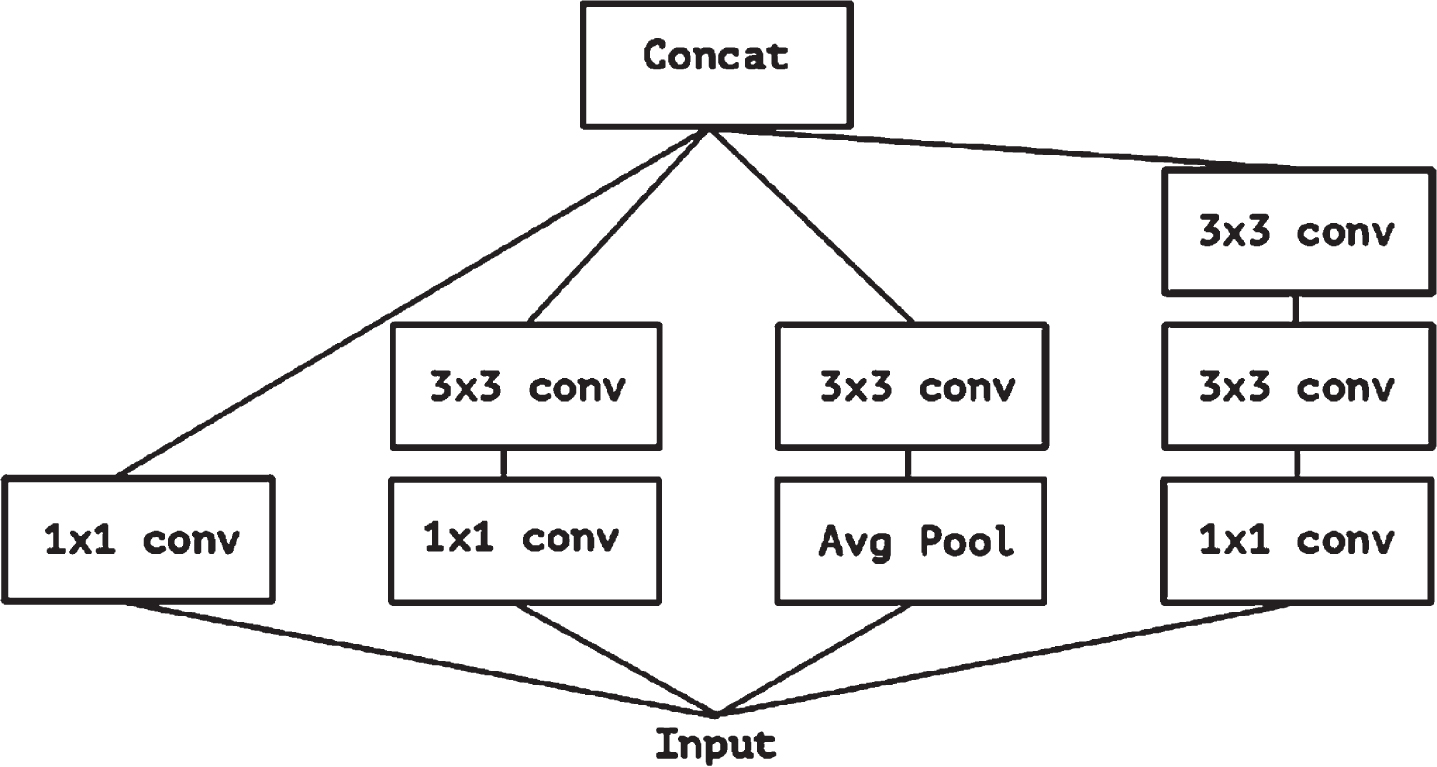
The canonical Inception architecture [6].
The Xception design contains 36 convolutional layers, which are the primary source of characteristics extracted by the networks [6]. Because picture classification is our main focus in experimental evaluation for the time being, we will use a convolutional base layer first, followed by a logistic regression layer. Another option is to place fully-connected layers before the logistic regression layer. All modules comprising the 36 convolutional layers, except for the first and last, are surrounded by linear residual connections.
The parameters of the network are summarised in Fig. 2. A simple way to think about the Xception architecture is as a linear stack of depth-separable convolution layers connected by residual connections. Just a high-level overview of the system is provided here. When compared to architectures like VGG-16 [30], which only takes 30 to 40 lines of code, using a high-level framework like Keras(2015) or TensorFlow-Slim [10] is quite different. This makes it easy to specify and make changes to the architecture. For those interested, Keras and TensorFlow power an open-source version of Xception. This code is included in the Keras Applications Module 1, released under the MIT license.
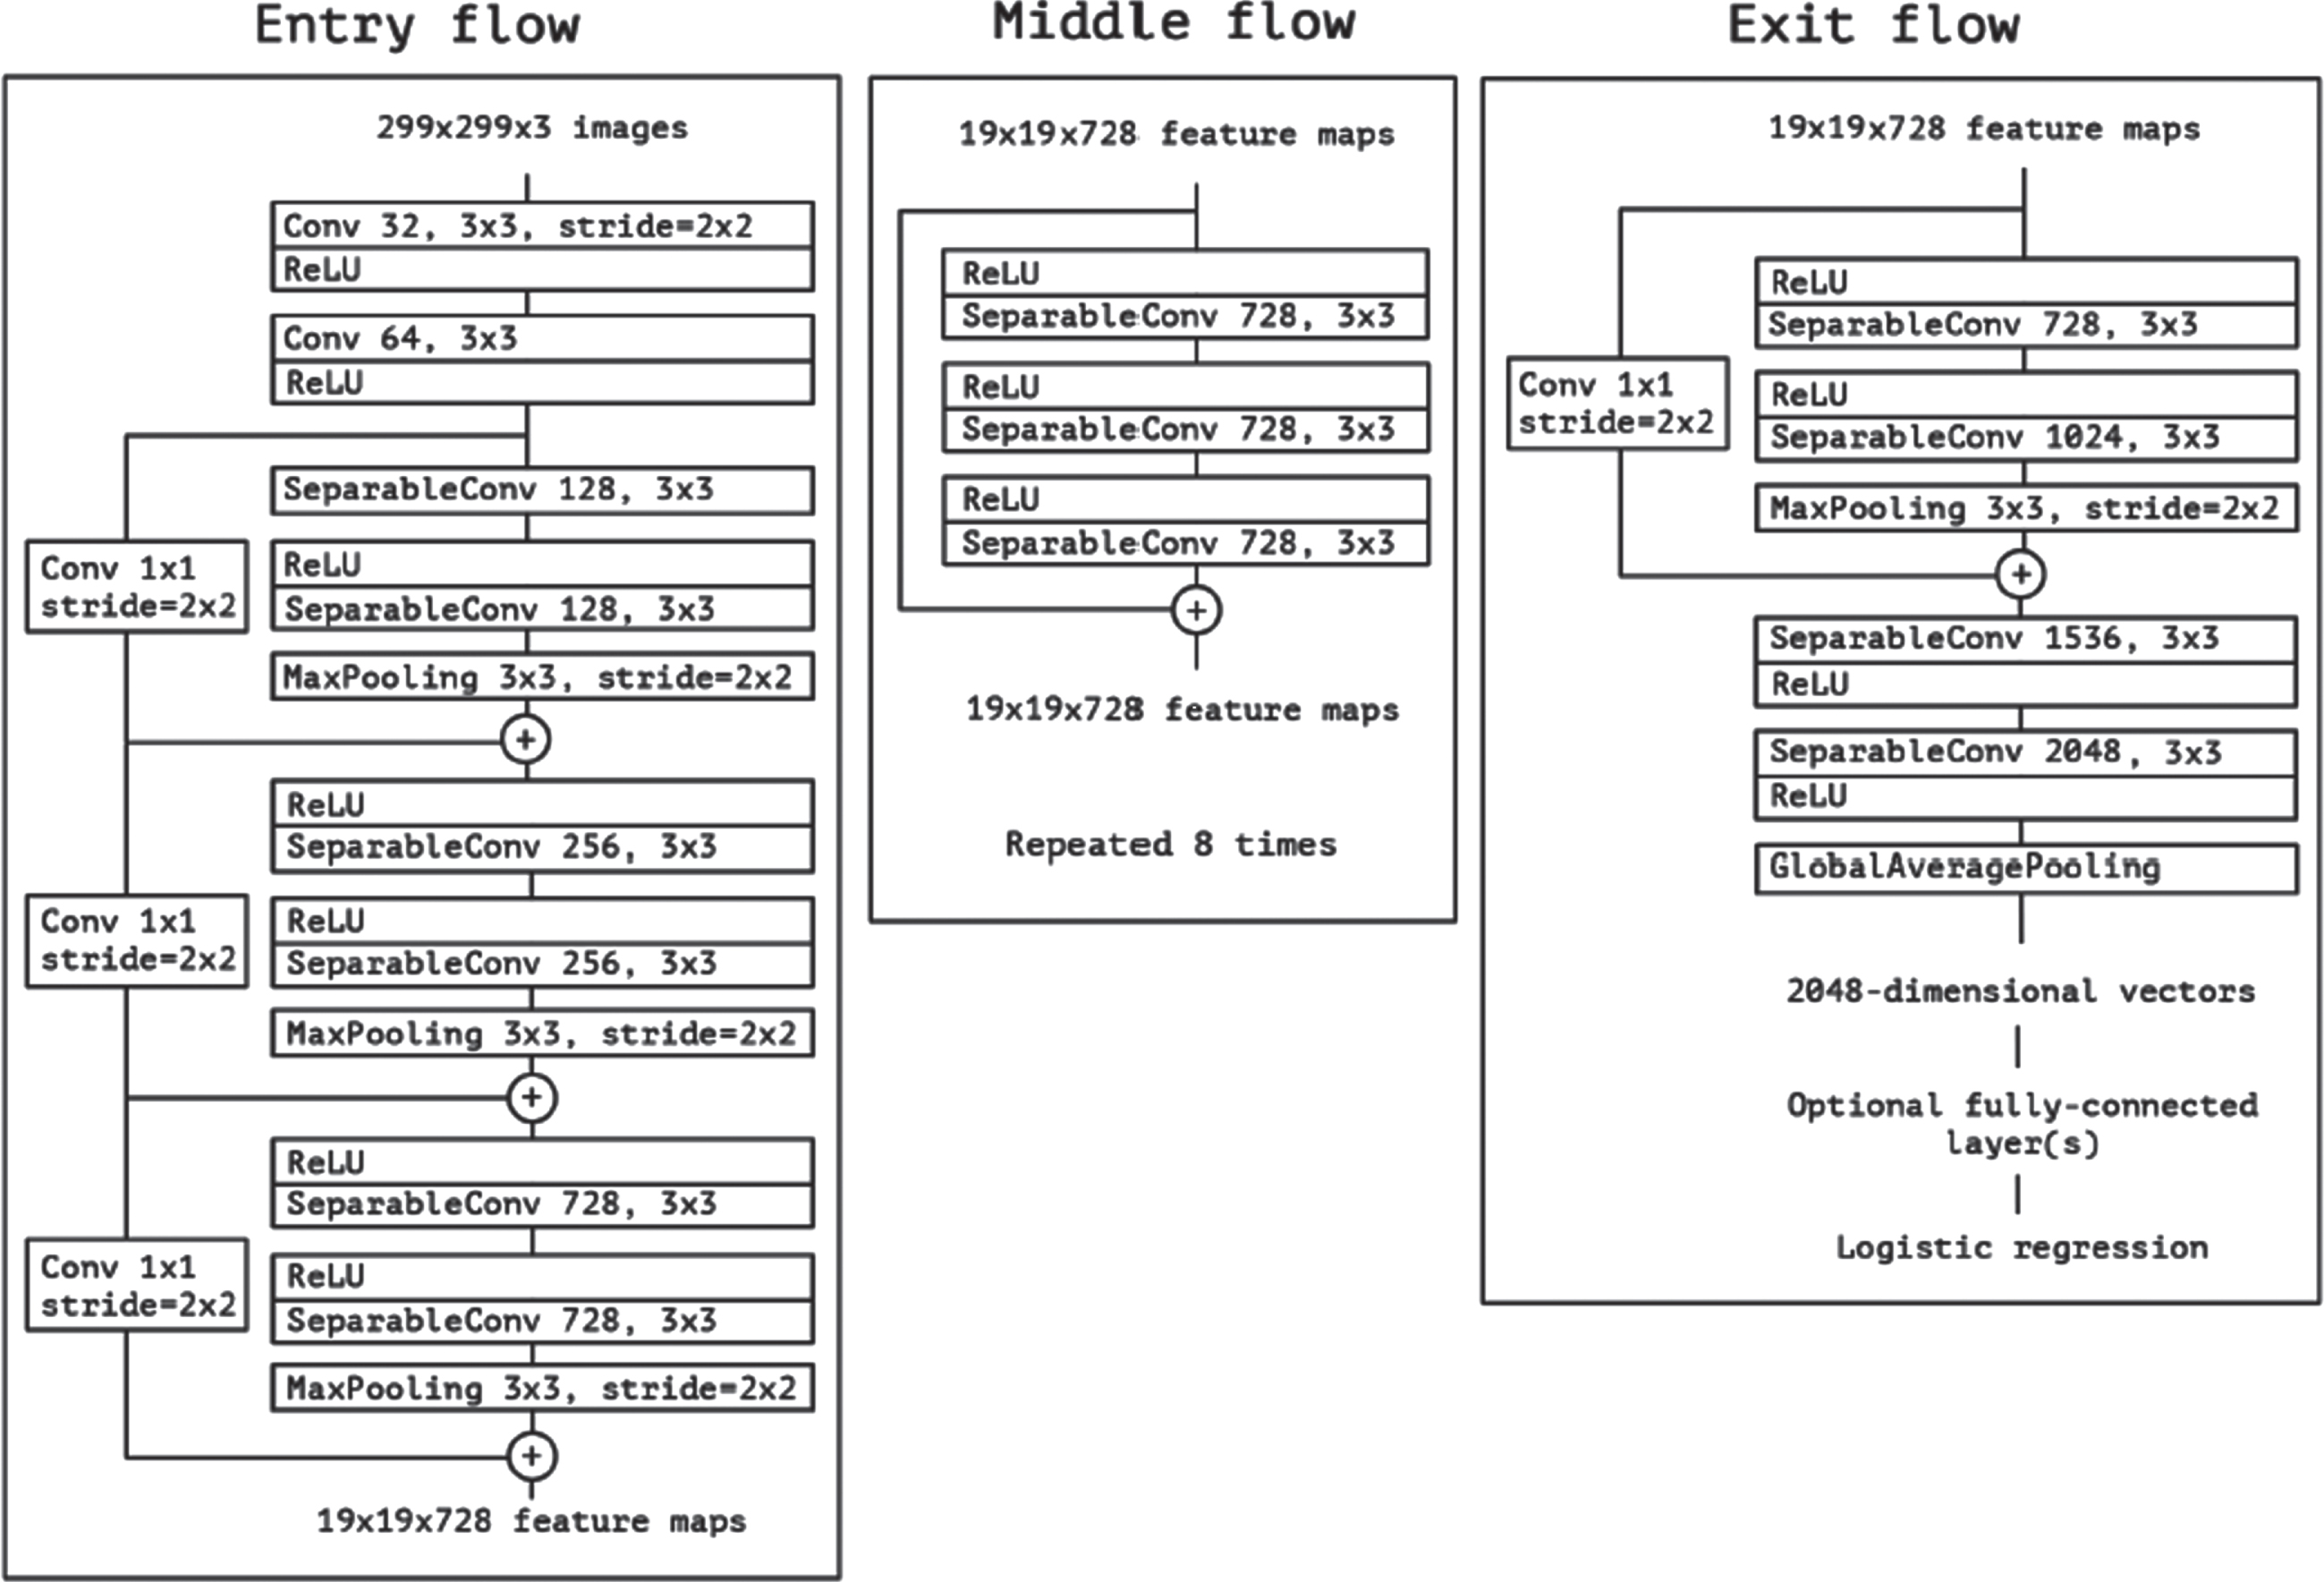
The Xception architecture [6].
The name “ResNet-101” refers to a specific kind of convolutional neural network with 101 hidden layers [12]. To use a trained network, the ImageNet database, which contains over a million images, must be loaded [7]. Photos of things can be sorted into a thousand different categories by the pretrained network, including “keyboard,” “mouse,” “pencil,” and “many animals.” This has allowed the network to learn rich feature representations for various image formats. When an image is posted to the internet, its maximum possible size is 224 pixels on either side. Classify allows us to use the ResNet-101 model to quickly and easily label new images.
GoogleNet
GoogleNet, also known as Inception v1, is a convolutional neural network (CNN) architecture designed by researchers at Google for the ImageNet Large Scale Visual Recognition Challenge (ILSVRC) in 2014. The network achieved state-of-the-art performance on the challenge, significantly outperforming previous architectures. GoogleNet was designed to create a deep neural network that is both computationally efficient and accurate. To achieve this, the network uses a novel architecture that includes multiple parallel convolutional layers of different sizes and a reduction layer that reduces the dimensionality of the feature maps before the next set of convolutional layers. One of the key features of GoogleNet is the use of an “Inception module”, a block of convolutional layers of different sizes stacked together and concatenated to form the output. This allows the network to learn features at different scales and provides a more efficient way of processing large images. GoogleNet also uses other techniques, such as global average pooling, which reduces the number of parameters in the network, and dropout regularisation, which helps prevent overfitting. The goal of paper [46] is to provide a unique automated Front Door Security (FDS) algorithm that uses Human Activity Recognition (HAR) to detect four separate security hazards at the front door using a real-time video stream with a 73.18% accuracy. The activities are detected using a cutting-edge combination of GoogleNet and the hybrid network BiLSTM. This network recognises the activities taken on video by the CCTV camera and receives the camera feed. The built algorithm will utilise the categorisation to identify any attempts to break down the door by kicking, hitting, or striking it. Moreover, the proposed FDS algorithm effectively detects gun violence at the front entry, boosting the facility’s safety measures. A novel FDS algorithm that is based on Human Activity Recognition (HAR) displays the capacity to deliver increased safety with 71.49% accuracy, 68.2% recall, and an F1 score of 0.65.
VGG16, MobileNetV2, AlexNet, ResNet50, and InceptionV3
VGG16, MobileNetV2, AlexNet, ResNet50, and InceptionV3 are popular convolutional neural network (CNN) architectures for image classification tasks. VGG16: VGG16 is a deep CNN architecture developed by the Visual Geometry Group at the University of Oxford. It comprises 16 convolutional and pooling layers and three fully connected layers. It is known for its simplicity and is often used as a baseline architecture for image classification tasks. MobileNetV2: MobileNetV2 is a lightweight CNN architecture designed for mobile devices by Google. It uses depthwise separable convolutions, which reduce the number of parameters in the network while maintaining accuracy. It is designed to be efficient and can run on mobile devices with limited computational resources. AlexNet: AlexNet is a CNN architecture developed by Alex Krizhevsky, Ilya Sutskever, and Geoffrey Hinton, which won the ImageNet Large Scale Visual Recognition Challenge (ILSVRC) in 2012. It comprises eight layers, five convolutional layers, and three fully connected ones. AlexNet was one of the first CNN architectures to achieve high accuracy on the ImageNet dataset and helped popularise deep learning. ResNet50: ResNet50 is a deep CNN architecture developed by Microsoft Research. It consists of 50 layers of residual blocks, which allow for the training of very deep neural networks.
ResNet50 won the ILSVRC in 2015, and is known for its ability to train deep neural networks without suffering from vanishing gradients. InceptionV3: InceptionV3 is a CNN architecture developed by Google for the ILSVRC in 2015. It uses the Inception module, which consists of multiple parallel convolutional layers of different sizes, to capture features at multiple scales. InceptionV3 also includes other techniques, such as batch normalisation and factorised convolution, which help improve performance and reduce the number of parameters in the network. Existing paper [47] explain models such as VGG16, MobileNetV2, AlexNet, ResNet50, and InceptionV3 were trained and tested to achieve test accuracies of 78.84%, 86.85%, 78.88%, 80.98%, and 96.31%, respectively. This model is then modified to produce the AlzheimerNet using the RMSprop optimiser and a learning rate of 0.00001 to achieve a maximum test accuracy of 98.67%. This is possible because InceptionV3 provides the maximum degree of accuracy. Five pre-trained models and the proposed fine-tuned model were assessed against one another using several performance matrices to demonstrate whether the AlzheimerNet model performs better in categorising and identifying the six distinct classes. The experiment’s hyperparameters are observable in ablation studies. According to a two-tailed Wilcoxon signed-rank test, the proposed model for detecting Alzheimer’s disease stages using brain MRI performs much better than the existing methods. This result requires a significance level smaller than 0.05.
Proposed work
Normal Inception performs 1×1 convolution after depth-wise N×N convolution; Xception performs 1×1 convolution before any N×N convolution; however, in the model proposed here, 8x8 convolution is performed before any N×N convolution, whereas 4×4 is performed in the experiment case, demonstrating that there is no immediate ReLU for non-linearity. Although residual connections are always present in the proposed architecture, which makes results on the higher side even with non-linearity and changed order of operations, the experiment achieves improved scores from existing convolution settings even with any immediate ReLU function, which reduces complexity and returns a similar level of performance.
Figure 3 represents the core order of convolution layers followed while implementing the proposed Xception Net, which shows how internal layers were arranged.
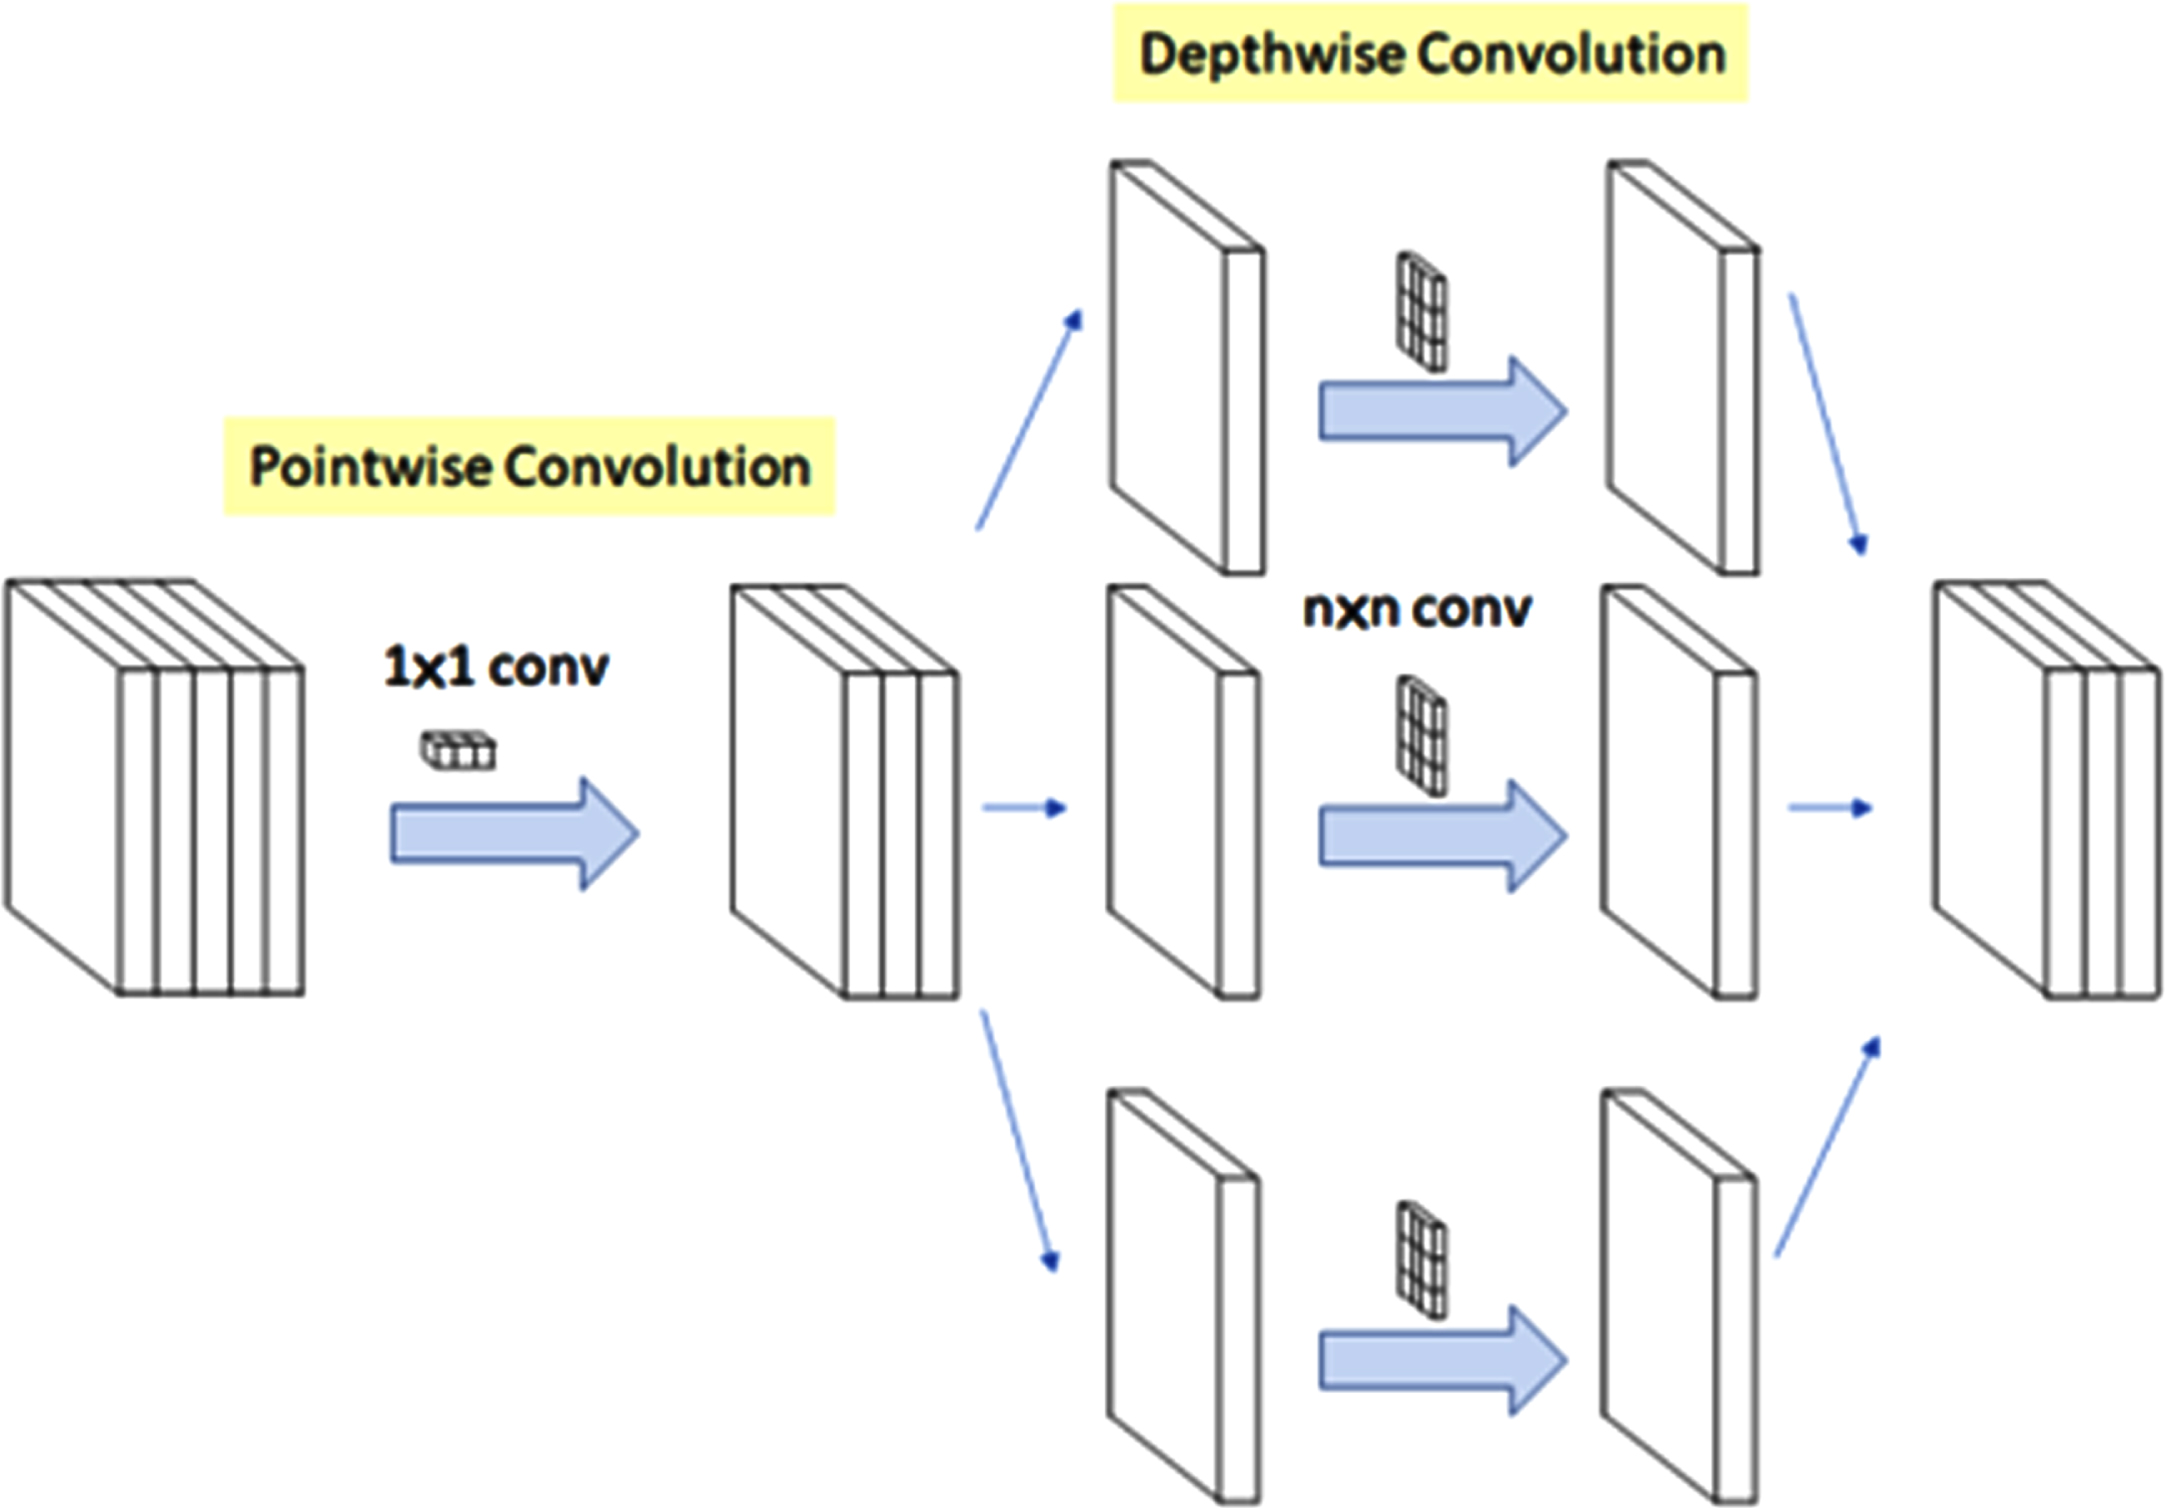
The convolution architecture.
The log(Softmax(x)) function is applied to an n–dimensional input tensor. The LogSoftmax formulation can be simplified as:
This log(Softmax(x)) function is a loss function to optimise the proposed model performance.
The Regularize function is used to regularise the layers to avoid over-fitting the model at any training instance.
Where, L = L * log(avg(R))
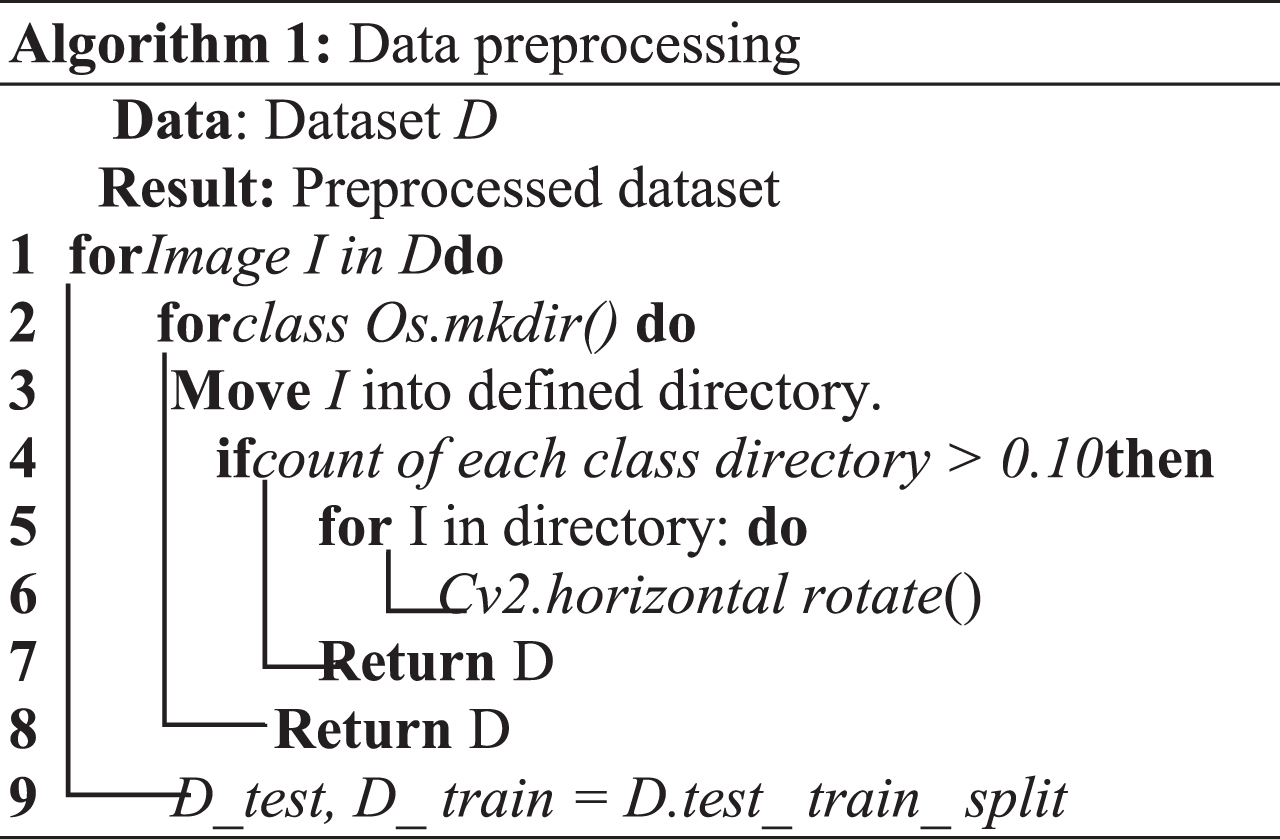
Algorithm 1 shows the preprocessing steps. This algorithm starts with creating a model using the current dataset. In Xception models, annotations are unnecessary; classes are identified based on the folder’s name. First, iterate through the data images, moving them into newly created directories based on the zip dataset’s class names. The balance between classes must then be checked to see if the number of samples in one class differs by more than 10% from the other class. Then it performs a horizontal rotation over the class’s images, with fewer samples if not varying. Finally, it returns dataset direcries; after creating rotated samples, it also returns dataset directories.
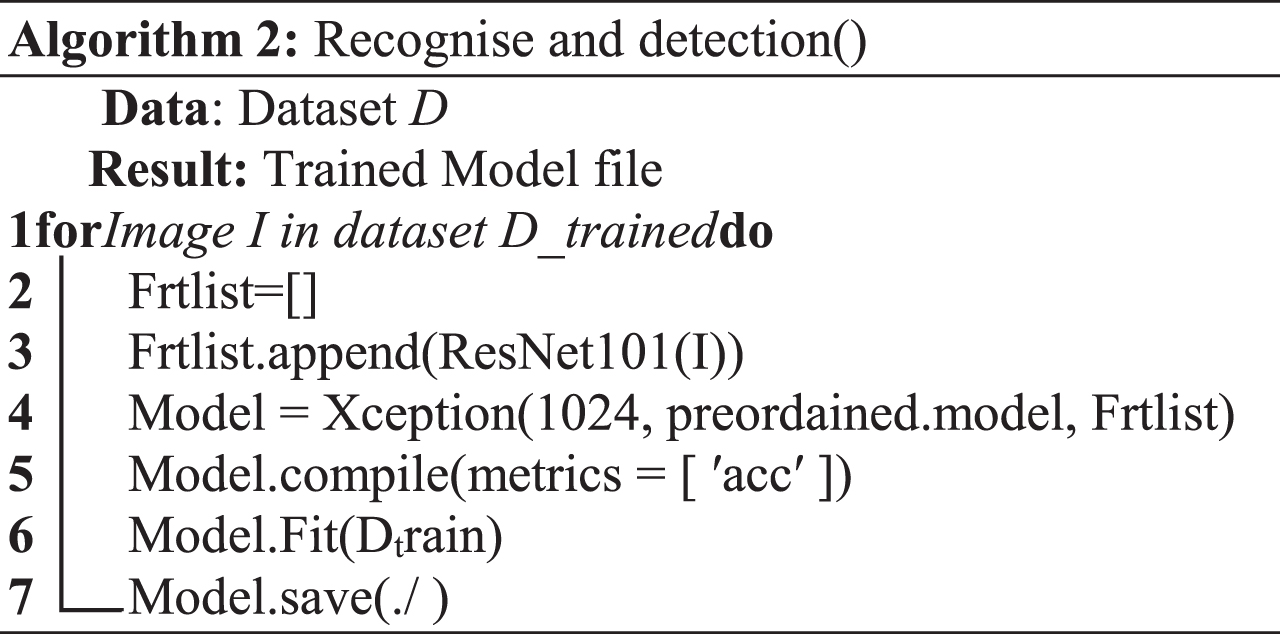
Algorithm 2 shows the steps for recognising and detecting the object. This algorithm uses a training set to extract features from me. Further, a model is created and summarised, and then training on the model begins. The model is saved in the current directory after training.
Figure 4 depicts how the dataset flow in the proposed model. The process begins with the preprocessing of the dataset by resizing the images, which is followed by grey scaling and background removal to extract regions, then classes for the images of leaf diseases taken as labels, which are taken from label text files, after which ResNet extracts features from the prepared images. And then, Xception makes the detection and returns a class for the image if the disease is present on the leaf.
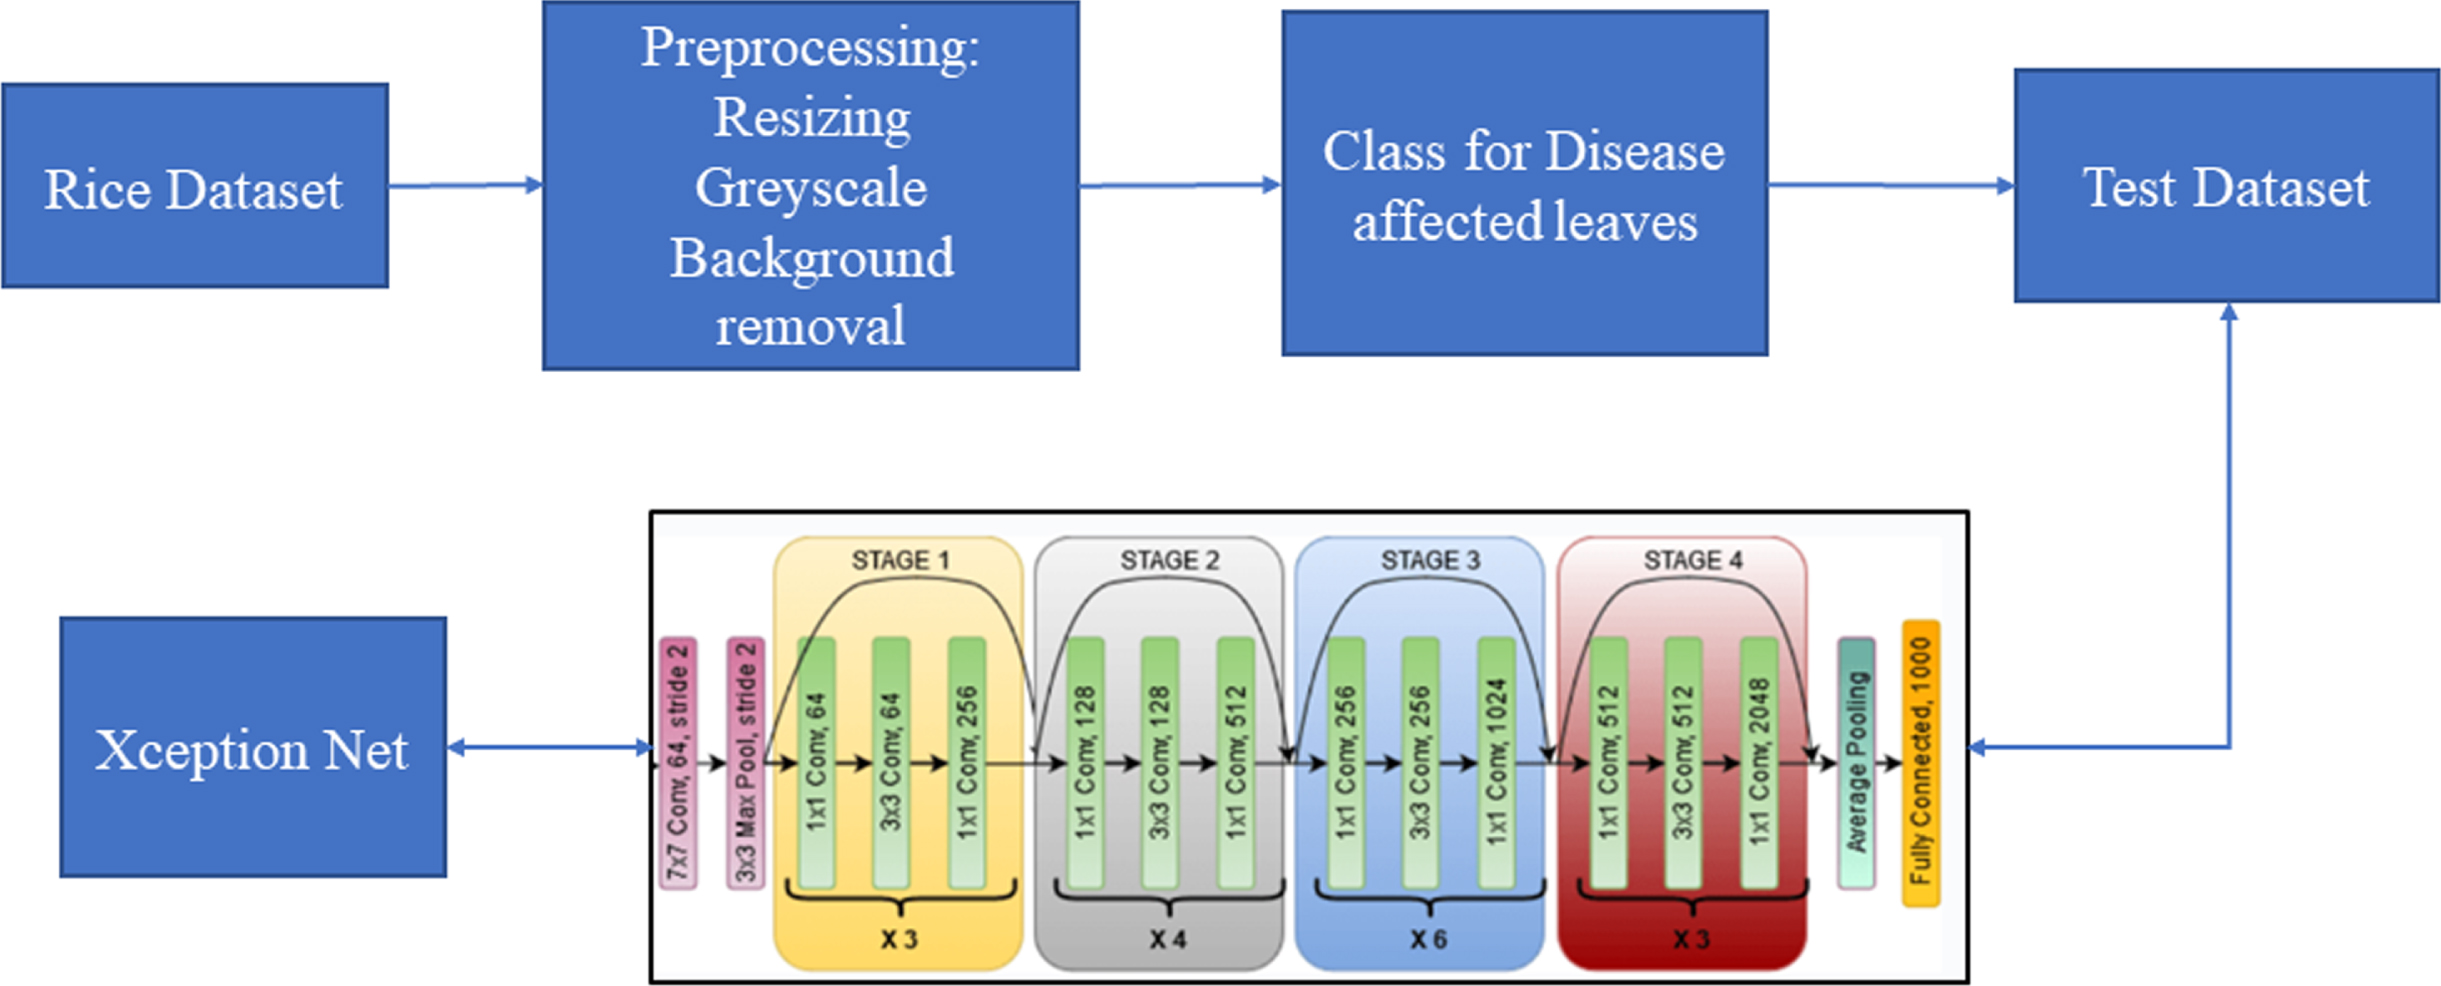
Flowchart of the proposed model.
Solutions for detecting rice illness are hampered by the overfitting issue, which implies the model performs better during training than it does on untried data. A model is given to address this issue, and it does so by using layers of a well-balanced neural network.Details show the algorithm 2.
During the experiments, we evaluate how well the proposed M-Xception model performs in comparison to other models, such as MobileNet [25], MobileNet-V2 [25], Xception [29], NASNetMobile [38], EfficientNet-B0, and M-Inception [5, 34].
Dataset description
In our tests, we utilised both the Plant Village [13] dataset, which is accessible to the general public, and the rice picture dataset, which was collected locally. Both of these sets of data were amassed in the same geographic region. One of these is referred to as Plant Village, and it is tasked with amassing images of plant leaves from all around the world to validate disease detection algorithms. This dataset is comprised of a total of 54,305 images of plant leaves, all of which have been organised into a total of 38 distinct groups. There are a total of 14 different species, 12 healthy plants, and 26 ill plants included in this collection. Every picture of a plant leaf was obtained through photography, and the conditions for doing so were very particular.
Lighting must have been consistent, and there must have been a lack of obstructions in the background. It has been brought to our attention that multiple angles and distances have been used to capture the same leaf in photographs. While the model was being trained, the one-hot encoding of the category variable was completed successfully. Here we arrive at our second point. The photographs were then uniformly resized to 224 pixels on a side to properly position the model within them. This was done to enlarge the images, improving the model’s performance. Some of the collected images of rice diseases were taken in genuine agricultural fields with the help of the Fujian Institute of Subtropical Botany and the innovation farm at ZeHuo Digital Technology Co., Ltd. Thanks to ZeHuo Digital Technology, and we were able to pull this off.
An additional percentage of the amassed rice disease photographs were obtained through crawler technology from widely used search engines, including Google, Yahoo, Baidu, and Bing. The vast bulk of the photographs were shot at the actual scene, so crawler technology was used to download these images. About a thousand representative images were shot for this dataset and sorted into 12 groups afterwards. The Fujian Institute of Subtropical Botany and the innovation farm captured most of the images.
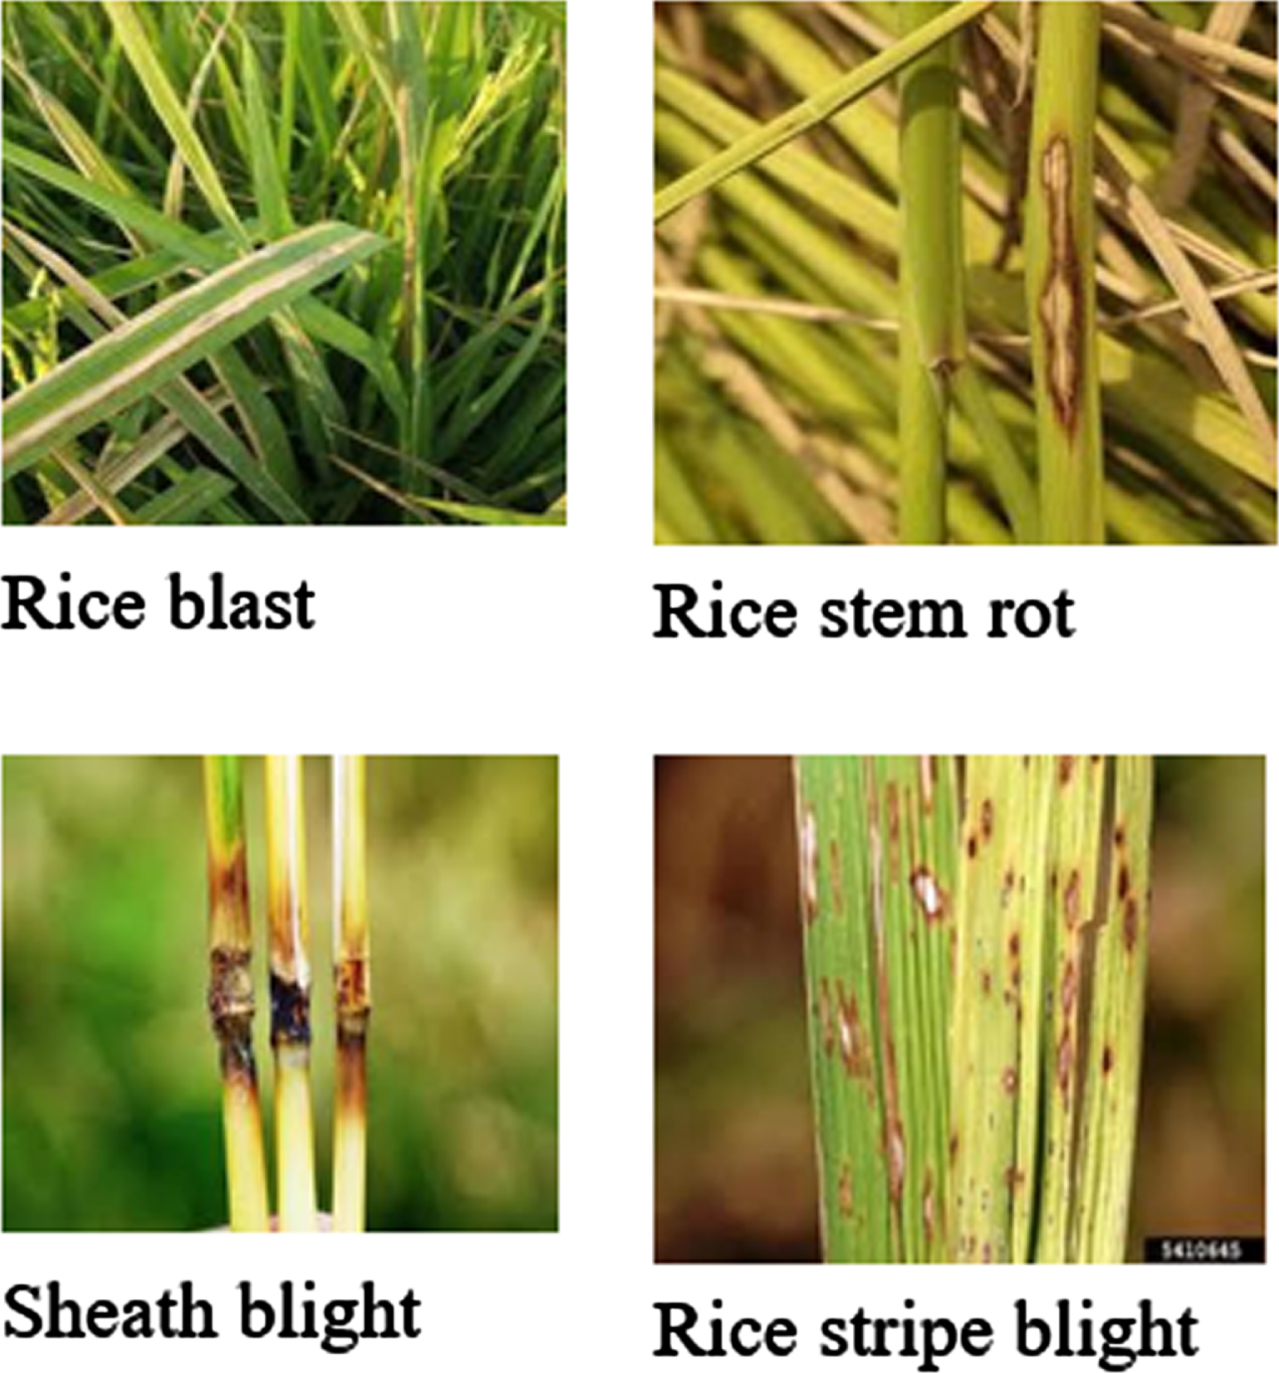
It should be noted that compared to the Plant Village dataset, the backgrounds of the pictures obtained for this one were more detailed. Each sample was first annotated with labels based on the knowledge of subject matter experts, then filed away in the proper categories, converted to JPG, and displayed in a gallery. Photoshop was also used to convert the photographs to the RGB model and reduce the size to a fixed resolution of 224 by 224 pixels. Their entire size was cut down, which served to achieve this goal. Pictures of the collected examples are shown in Fig. 5, and a summary of the symptoms depicted there is listed in Table 1.
Flowchart of the proposed model.
Major symptoms of rice diseases
Accuracy, Recall, Specificity, and F-score are some metrics used as evaluation indicators to determine how well various models performed. These metrics were derived from the statistics of correct and incorrect detections. To put this into a context that is easier to understand, these measurements and their enlarged computations for multi-class activities that use macro averages are written out as Equations (3–7).
In this section, we discuss the effectiveness of the proposed m Xception with the existing model.
Figure 6 shows the performance of the proposed model per epoch; the left graph shows loss reduction as the number of epoch’s increases, and higher values indicate that the losses are decreasing. And the right-side curve shows accuracy for training and validation; based on the above curves, it is evident that the model can overcome overfitting as the curves for accuracy for both training and validation move in the same rhythm.
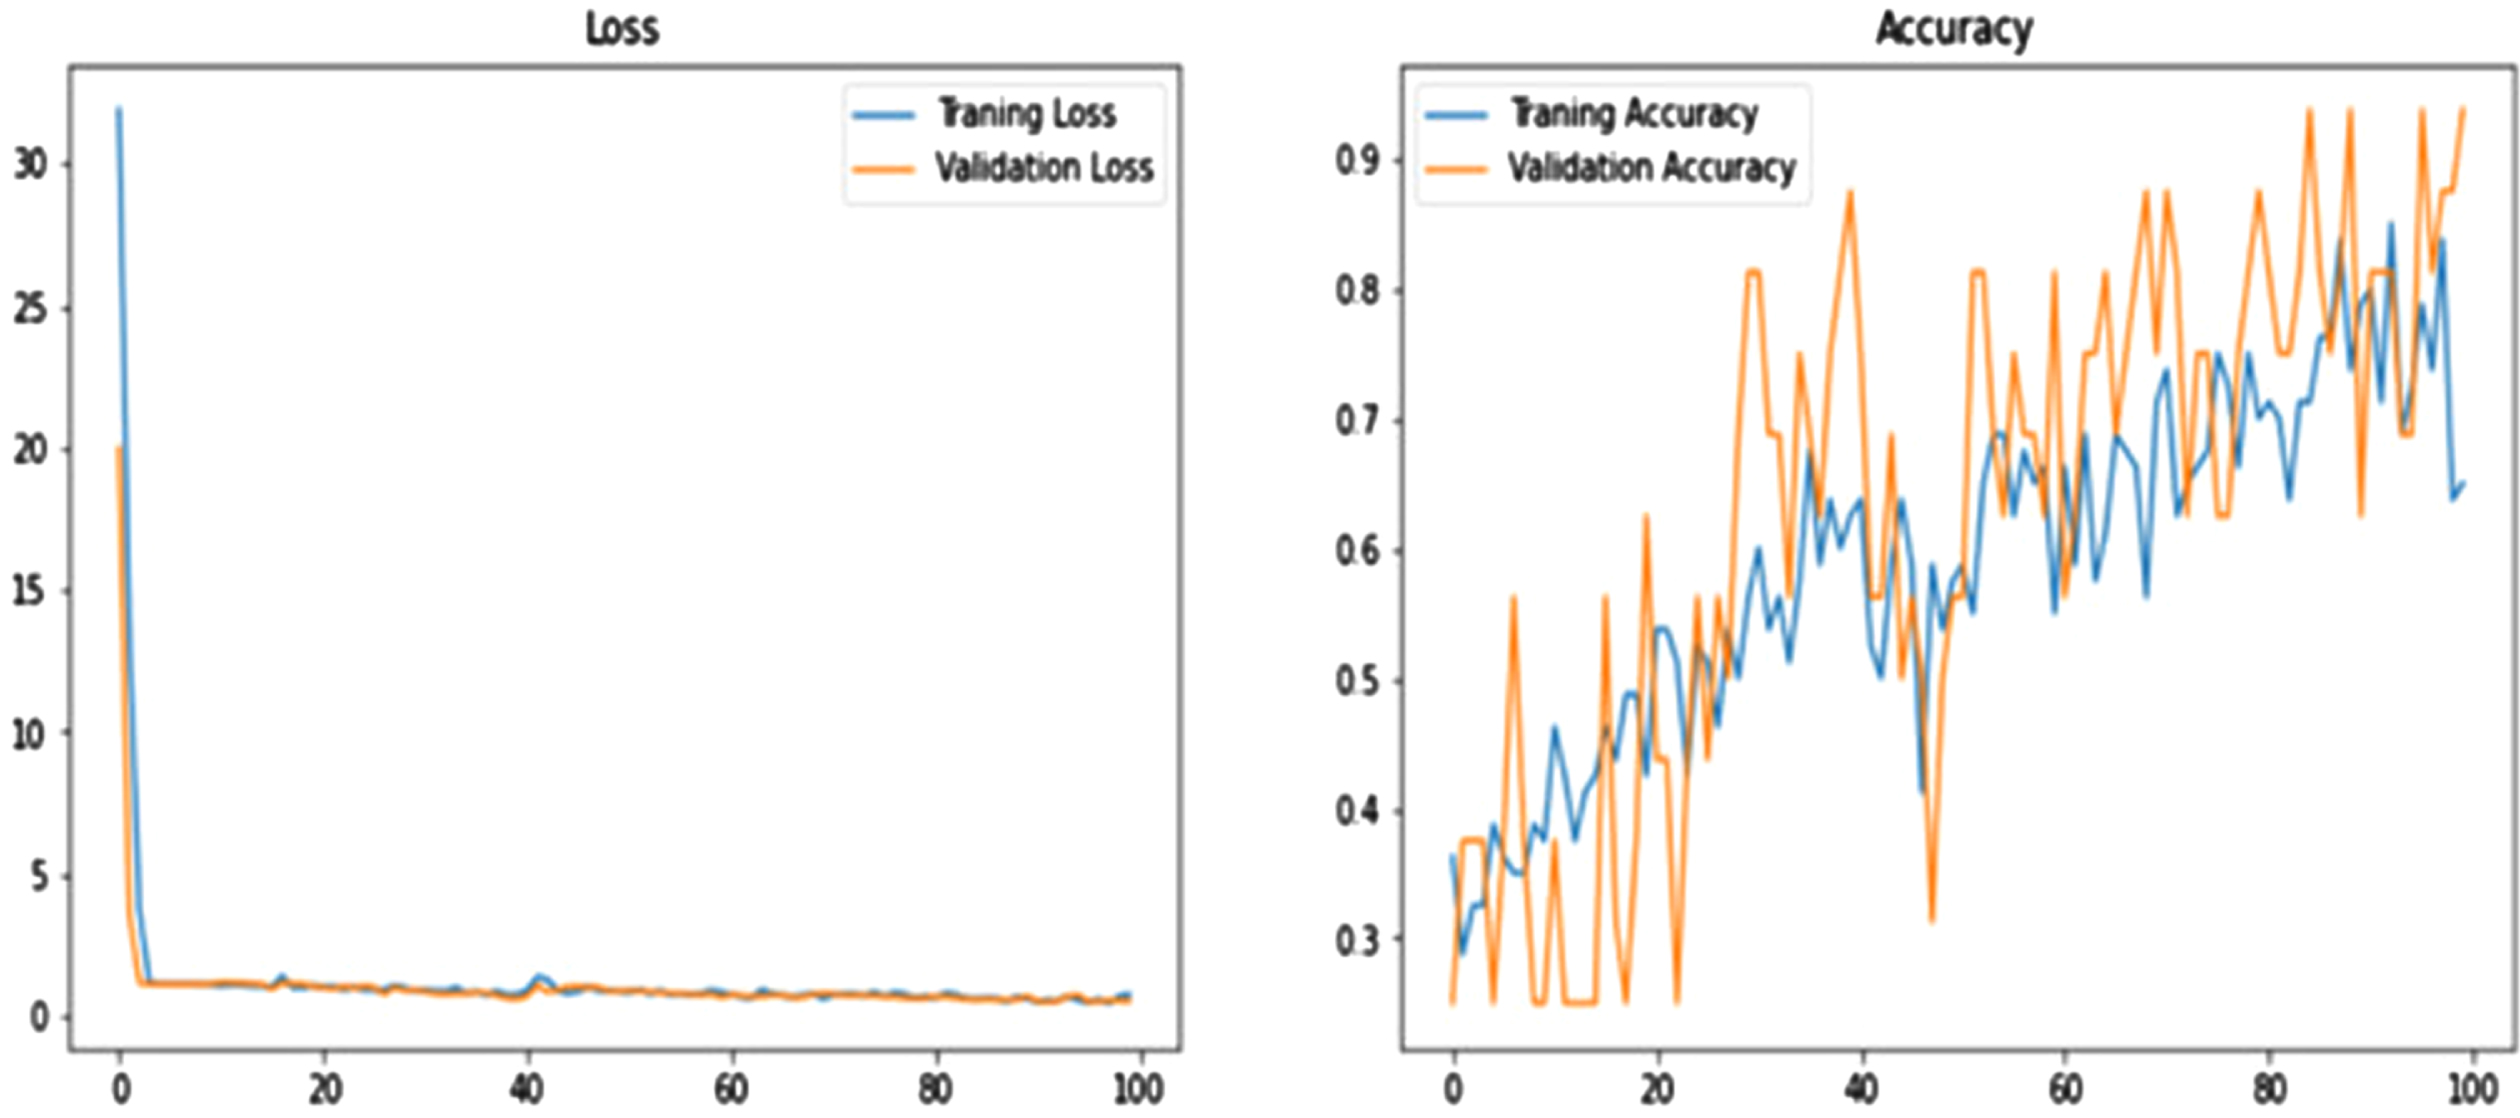
Graphs show the performance of the proposed model.
Table 1 depicts all generic types of diseases for rice plant leaves and their physical effects on the leaves, which appear to be effects of a generic population; symptom shapes depict how leaf shapes are affected; symptom colour depicts how specific diseases affect the colour schema of the plant leaf. The disease regions depict parts of the plant affected by specific diseases, such as leaves, stems, and some of the effects of glumes and grains. Then the number of samples represents the number of images for each class, which we consider for the experimentation of the proposed model.
Table 2 shows how the defined shapes of filters and convolutional layers work in the internal networks of the proposed model. The number column represents the number of layers for a specific network, and the layer represents which specific layer uses that particular parameter-based shape. The kernel size is self-defined, as it refers to the size of the Parnell used for that specific layer. And the input shape represents the shape of the input. Each layer accepts different input shapes based on their geometrical properties so that results are defined for the next or succeeding layers and independent of images and shapes.
Major parameters of network layers
Table 3 and Figs. 7 and 8 compare the proposed model’s performance on village data with the performance of known solutions depending on the number of epochs. Epochs refer to the number of iterations followed by training performed across the whole network. On both 10 and 30 epochs, the models included in this table were analysed and compared to the proposed model. Accuracy in training and validation and losses incurred during training and validation were utilised as metrics to evaluate the proposed model. It was noted from the table that the suggested model outperforms existing solutions in terms of accuracy and losses. This was found because the proposed model improved accuracy while reducing losses when 10 epochs were considered. And when 30 epochs were considered, the proposed model also performed better than existing solutions, representing that the proposed model is also not inclined towards overfitting as the number of epochs increased, which resembles that model’s ability to balance variance and bias. And when 50 epochs were considered, the proposed model performed better than the existing solutions.
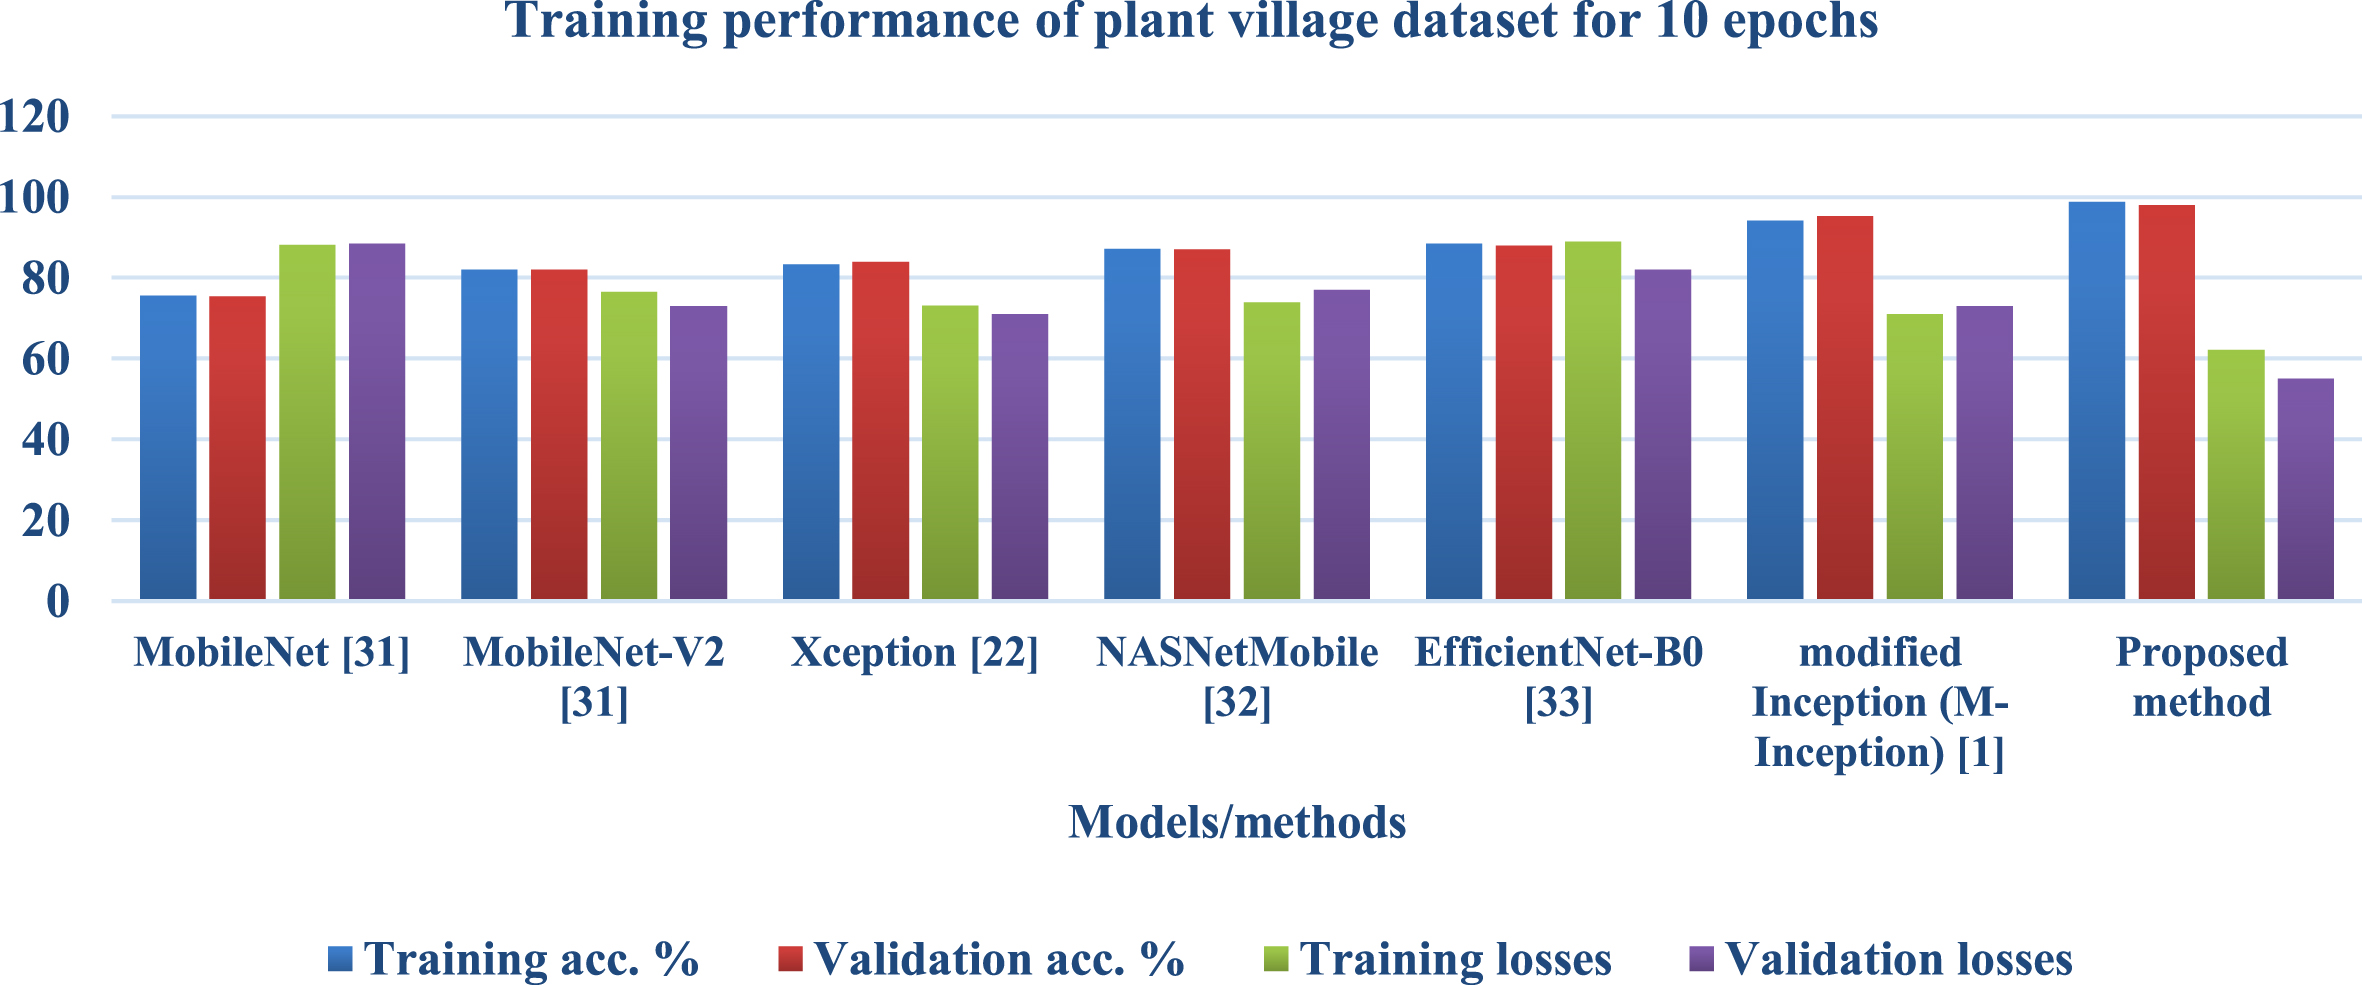
Training performance of plant village dataset for 10 epochs.
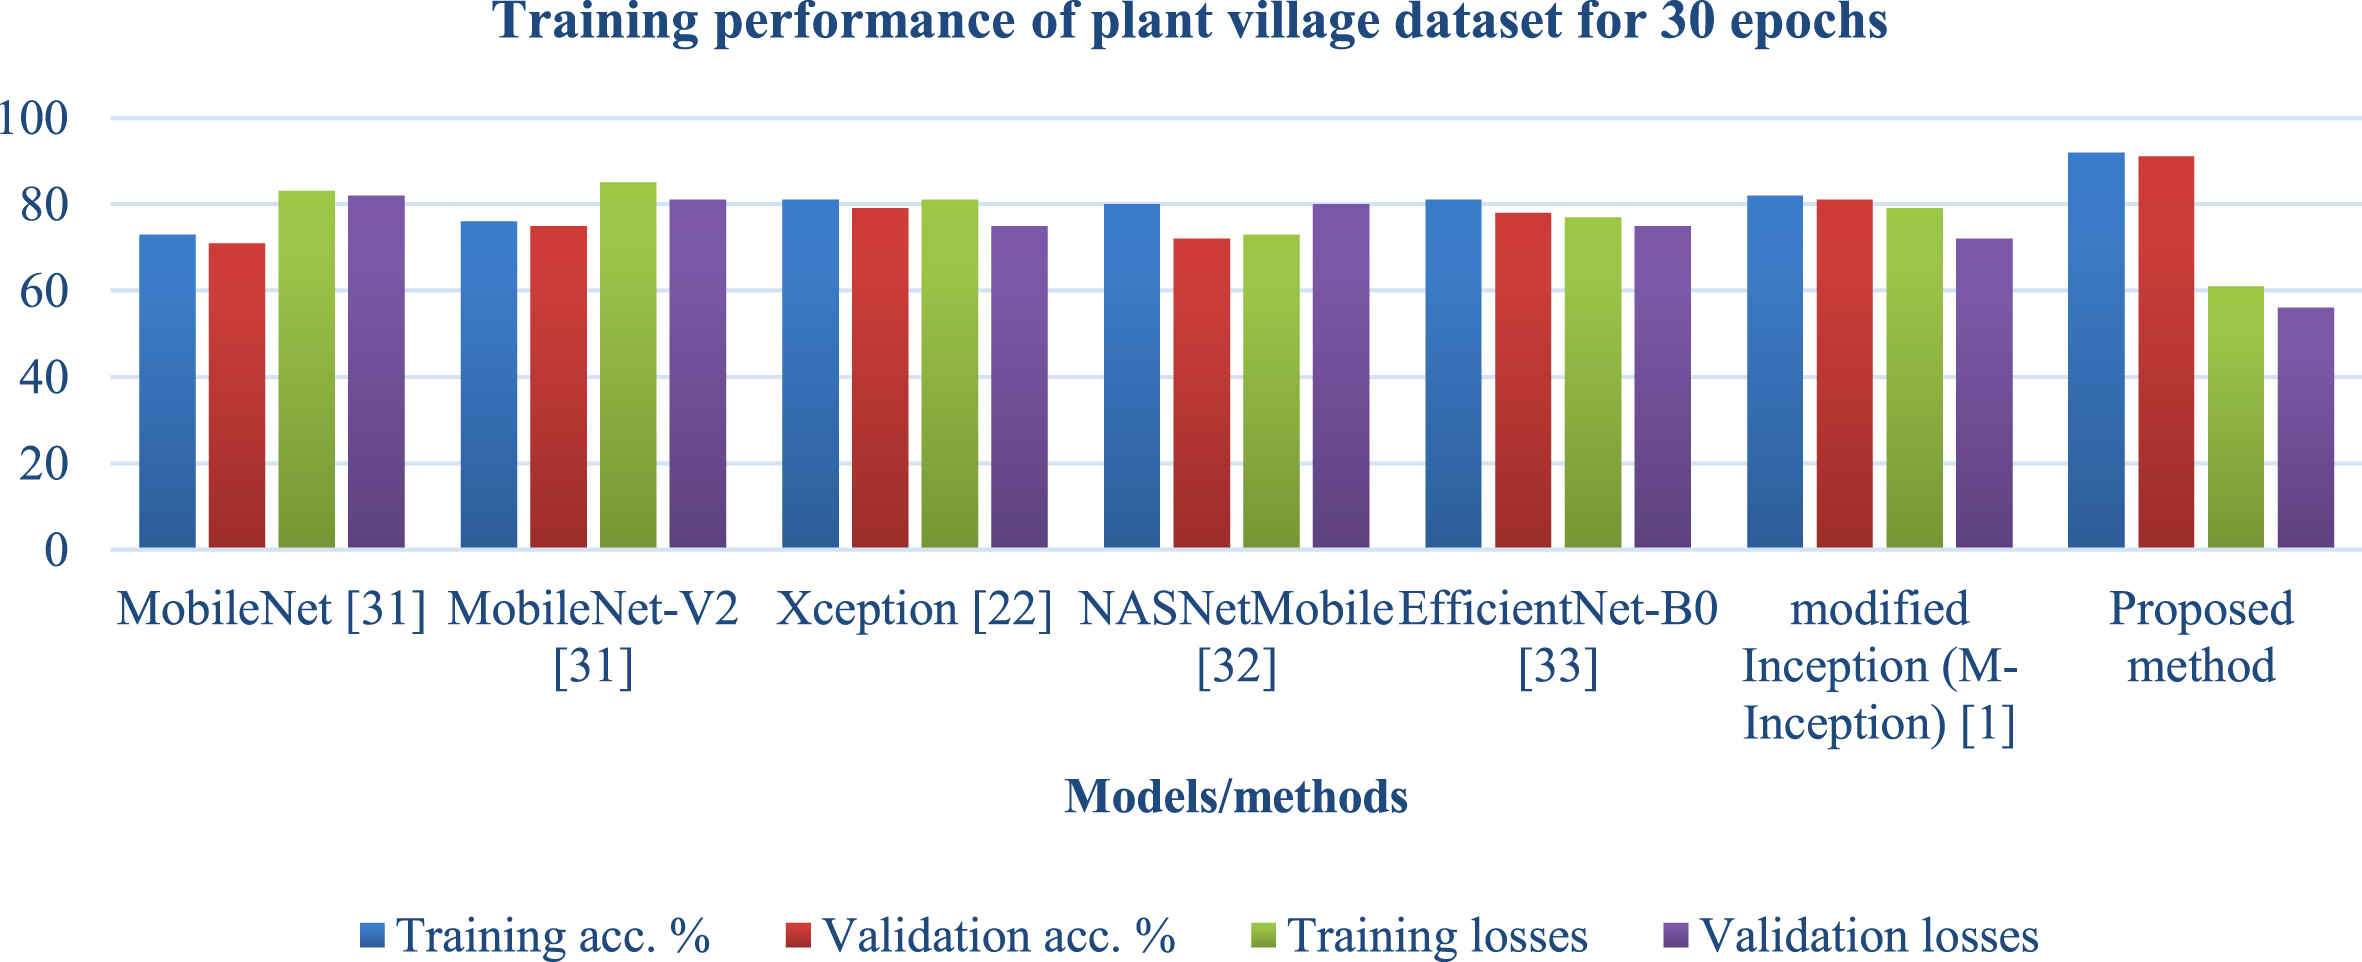
Training performance of plant village dataset for 30 epochs.
Training performance of plant village dataset
Table 4 and Fig. 9 comprise existing solutions with the year they were proposed, their baseline architecture,CNN, and the number of classes that particular model has. The accuracy scores are then calculated by averaging the scores of all accesses in that model. It was observed that rice disease detection was discovered in 2018, and results were higher every year as modifications introduced in the working layers of the model continued this trend and outperformed existing solutions in accuracy metrics with low losses in training and validation.
Comparison of the proposed M-xception model with the existing models
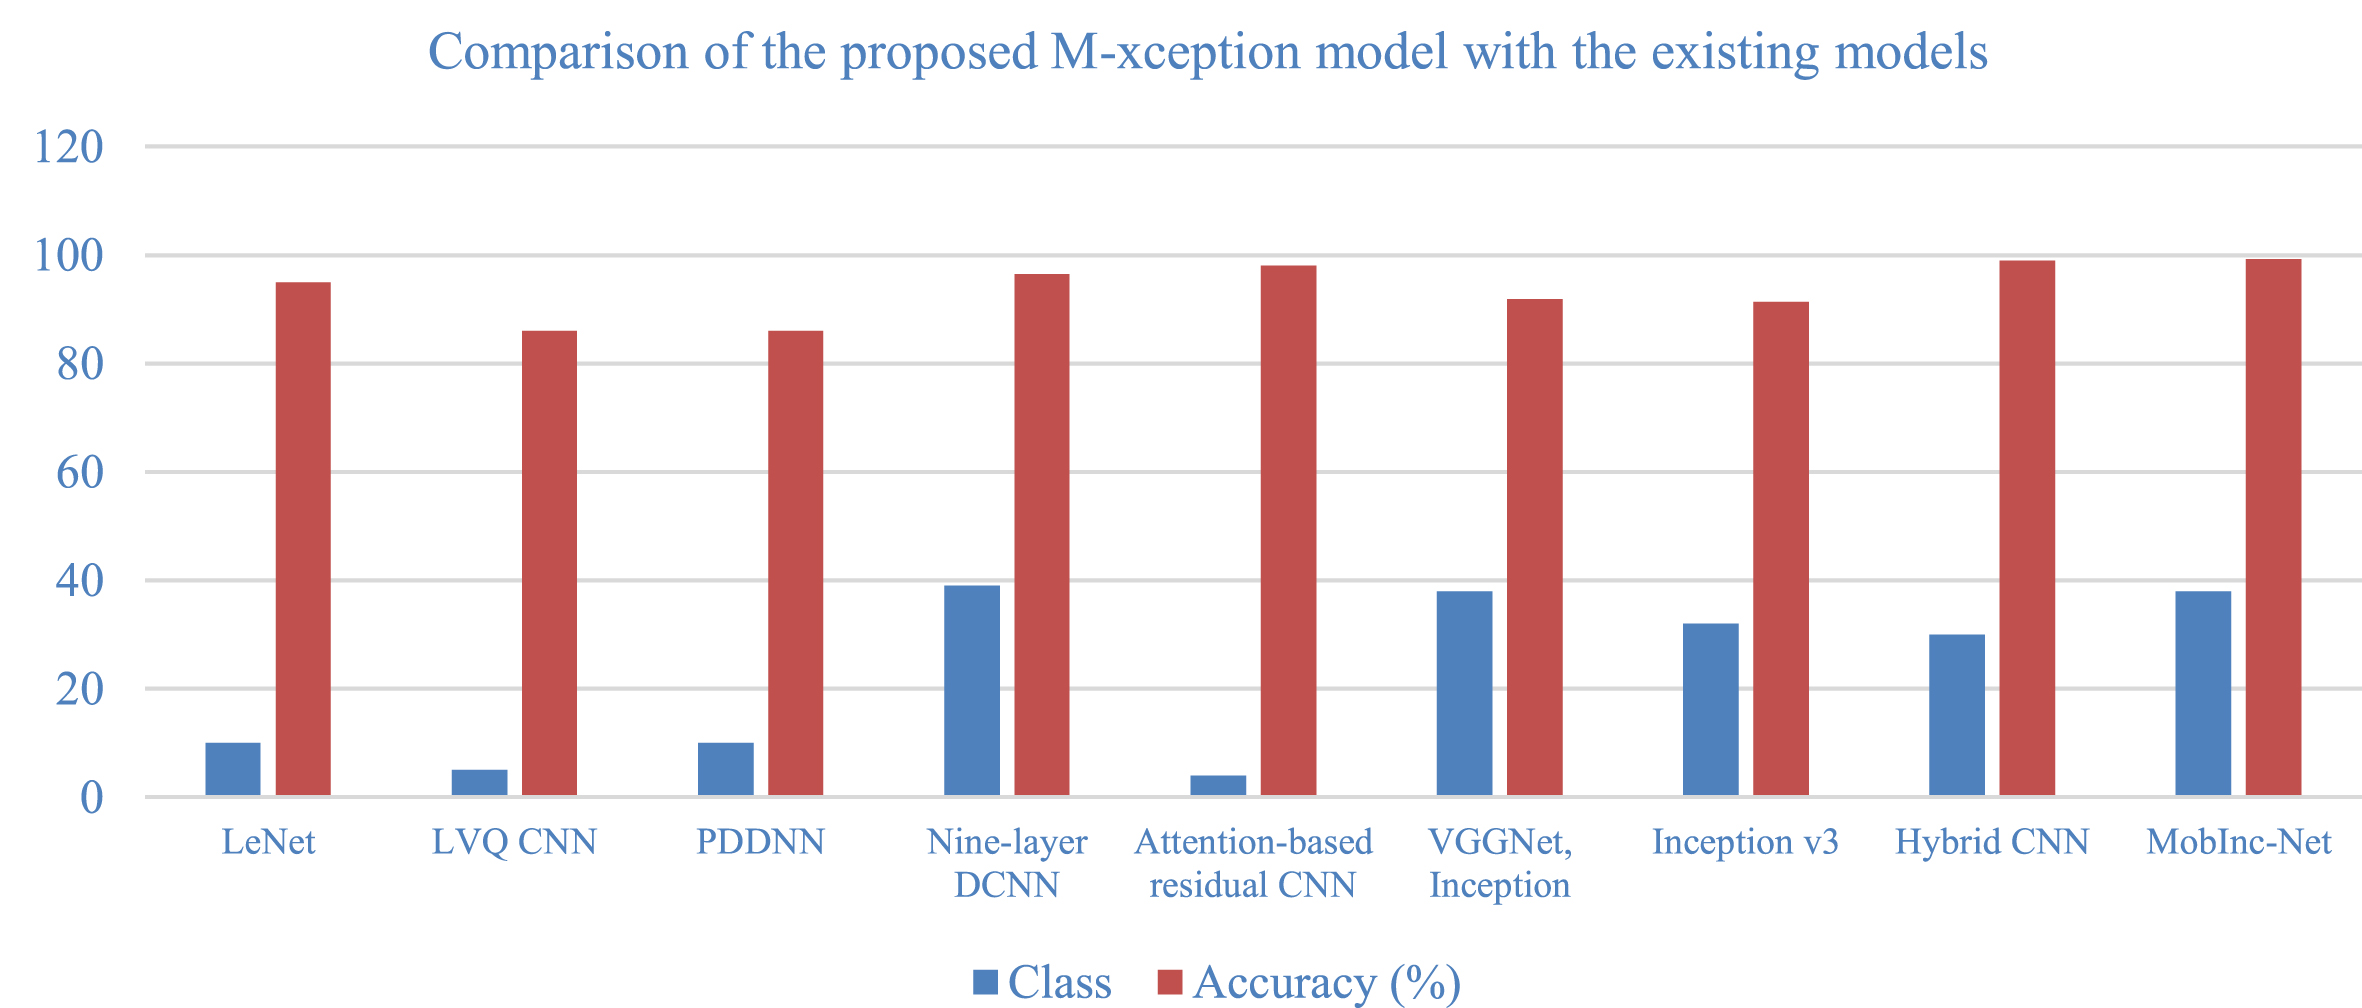
Comparison of the proposed M-xception model with the existing models.
Table 5 and Figs. 10, 11 compares the performance of the proposed models with existing models on a local dataset, which allows for robust testing of the proposed models with existing models on another dataset where existing ones may not be tested, on a different number of epochs, as results were compared when the number of epochs was 10 and when the number of epochs was 30, as well as training, validation accuracy, and losses during the proposed model’s training. It was observed from the table that the proposed models achieve an average of 7% improvements over the existing solutions at epoch 10 on the local dataset for both accuracy and loss metrics. For 30 epochs of experiments, the proposed model performs around 6% better in accuracy than the existing solutions.
Training performance on local dataset
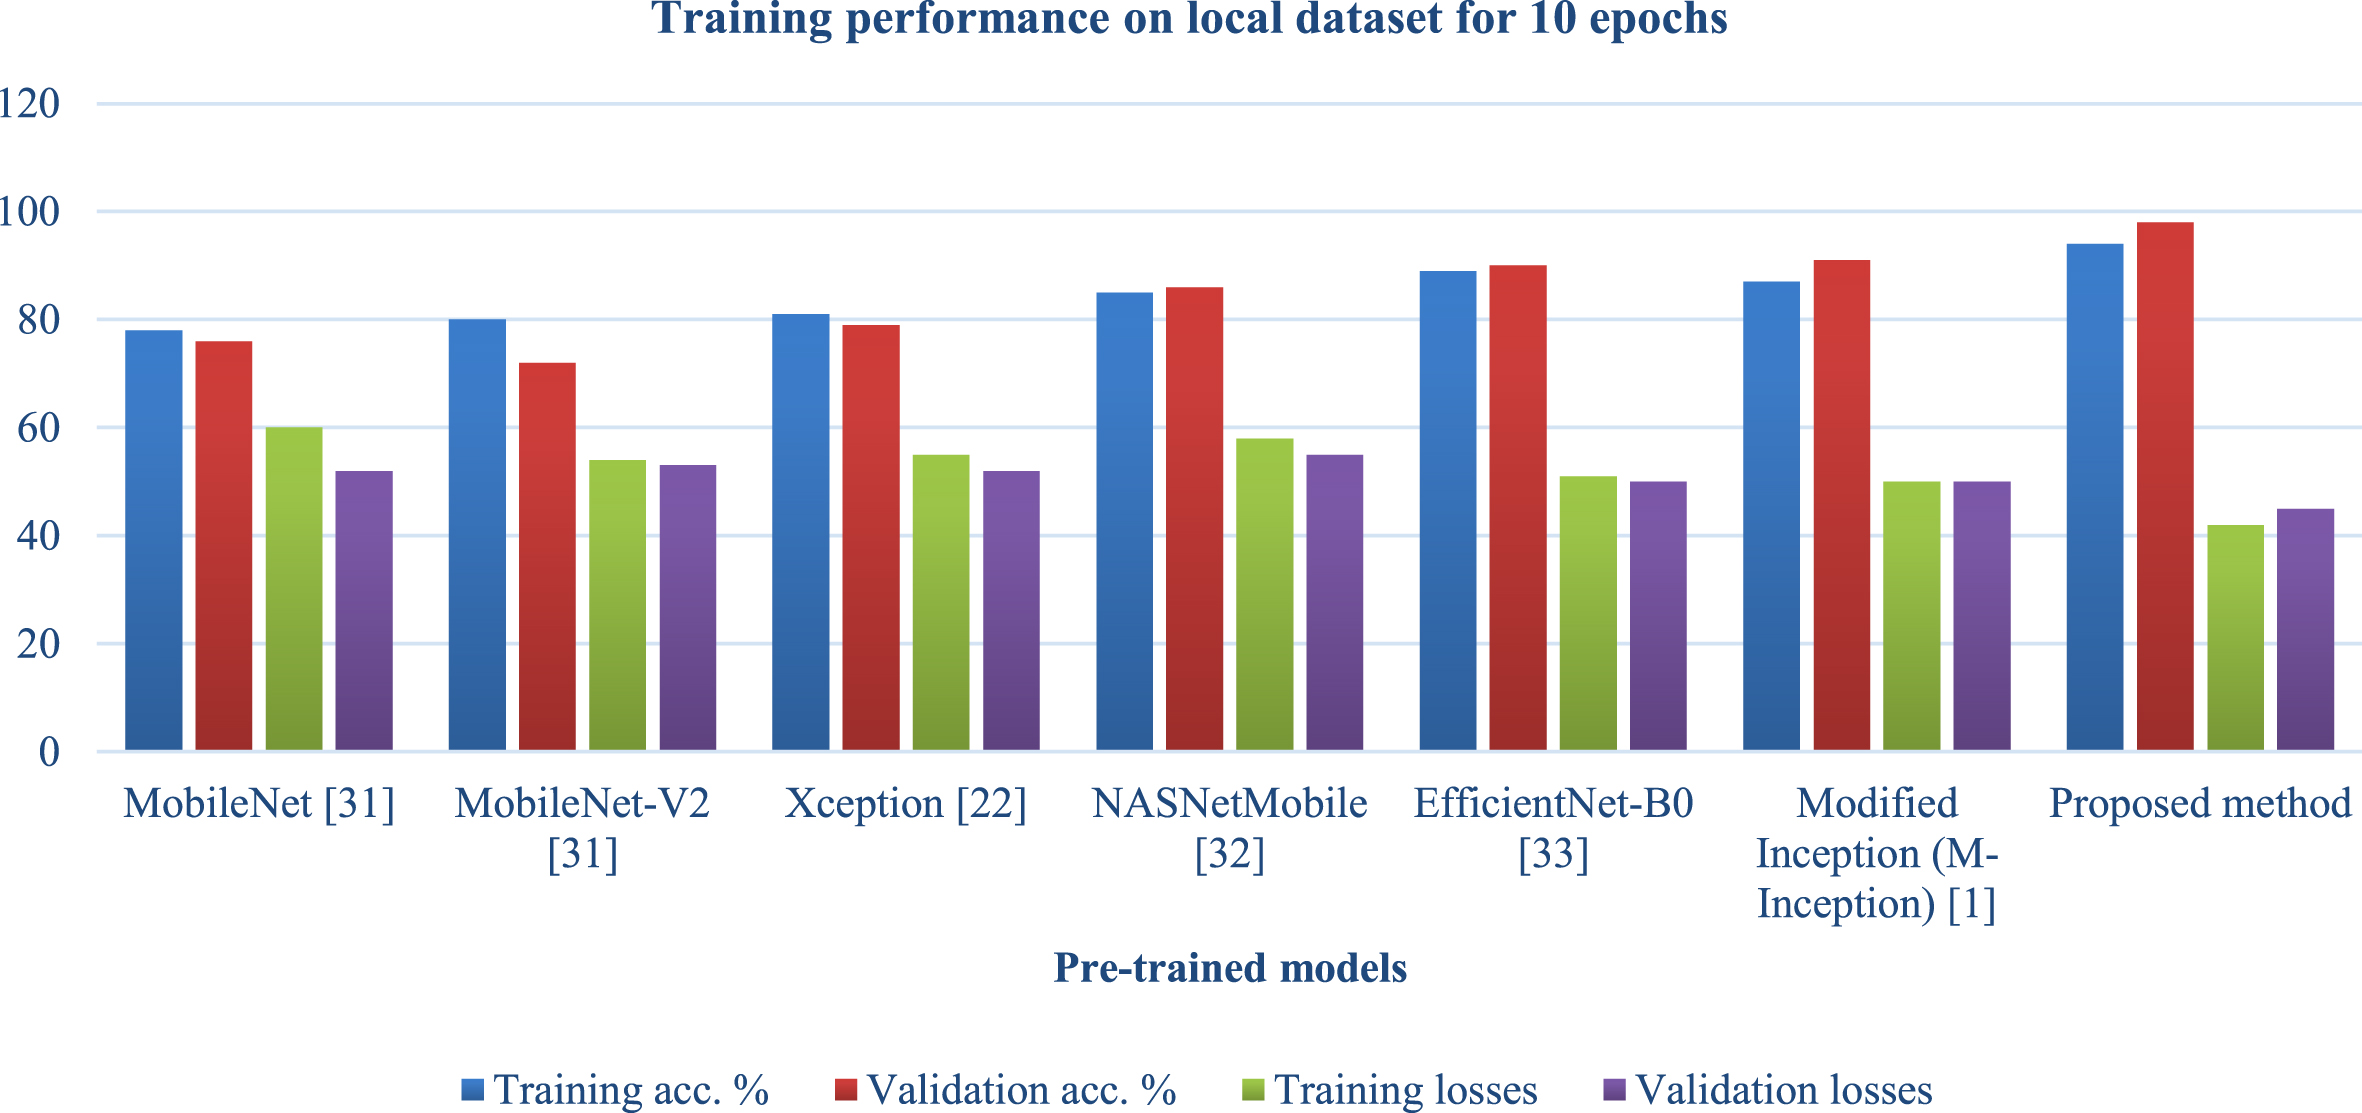
Training performance on local dataset for 10 epochs.
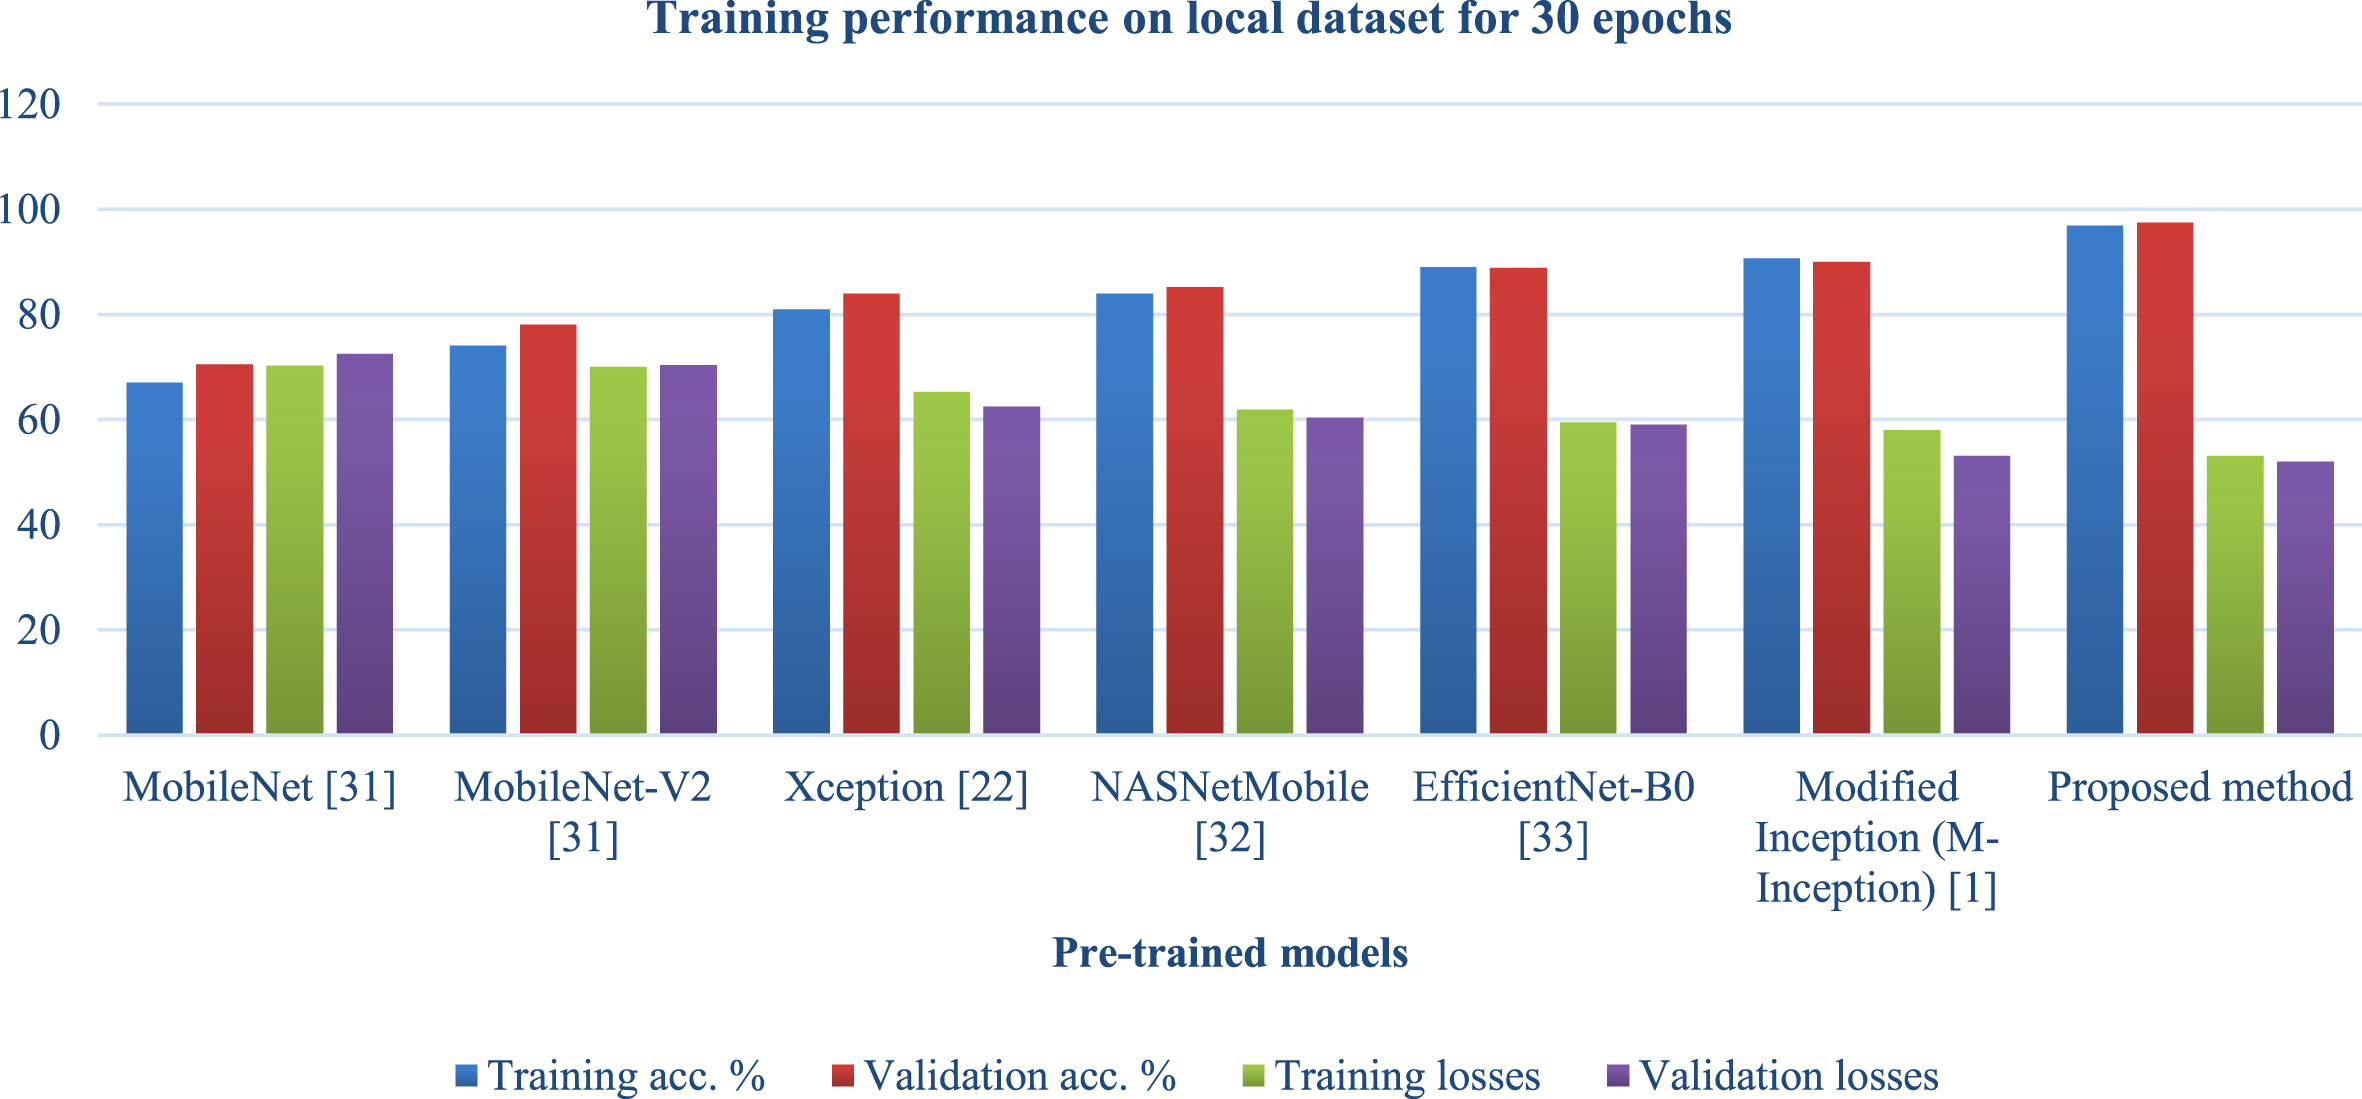
Training performance on local dataset for 30 epochs.
Table 6 and Fig. 12 explains the results for various classes and displays predicted and actual numbers and performance metrics such as accuracy, recall, precision, and F-score to evaluate model performance across classes. It was observed from the table that the number of correct to incorrect averaging had a stable gap, which means the model wasn’t biased towards any particular class, which suggests that the model was stable towards multiple variations of datasets even when some subsets of classes were experimenting with the proposed model.
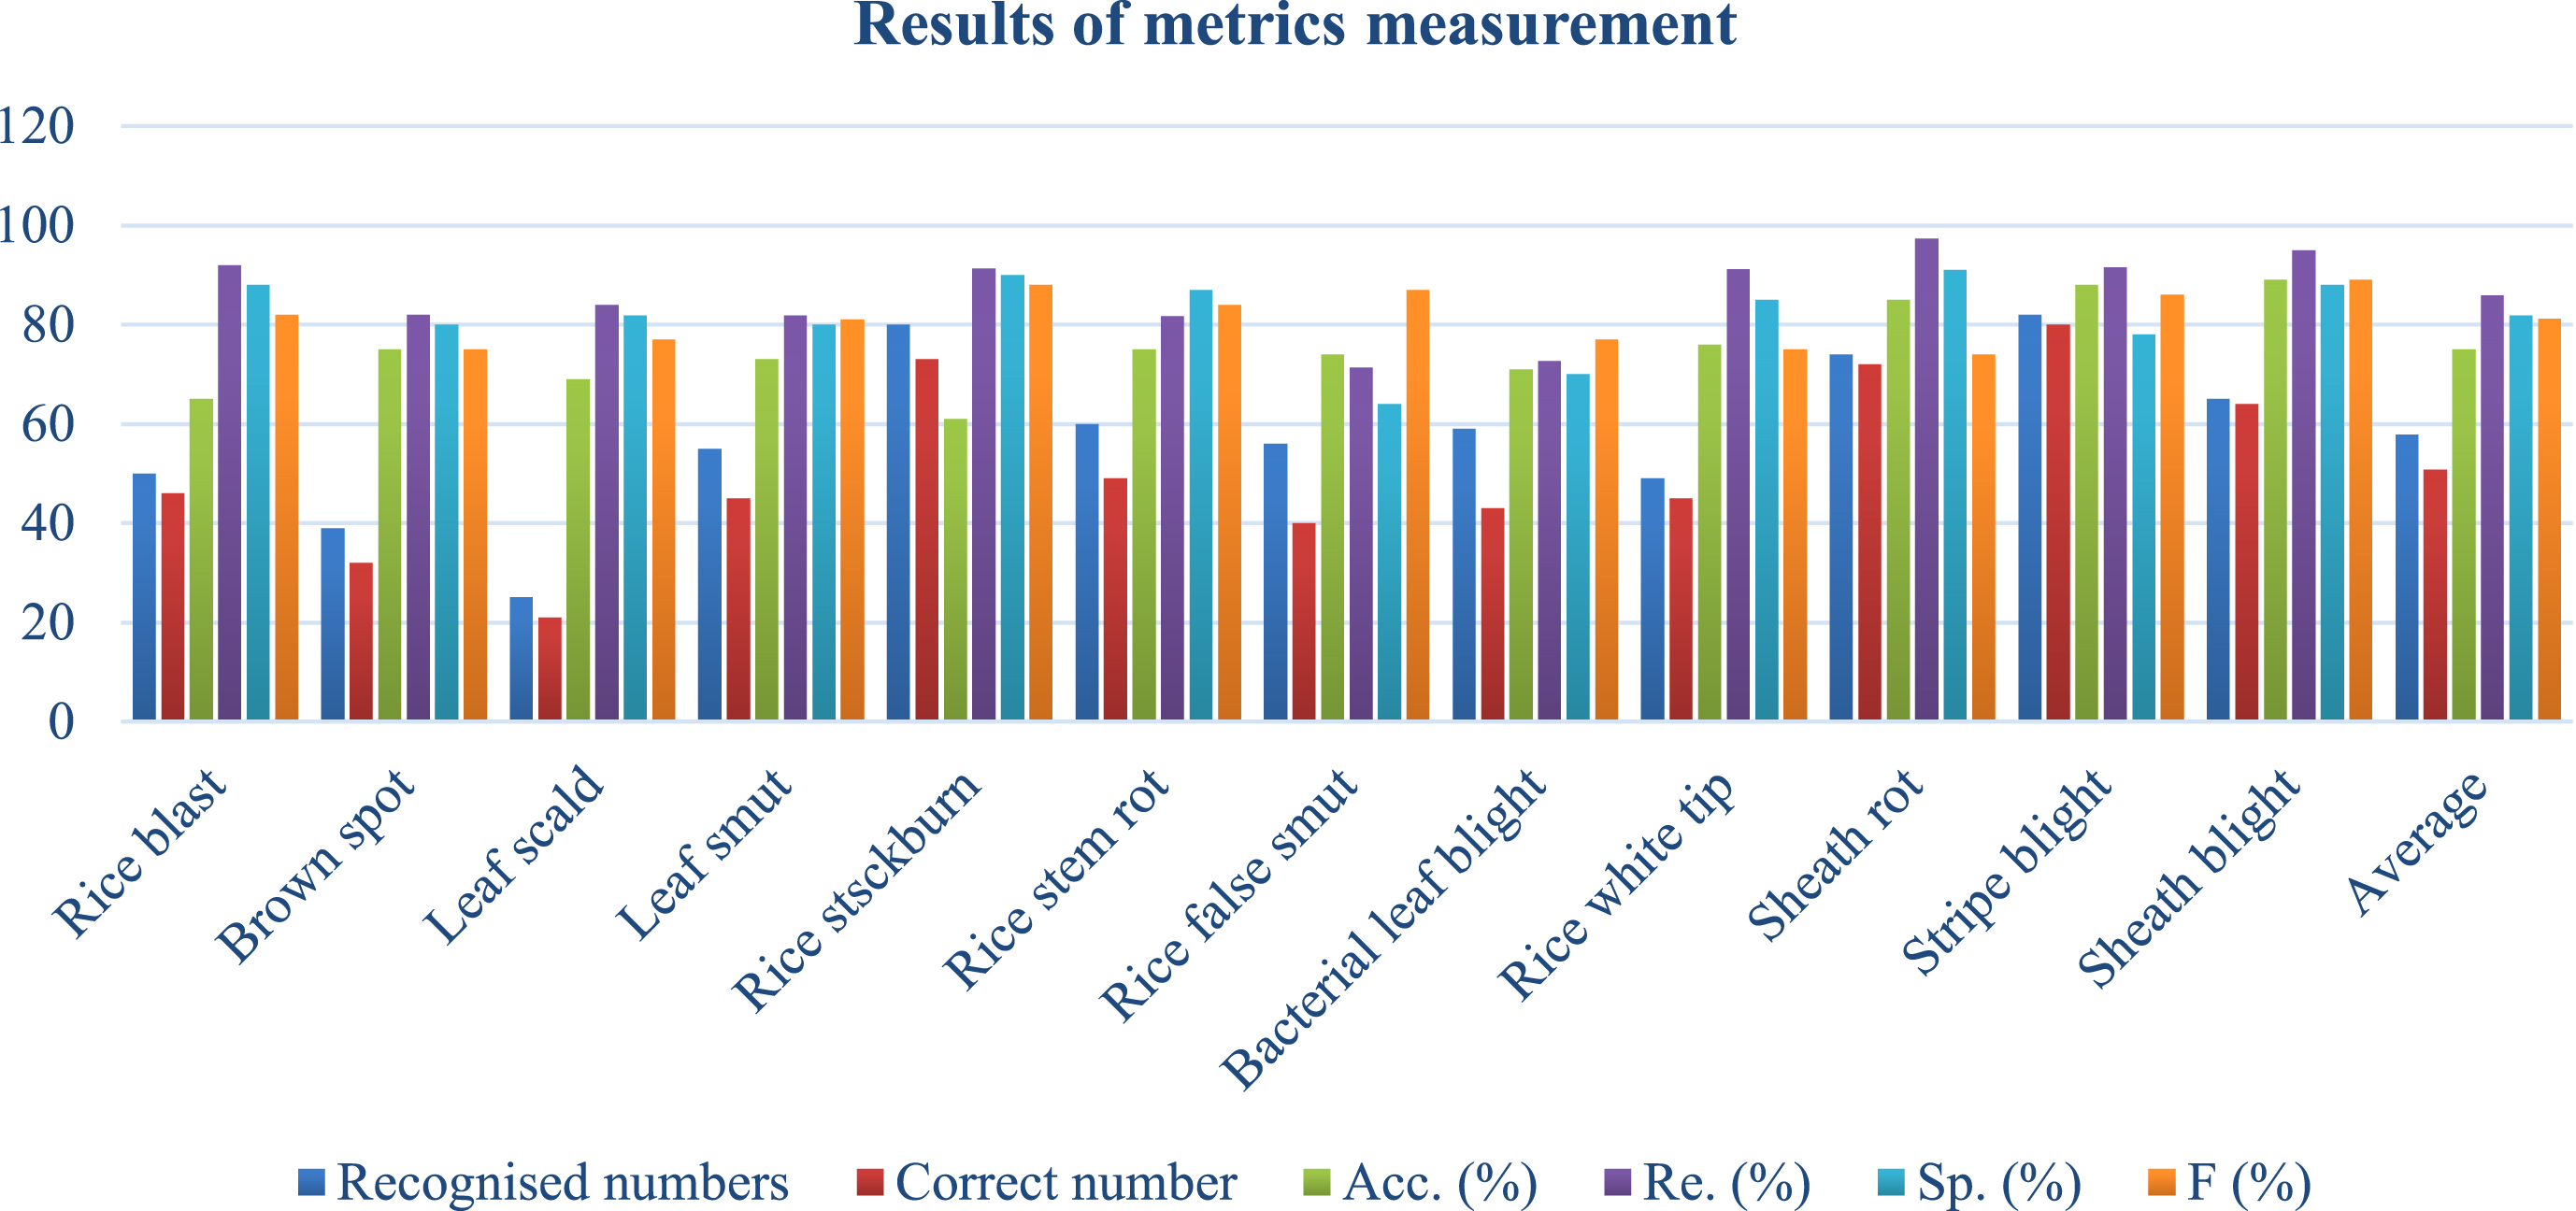
Results of metrics measurement.
Results of metrics measurement
The Proposed Xception model produces new applications in Argitech based on experimental results. Currently, disease detection models generate false positives because of their overlapping nature, as the same leaf of a plant may suffer from multiple diseases. These issues are handled by the proposed model, which makes disease detection more accurate. It uses Resnet18, a logarithmic-based softmax layer with mobile networks and less neural networks, to extract features. They classify using Inception-based models. These modifications reduce false positives and increase true positives, matching the model’s accuracy numbers. The local experimental materials also contain photographs of rice plants from different places taken in natural settings like untamed fields with varied backgrounds and light intensities. Existing methods employ Inception as a classification module with a mobile net and a logarithmic-based softmax layer to extract features from the suggested model. These adjustments considerably minimise false positive responses, increasing true positives and the proposed model’s accuracy. Xception architecture layers managed to iterate over the images of different overlapping regions of the Rice plant diseases, which makes separation between two different regions more effective and handles boundary cases better. This makes feature extraction the backbone to extract overlapping features as well, which ultimately leads to a wide range of thresholds for different diseases even if they look similar, making the decision boundary wider and generating results with higher confidence.
Another use is for farming drones to clip aerial images of plants, which is now legal in the Xception network thanks to changes suggested by the study and makes feature extraction simpler for highly distributed images. Even the proposed study helps in the Amandine recommendations system for the farming sector, as features were passed in the overall ping dirases that recommend solutions that work effectively on plants suffering from multiple diseases as well. The experiment’s promising findings validated the proposed approach for diagnosing agricultural illnesses. Despite the difficult conditions, the experiment might yield a big finding. Even if the model is accurate and memory efficient, backbone network fine-tuning may improve its performance. Memory consumption is closely connected with model performance. Increased backbone network activity can achieve this. We plan to improve the model’s performance while shrinking it soon. To do this, more bottom convolutional layers will be unfrozen, and the network architecture will be changed. The proposed model worked well on noisy and non-image data even with unbalanced samples in actual testing, making it relevant to industry as rice infections may be the same in different places. According to baseline research, the proposed neural network model must resist overfitting, perform well on noisy and non-image data, and even better on unbalanced data when features are controlled. It was discovered that the proposed approaches could improve accuracy and loss metrics on the local dataset by an average of 7% compared to the solutions already in place at epoch 10 on the dataset. The proposed approach has a performance that is about 6% better in terms of accuracy than the current solutions when 30 epochs of experiments are considered.
The current solution can detect rice plant diseases effectively on already detectable and stored infections but cannot learn on its own when the leaf of a plant suffers from any new plant. Hence, the future scope is to make it a learning model that learns when new diseases are captured in images as data points. Training at regular intervals puts another burden on potential users of these types of solutions.
Declarations
Author contributions
Mr. Rakesh Meena performed the research work under the supervision of Dr. Sunil Joshi and Dr. Sandeep Raghuwanshi. This manuscript is written by Mr. Rakesh Meena under the guidance of Dr. Sunil Joshi and Dr. Sandeep Raghuwanshi. This manuscript is reviewed and proof read by Dr. Sunil Joshi and Dr. Sandeep Raghuwanshi.
Compliance with ethical standards
Ethical approval
This manuscript does not contain any studies with human participants or animals performed by any of the authors.
Funding
No funding was received from any organisation for conducting the study of the submitted work and preparation of this manuscript.
Conflict of interest
The authors of this manuscript declare that they have no conflict of interest.
Informed consent
The research papers which are used for the study of the submitted work has been cited in the manuscript and the details of the same has been included in the reference section.
Data availability
We will deliver the data in accordance with the request.