
Abstract
Wireless Sensor Networks (WSN) play a major role in the wide variety of applications like underground pipeline and leaks monitoring, temperature distribution monitoring in industrial cyber systems, military, forest life monitoring, and environmental and geographical monitoring. Sensors are widely used in these different applications. The number of sensors and the application concerned mainly decides the energy consumption, network lifetime. In this process relay nodes may help the sensors as backbone to connect with sink node or base stations. In this paper, we introduce a new approach for relay node selection in WSN to minimize the energy consumption of the network. It uses channel aware relay selection technique using game theory optimization and act as a virtual backbone in connecting to the base station. However, the relay nodes are varied to check the optimal number of relays required for the small, medium and large number of nodes deployed in the network. Simulations are carried out using Network Simulator NS-2.35 and network is analyzed in wide variety of scenarios. Results show that the proposed relay node selection algorithm reduces energy consumption, improves lifetime, throughput of the network.
Introduction
Wireless Sensor Networks (WSN) play a major role in varied areas from sea life monitoring, wild life monitoring to security applications. Energy consumption in WSN is a major concern in which various techniques, schemes are used. Rigid graph-based topology helps in better temperature estimation, removes redundant communication links and thereby reduces energy consumption. Estimation algorithm to coordinate sensors and relay nodes is used in [21,44]. A routing tree algorithm with topology and location design for the node placements are carried out in [17,33]. However, it follows 3 stage algorithms in which the mobility of the nodes are not maintained in the same way throughout the operation of the network and it follows a greedy nature of the network. It acts as mobile relay, data sensitive method for WSN with low-cost energy optimization technique. Based on residual energy of each node and its distance from the sink node, opportunistic routing technique is followed to decrease energy consumption and increase network lifetime [12,22,26,39]. Selecting relay node using Markov decision process in sleep-wake up cycle for geographical forwarding is implemented by authors in [30]. In spite of geographical concentration in this paper, the local forwarding scheme is overlooked using a Markov decision process. One hop waiting delay is addressed and award metric for asset selling problem is considered as the major criteria in solving relay selection problems to reduce delay and average costs in the network.
Cooperative game works on the basis of TDMA approach. It helps in proper relay node selection which coordinates in optimum power levels thereby achieve better energy and overhead in the network. Cooperative game in the network with energy balancing in the communication process improves quality of service. Cooperative communication helps better next hop selection in clustering approach. However, by combining distributed network with cooperative games help in achieving better overhead, lifetime for the network.
Relay nodes are selected based on distance threshold in [2,36]. K means approach helps in connecting each cluster head to at least one relay node and thereby energy consumption is reduced and network lifetime is increased. Sensors in WSN are prone to frequent failures which can be addressed by using relay nodes as virtual backbone of the network [15]. Repairing costs of the failures in the network can be reduced. Virtual relay set scheme is followed in [24] for creating hotspots and non-hotspots in the network. In this method, the requirement of nodes, energy are main constraints to create hot spots and non-hotspots. Loss and delay are addressed in WSN by fixing size of virtual relay scheme.
Cluster formation based on density and energy levels of nodes followed in [13,16]. Even though the number of cluster heads is decided based on the density of nodes in each sub layer and based on partition that happens in the network, the momentous change in energy and lifetime is yet to be analyzed and standardized to give a basic rule in this logic. This will reduce the burden on cluster heads and relay nodes take charge whenever required. In this method activate and deactivate of small part of network is possible at any required time. Clustering is followed to decrease energy consumption in the network, since only cluster heads communicate to base stations. In some cases, cluster heads and relay nodes are same which makes cluster heads job complex. By using distributive clustering [10,40,43,45] relay nodes are separated from cluster heads whereby data aggregation to be done by relay nodes to the maximum extent. A routing algorithm for wireless body area network is used in [11]. Energy aware routing in software defined network helps in energy efficient routing for health care applications.
Section 2 presents the related works in WSN, Section 3 describes the proposed Distributed Sensor Media Access Control (DS-MAC) with game theory optimization in random number of relays or base stations. Section 4 shows the results in random deployment with varied number of relays deployed for DS-MAC and their performances, and Section 5 concludes the work.
Related work
Sensors are powered by battery and relays are powered by energy harvested in the network. All the nodes/sensors are initially powered by non-rechargeable batteries, however during communication the relay nodes energy is calculated based on its distance from sink/destination node and the residual/remaining energy of adjacent nodes. A two-tier hierarchal node placement approach is used in [3] by a probability density function (pdf) to minimize energy consumption in the network. Random deployment is done based on the probability density function. Based on data aggregation, energy aware path is selected for forwarding the packets. This approach also improves throughput, lifetime in the network. Two phase two-tier topology helps in saving the deployed relay nodes and thereby increase scalability and energy efficiency of the network in [27]. Delay constraints in relay node placements are addressed by this method and connectivity in the network is improved using relay nodes through connectivity algorithm. Local search algorithm for relay node positioning is carried out in [18,20,25,28]. Time complexity and approximation ratio for the algorithm is analyzed to check the high-tier network connectivity in WSN. A relay placement technique with length based and time-based packets are transmitted in [38]. It helps in transmitting signal power optimization as well as circuit power optimization [34], thereby minimizing battery energy consumption.
A new algorithm for sensors placement in WSN for underground pipeline inspection and leaks detection is carried out in [41]. It depends on sensor movements, velocity and received signal strength [32]. Industrial cyber monitoring performance is improved using relay nodes in WSN in addition to sensors alone in [5,8].In spite of guaranteed time slot allocation for the nodes, the code is double than the conventional method and transmission power allocation for the cluster head is not uniform in this work. This is based on the distance of the cluster of nodes from the coordinator node and to be analyzed to arrive at a standardized logic. Kalman filtering and tree-based broadcasting approach are used by the authors to monitor temperature distribution in rolling process of industrial cyber physical systems. Optimal number of relay nodes and their position in the network are decided using NP-hard heuristic approaches in [1,23]. A cost function is assigned to each cell in the grid type network model and relay nodes optimal number, position is chosen to satisfy connectivity and QoS requirements. Radio propagation in multi-medium environment for under-ground pipeline inspection using sensors above ground levels. These are called relay nodes. The authors in [42] tried to minimize the number of relay nodes and energy of under-ground mobile robots using channel-aware placement of relay nodes. State estimation for sensor nodes can be used to solve the limited energy resources problem in WSNs. It is and underground pipelines inspection where sensor nodes are deployed underground but relay nodes are deployed above the surface. Different medium and their path loss are analyzed, however the optimum number of relay nodes above ground is analyzed and methods are yet to be framed to deploy relay nodes underground. Distributed sensor networks solve the problems of fault tolerance and network scalable problems [35]. Various approaches using relay nodes is shown in Table 1.
Literature survey on relay nodes for WSN
Literature survey on relay nodes for WSN
The challenge in Media access control (MAC) Layer is noise and interference levels, energy consumption for improving network performance. Channel degradation and difficulty in finding minimum weight path from source to sink is a challenge. Relay nodes play vital role in providing minimum weight path from cluster head to base station or sink node by utilizing the energy harvested based on communication rate and the distance to the sink node. Relays can also act bidirectional in data communication between source and sink nodes. In this paper, we designed and analyzed a new method with payoff optimization and back off mechanism for adaptively changing the sleep, listen and alive duration of relay nodes (BS-base station) in the network for obtaining low end-to-end delay (EED) and high throughput in MAC for WSN applications using Network Simulator. The novel idea of this work is that constructing path from sensor nodes to relays with channel availability for increasing the throughput of MAC. Back off period is maintained whenever channel is busy and then adjusting contention window size as per interference levels in the proposed DS-MAC can lead to high network lifetime, low EED and energy consumption.
Game theory
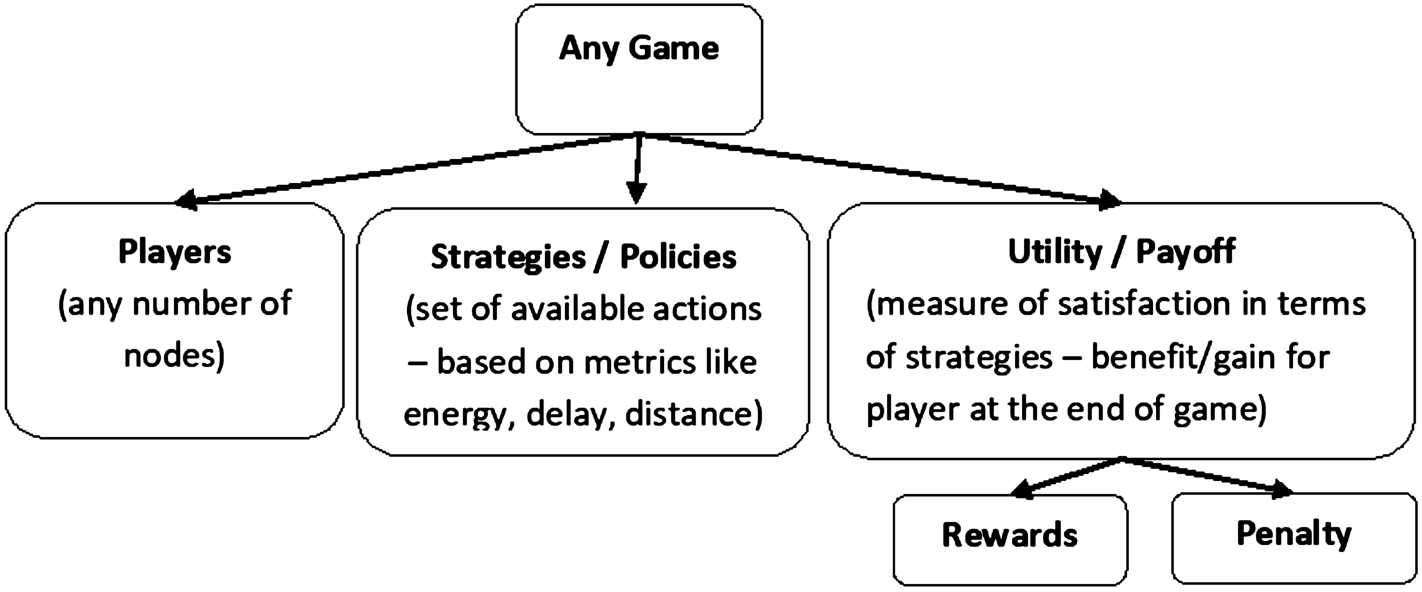
Figure 1 and Fig. 2 illustrate the game strategy used in our proposed methods. Games are of two types namely cooperative and non-cooperative games. In our work, cooperative games with credit-based incentive mechanisms are used. Any game consists of players, strategies, utility as the components. Based on performance of players and their actions, rewards are offered as payoffs. In our work we have used distance and energy level of the neighboring node as two criteria’s based on which the node will decide forwarding the packet to next neighbor. These set of actions are called payoff of the node. The action profile of a node is called the strategy of the node. Based on the actions by a node, the reward/penalty are assigned to the node which can be considered as the cost function.
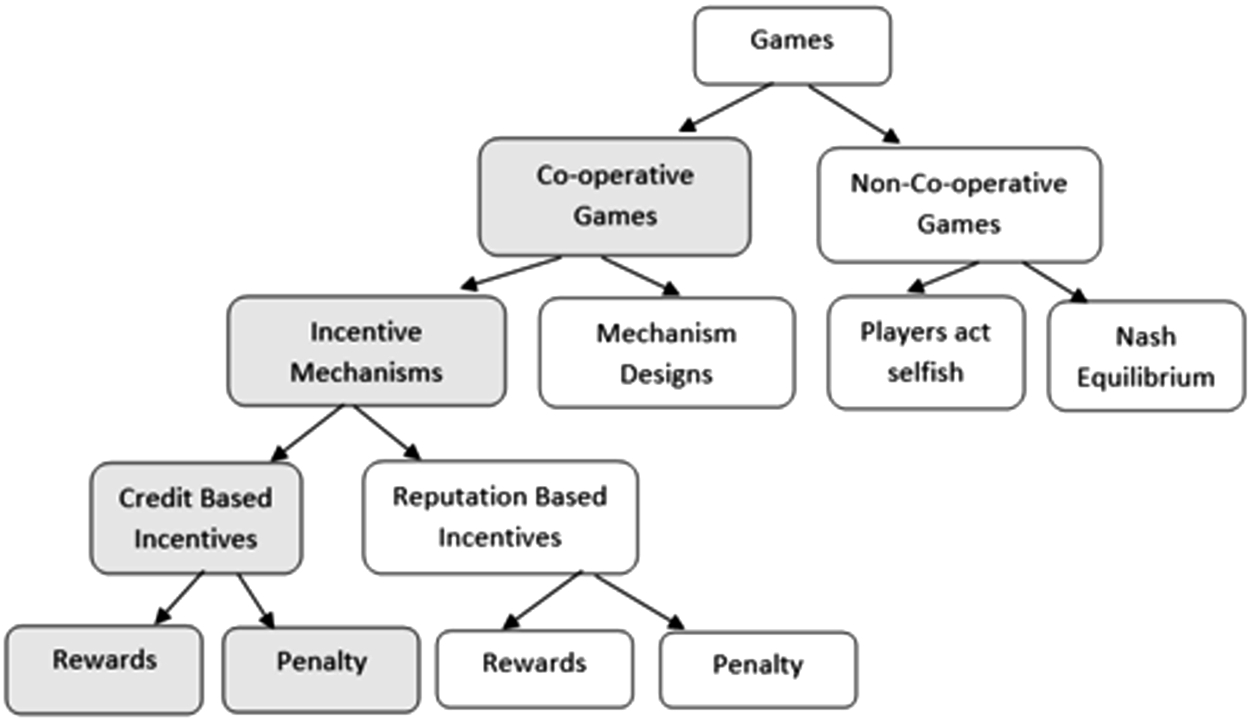
Game theory – cooperative and non-cooperative games.
Rewards, penalty for sensors/players in the game.
An asymmetrical two-way relay network in which network coding and two-way cooperative communication introduced in existing time division multiple access (TDMA) is to achieve higher throughput than a symmetrical network and lower packet generation rate by relay nodes. Bidirectional relay node selection helps in stable communication by using a link quality algorithm. This quality estimation algorithm outperforms other multi-hop broadcast schemes and obtain improved packet delivery ratio by decreasing end-end communication delay in the vehicular ad hoc network.
Instead of transmitting data from cluster head to base station nodes directly which consumes more energy, transmitting data from cluster head to relay nodes are preferable and the relay nodes should be the node closer to base station node. This is carried out using multi-tier protocol and stable election protocol. The relay nodes can transmit data in either direction i.e. from cluster head to base station and base station to cluster head, hence called as bidirectional relays. Half duplex and full duplex relay nodes are used in pipeline MAC for decreasing hop count, suppressing self and inter flow interference. A Gaussian relay channel with full duplex for nodes are used with cooperative communication and it acts as a novel technique for energy optimization. Energy consumed per relay node is given by Equation (1).
Where
Distributed sensor nodes are deployed in single-tier topology and connectivity-based relay node selection as shown in Fig. 3. It is by two set two phase method. When a network is applied to partitions, it leads to disjoint sub networks. In addition, relay nodes are placed using heuristic algorithm and Steiner- minimum tree optimum relay placement method as shown in flowchart. Steiner tree is a subtree of minimum spanning tree where all the vertices in the subtree are the vertices of the whole network hereafter. X and Y are the nodes considered and path between X, Y are considered in the steiner tree. Y node acts as relay node and its communication range is R and this is greater than r. The remaining part of the network is neglected as it does not take the minimum weight path towards destination. Hence, steiner is the subtree of minimum spanning tree with minimum weight path towards destination. In some networks based on large network size or time varying channel information, selecting best relay between transmitter and receiver is very difficult. A technique to select an optimal relay by fixing up the area helps for relay selection, rate transmission and outage probability in the first phase. Thereafter, carrier sense multiple access with successive slotting is implemented as the second phase. This model gives better transmission rate compared to random access blind relay selection.
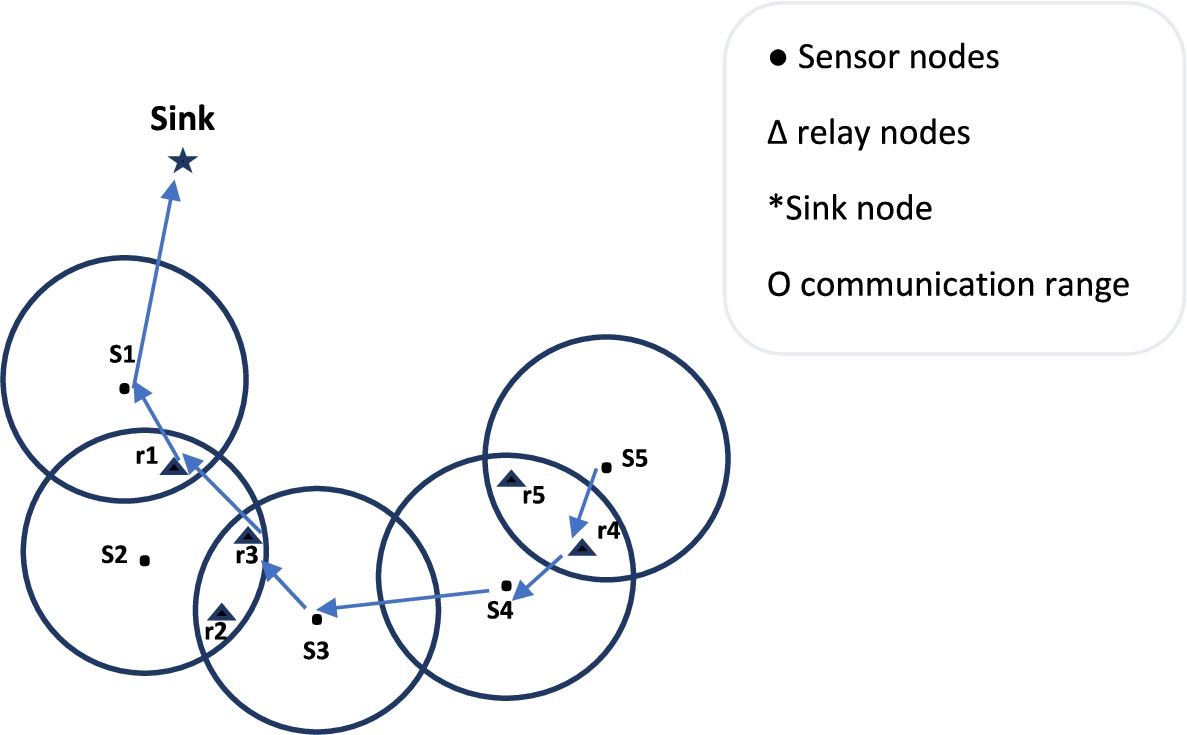
Transmission path between source node S5 and sink node via optimum relay selection.
Single tiered minimum spanning tree (MST) to select relay nodes in the network is shown as flowchart in Fig. 4. Two positive real constants are taken,
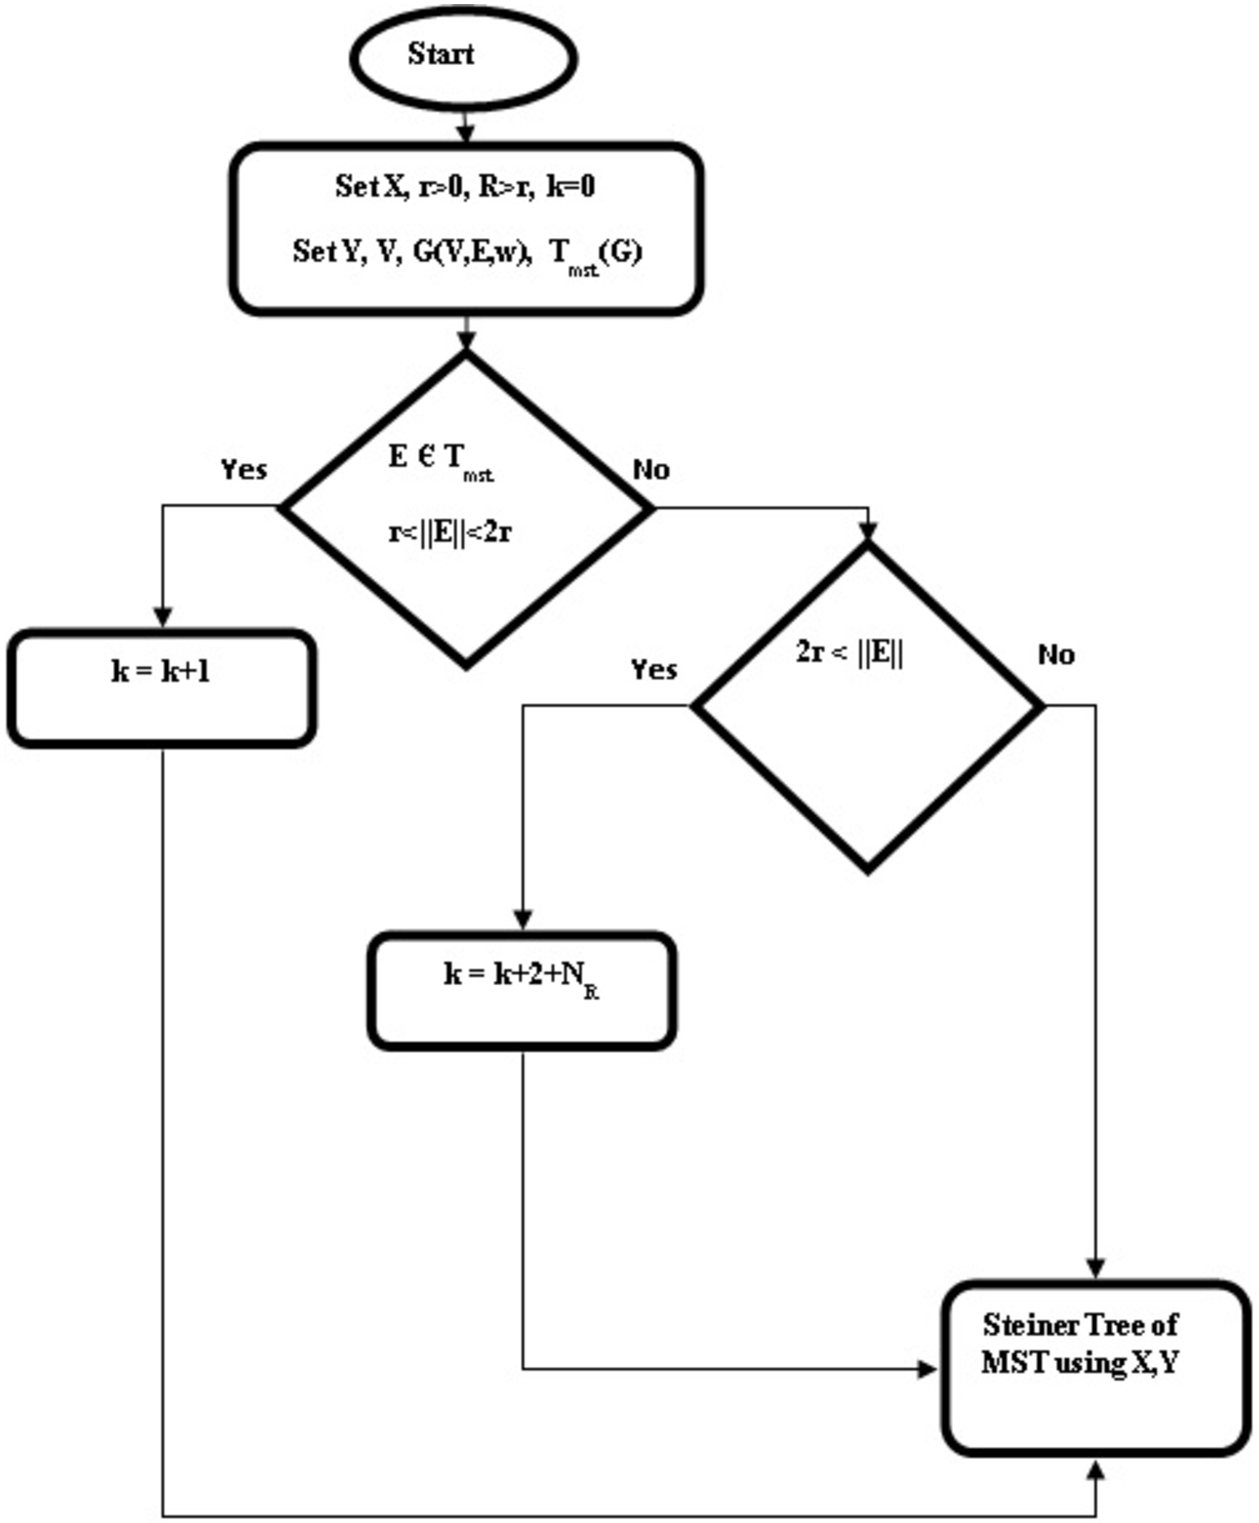
Flowchart for Minimum Spanning Tree (MST) to place relay nodes.
Let p and q be two points in the plane, then
In Fig. 4; X, Y are neighbor nodes in the network, V and E represents vertices and edges in the network. w is the weight of the edge calculated based on energy consumption, distance to travel if that edge is selected.
If edge E belongs to
Network simulation setup for DS-MAC with relays
Energy consumption of a node acting as sensor or relay in the network is given by Equation (2).
Where
Throughput for a packet transmitted successfully from node i to sink node k is given by Equation (3).
Here,
Delay in transmission of one packet is given by Equation (4).
Where
In Equation (5),
A heterogeneous WSN can be formed with two types of nodes, the SNs and relay nodes (RNs), respectively. SNs are responsible for data fusion and do not take traffic relaying as a routine function. RNs are used to aggregate and relay information from SNs. New consensus-based distributed estimation method is investigated with the technique of topology optimization such that the information fusion in the estimation process can be expedited with less energy consumption. The main contributions of this paper are 3-fold:
Min-weighted rigid graph is used to describe the topological relation of SNs and RNs. Then, the network topology is optimized such that the number of communication links and energy dissipation can be reduced.
Given the optimal topology, consensus-based distributed estimation and data aggregation rules are proposed for SNs and RNs, respectively.
The introduction of low-end RNs, the energy consumption, packets dropping ratio can be improved as compared with the homogeneous WSNs.
The proposed DS-MAC protocol with varied number of relay nodes as base stations (BS) are implemented in NS-2.35. Figure 5 and Fig. 6 shows deployment of nodes with 10 base stations/relay nodes in 500 × 500 terrain. Deployment of nodes/sensors does not depend on type of games used. Random deployment method is followed. In Fig. 5, green color is the energy of the nodes, red color are the relay nodes and BS stand for base stations. In Fig. 6, blue color is the node in sensing mode, brown color means node in forwarding mode and pink color means node is in receiving mode. Two ray ground reflected model is considered for wireless channel and conventional MAC parameters are used in the simulations carried out. The number of nodes, speed of the nodes, data rates, deployment space, and type of traffic for different transmissions used for the simulation are shown in Scenario 1 to Scenario 5.
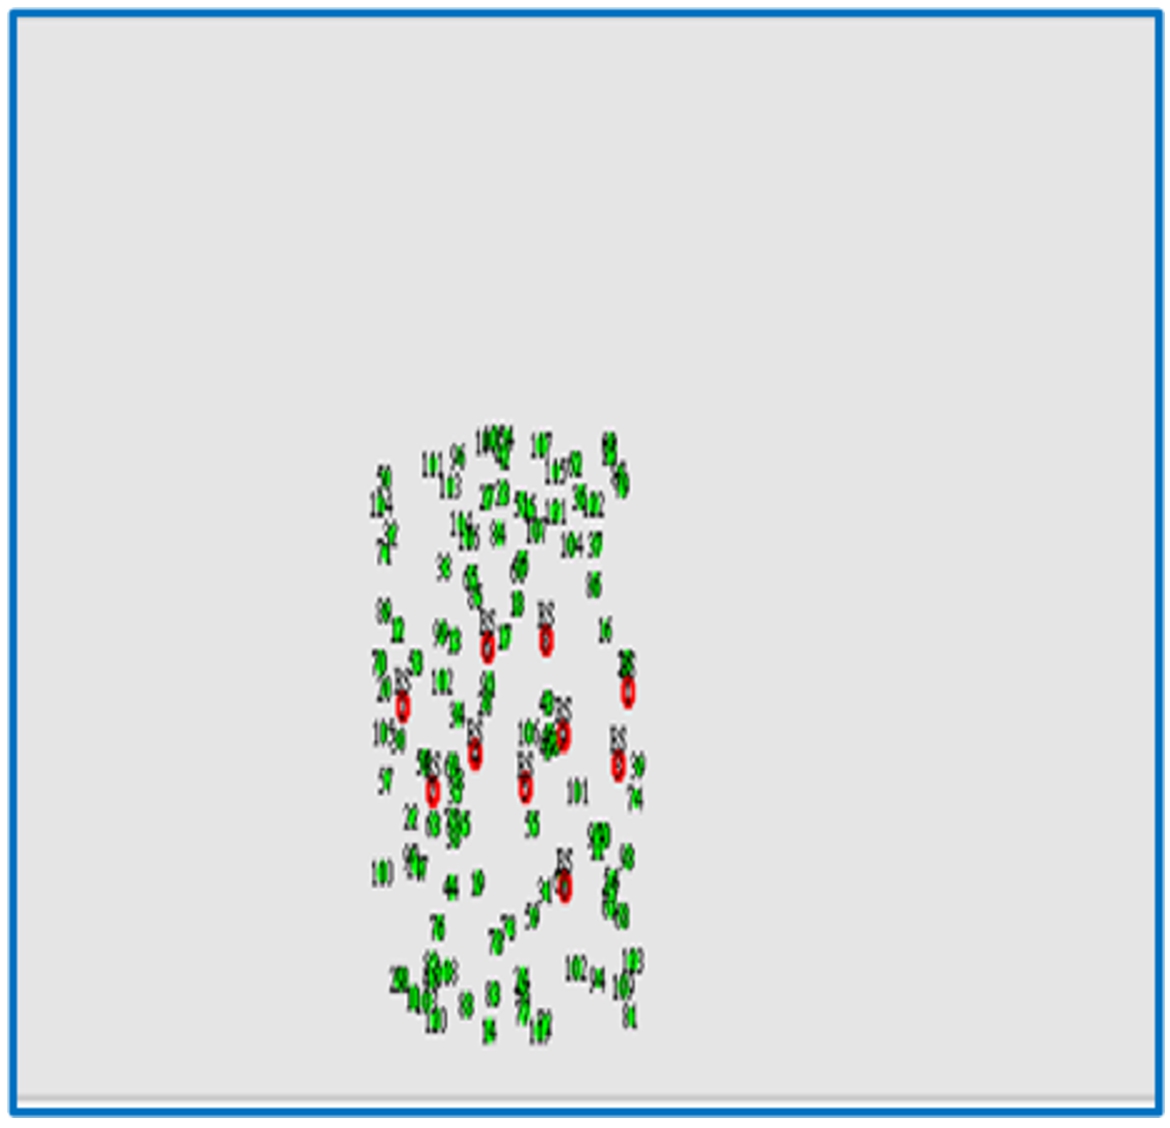
Deployment of nodes with 10 base stations/relay nodes.
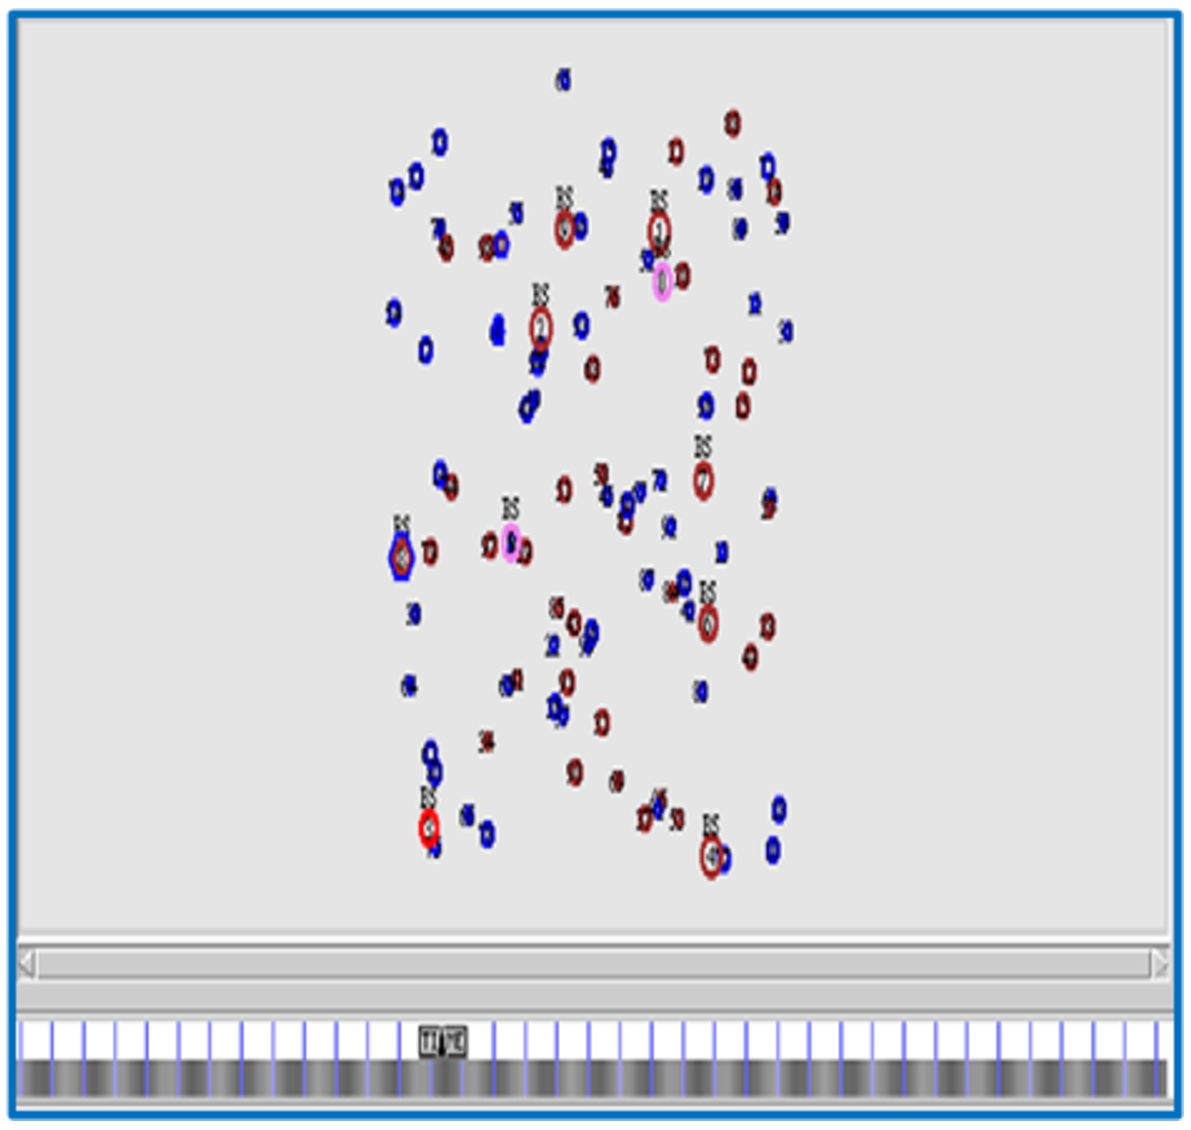
Nodes in sensing, forwarding and receiving mode.
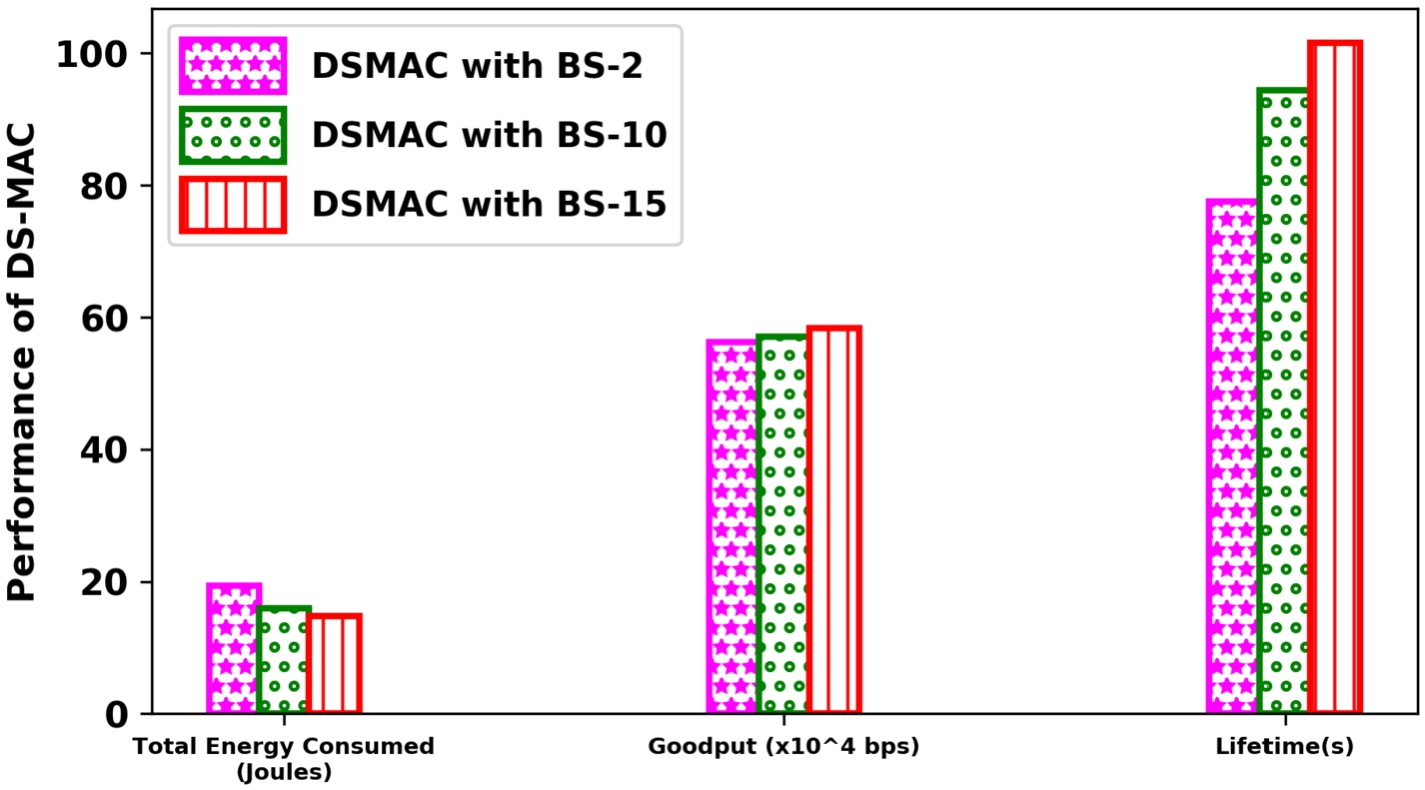
Total energy consumption, goodput and lifetime in DS MAC-FRAME with 2 BS, 10 BS and 15 BS – scenario 1.
Network Performance in single and multiple base stations scenario and 500 m2: The graphs of Fig. 3 to Fig. 5 depicts the battery utilization of a lightly, densely and moderately populated network with 1,2,5,10 and 15 base stations. Figure 7 shows that total energy consumed by 75 nodes in a network are 0.647384 J and 19.3516 J respectively in two base station scenarios for proposed DS-MAC whereas 0.393132 J and 14.7616 J respectively in fifteen base stations scenario for the same DS-MAC. As the transmission range for relay node is higher than sensor node, the energy consumption is reduced when relay node selected by single tier algorithm participates in transmission of packets. Figure 7 indicates that goodput and lifetime in a network with 75 nodes are 35.6114 × 10⁴ bps, 33.7628 s in single base station and 58.3733 × 10⁴ bps, 101.615 s in fifteen base stations scenario respectively. Goodput increases as relay nodes having longer transmission range helps in successful transmission of packets, lifetime increases as per equation (5) due to decrease in energy consumption.
Figure 8 exhibits that Throughput of the network with 75 nodes and 125 nodes are 24.5725 Mbps, 81.648 Mbps in two base station and 26.0362 Mbps, 97.2088 Mbps in five base station scenarios respectively in proposed DS-MAC. Throughput is inversely proportional to delay. If delay decreases, throughput increases.
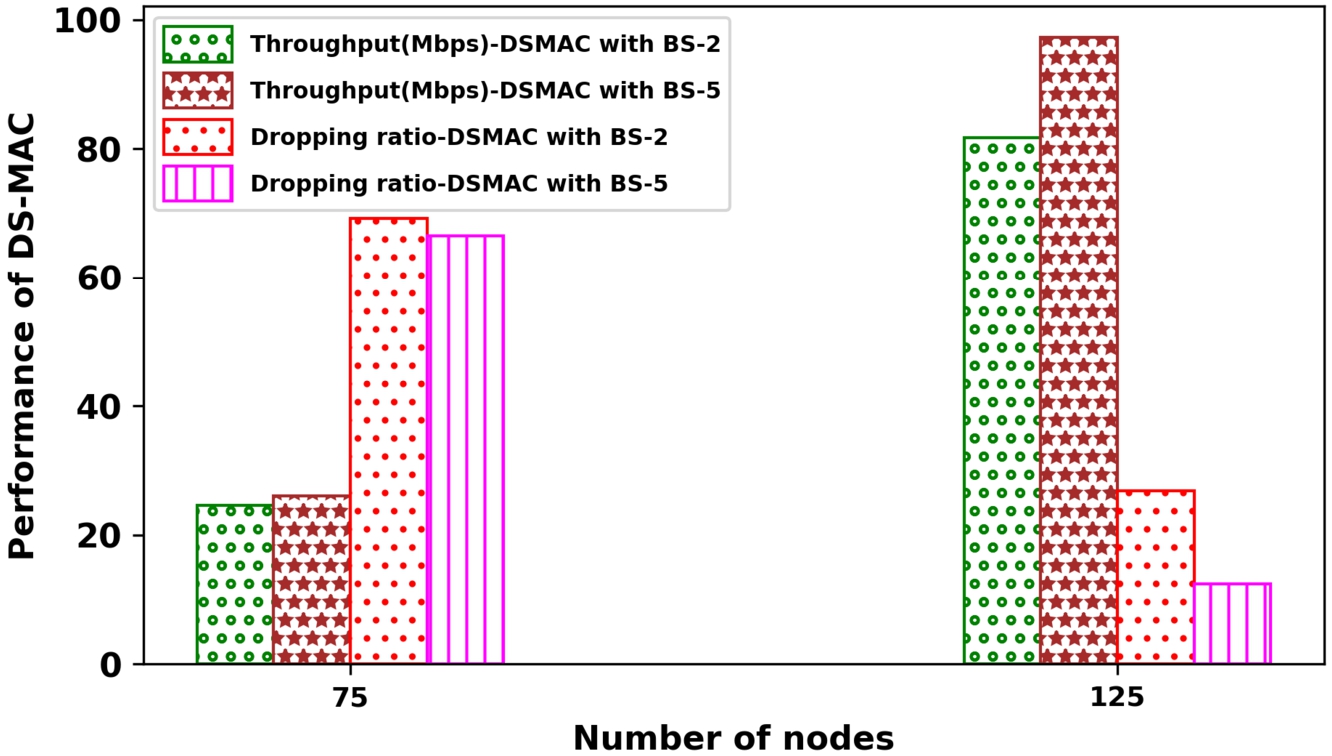
Throughput, dropping ratio in DS MAC-FRAME with 2 BS, 5 BS – scenario 1.
Figure 8 pictures that dropping rate of packets in the network with 75 and 125 nodes are 69.2148, 26.8723 in two base stations scenario and 66.4349, 12.4553 in five base stations scenario respectively. Figure 9 portrays that delay of the network with 75 and 125 nodes are 0.0115019 ms, 0.0119503 ms in single base station and 0.00729103 ms, 0.0112548 ms in two base stations scenario. As the number of control bits decreases due to longer transmission range of relay nodes compared to sensor nodes, this in turn helps in decreasing delay as per equation (4).
Relay node helps to find optimum path to transmit packets to the sink node, hence energy consumption reduces and throughput, goodput increases. As the relay node transmission range is high, number of packets dropped is reduced.
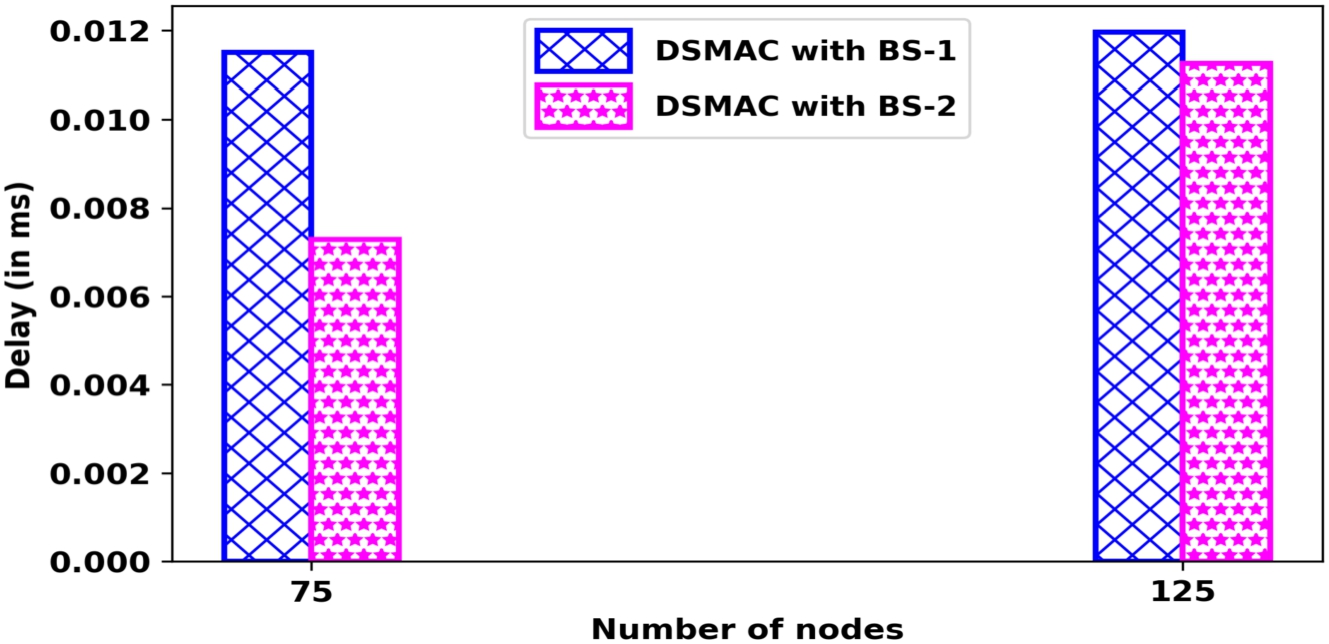
Delay in DS MAC-FRAME with 1 BS, 2 BS – scenario 1.
Figure 10 represents that total energy consumed by 100 nodes at data rate 100 Kbps and 900 Kbps in a network are 51.9836 J and 51.2996 J respectively in single base station, 47.0013 J and 49.5413 J respectively in two base stations scenario for proposed DS-MAC whereas 45.8099 J and 44.8919 J respectively in fifteen base stations scenario for the same DS-MAC. Effective relay node selection helps in reducing the energy consumption in the network. Figure 7 depicts that packet delivery PDR (in %) by 100 nodes at data rate 100 Kbps and 500 Kbps are 73.9302, 71.659 in two base stations, 76.2988, 76.9518 in five base stations respectively. Figure 11 shows that dropping rate of packets of the network by 100 nodes at data rate 100 Kbps and 500 Kbps are 26.0698, 28.341 in two base station and 23.7012, 23.0482 in five base stations scenario respectively. Figure 12 exhibits that delay of the network by 100 nodes at data rate 100 Kbps and 900 Kbps are 0.00934194 ms, 0.00923965 ms in single base station and 0.00882266 ms, 0.00901113 ms in two base stations scenario respectively in proposed DS-MAC.
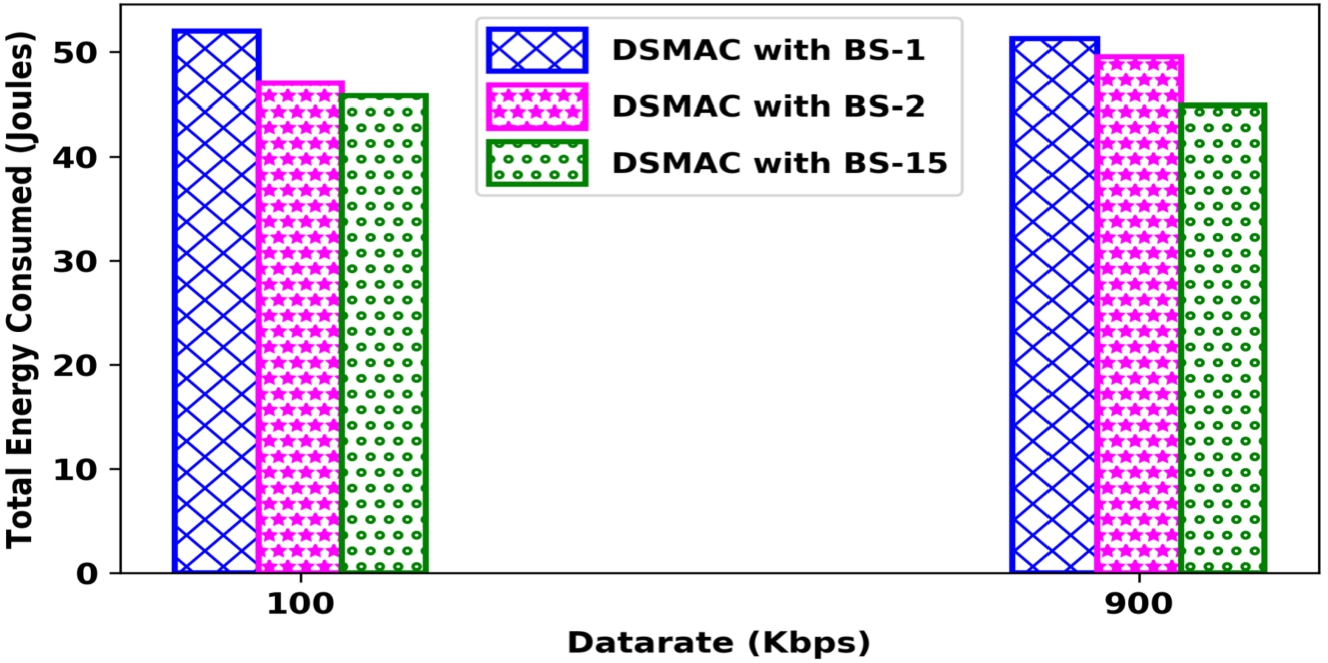
Total energy consumption in DS MAC-FRAME with 1 BS, 2 BS and 15 BS – scenario 2.
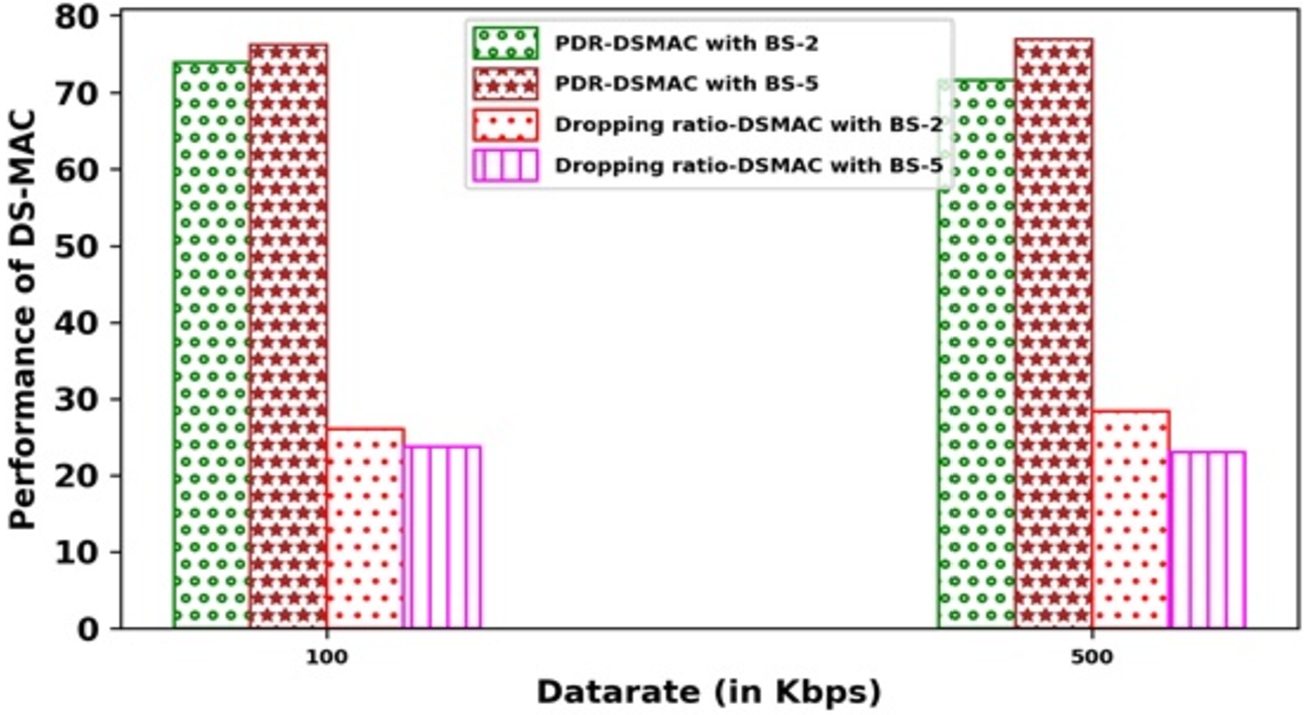
PDR, dropping ratio in DS MAC-FRAME with 2 BS and 5 BS – scenario 2.
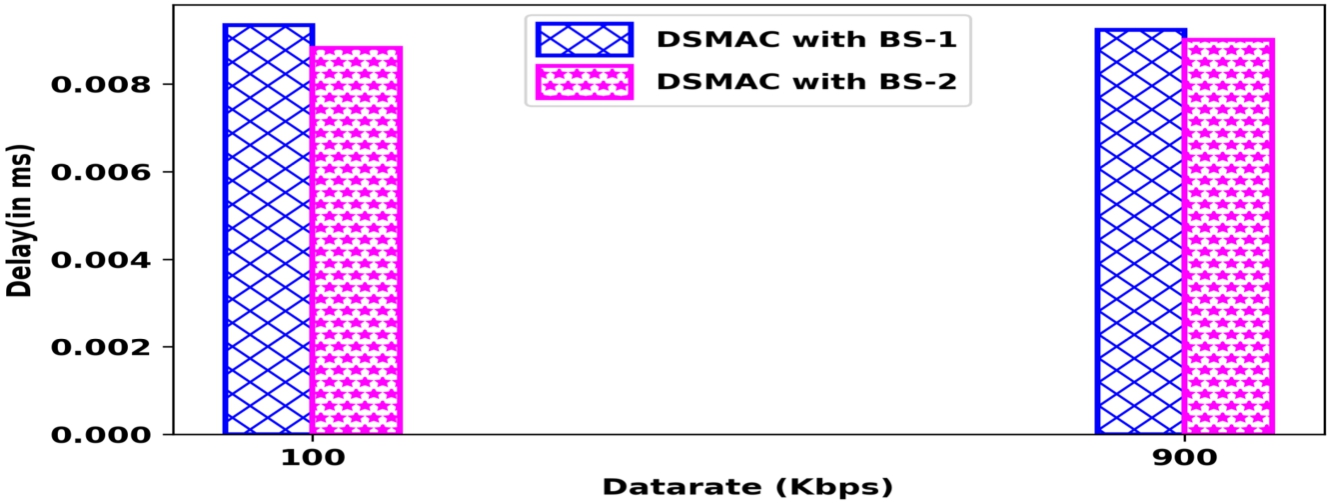
Delay in DS MAC-FRAME with 1 BS and 2 BS – scenario 2.
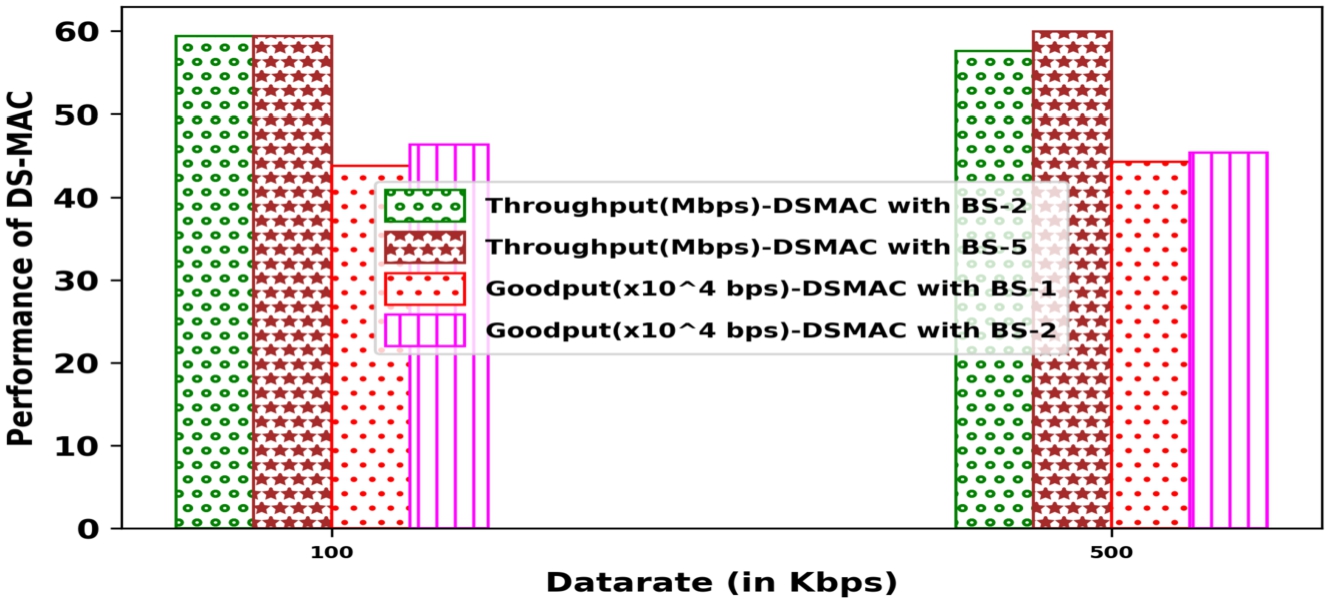
Throughput, goodput in DS MAC-FRAME with 1 BS, 2 BS and 5 BS – scenario 2.
Figure 13 shows that throughput of the network with 100 nodes at data rate 100 Kbps and 500 Kbps are 59.3698 Mbps, 57.5752 Mbps in two base station and 59.3838 Mbps, 59.9173 Mbps in five base stations scenario respectively. Throughput increases and delay decreases by the optimal routes towards destination due to relay nodes in DS-MAC. Figure 13 interprets that goodput by 100 nodes at data rate 100 Kbps and 500 Kbps in a network are 43.8453 × 10⁴ bps, 44.3307 × 10⁴ bps in single base station scenario and 46.4259 × 10⁴ bps, 45.4549 × 10⁴ bps in two base stations scenario respectively for proposed DS-MAC. Goodput increases as relay nodes in DS-MAC helps in successful transmission of data packets without additional control bits transmission to neighbor nodes.
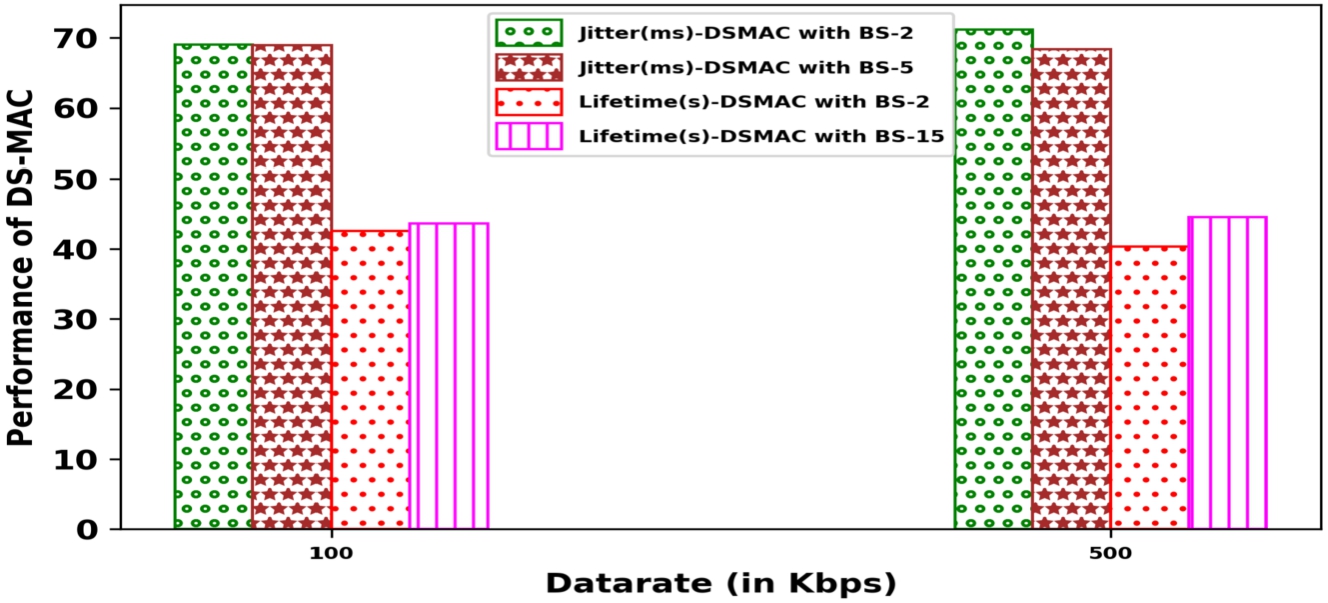
Jitter, lifetime in DS MAC-FRAME with 2 BS, 5 BS and 15 BS – scenario 2.
Figure 14 presents that jitter in a network by 100 nodes at data rate 100 Kbps and 500 Kbps are 69.002 ms, 71.1527 ms in two base station and 68.9769 ms, 68.3603 ms in five base stations scenario respectively. Delay is time required for end-end packet transmission, whereas jitter is additional time required for packet transmission due to congestion in the channel. Relay nodes maintains the connectivity between nodes in the path towards destination helps in reduction of jitter and delay in the network.
Figure 14 shows that lifetime of the network by 100 nodes at data rate 100 Kbps and 500 Kbps are 38.4737 s, 38.9867 s in single base station and 42.552 s, 40.3704 s in two base station scenario and 43.6587 s, 44.5515 s in fifteen base stations scenarios respectively in proposed DS-MAC. Lifetime increases as the energy consumption is reduced in the network. Relay node can transmit packets to larger range compared to sensor node transmission of packets, throughput increases and jitter, dropping packets decreases. Network lifetime is improved as energy consumption for retransmission of collided packets is reduced.
Figure 15 portrays that total energy consumed by 75 nodes and 125 nodes in a network are 20.4365 J and 153.492 J respectively in two base station scenarios for proposed DS-MAC whereas 17.1039 J and 148.937 J respectively in fifteen base stations scenario for the same DS-MAC. Relay assistance by single tier algorithm and the number of relays used in DS-MAC helps in reducing the energy in DS-MAC.
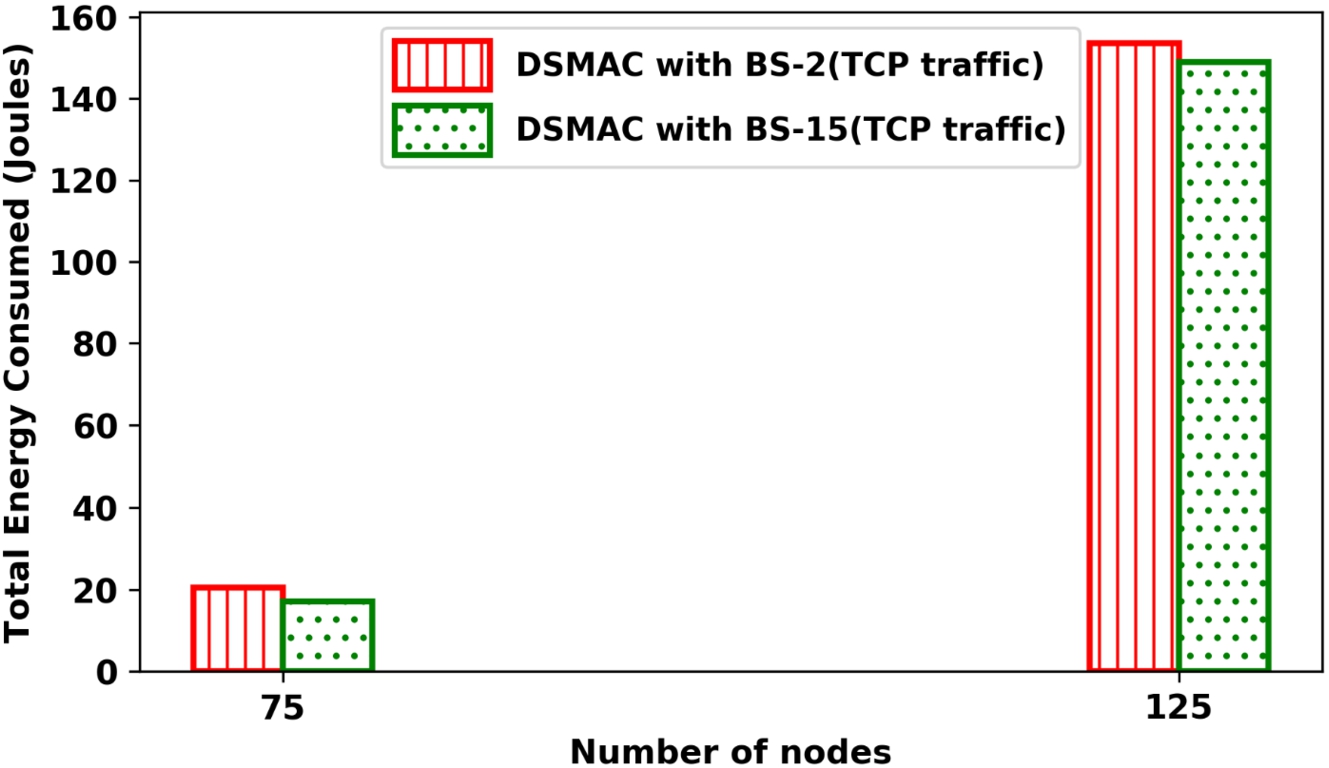
Total energy consumption in DS MAC-FRAME (TCP traffic) – scenario 3.
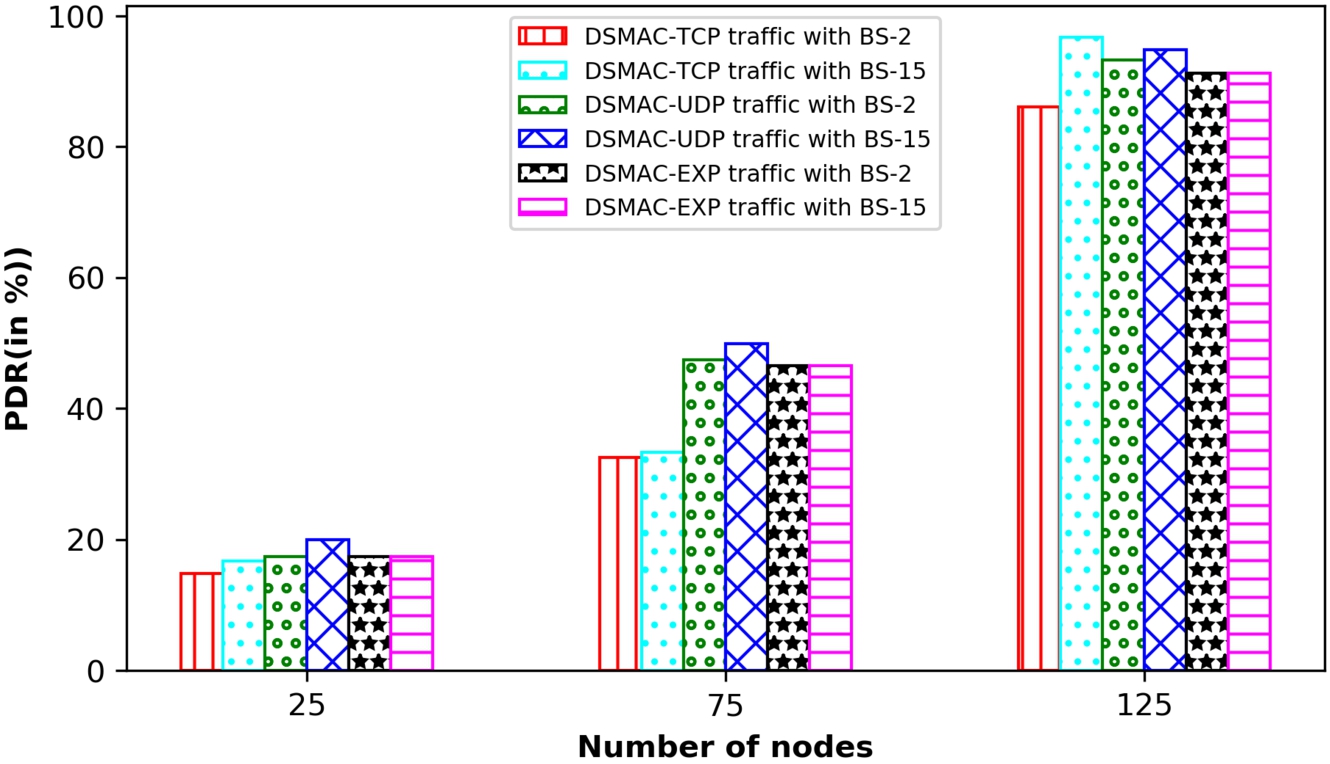
PDR in DS MAC-FRAME (TCP, UDP, EXP traffic) – scenario 3.
Figure 16 depicts that PDR (in %) of the network with 25 nodes, 75 nodes and 125 nodes are 14.8148, 32.5685, 86.0396 for TCP traffic, PDR (in %) is 17.3913, 47.4149, 93.2337 for UDP traffic, PDR (in %) is 17.3913, 46.5753, 91.2667 for EXP traffic in two base stations and PDR (in %) is 16.6667, 33.3333, 96.6884 for TCP traffic, PDR (in %) is 20, 49.8925, 94.7816 for UDP traffic, PDR (in %) is 20, 50, 95.5718 for EXP traffic in fifteen base stations scenarios respectively.
Figure 17 indicates that delay by 75 nodes and 125 nodes in a network are 0.00897891 μs, 0.0200423 μs respectively for TCP traffic in two base station scenarios for proposed DS-MAC whereas 0.00894762 μs, 0.0198342 μs respectively for TCP traffic in five base stations scenario for the same DS-MAC. PDR increases and delay decreases in DS-MAC when number of relay nodes are increased. Figure 13 shows that goodput with 75 nodes and 125 nodes in a network are 45.7776 × 10⁴ bps, 11.1347 × 10⁴ bps respectively for TCP traffic in five base station scenarios for proposed DS-MAC whereas 46.2125 × 10⁴ bps, 20.9230 × 10⁴ bps respectively for TCP traffic in ten base stations scenario for the same DS-MAC. Goodput increases in DS-MAC when relay nodes are increased from 5 to 10.
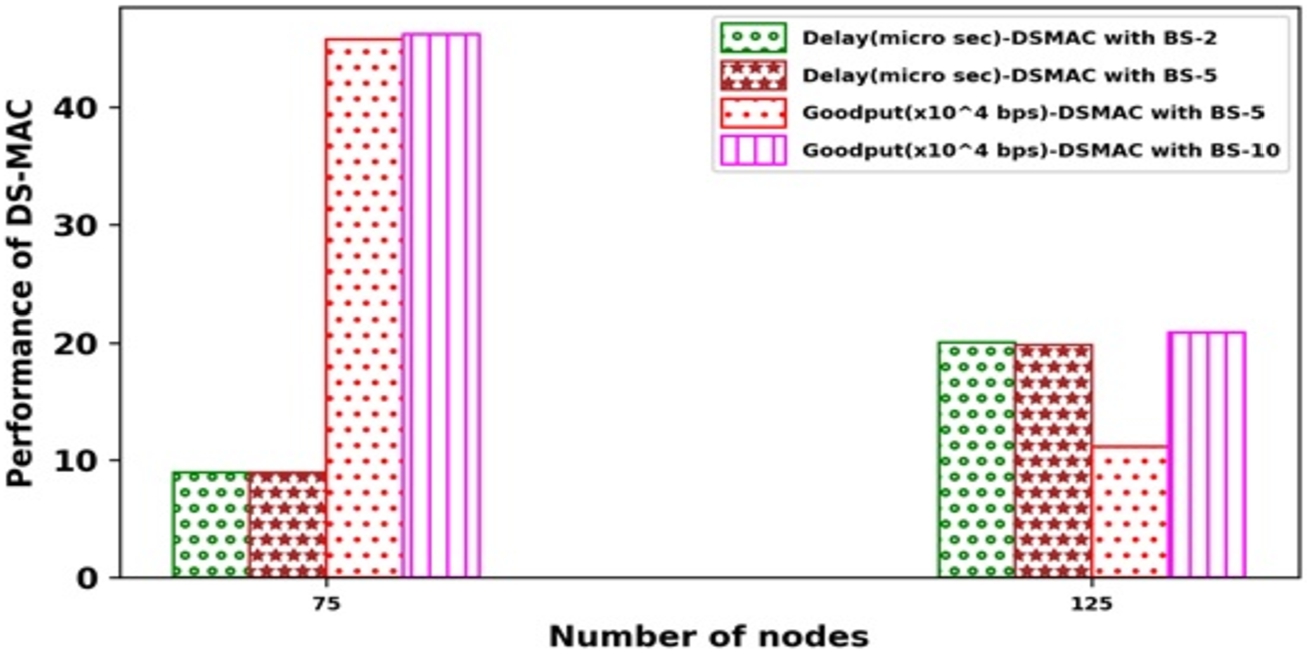
Delay, goodput in DS MAC-FRAME (TCP traffic) – scenario 3.
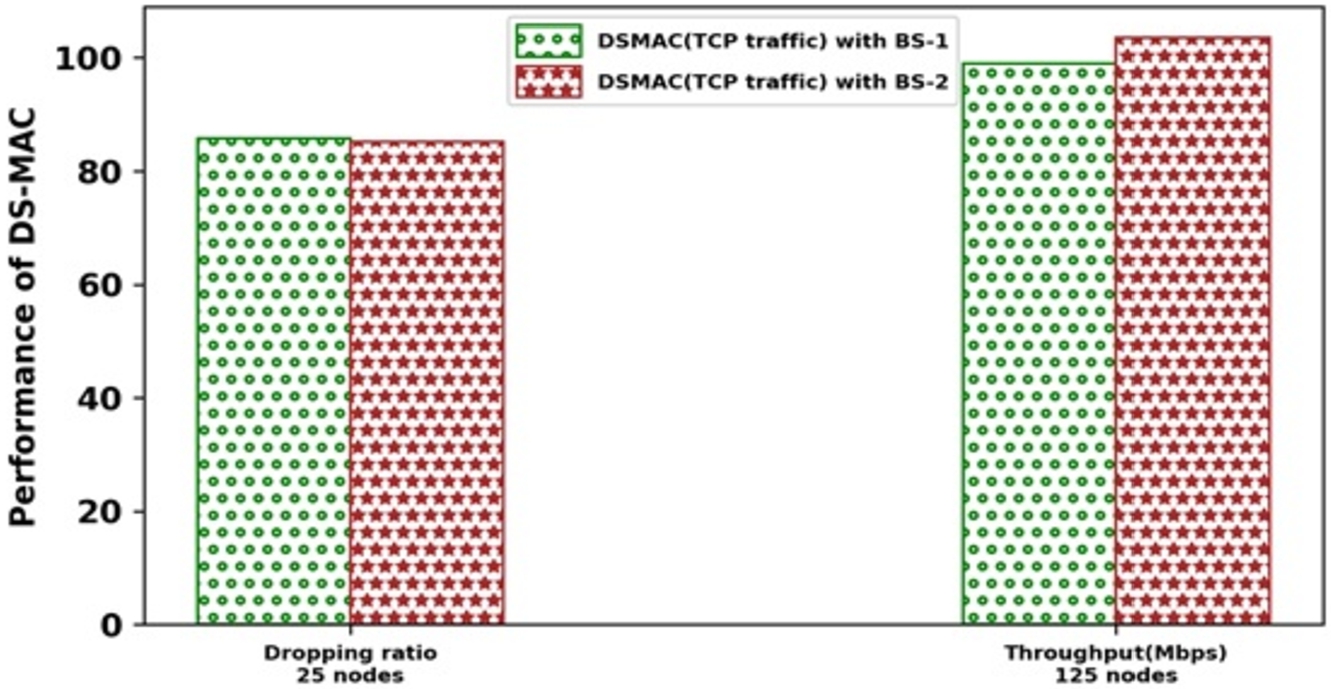
Dropping ratio, throughput in DS MAC-FRAME (TCP traffic) – scenario 3.
Figure 18 exhibits Throughput of the network with 25 nodes and 125 nodes are 3.29558 Mbps, 98.9862 Mbps for TCP traffic in single base station and 3.30219 Mbps, 103.582 Mbps for TCP traffic in two base station scenarios respectively in proposed DS-MAC. Figure 14 presents dropping ratio of the network with 25 nodes and 125 nodes are 85.7143, 67.7096 for TCP traffic in single base station and dropping ratio is 85.1852, 67.4315 for TCP traffic in two base station scenarios respectively in proposed DS-MAC. Throughput increases and dropping ratio decreases in DS-MAC. Performance is better as the number of relay nodes increase, the more optimal path to transmit packets to sink node is achieved.
Figure 19 depicts that total energy consumed by 25 nodes in a 200 × 200 terrain network are 6.64487 J in five base station scenarios whereas 2.99293 J in fifteen base stations scenario for proposed DS-MAC.
Figure 19 shows that in 800 × 800 terrain, total energy consumed by 125 nodes are 26.4648 J in five base stations and total energy consumed by 125 nodes is 26.3397 J in fifteen base stations scenario respectively. Relay nodes at optimal distance between the nodes in the path towards destination reduces the energy consumption in DS-MAC.
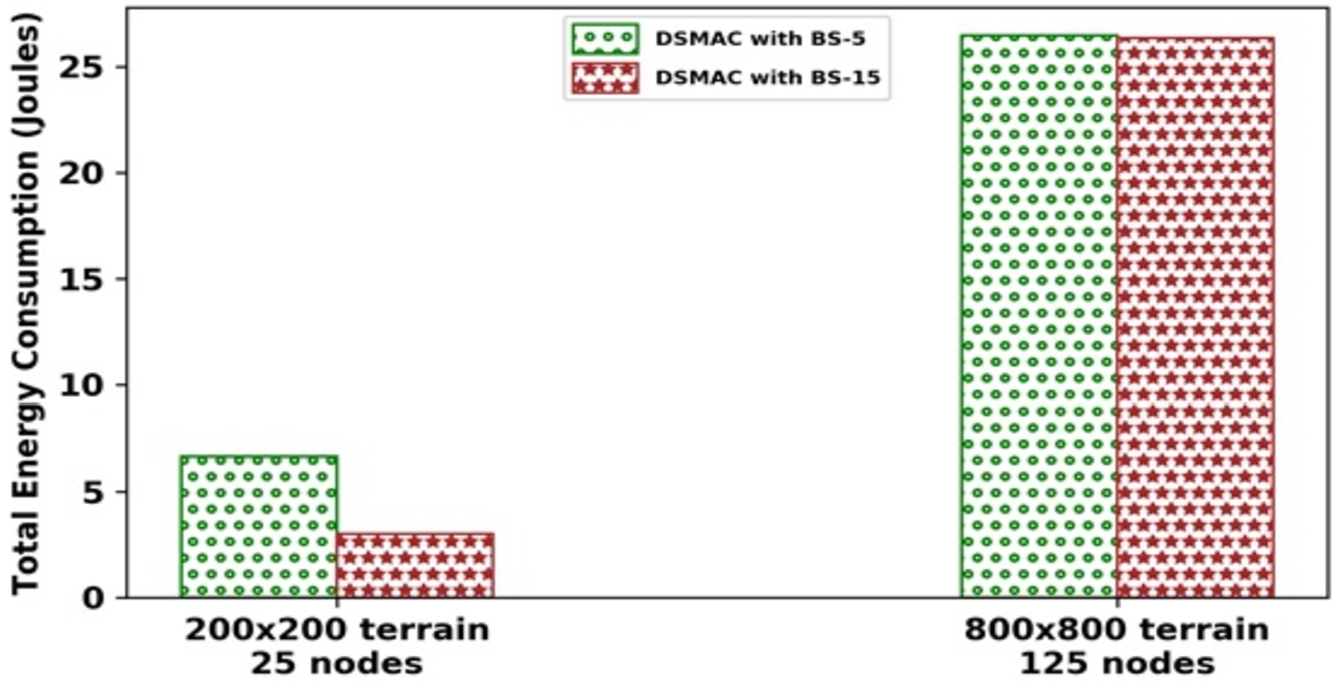
Total energy consumption in DS MAC-FRAME with 5 BS and 15 BS – scenario 4.
Figure 20 shows that in a 200 × 200 terrain, PDR (in %) of the network with 25 nodes and 75 nodes are 85.2735, 96.98 in two base stations, PDR (in %) is 97.0968, 97.8507 in five base stations and PDR (in %) is 100, 98.0315 in fifteen base station scenarios respectively in proposed DS-MAC. Figure 20 pictures 800 × 800 terrain, PDR (in %) of the network with 25 nodes and 125 nodes are 13.0435, 15.1318 in two base stations, PDR (in %) is 15, 16.1137 in five base stations and PDR (in %) is 20, 15.009 in fifteen base station scenarios respectively in proposed DS-MAC.
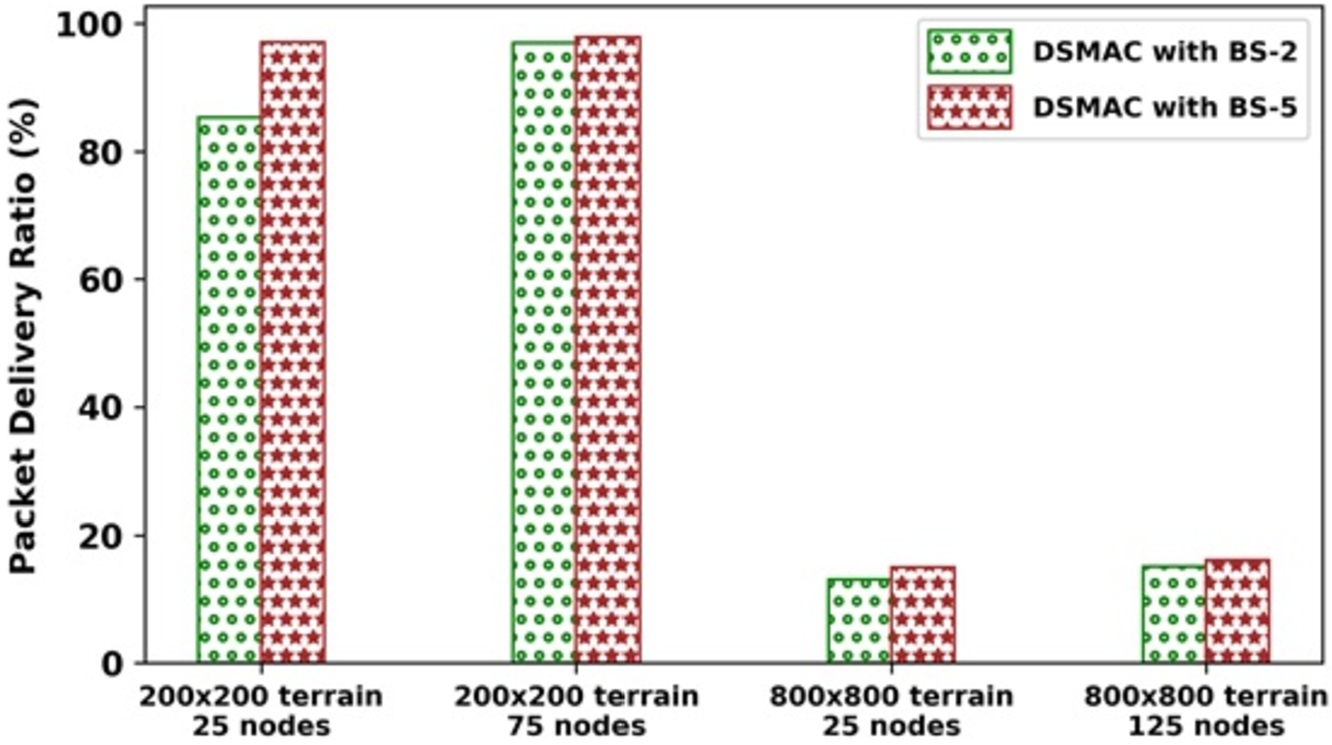
PDR in DS MAC-FRAME with 2 BS, 5 BS, 15 BS – scenario 4.
Figure 21 shows that in 200 × 200 terrain, throughput by 125 nodes is 85667.5 Kbps in ten base stations, throughput is 87406.7 Kbps in fifteen base stations scenario and in 800 × 800 terrain,throughput by 125 nodes is 12907.2 Kbps in ten base stations, throughput is 15566 Kbps in ten base stations scenario respectively. Performance improvement is observed in terms of PDR, throughput by using relay nodes along with game theory in DS-MAC.
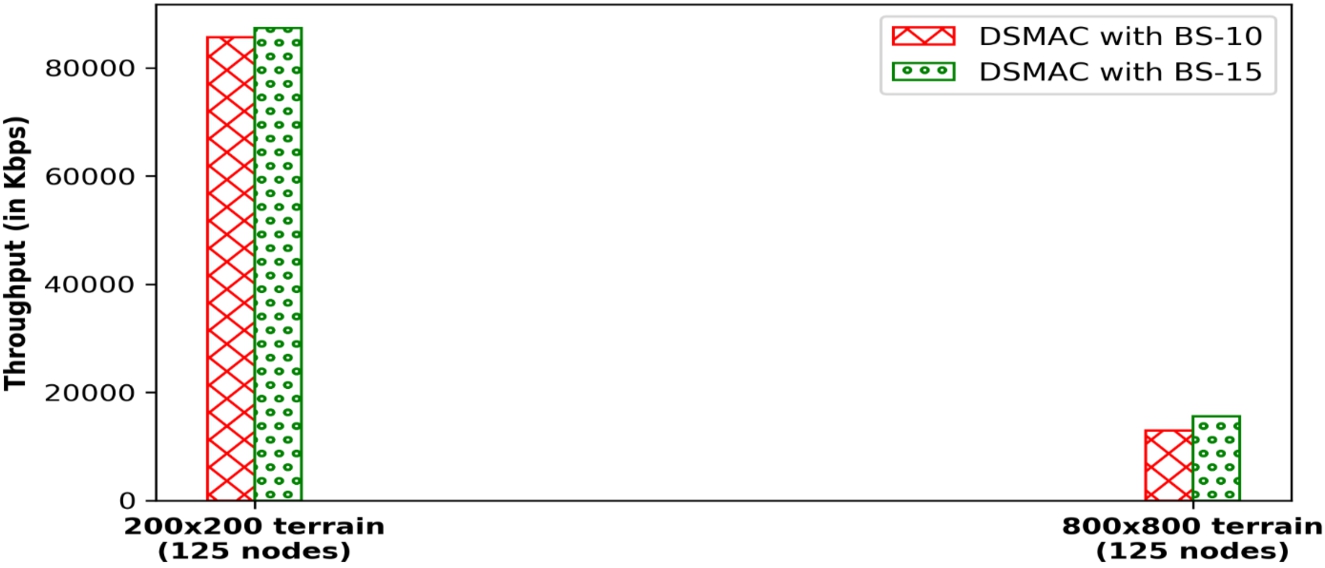
Throughput in DS MAC-FRAME with 10 BS and 15 BS – scenario 4.
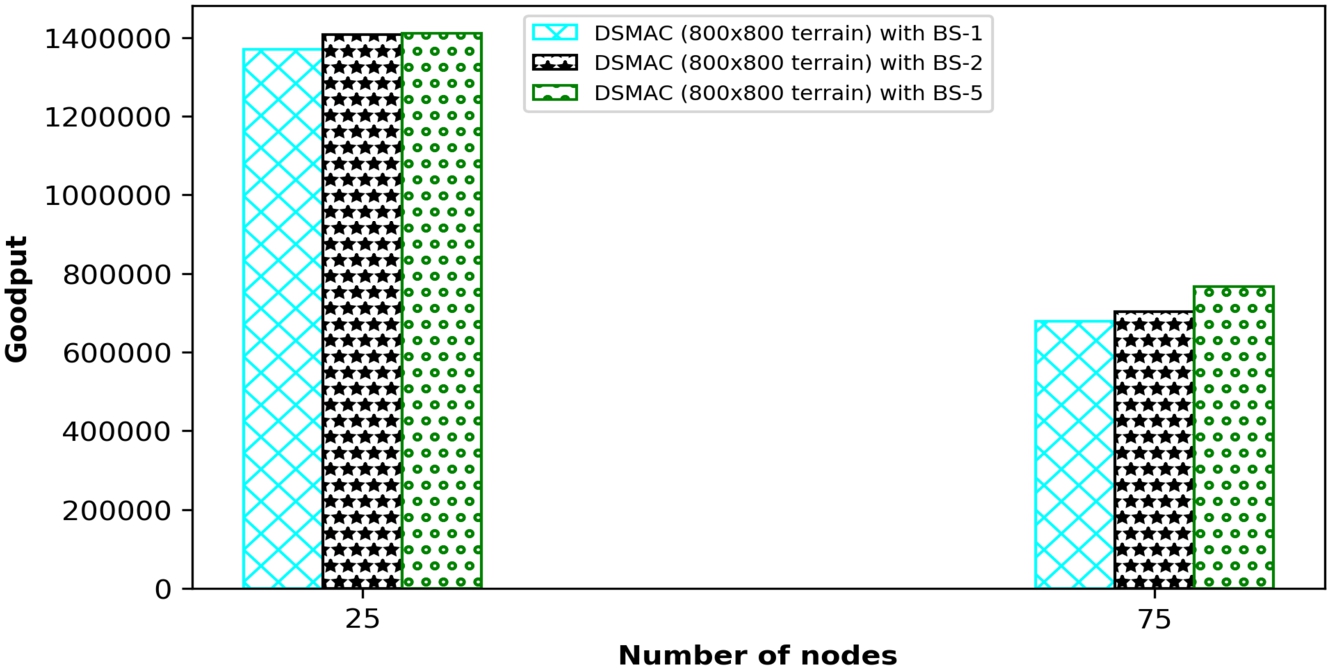
Goodput in DS MAC-FRAME with 1 BS, 2 BS and 5 BS – scenario 4.
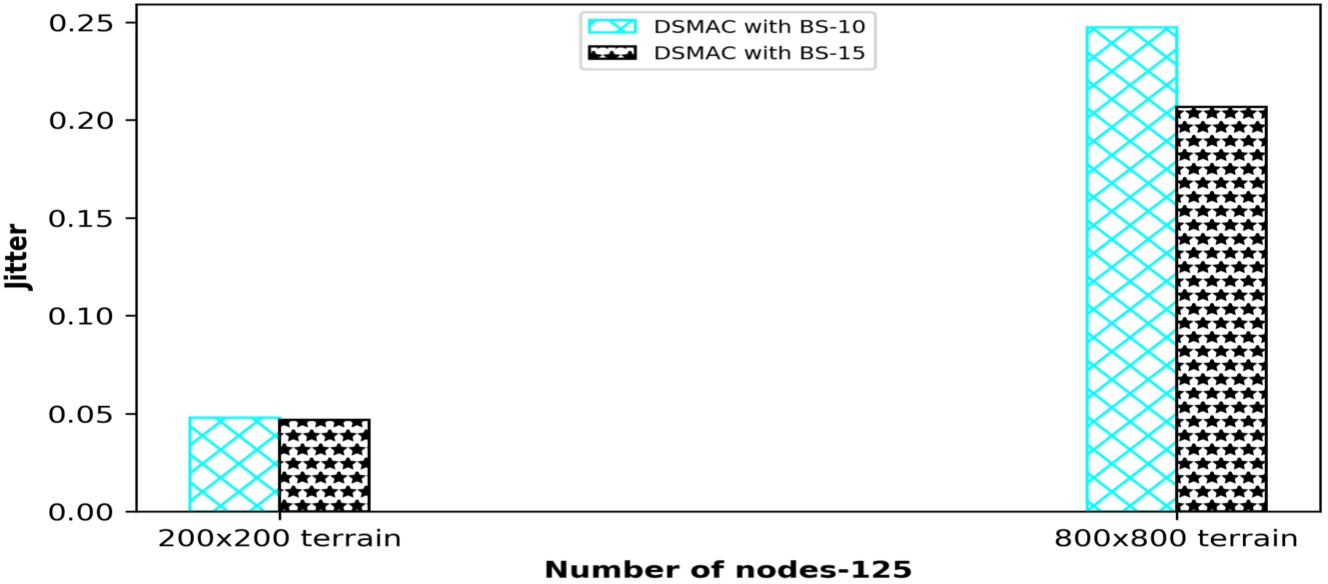
Jitter in DS MAC-FRAME with 10 BS and 15 BS – scenario 4.
Figure 22 presents 800 × 800 terrain, goodput of the network with 25 nodes and 75 nodes are 1.37031e+06 bps, 678927 bps in single base station and goodput is 1.40741e+06 bps, 702490 bps in two base station and 1.41054e+06 bps, 767204 bps in five base station scenarios respectively in proposed DS-MAC. Relay nodes support long distance transmission compared to sensor nodes. Large terrain with same number of nodes deployed as in small terrain leads to nodes placed at distant from each other. Hence, throughput is less in large terrain compared to small terrain. However, increasing number of relay nodes give better performance than DS-MAC without relay nodes in terms of higher goodput.
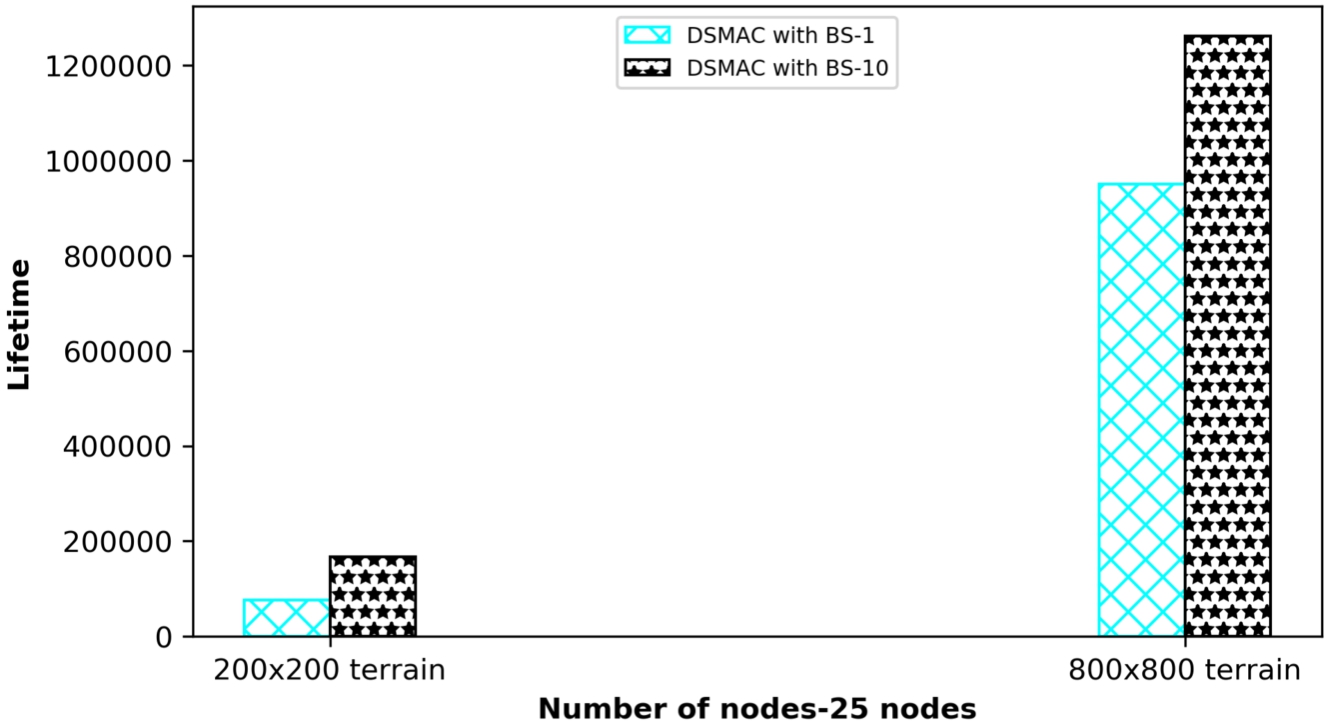
Lifetime in DS MAC-FRAME with 1 BS, 10 BS – scenario 4.
Figure 23 presents 200 × 200 terrain with 125 nodes, jitter is 0.0478323 s in ten base station scenarios for proposed DS-MAC whereas jitter is 0.0468803 s in fifteen base stations scenario for the same DS-MAC. And in 800 × 800 terrain with 125 nodes, jitter is 0.247273 s in ten base station scenarios for proposed DS-MAC whereas jitter is 0.206552 s in fifteen base stations scenario for the same DS-MAC. Relay nodes reduces congestion in DS-MAC by maintaining the connectivity between the nodes in the path towards destination. Reduction in congestion helps in reduction in jitter in the network. Figure 24 shows that in 200 × 200 terrain with 25 nodes, lifetime is 75685.9 ms, 95796 ms in single, ten base stations and in 800 × 800 terrain, lifetime is 951232 ms, 1.26147e+06 ms in single, ten base station scenarios respectively in proposed DS-MAC.
Lifetime increases and the number of packets dropped decreases in DS-MAC with relay nodes compared to without relay nodes. This is due to larger transmission range ‘R’ for relay nodes compared to ‘r’ for sensor nodes and helps in packet transmission by giving an optimal path to sink.
Figure 25 exhibits total energy consumed by 100 nodes at a speed of 0.3 m/s and 0.5 m/s in a network are 91.167 J, 53.6761 J respectively in single base station scenario for proposed DS-MAC whereas total energy consumed is 89.428 J, 51.5026 J respectively in two base stations scenario for the same DS-MAC. Relay nodes selected by single tier algorithm and its movement helps in variation in the distance between nodes in the path towards destination and support in reducing energy in DS-MAC. Figure 25 presents delay of the network with 100 nodes at a speed of 0.3 m/s and 0.5 m/s are 12.2055 μs, 8.10024 μs in two base station and delay is 11.1234 μs at 0.3 m/s speed, 7.3869 μs at 0.5 m/s speed in five base station scenarios respectively. As the relay nodes keep moving, it varies the distance between nodes and helps in effective transmission by decreasing delay in the network.
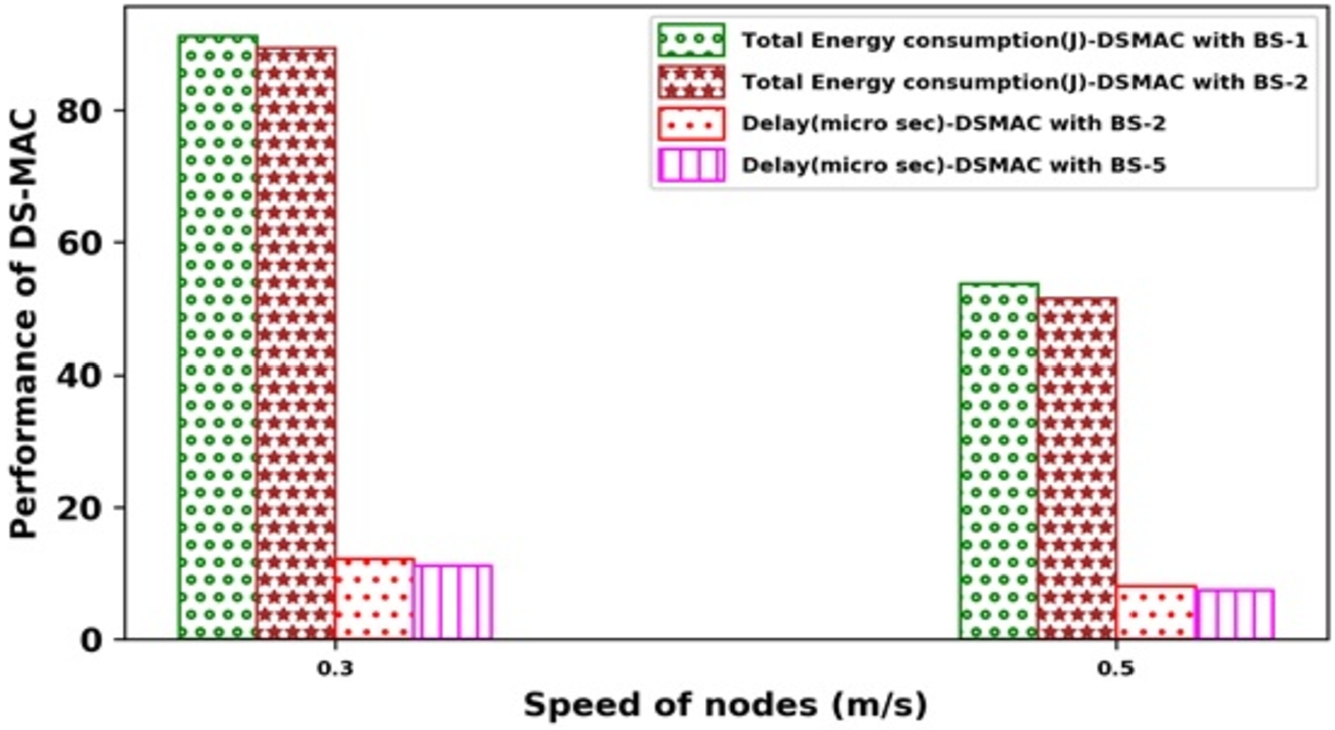
Total energy consumption, delay in DS MAC-FRAME with 1 BS, 2 BS, 5 BS-scenario 5.
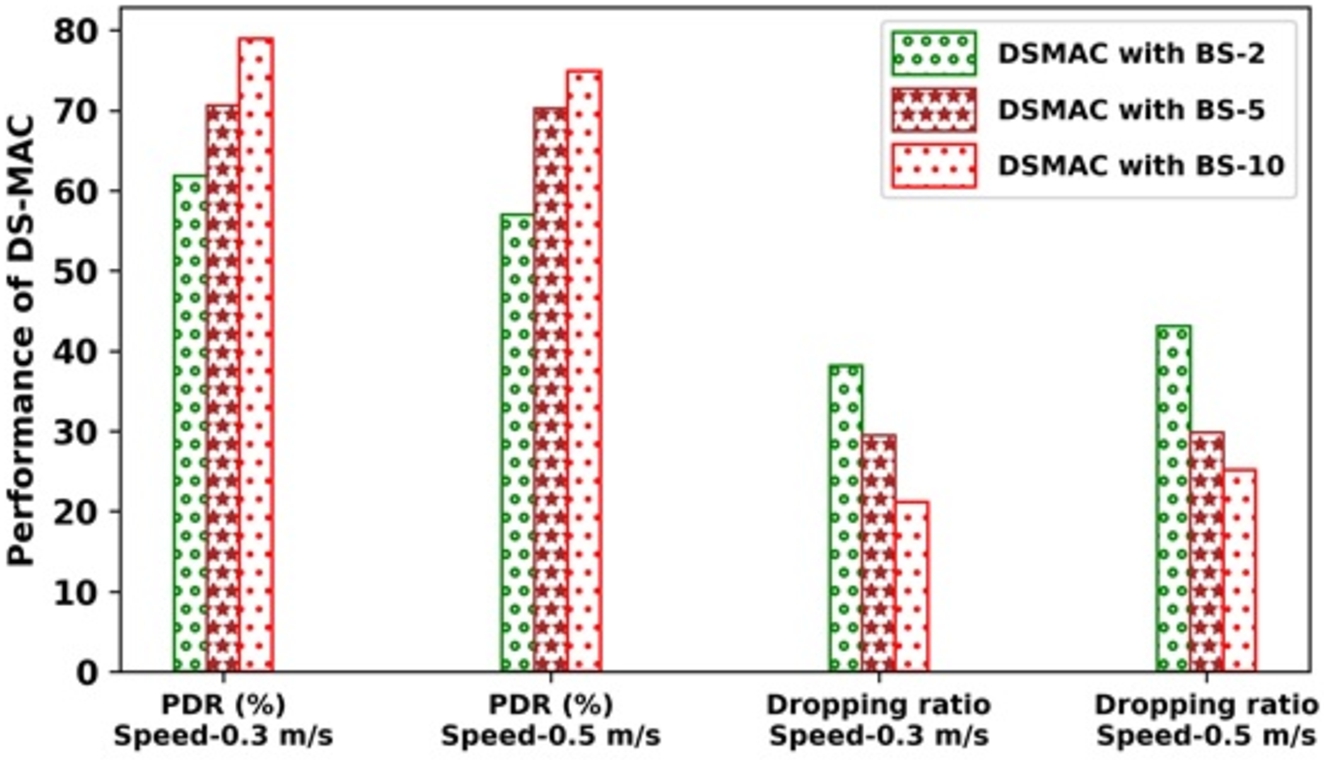
PDR, dropping ratio in DS MAC-FRAME with 2 BS, 5 BS, 10 BS – scenario 5.
Figure 26 indicates PDR (in %) by 100 nodes at a speed of 0.3 m/s and 0.5 m/s in a network with 100 nodes are 61.8355, 56.9486 in two base stations and PDR (in %) is 70.57, 70.2071 in five base stations and 78.8871, 74.8685 in ten base stations scenario respectively. Figure 22 shows that dropping ratio of the network with 100 nodes at a speed of 0.3 m/s and 0.5 m/s are 38.1645, 43.0514 in two base stations, dropping ratio at a speed of 0.3 m/s and 0.5 m/s are 29.43, 29.7929 in five base stations and dropping ratio at a speed of 0.3 m/s and 0.5 m/s are 21.1129, 25.1315 in ten base stations scenario. PDR is increased and dropping ratio is reduced in DS-MAC as number of relay nodes are increased.
Figure 27 depicts throughput of the network with 100 nodes at a speed of 0.3 m/s and 0.5 m/s are 59.1565 Mbps, 54.7623 Mbps in two base stations scenario, throughput at a speed of 0.3 m/s and 0.5 m/s are 66.3027 Mbps, 66.0994 Mbps in five base stations scenario.
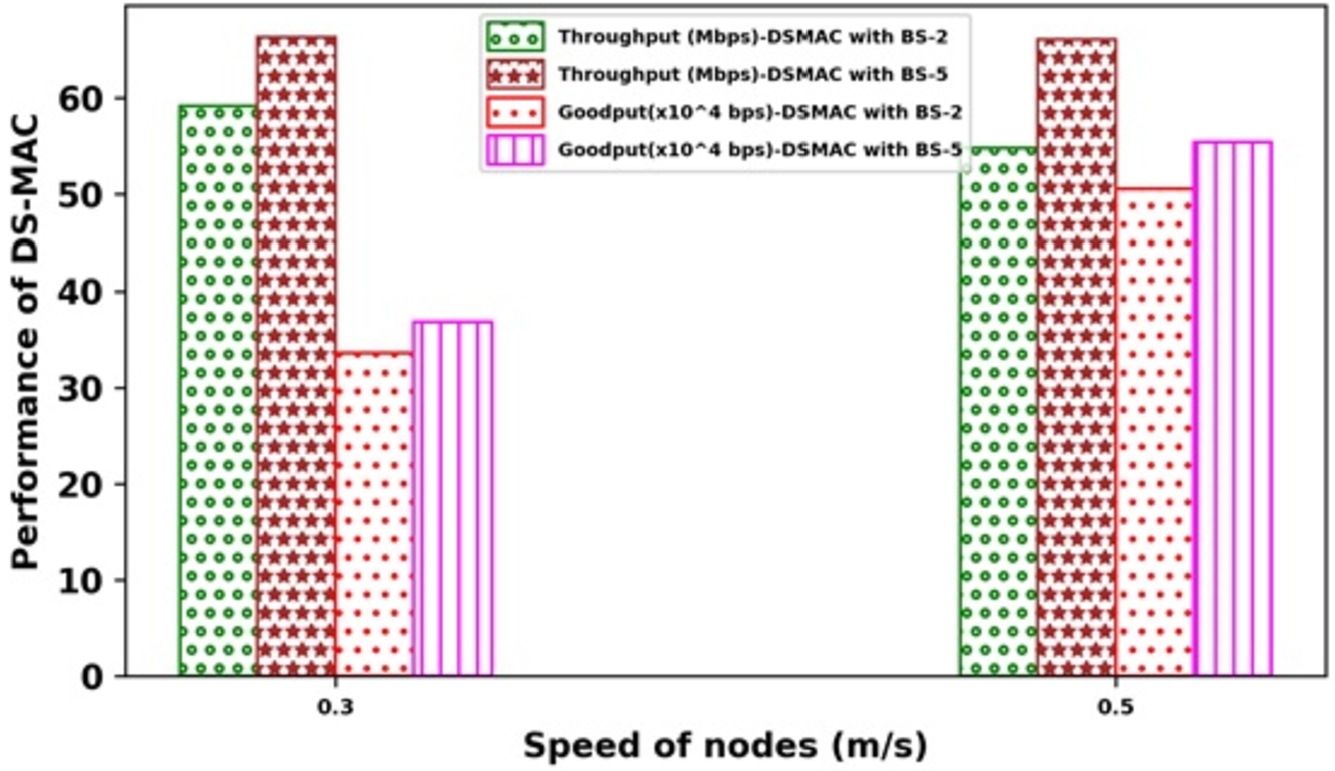
Throughput, goodput in DS MAC-FRAME with 2BS, 5 BS – scenario 5.
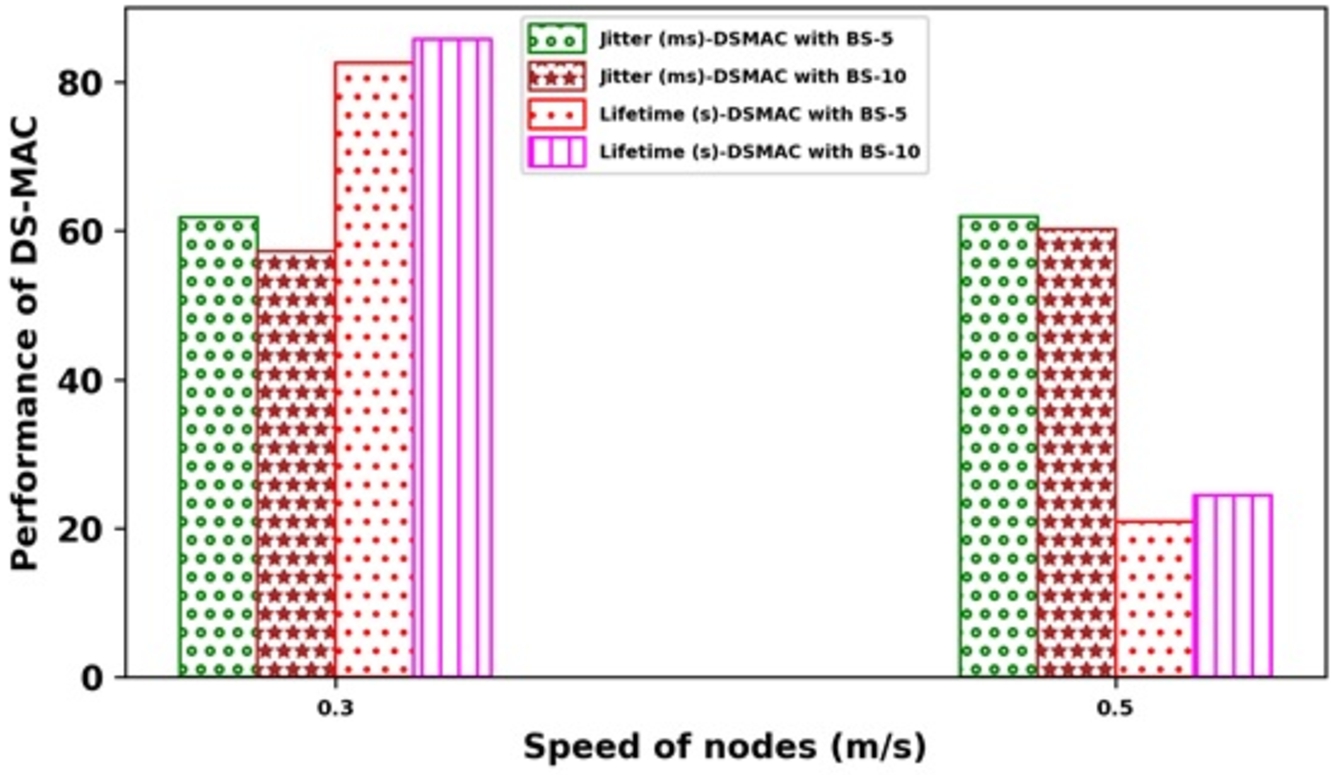
Jitter, lifetime in DS MAC-FRAME with 5 BS, 10 BS – scenario 5.
Figure 27 pictures the goodput by 100 nodes in a network at a speed of 0.3 m/s and 0.5 m/s are 33.5587 × 10⁴ bps, 50.5664 × 10⁴ bps respectively in two base stations scenario for proposed DS-MAC whereas goodput at a speed of 0.3 m/s and 0.5 m/s are 36.8234 × 10⁴ bps, 55.4495 × 10⁴ bps respectively in five base stations scenario for the same DS-MAC. Throughput and Goodput increases in DS-MAC when number of relays are increased. Figure 28 shows that jitter in a network with 100 nodes at a speed of 0.3 m/s and 0.5 m/s are 61.7937 ms, 61.9305 ms in five base stations scenario and jitter by 100 nodes at a speed of 0.3 m/s and 0.5 m/s are 57.2831 ms, 60.2491 ms in ten base stations scenario respectively. Figure 28 presents lifetime of the network with 100 nodes at a speed of 0.1 m/s and 0.3 m/s are 82.5701 s, 20.8395 s in five base station and lifetimes of 100 nodes at a speed of 0.1 m/s and 0.3 m/s are 85.7605 s, 24.4239 s in ten base station scenarios respectively in proposed DS-MAC. Jitter decreases, Lifetime increases when number of relays are increased in DS-MAC.
Increasing the speed of the nodes gives scope for nodes coming closer which makes transmitting packets to neighbor nodes in an easier way. More number of neighbors come within the transmission range of sensor nodes and relay nodes; hence it reduces node energy consumption, jitter and increases throughput, goodput, PDR and network lifetime. Table 3 shows comparison with other works.
The simulation shows improvement in network lifetime and goodput in the proposed DS-MAC with varied number of relay nodes. Energy consumption and end-end delay are reduced by this single-tier relay node placement algorithm. Hence, the effect of single and multiple relays in the network are analyzed in this paper.
Comparison with other works
In this chapter, the impact of distributed MAC with optimal number of base stations is analyzed to improve its energy consumption, network lifetime. Single-tier optimal selection of relay nodes is introduced; so that the relays can change their transmission range adaptively was formulated. Simulation shows improvement in network lifetime, goodput in the proposed DS-MAC with varied number of relay nodes. Energy consumption and end-end delay are reduced by this single-tier relay node placement algorithm. By increasing the number of relay nodes in DS-MAC, improvement in packets dropping ratio and PDR are obtained. Network lifetime improves by 1.17%, dropping ratio decreases by 35.46% in static environment with relays in DS-MAC. Jitter is decreased by 4.79% in dynamic environment with relays. Throughput is increased by 5.06% in dynamic environment when relays. PDR increases by 1.19% in static environment and increases by 15.67% in dynamic environment when relays. Energy consumption reduces by 1.16% when relays are used in DS-MAC.
Other cooperative and non-cooperative games can be tried for MAC protocols. PSO, ABC, genetic algorithm are few other optimization techniques that can be used to analyze the proposed DS-MAC. Star, mesh, grid topologies and their performances with DS-MAC can be analyzed in future.
Conflict of interest
The authors have no conflict of interest to report.