
Abstract
Structural magnetic resonance imaging (MRI) is a powerful tool to visualize 3D neuroanatomy and assess pathology and disease progression in neurodegenerative disorders such as Huntington’s disease (HD). The development of mouse models of HD that reproduce many of the psychiatric, motor and cognitive impairments observed in human HD has improved our understanding of the disease and provided opportunities for testing novel therapies. Similar to the clinical scenario, MRI of mouse models of HD demonstrates onset and progression of brain pathology. Here, we provided an overview of the articles that used structural MRI in mouse models of HD to date, highlighting the differences between studies and models and describing gaps in the current state of knowledge and recommendations for future studies.
INTRODUCTION
Huntington’s disease (HD) is a neurodegenerative disorder with a known genetic cause. 1 It is autosomal dominant and caused by a CAG repeat expansion in the huntingtin gene (HTT). A CAG repeat length greater than 39 results in full penetrance of the disease and the CAG repeat length is positively correlated with disease severity. 2 HD is characterized by psychiatric disturbances, motor and cognitive impairments and premature death. While clinical diagnosis involves cognitive and motor symptoms and confirmatory genetic testing, structural magnetic resonance imaging (MRI) is often used as a biomarker of disease and to establish disease progression. 3 MRI may also serve as a marker of treatment efficacy. 4 Large human observational studies using structural MRI have revealed that striatal volume loss occurs early in HD (more than 15 years before motor symptoms present),5–8 with other brain structures, such as the cortex, hippocampus and thalamus, impacted later in disease.9–12 Clinical findings with respect to white matter volume in HD are more varied but have shown it is also impacted early in disease progression,6,13, 6,13 with the largest changes in the frontal lobe. 8 The rate of brain volume loss has been associated with CAG repeat length.14,15, 14,15 At the time of clinical diagnosis, MRI typically reveals large volume loss in the striatum compared to controls (30–52% loss of the caudate, 33–69% loss of the putamen and 37% loss of the nucleus accumbens).16–18 Preclinical animal models play an important role in studying neurodegenerative diseases like HD. The use of experimental mice allows for genetic manipulation of the HTT gene and invasive experimental assays (e.g., histology, immunohistochemistry), improving our understanding of the mechanisms of HD and providing an avenue to test therapies and potential treatments. Imaging technologies used to study experimental mice are the same as those used clinically. Preclinical MRI systems at high magnetic field strength are often used to study the whole mouse brain as they provide high spatial resolution and good tissue contrast. 19 The high anatomical reproducibility of mouse age-matched wild type brains (∼5%) means that small differences in brain structure can be detected in mouse models of disease. 20 The majority of mouse models with a motor or cognitive deficit suggestive of a neurological disease have been shown to have abnormal brain anatomy using MRI 21 and the non-destructive nature of MRI means it can be paired with behavioral testing and biochemical markers post-imaging.
This review intends to provide an overview of the structural brain MRI findings from mouse models of HD. The search for this review was conducted using PubMed and Web of Science databases up to May 2024 using the following search terms: “Huntington”, and “Mouse”, and “MRI”, or “Magnetic Resonance Imaging”. Full-length English language peer reviewed, or preprint studies that use structural MRI to study a mouse model of HD were included. Those not using a mouse model of HD (n = 15), missing an untreated (e.g., no oral gavage or injections) control group (n = 19), or not using structural T1-weighted or T2-weighted anatomical brain MRI (n = 32) were excluded.
PRECLINICAL MRI
MRI measures signal emitted from hydrogen atoms (mostly water and fat) after application of a radio-frequency pulse. Spatial localization is achieved using varying magnetic gradients and image contrast depends on the density of hydrogen atoms and the local tissue microenvironment. 22 MRI is often used to study the brain because it is non-invasive and provides excellent contrast between different brain structures. Preclinical MRI of mouse brains has become a powerful tool in biomedical research; however, compared to clinical human MR imaging, the smaller size of the mice presents a challenge. This is addressed with the use of stronger gradients, closer fitting imaging coils, longer scan times and higher magnetic field strengths. An increase in magnetic field strength (measured in Tesla (T)) results in an increase in the signal sensitivity (increased signal-to-noise ratio), allowing for increased image resolution and image fidelity that can be used to detect subtle differences in tissue and physical structure. Imaging at ultrahigh magnetic fields (e.g., 16.4 T) can suffer from susceptibility imaging artifacts (e.g., from the iron in blood and at air-tissue interfaces) and was only used for ex vivo imaging in the articles described in this review.
Structural MRI provides information about brain volume on the macroscopic and mesoscopic level. This review excluded studies of brain microstructure that can be imaged in HD mice using MRI approaches such as diffusion tensor imaging.23–25 All of the structural MRI articles included in this review used anatomical T2-weighted MRI, an imaging method that provides the optimal image contrast between grey matter, white matter and cerebrospinal fluid based on differences in T2 relaxation times. This high image contrast enables delineation of anatomical brain structures. Structure volumes (in mm3) can be measured in the brain using manual volumetry, where trained neuroanatomists segment/define specific regions of interest in the brain, or using automated image analysis algorithms that can segment the whole brain into different anatomic regions.
Structural MRI is only one of many techniques used to study and monitor HD clinically. For more information on other MR imaging approaches to study mouse models of HD, we recommend a recent review article. 26 While outside of the scope of this review, it is important to note that several of the 37 articles that met our inclusion criteria also included additional MRI techniques to study other aspects of HD pathology. These included magnetic resonance spectroscopy to measure brain metabolites,27–31 T2 relaxivity to measure tissue composition,32–35 diffusion tensor imaging to measure white matter tracts,31,36,37, 31,36,37 functional MRI (fMRI) to measure cerebral blood flow,38,39, 38,39 magnetic resonance angiography to visualize vasculature and measure cerebral blood volume, 40 resting state fMRI to measure brain connectivity, 41 quantitative magnetization transfer for myelin imaging 37 and dynamic contrast enhanced MRI to measure blood-brain barrier permeability.39,40, 39,40
MOUSE MODELS OF HD
There are over 20 different mouse models of HD used in scientific research, with the decision to use a particular model dependent on which aspect of HD you want to model (motor, cognitive, or psychiatric disturbances). 42 The models vary in terms of how they are engineered, the CAG repeat length, and the severity of disease onset/progression. Models can be grouped into 3 categories: N-terminal transgenic, full-length transgenic and full-length knock-in models. 43 N-terminal transgenic animals carry a portion including the CAG repeat region of the 5′ end of the human HTT gene, full-length transgenic models carry the full HTT artificial gene in a yeast or bacterial chromosome, and full-length knock-in models involve the introduction of CAG repeats directly to the mouse Htt gene (Hdh) via recombination. The most studied HD mouse model is the R6/2, an early onset N-terminal transgenic model that has significant striatal atrophy and a shortened lifespan that depends on the CAG repeat length. 44 MRI has been used to study each of the three types of model. The search conducted for this review identified 37 articles from 10 different models of HD that met the inclusion criteria (3 articles include the study of more than one mouse model).
PRECLINICAL STRUCTURAL MRI OF HD MOUSE MODELS
Table 1 summarizes the 37 articles that used structural MRI to study mouse models of HD, including MRI acquisition parameters, data analysis techniques, neuroanatomical changes and correlations between structural MRI and behavioral symptoms or histopathology. The MRI studies aimed to (i) determine differences in brain structure in HD mice compared to controls and/or (ii) track changes in HD neuroanatomy over time. Comparisons between groups were performed using a single imaging time point or multiple time points. There are tradeoffs between in vivo and ex vivo imaging. 20 In vivo imaging provides more physiologically relevant experimental conditions and the ability to perform a longitudinal study, while ex vivo imaging allows for higher image resolution, elimination of motion artifacts, and the use of non-physiological MR contrast agents. As demonstrated in Zhang et al., it should be noted that there are overall reductions in the total brain volume, irrespective of genotype, after perfusion fixation for ex vivo imaging. 45 Of the studies that used a single imaging time point, eight were in vivo and six used an ex vivo experimental design. To investigate the changes in brain structure over time, the study design can be cross sectional or longitudinal. In vivo, longitudinal study designs allow for measurements within the same animal, decreasing the required sample size, while sacrificing the higher image resolution that is possible with an ex vivo, cross sectional study. The majority of the MRI articles (21/37, 57%) used in vivo, longitudinal MRI to follow the changes in neuroanatomy over the time course of disease. Three of these studies also included an ex vivo time point at the end of the longitudinal study, to explore whether higher resolution images revealed any additional neuroanatomical changes. The number of study time points varied significantly from two (e.g., pre-symptomatic to post-symptomatic) up to seven time points. This included seven time points closely spaced to carefully characterize early brain development in the R6/2 mouse model (3–12 weeks of age)45,46, 45,46 and seven time points that covered the lifespan of the HdhQ150 mouse model (8–94 weeks of age). 35 In all of the articles, the age of the imaging time points varied substantially, often reflecting the variable disease onset and severity of disease progression in the different mouse models. For example, the imaging time point of 12 weeks of age is pre-symptomatic for the zQ175 and HdhQ250 mouse models and post-symptomatic for the YAC128 and R6/2 mouse models.
Structural MRI study specifications and results for mouse models of HD
F, female; M, male; n, number of mice; NR, not reported; T, Tesla; T2w, T2-weighted. aincludes in vivo/ex vivo, image contrast (T1/T2), longitudinal/cross-sectional, magnetic field strength, image resolution (mm3 if 3D isotropic, mm2 if 2D with slice thickness).
Image analysis varied between articles with 19/37 (51%) using manual segmentation of brain structures known to be impacted in human cases of HD (e.g., striatum, cortex, hippocampus). Manual segmentation is time-intensive and limits the number of structures that can be studied. In contrast to using user-defined regions of interest, three morphometry algorithms were used to analyze the brain structures: deformation based morphometry (DBM) (11/37 studies), voxel based morphometry (VBM) (4/37 studies) and tensor based morphometry (TBM) (3/37 studies).47,48, 47,48 These automated algorithms provide unbiased, full brain coverage and can be used to determine focal differences in brain structure (voxel-wise) or used in combination with a segmented anatomical atlas to determine structure volume differences. Both absolute volumes and relative volumes (normalized to total brain volume to account for variance caused by overall differences in brain volume) were studied.
STRUCTURAL VOLUME CHANGES IN HD MOUSE BRAINS
Figure 1 summarizes the changes in brain structure reported for the 10 different mouse models and the most commonly studied mouse model, the R6/2.
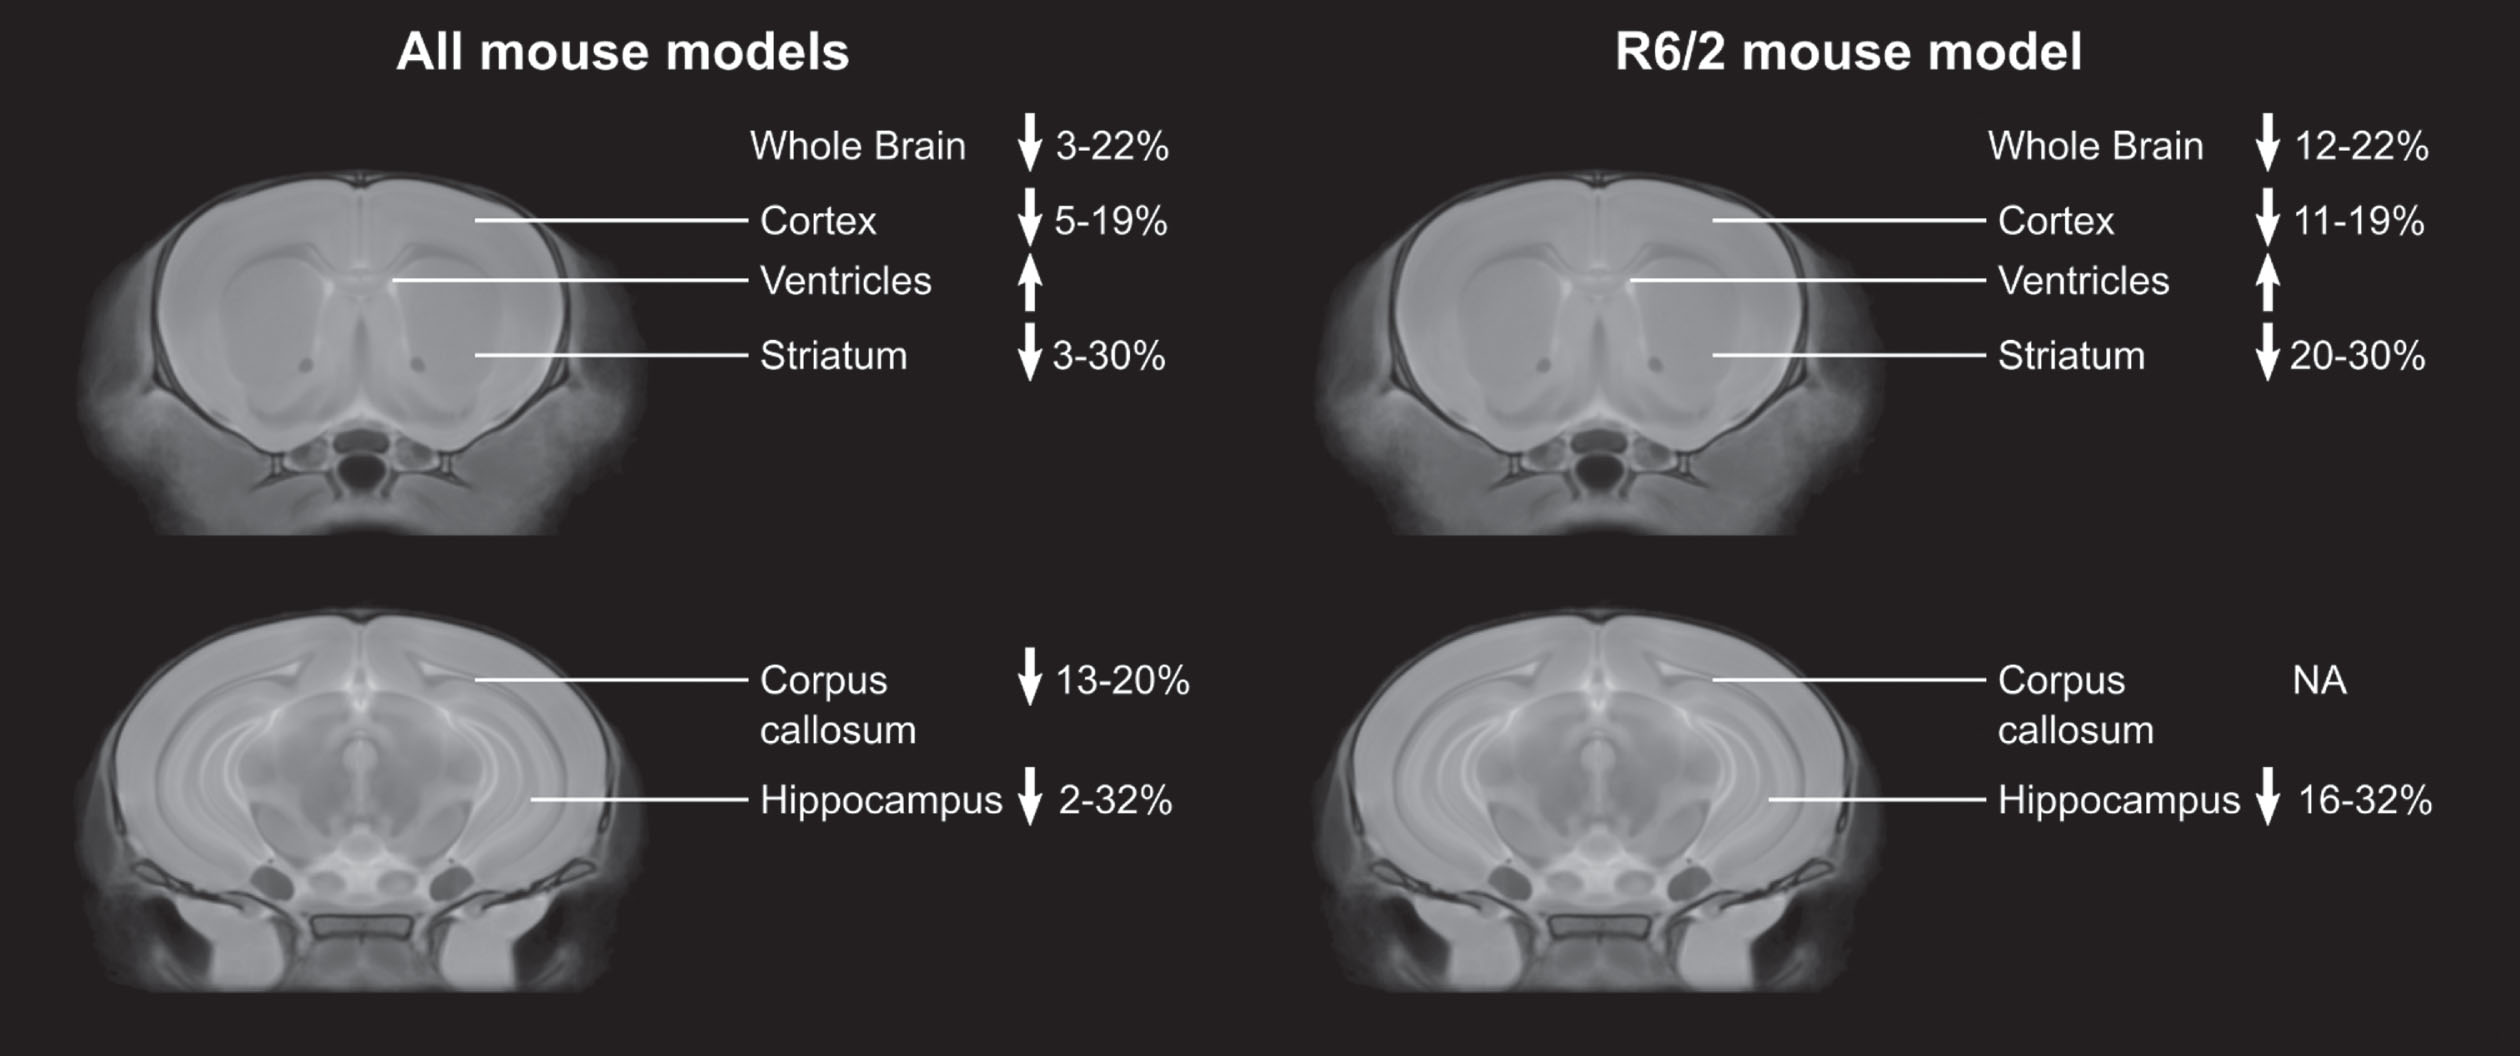
Percent changes in brain regions compared to controls across studies in all mouse models, and in only the R6/2 mouse model. Only data from articles that provided percent differences or the absolute structure volumes was included.
Striatum
Volumetric changes in the striatum of the human brain are a hallmark of HD onset and progression. 69 Structural MRI revealed absolute volume decreases in the striatum in all of the mouse models of HD. These losses ranged from 3–30% across the different models, with the R6/2 mouse model showing the largest decrease compared to controls. 45 Although all of the studies reported decreased striatum volume compared to controls, only 8 of the studies showed progressive striatal atrophy.28,31,35,40,45,46,57,59, 28,31,35,40,45,46,57,59 This progression is a human neuroanatomical phenotype of HD 70 and represents an advantage for these models towards clinical translation (YAC128, R6/2, N171-82Q, HdhQ150). In humans, the striatum often undergoes atrophy long before motor and cognitive symptoms occur.5–8 Most of the mouse studies that included an early imaging time point (before the appearance of overt behavioral phenotypes) did not find significant differences in striatum volume in the HD mice compared to controls.28,32,33,35,36,39,40,45,46,53,65, 28,32,33,35,36,39,40,45,46,53,65 With the shortened lifespan of mice compared to humans, this pre-symptomatic atrophy can be challenging to target in the more severe mouse models of HD (e.g., R6/2 mice). Consistent with human HD studies, a decrease in striatum volume was reported in pre-symptomatic N171-82Q 59 and HdhQ150 mice. 66 In male zQ175 mice, Zhang et al reported an increase in striatum volume at 3 weeks, that progressively decreased from 5 to 7 weeks of age. 61
In addition to investigating total striatum volume, Lerch et al. used striatal shape analysis and reported left-right asymmetry in the striatal atrophy. 51 Several studies using voxel-wise analysis found the volume decreases in the striatum were heterogeneous, with the dorsal, posterior and lateral parts of the striatum being the most affected.46,51,55, 46,51,55
One advantage of in vivo, longitudinal imaging is the ability to explore correlations between structure volume and behavioral outcomes to investigate the neuroanatomical basis of the behavior impairment. While 19 of the mouse MRI studies also included behavioral testing, only seven of the studies examined correlations with neuroanatomical changes. Four of these studies found positive correlations between striatum volume and motor performance (rotarod, locomotor activity in open field test, grip strength).35,45,46,59, 35,45,46,59
Cortex
In humans, a decrease in the cortex volume has been reported at different points during clinical presentation in HD. 71 Structural MRI revealed absolute volume decreases in the cortex in all of the mouse models of HD, ranging from 5–19%. Similar to the striatum, the largest changes were in the R6/2 mouse model. 39 When divided into subcortical regions, large changes were reported for the frontal accessory cortex (47.1%) and the cingulate cortex (34.0%) in R6/1 mice 36 and focal decreases were found in the somatosensory, piriform, motor, frontal, and parietal cortex.32,46,55–57, 32,46,55–57 Only one article reported increases in cortical regions, with focal increases in the primary sensorimotor and primary motor cortex in YAC128 mice. 51
Another way to analyze the cortex is by measuring the cortical thickness. Thinning of the cortex, with the sensorimotor cortex most impacted, has been demonstrated in humans with HD. 72 Three mouse MRI studies analyzed the cortical thickness and found it was impacted in HD mice; however, the direction of the effect was inconsistent. Thinning of the motor cortex was found in the HdhQ150 66 and the YAC128 mouse model at 48 weeks of age. 53 In contrast, Lerch et al. demonstrated increased cortical thickness at 32 weeks of age, with the largest difference in the sensorimotor cortex. 52 The difference between the YAC128 studies is that Lerch et al. 52 analyzed the entire cortical thickness while Carroll et al. 53 subdivided the cortex into layers I-V/VI, with the thinning observed only in layers II/III (superficial projection layer) and V/VI (deep projection layers) and a trend towards an increase in layer I. Interestingly, the increased mean cortical thickness at 32 weeks of age correlated to decreased striatal volume, suggesting a potential compensatory response to striatal degeneration.
Compared to the first evidence of striatal atrophy, the majority of mouse studies found the onset of cortical atrophy at a later age. However, two studies in the R6/2 mouse model reported significant decreases in the cortex volume before striatal atrophy was detected.33,46, 33,46 Five of the seven studies that explored relationships between neuroanatomy and behavioral changes reported correlations with the cortex volume. The HdhQ150 model exhibited deficits in grip strength which were correlated to the cortical volume decrease. 35 R6/2 and N171-82Q mice showed a correlation between cortex volume and rotarod performance and exploratory behavior.33,45,46,59, 33,45,46,59
Hippocampus
In addition to the striatum, the hippocampus is another subcortical region impacted by HD progression. 73 The hippocampus plays a key role in memory and learning, meaning hippocampal atrophy is directly associated with the cognitive impairments observed in HD. Volume changes in the hippocampus were not found in all of the HD mouse models. For example, the mouse MRI studies of the zQ175 and Ki140CAG mice showed sparing of the hippocampus volume. In the YAC128 mouse model, four of the five studies reported no change in the hippocampus volume compared to controls and Petrella et al. only found a small (2.1%) decrease from 12–48 weeks. 31 Moreover, they reported a negative correlation between striatum volume and hippocampus volume, suggesting this correlation reflects an adaptive mechanism. Those studies that did report changes in hippocampus volume ranged from 2–32%, with the largest change in the R6/2 mouse model. 45 This study found a positive correlation between hippocampus volume and rotarod performance.
Thalamus
MRI studies in humans with HD report decreased thalamus volume and associations between thalamic atrophy and cognitive impairments. 74 The majority of the mouse models reported focal and total volume decreases in the thalamus including the YAC128, 51 R6/2,28,46,55, 28,46,55 N171-82Q, 59 zQ17558,61, 58,61 and HdhQ150 mice.35,66, 35,66 Similar to the striatum volume, the thalamus volume was found to be increased at 3 weeks of age in male zQ175 HD mice and then decreased from 5 to 7 weeks of age. 61 Counterintuitively, a negative correlation between the relative volume change in the thalamus and rotarod performance was reported in the HdhQ150 mouse model. 66
Cerebellum
Despite the motor impairments associated with human HD, the cerebellum is believed to be spared. 75 The findings with respect to the impact of HD on the cerebellum volume in mouse models were heterogeneous. Cerebellum volume was reported to be increased,51,53,58,61, 51,53,58,61 decreased, 57 or unchanged.39,45,46,58,60,65,66, 39,45,46,58,60,65,66 In general, the YAC128 and zQ175 mice appear to have increased cerebellum volume, while the cerebellum is spared in the R6/2 mouse model. Zhang et al. found there was no correlation between motor function (rotarod performance) and cerebellum volume in the R6/2 mouse model. 45
Ventricles
Ventricle enlargement is a common pathology in human HD. 76 The ventricle volume was shown to be increased compared to controls in YAC128, 53 R6/1,32,36, 32,36 R6/2,27,40,45,54,57, 27,40,45,54,57 HdhneoQ20/HdhneoQ111, 64 HdhQ150, 35 and Ki140CAG 68 mouse models. Zhang et al. reported the largest increase, with ventricles 60% larger in R6/2 mice compared to controls at 12 weeks of age. 45 Auerbach et al. found ventricle size was enlarged in only a subset of HdhneoQ20/HdhneoQ111 mice and that despite worsening phenotype with age, ventricle size did not increase. 64 They conclude that enlarged ventricles are most likely a developmental defect and not a progressive phenotype associated with disease progression.
White matter
The corpus callosum volume decreases in the human brain in HD, resulting in worsening neuropsychological outcomes. 77 Unlike the striatum, cortex and hippocampus, the corpus callosum was not included in all of the studies that performed manual segmentation. Five studies investigated the total volume of the corpus callosum, with four detecting a decrease in the R6/1, 36 R6/2, 33 N171-82Q 59 and HdhQ150 HD mice 35 and one reporting no differences in white matter volume compared to controls in R6/1 mice. 32 The decrease in corpus callosum volume ranged from 13–20% compared to controls. In the R6/2 mice, the decrease in the corpus callosum volume was only detected in males. 33 Focal differences in the corpus callosum were also detected in the YAC128 mice51,53, 51,53 and R6/1 mice. 37 The three R6/1 studies provide an illustration of the potential time course of the corpus callosum changes in this mouse model, with an initial localized increase in volume (in the posterior callosum) at 16 weeks of age, 37 followed by no change compared to controls at 17 weeks, 32 and a subsequent decrease in volume of 19% at 30 weeks. 36 In comparison, in the N171-82Q mice, the decrease in corpus callosum volume occurs at the earliest imaging time point (6 weeks of age) and was the only evidence of neuroanatomical atrophy at this age. 59
Other white matter brain structures that show decreases in HD mice compared to controls include the anterior commissure, 51 external capsule 37 and fimbria. 51
Other brain structures impacted by HD
46% of the articles used 2D images and manual segmentation of a set of brain structures expected to change in HD. As illustrated by the comparison in [54] and [55], 3D, high-resolution isotropic images combined with automated image analysis and VBM (or DBM) finds new and unexpected (sub)-structures impacted by HD. Other brain structures that were revealed to be impacted by HD include the olfactory bulb,37,51,56, 37,51,56 hypothalamus,28,55,59, 28,55,59 globus pallidus/basal ganglia,54,55,58,61,66, 54,55,58,61,66 amygdala46,55,56,59, 46,55,56,59 and nucleus accumbens. 61
CAG repeat length
Traditionally, HD severity and the rate of striatal atrophy is associated with CAG repeat length.2,78, 2,78 Figure 2 shows the percentage of striatum volume loss measured by structural MRI with CAG repeat length, colored by mouse model. Unlike in human HD, the largest striatal atrophy was observed in mice with the lowest CAG repeat length (at 12 weeks in the R6/2 model 45 and 30 weeks in the R6/1 model). 36 At lower CAG repeat lengths (determined at time of genotyping), there was a U-shaped relationship in striatum volume loss. In Sawiak et al., HD mice with CAG repeat length greater than 200 were described as having an “ameliorated phenotype” compared to mice with fewer repeats. 57 This is consistent with the decrease in the trend line at 200 CAG repeats in Fig. 2 and in the reported delayed disease onset and prolonged survival in other studies of R6/2 mice with > 200 CAG repeats.79,80,81, 79,80,81 It is important to note that striatum volume measurements were taken at different ages and the reported CAG repeat lengths (measured at genotyping) do not account for somatic expansion that occurs with age. 82
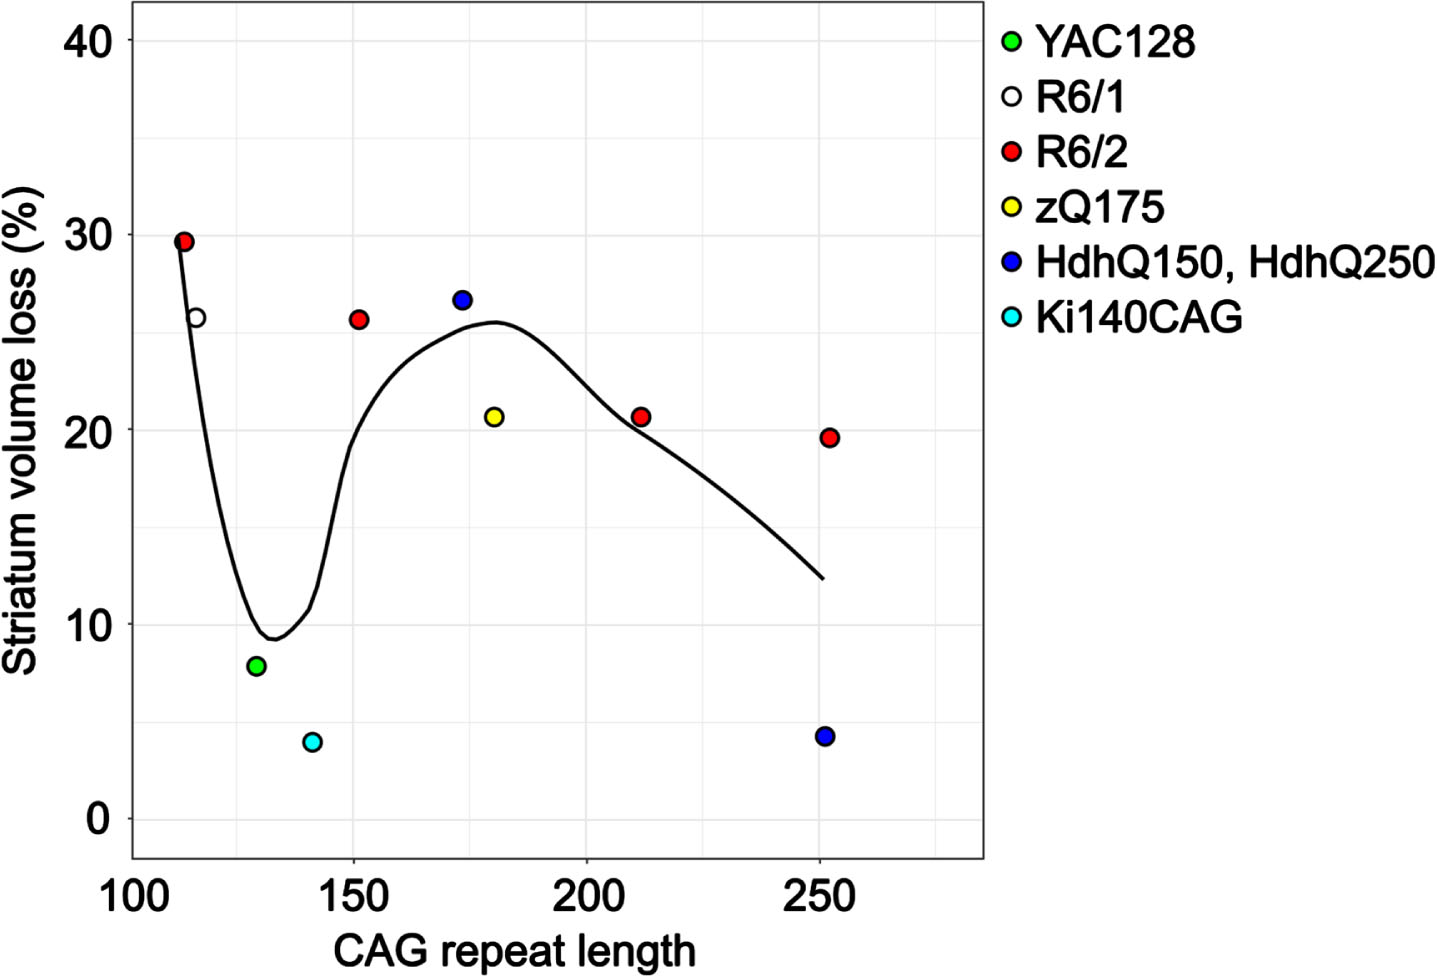
Striatum volume loss as measured by structural MRI with CAG repeat length in 6 different mouse models. The CAG repeat lengths were determined at the time of genotyping by PCR. Only data from articles that provided percent differences or the absolute structure volumes was included. For mouse models with multiple imaging time points, only data post-symptom onset was included. The average time between motor and cognitive symptom onset and MR imaging was 14 weeks.
KNOWLEDGE GAPS AND FUTURE DIRECTIONS
Replicability
Across all articles there was little replication of results. Study designs (MRI acquisition (e.g., image resolution), sample size, time points, data analysis) varied between all mouse models. Within articles that investigated the same mouse model at the same time point, there is some discrepancy in the structural MRI results. For example, in the YAC128 mouse model, three articles measured striatum volume at 32 weeks of age. However, at this time point, only the two ex vivo imaging studies reported a significant decrease in striatum volume,51,53, 51,53 while the in vivo imaging study reported no significant difference compared to controls.
38
In the zQ175 mouse model, 2 of the 7 articles included a time point at 16 weeks of age. One reported significant decreases in the striatum and cortex volumes at this time point in heterozygous zQ175 mice
29
while another found no changes.
63
The former study had a larger sample size (n = 9–10 in Heikkinen et al.
29
vs. n = 5 in Liu et al.
63
) which may explain the ability to detect significant volume differences (on the order of 4–8%). Four of the articles about zQ175 mice included a time point at 24 weeks of age and the use of relative brain structure volumes (normalized to total brain volume) in Tereshchenko et al.
58
resulted in the identification of a larger number of structures impacted by HD compared to the three other studies that only looked at absolute structure volumes.30,60,62, 30,60,62 Of the 12 articles that used structural MRI in R6/2 mice, the time points ranged from 3 to 21 weeks of age. Two articles used the same imaging data; however, the analysis approach was different. In Zhang et al., manual segmentation found significant differences at 4 weeks of age in the striatum, cortex, and hippocampus.
45
In contrast, deformation based morphometry from 3–5 weeks of age only showed focal decreases in the cortex.
46
In other studies where there was overlap at the 4 week time point, there were no significant volume differences reported.28,33, 28,33 These inconsistencies may be attributed to differences in image resolution, sample size or CAG repeat length. These examples illustrate the impact of study design on MRI outcomes and lack of replicability represents a significant challenge in determining which mouse model best reproduces clinical HD pathology. We recommend following the guidelines in Lerch et al.
20
for experimental design and comparing the different HD mouse models including the use of voxel-wise and both absolute and relative structure volumes, well-powered sample sizes and an appropriate number of time points to explore the full disease progression (including early life, as described below). We also recommend making the structural MRI images freely available to other researchers using a repository such as the Cambridge MRI database.
83
Early life imaging
One of the limitations of the use of HD mouse models is that the shortened lifespan means the brain atrophy observed in humans is not fully recapitulated. For example, at clinical diagnosis, the striatum volume in humans is decreased by 30–69%.17,18, 17,18 In comparison, the largest striatum volume loss observed in mice was 30%.
45
In the HD mouse models with a more severe phenotype, it is challenging to separate out the impact of the mutation on brain development versus HD pathology. The striatum in the R6/2 mouse model is shown to be different from controls at the earliest imaging time point (3 weeks of age),
61
suggesting the differences are programmed early in life. Moreover, one of the studies of the R6/2 model found there was no progression in the striatal atrophy as the pathological burden increased,
33
indicating it is unaffected by the onset of pathology. This has been observed in the TgCRND8 mouse model of Alzheimer’s disease,
84
where abnormal neuroanatomy compared to controls was observed at 1 week of age (before amyloid plaque deposition). Interestingly, a growing body of literature suggests mutant HTT has an impact on brain development, supporting the idea that abnormal neurodevelopment is part of the pathology of HD.
85
Children at risk of HD (CAG repeat length > 39) show striatum volume changes very similar to the R6/2 mice in Zhang et al.
61
: an early increase relative to controls, followed by a significant progressive decrease.
86
MR imaging of HD mouse models in early life is important to better understand the impact of the HD mutation throughout the lifespan. Mice can be imaged as early as postnatal day 1,
87
providing valuable information about whether the mutation causes a neurodevelopmental phenotype in addition to modeling HD pathology.
Biological sex differences
Another important consideration for future studies is understanding sex as a biological variable in HD. Recent human studies have reported significant sex differences in motor, cognitive and depressive symptoms in people with HD.
88
Several of the mouse MRI articles only included one sex and while many used both female and male mice, they were underpowered for exploring sex differences and did not include sex as a biological variable in the data analysis. The MRI mouse studies that did explore sex differences generally found an earlier and more severe impact of HD in males. In R6/1, focal decreases in the cortex volume were observed in males at 17 weeks of age and in females only starting at 19 weeks.
32
In R6/2 mice, males showed a decrease in hippocampus and corpus callosum volumes at 8 weeks of age while atrophy to the hippocampus was not apparent in females until 12 weeks and there was no significant differences between female R6/2 mice and controls in the corpus callosum volume up to 14 weeks.
33
However, striatum volume was significantly decreased in R6/2 females and not in males at 12 weeks of age.
33
In the study of early brain development in zQ175 mice, only males showed volumetric differences compared to controls.
61
Finally, there were significant sex differences in HdhQ150 mice, with females showing cortical atrophy before males and males showing a greater decrease in striatum volume at 95 weeks compared to females.
35
These results support the recommendation that both sexes must be included in the study design and that biological sex must be included in the data analysis.
Other animal models of HD
Large animal models of HD provide several unique advantages compared to mice (reviewed recently in Howland et al.).
89
While the majority of MRI studies of HD have been conducted in mouse models, a structural MRI study in transgenic HD non-human primates reported decreased striatum volume and increased lateral ventricle volume, consistent with human HD.
90
Diffusion tensor MR imaging has been conducted in the OVT73 sheep model of HD
91
and the feasibility of using structural MRI in a minipig model of HD has been demonstrated.
92
Future MRI research of both small and large animals promises to bridge the gap between preclinical studies and human HD.
CONCLUSIONS
HD is associated with brain atrophy and structural MRI plays an important role as a clinical biomarker of disease progression. Mouse models of HD provide an avenue for improving our understanding of human disease and for testing novel therapies. Several studies have used structural MRI to investigate treatment efficacy on HD mouse models.93–97 In order to evaluate these therapies, we need to know how the brain pathology develops over time in each untreated mouse model. Compared to histological assessments, MRI provides a non-invasive, three-dimensional, whole brain approach to image the HD brain and an opportunity to correlate the structure volumes with behavioral outcomes. Mouse models of HD show variable disease progression and pathology and therefore it is not surprising that the MRI-detectable neuroanatomical changes are also variable. When deciding on which mouse model to use, it is important to consider which neuroanatomical aspect and which time point in development is desired. Taken together, the MRI mouse studies reviewed in this paper provides a detailed picture of the time course of neuroanatomical changes that occur in some of the most widely used mouse models of HD.
Footnotes
ACKNOWLEDGMENTS
The authors have no acknowledgments to report.
FUNDING
The funding for this work was provided by Brain Canada. JH and DPL acknowledge financial support from CIHR and NSERC, respectively.
CONFLICT OF INTEREST
The authors have no conflict of interest to report.