
Abstract
Background:
Perivascular spaces (PVS) are fluid-filled cavities surrounding small cerebral blood vessels. There are limited reports of enlarged PVS across the grey matter in manifest Huntington’s disease (HD). Little is known about how PVS morphometry in the white matter may contribute to HD. Enlarged PVS have the potential to both contribute to HD pathology and affect the distribution and success of intraparenchymal and intrathecally administered huntingtin-lowering therapies.
Objective:
To investigate PVS morphometry in the global white matter across the spectrum of HD. Relationships between PVS morphometry and disease burden and severity measures were examined.
Methods:
White matter PVS were segmented on 3T T2 W MRI brain scans of 33 healthy controls, 30 premanifest HD (pre-HD), and 32 early manifest HD (early-HD) participants from the Vancouver site of the TRACK-HD study. PVS count and total PVS volume were measured.
Results:
PVS total count slightly increased in pre-HD (p = 0.004), and early-HD groups (p = 0.005), compared to healthy controls. PVS volume, as a percentage of white matter volume, increased subtly in pre-HD compared to healthy controls (p = 0.044), but not in early-HD. No associations between PVS measures and HD disease burden or severity were found.
Conclusions:
This study reveals relatively preserved PVS morphometry across the global white matter of pre-HD and early-HD. Subtle morphometric abnormalities are implied but require confirmation in a larger cohort. However, in conjunction with previous publications, further investigation of PVS in HD and its potential impact on future treatments, with a focus on subcortical grey matter, is warranted.
INTRODUCTION
Huntington’s disease (HD) is an autosomal dominant neurodegenerative disease caused by a cytosine-adenine-guanine (CAG) trinucleotide repeat expansion in the huntingtin (HTT) gene for which there is currently no cure [1]. Despite this, the single genetic cause of HD has led to the development of a diverse pipeline of clinical trials aiming to lower mutant HTT (mHTT) [2]. Many of these putative treatments are administered either intrathecally, such as antisense oligonucleotides, or via intraparenchymal delivery such as genetic therapies [3]. Understanding factors that may affect regional distribution and success of such therapies throughout the grey and white matter, such as morphological changes in perivascular spaces (PVS), is imperative [3]. Thus, a more in-depth understanding of PVS, particularly in premanifest (pre-HD) and early manifest HD (early-HD), may facilitate future clinical trial design or interpretation.
PVS are fluid-filled structures surrounding the walls of arterioles, capillaries, and venules within the brain parenchyma and throughout the white matter [4]. Astrocytic end-feet containing aquaporin-4 (AQP-4) channels make up the external boundary, and the vessel wall forms the internal boundary of PVS. While their precise role remains elusive, they are believed to act as a conduit for fluid transport, including the exchange of cerebrospinal fluid (CSF) surrounding the cortex with intra-parenchymal interstitial fluid [5]. This exchange facilitates waste clearance from the brain and contributes to the maintenance of brain homeostasis [6]. By contrast, increased PVS load is associated with neuroinflammation [7], blood-brain barrier (BBB) dysfunction, and impaired clearance from the interstitial space, ultimately leading to the accumulation of toxins and hypoxia, causing tissue damage [6]. There is evolving interest in abnormal PVS morphometry in neurological disorders and how they contribute to disease mechanisms with numerous strategies and techniques proposed in the literature to enhance the visibility and quantification of PVS. For example, there are reports of visibly enlarged PVS (ePVS) on magnetic resonance imaging (MRI) in various neurological diseases including Alzheimer’s disease [8], small vessel disease [6], multiple sclerosis [9], and HD [3, 10–12].
PVS in HD have mostly been investigated in subcortical grey matter structures in participants with manifest disease. Using PVS visual scores on 1.5T MRI, one study found increased PVS burden in the basal ganglia of manifest HD participants compared to first-degree relatives [10]. A histological study found profoundly enlarged PVS on ex vivo 7T MRI in HD participants. However, the authors acknowledged that whether ePVS were a fault of fixation artefact or a disease-specific observation was unknown [11]. Subsequently, an in vivo 3T MRI study reported a larger percentage volume of dilated PVS in subcortical structures in early-HD participants compared to healthy controls [3]. They reported higher PVS burden to be associated with smaller caudate volume, suggesting PVS burden becomes progressively worse with increasing disease severity; however, this is only suggestive because the study was cross-sectional [3]. Furthermore, a greater quantity of ePVS has been shown to overlap with areas of impaired cerebrovascular reactivity in HD participants compared to controls [12]. This can alter cerebral blood flow and induce relative hypoxia, therefore, compromising PVS function and encouraging enlargement of PVS. A relationship between cerebrovascular reactivity and PVS suggests that neurovascular alterations in HD have the potential to contribute to the enlargement of PVS.
Nonetheless, the reasons for the widening of PVS remain to be elucidated but they may be an indication of compromised PVS function. A review by Brown et al. (2018) described obstruction of PVS from protein and cell debris to contribute to the widening of PVS and stagnation of fluid drainage [6]. HD is a disease caused by the accumulation of mHTT protein [13] and there have been reports that clearance of mHTT occurs through PVS in the glymphatic system [14]. This suggests that mHTT might amass within PVS, leading to detectable PVS enlargement on 3T MRI, potentially due to the accumulation of debris around vascular cells [6]. This postulation would need to be investigated further as enlarged PVS have the potential to affect the distribution and success of intraparenchymal and intrathecally-administered therapies in HD [2].
Additionally, a recent study examined the glymphatic distribution of antisense oligonucleotides (ASOs) in BACHD transgenic mice expressing the human HTT gene [15]. They found that, following cisternal injection, ASOs entered the brain parenchyma via PVS in the cortex and striatum of mice. This study also found downregulation of AQP-4 in astrocytes decreased levels of ASOs in the brain, suggesting AQP-4 lined PVS are vital for intracisternal injected therapies [15]. Therefore, further understanding of PVS morphological alterations across the spectrum of HD will enable a deeper understanding of how they could impact future HD therapies.
PVS are very small structures and manually identifying and delineating them is extremely time-consuming and prone to rater error [16]. Despite this, multiple different automated and semi-automated pipelines for PVS quantification have been described in the literature based on classical image processing techniques or machine learning approaches to eliminate time-consuming manual processes [17]. For example, the effectiveness of employing a Frangi filter for detecting tubular structures in semi- and fully automated methods have been investigated, resulting in successful and robust segmentation of PVS through the extraction of a vesselness map derived from the tubular morphology characteristics of PVS [18–20]. Furthermore, various machine learning approaches have been investigated, where algorithms are trained with manually labeled PVS segmentations; through multiple iterations, these models learn the features associated with PVS and can subsequently label PVS structures on new data [17]. For instance, Park et al. (2016) demonstrated a machine-learning technique utilizing random forests for automated PVS segmentation [21]. More recently, efforts have been focused on enhancing the visibility of PVS on scans. One approach combined both T1- and T2-weighted images to achieve enhanced PVS contrast (EPC), making the PVS clusters more discernible from the white matter [22]. However, the availability of such techniques are often limited, with the majority being in-house techniques [19].
Recently, perivascular space semi-automatic segmentation (PVSSAS) [23], was made freely available on GitHub (https://github.com/smithd37/pvssas) for segmenting, viewing, and editing PVS in vivo on T2-weighted scans across the cortical white matter. PVSSAS quantifies PVS count, PVS total volume (mm3) and PVS median long and short axis (mm). This method was validated on a participant with multiple sclerosis, finding an 83% overlap of PVS detected manually and using PVSSAS [16], and has since been applied to quantify PVS across the white matter in participants with COVID-19 [23] and major depressive disorder patients [24].
The objective of this study is to assess the application of PVSSAS, an existing analysis pipeline validated for quantification of PVS in T2-weighted images across the global white matter, for use in HD using a cohort of pre-HD, early-HD, and matched controls. The clinical application of this method will investigate PVS morphometry in the global white matter across the spectrum of HD to visualize if there is a stepwise increase in total PVS count and absolute PVS volume from controls to pre-HD to early-HD. Additionally, we will assess the relationships between PVS morphology and measures of disease burden/severity in HD including HD disease burden score (DBS) and total motor score (TMS).
MATERIALS AND METHODS
Study participants
Participant data from the Vancouver site of the multi-site TRACK-HD study were selected [25–28] including 33 healthy controls, 30 pre-HD, and 32 early-HD participants. Participants were aged 18 to 65 years, able to tolerate MRI and biosample collection, and without major psychiatric disorder or previous significant head injury. Written informed consent was obtained from each participant according to the Declaration of Helsinki and this study was approved by local ethics committees. Full descriptions of data collection, storage, procedures, ethical approval, and demographics are found in previous TRACK-HD publications [25–28].
Healthy controls included siblings, relatives, and non-family members with confirmed non-expanded CAG repeat lengths. Controls were recruited with comparable environmental and social exposures with HD participants as well as some psychological burdens of living with HD [25]. Pre-HD participants (prior to clinical onset) required a CAG repeat expansion of ≥40 and a DBS of > 250 which approximates 15 years to estimated disease onset [29]. DBS is a model to reflect the burden of HD pathology determined by age x (CAG –35.5) [30]. A Unified Huntington’s Disease Rating Scale (UHDRS) TMS of ≤5 to indicate a lack of significant motor features was required for pre-HD participants [25]. Early-HD participants (clinical motor onset) required a CAG repeat expansion of ≥40 and were identified in stage 1 or 2 according to the Shoulson and Fahn staging system with a UHDRS Total Functional Capacity (TFC) score of ≥7 [31].
Image acquisitions
Participants underwent both T1-weighted (T1) and T2-weighted (T2) MRI in the same visit. For T1 scans, a 3D MPRAGE acquisition on 3T Phillips scanners with the following imaging parameters was used: TE = 3.5 ms, TR = 7.7 ms, FA = 8°, FOV = 24 cm, matrix size =224 × 224, voxel size = 1.07×1.07×1.07 mm3. A total of 164 sagittal slices were produced for each scan with 1.0 mm slice thickness. For T2 scans, a VISTA sequence was used for the 3T Phillips scanners with an identical field of view, acquisition matrix and slice thickness as T1 scans [25].
Perivascular space analysis pipeline
The analysis pipeline for PVS segmentation included MRI pre-processing, PVS morphometric measurements, and refinement of the methodology (Fig. 1). This included parameter optimisation for this 3T cohort from the Vancouver site and reproducibility testing to assess manual edits to improve segmentation accuracy. We utilized a single TRACK-HD cohort site for this exploratory analysis to mitigate confounding variables, as site-specific optimization is necessary for PVSSAS software. Prior to running MRI data through the pipeline, raw T1 and T2 data were visually inspected for artefacts and those deemed unsuitable for analysis were excluded prior to processing.
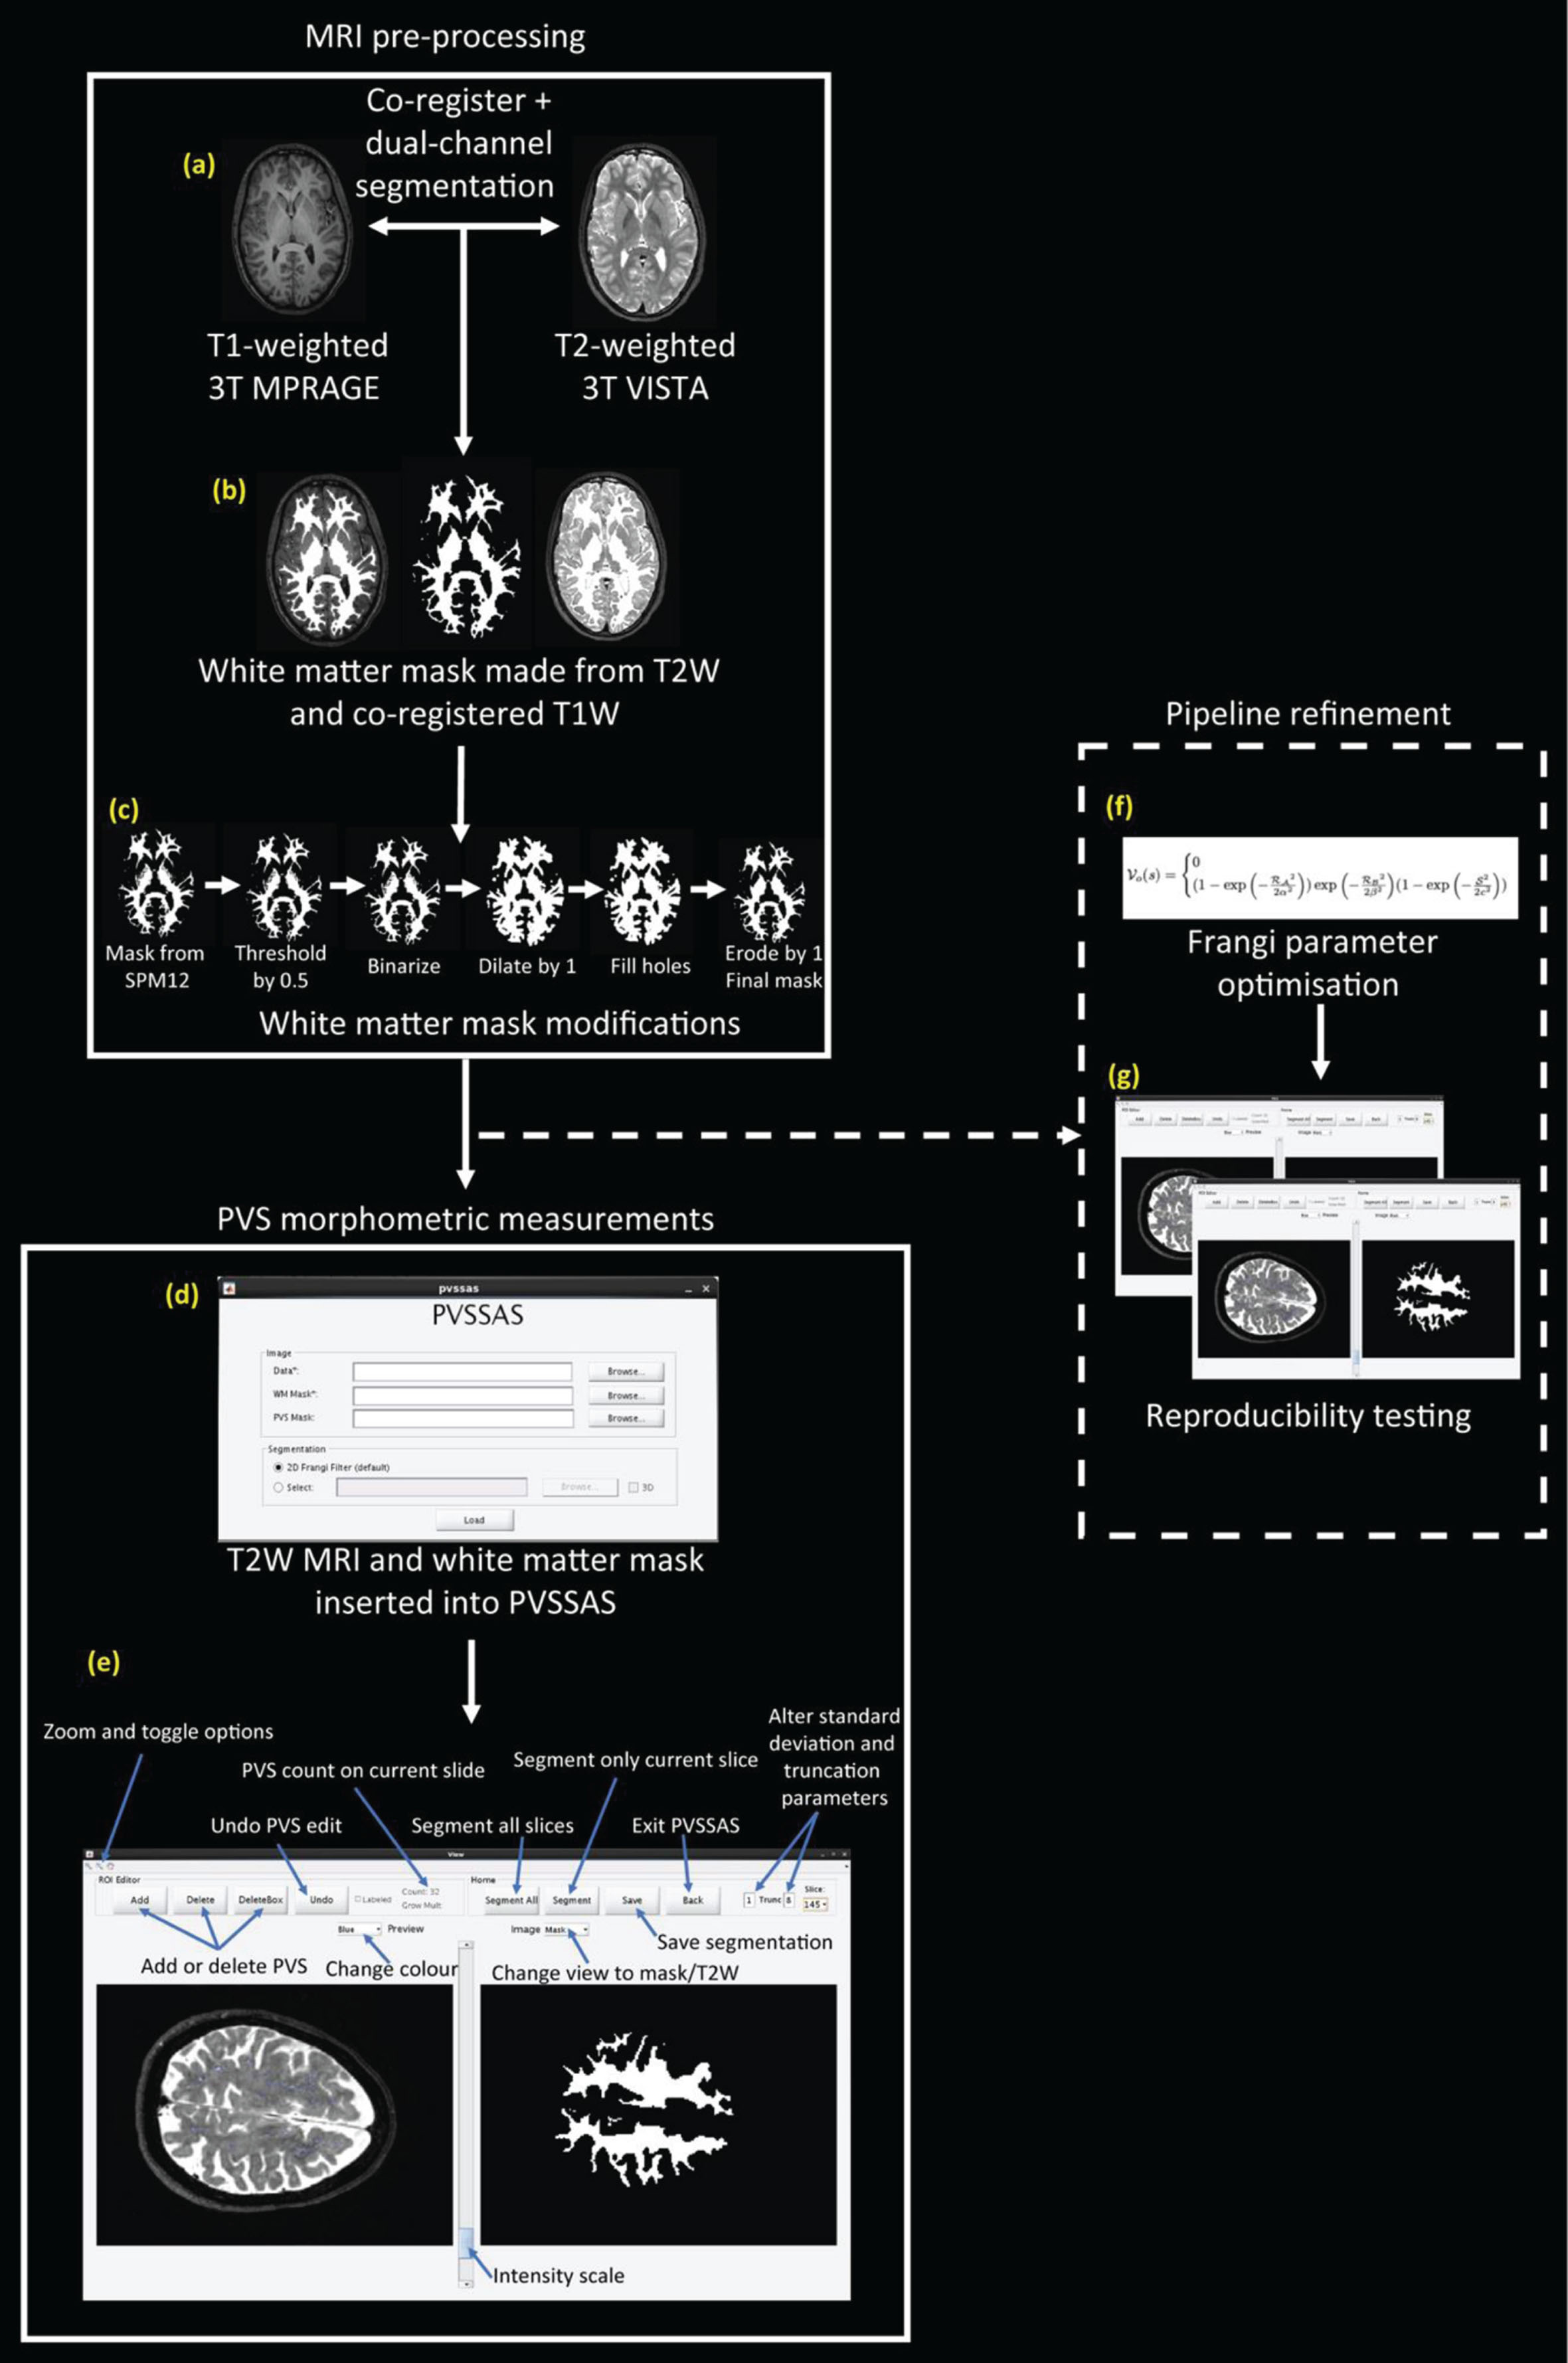
Schematic representing the analysis pipeline including MRI pre-processing, PVS morphometric measurements, and pipeline refinement. (a) T1 MRI co-registered to T2 MRI using SPM12. (b) Dual-channel segmentation was performed on SPM12 using the T2 MRI and the co-registered T1 MRI to generate white matter masks. (c) White matter mask modifications were performed including thresholding by 0.5, binarizing the image, dilating the image by 1 voxel, filling the holes, and eroding the image by 1 voxel to create a final mask (Supplementary Material 1). (d) The PVSSAS interface where each participant’s T2 image and white matter masks were inserted. (e) The primary interface of the PVSSAS tool where PVS were automatically segmented in each slice of the scan in the pre-defined white matter and manual editing of the segmentations was performed. (f) Frangi parameters were optimized for use on 3T scans (Supplementary Material 2). (g) Reproducibility of manual edits was examined (Supplementary Material 2).
MRI pre-processing
T1 and T2 scans that passed visual quality control were co-registered using Statistical Parametric Mapping version 12 (SPM12) [32] to correct for subtle alignment differences between scans (Fig. 1a). This was followed by a dual-channel tissue segmentation within SPM12 to generate a white matter mask using default parameters for bias regularisation and bias full-width half maximum. SPM12’s built-in dual-channel segmentation segments, bias corrects, and spatially normalises all in the same model [32]. This segmentation method combined the different T1 and T2 image contrasts to generate a white matter mask that was specific to the T2 images (Fig. 1b). Additional morphological pre-processing steps included optimising the white matter mask for PVSSAS which can be found in Supplementary Material 1 Fig. 1c). The quality of white matter masks was visually inspected and those deemed unsuitable for analysis were excluded prior to processing.
PVS morphometric measurements
PVSSAS is a semi-automated segmentation tool for segmenting, viewing, and editing PVS in vivo [23]. It functions to segment PVS in T2 images by using a 2D Frangi-based detection algorithm: a quick and powerful segmentation technique to detect vessel-like structures and fibers in volumetric data, such as PVS [20]. PVSSAS pipeline refinement and the reproducibility of PVS segmentations were assessed and the methods for this can be found in Supplementary Material 2. To summarize, Frangi filter parameter optimization included systematically assessing each parameter gradually within their pre-defined limits and visually inspecting the PVS segmentations. Supplementary Table 1 summarizes the different parameters, the range explored for the optimization process in this study, and how they change PVS segmentations. The final PVSSAS parameters were used: PVSSAS filter size to 0.5–10, Frangi scale range of [0.5–3.2], scale ratio of 2, Frangi β1 to 0.98, Frangi β2 to 0.35.
For each participant, the T2 image and white matter mask were inserted into PVSSAS and PVS were segmented (Fig. 1d, e). MRI scans in PVSSAS can only be viewed in one plane at a time, restricting the view of PVS. To increase the reliability of the visual quality control of the segmented and non-segmented PVS, FMRIB Software Library (FSL) viewer [33] was open with the corresponding T2 scan for additional 3-plane visibility of PVS.
Manually editing, adding, and removing PVS on PVSSAS included removing PVS outside the white matter mask such as within a ventricle or sulcus. Missegmented white matter hyperintensities were removed. PVS that were not segmented by PVSSAS were added in all visible slices above and below using the ‘Add’ tool if they were visible on FSLView and abided by the STRIVE criteria (Fig. 1e) [34].
Statistical analysis
All data analysis was performed using STATA version 17.0 (https://www.stata.com). The level of significance for all statistical tests was set at 0.05. Appropriate normality tests were performed, and log transformations were attempted for variables where necessary.
Demographic group differences were investigated using independent t-tests for normally distributed data and Mann-Whitney U tests when groups were not normally distributed. A Chi-squared test was used for group differences in sex.
For the main analysis, absolute group differences for PVS count and PVS volume were assessed using linear regression with age, sex, and total intracranial volume (TIV) adjusted for as nuisance variables. Further analysis looked at the density of PVS count and PVS volume in the white matter by normalizing to white matter volume. PVS count density was calculated as PVS count per 1000 mm3 of white matter volume. PVS volume was calculated as a percentage of white matter volume: total PVS volume divided by total white matter volume. Group differences between healthy controls, pre-HD and early-HD for these variables were assessed using linear regression models with age, sex, and TIV as nuisance variables.
Linear regression analyses were conducted to investigate associations between PVS variables with TMS and DBS with age, sex, and TIV adjusted for nuisance variables. TMS was only assessed in early-HD participants as most pre-HD participants would score at floor level. DBS was used as a disease burden measure across all gene-positive participants and, therefore, comprised both pre-HD and early-HD participants.
RESULTS
Group demographics
Table 1 provides demographic data for the participants included in this study. As expected for a progressive disease, pre-HD participants were significantly younger than early-HD participants (p = 0.004). The distribution of males and females differed slightly between groups as assessed by a chi-squared test (χ2 = 6.38, p = 0.041). DBS, TMS, and TFC all showed a significant increase between pre-HD and early-HD groups (as expected for a progressive disease) whereas CAG repeat length did not differ between HD groups (p = 0.464).
Group demographics
Data are mean (SD). Demographic data of the participants that were included in the analysis. Age and CAG length used a Mann-Whitney U test. All other group differences are found using an independent t-test apart from a chi-squared test to assess sex group differences. Bold values are statistically significant (p < 0.05). 1Control versus pre-HD, 2Control versus early-HD, 3Pre-HD versus early-HD, +Chi-squared test. SD, standard deviation; M, males; TIV, total intracranial volume; CAG, trinucleotide repeat number; DBS, disease burden score; TMS, total motor score; TFC, total functional capacity.
Quality control
Visual assessment of T1 and T2 scans excluded three participants due to motion artefact (1/33 healthy controls, 1/30 pre-HD, 1/32 early-HD). Following processing, four participants were excluded due to white matter mask failure: two failures from over-segmented non-cortical areas (2/33 healthy controls) and two from over-segmentation of the brainstem (1/33 healthy controls, 1/30 pre-HD). After discussion, one pre-HD participant was excluded due to overwhelming additional small vessel disease features, making the differentiation and delineation of PVS difficult due to additional non-HD pathology. The final cohort used for statistical analysis included 29 healthy controls, 27 pre-HD, and 31 early-HD with a total failure rate of 8%. No patterns of systematic failure between HD and healthy controls were identified.
PVSSAS between-group differences
The reproducibility of the manual refinement of the PVSSAS segmentations was assessed and intraclass correlation coefficient (ICC) values for all PVS metrics included in this study were 0.95 or higher, showing excellent reproducibility of the manual refinement process for all PVS measures (Supplementary Table 2). See Supplementary Material 2 for further information about reproducibility tests and results.
White matter volume was significantly smaller in early-HD compared with both healthy controls and pre-HD, as expected (p < 0.0005 for both, Table 3), adjusted for age, sex, and TIV. No significant difference was found in white matter volume between pre-HD and healthy controls in this relatively small cohort (Table 2).
Group summary statistics of PVS measures
Summary statistics table of white matter volume and different PVS variables for healthy controls, pre-HD, and early-HD participants. Data are presented as mean and standard deviations (SD). WMV, white matter volume; WM, white matter.
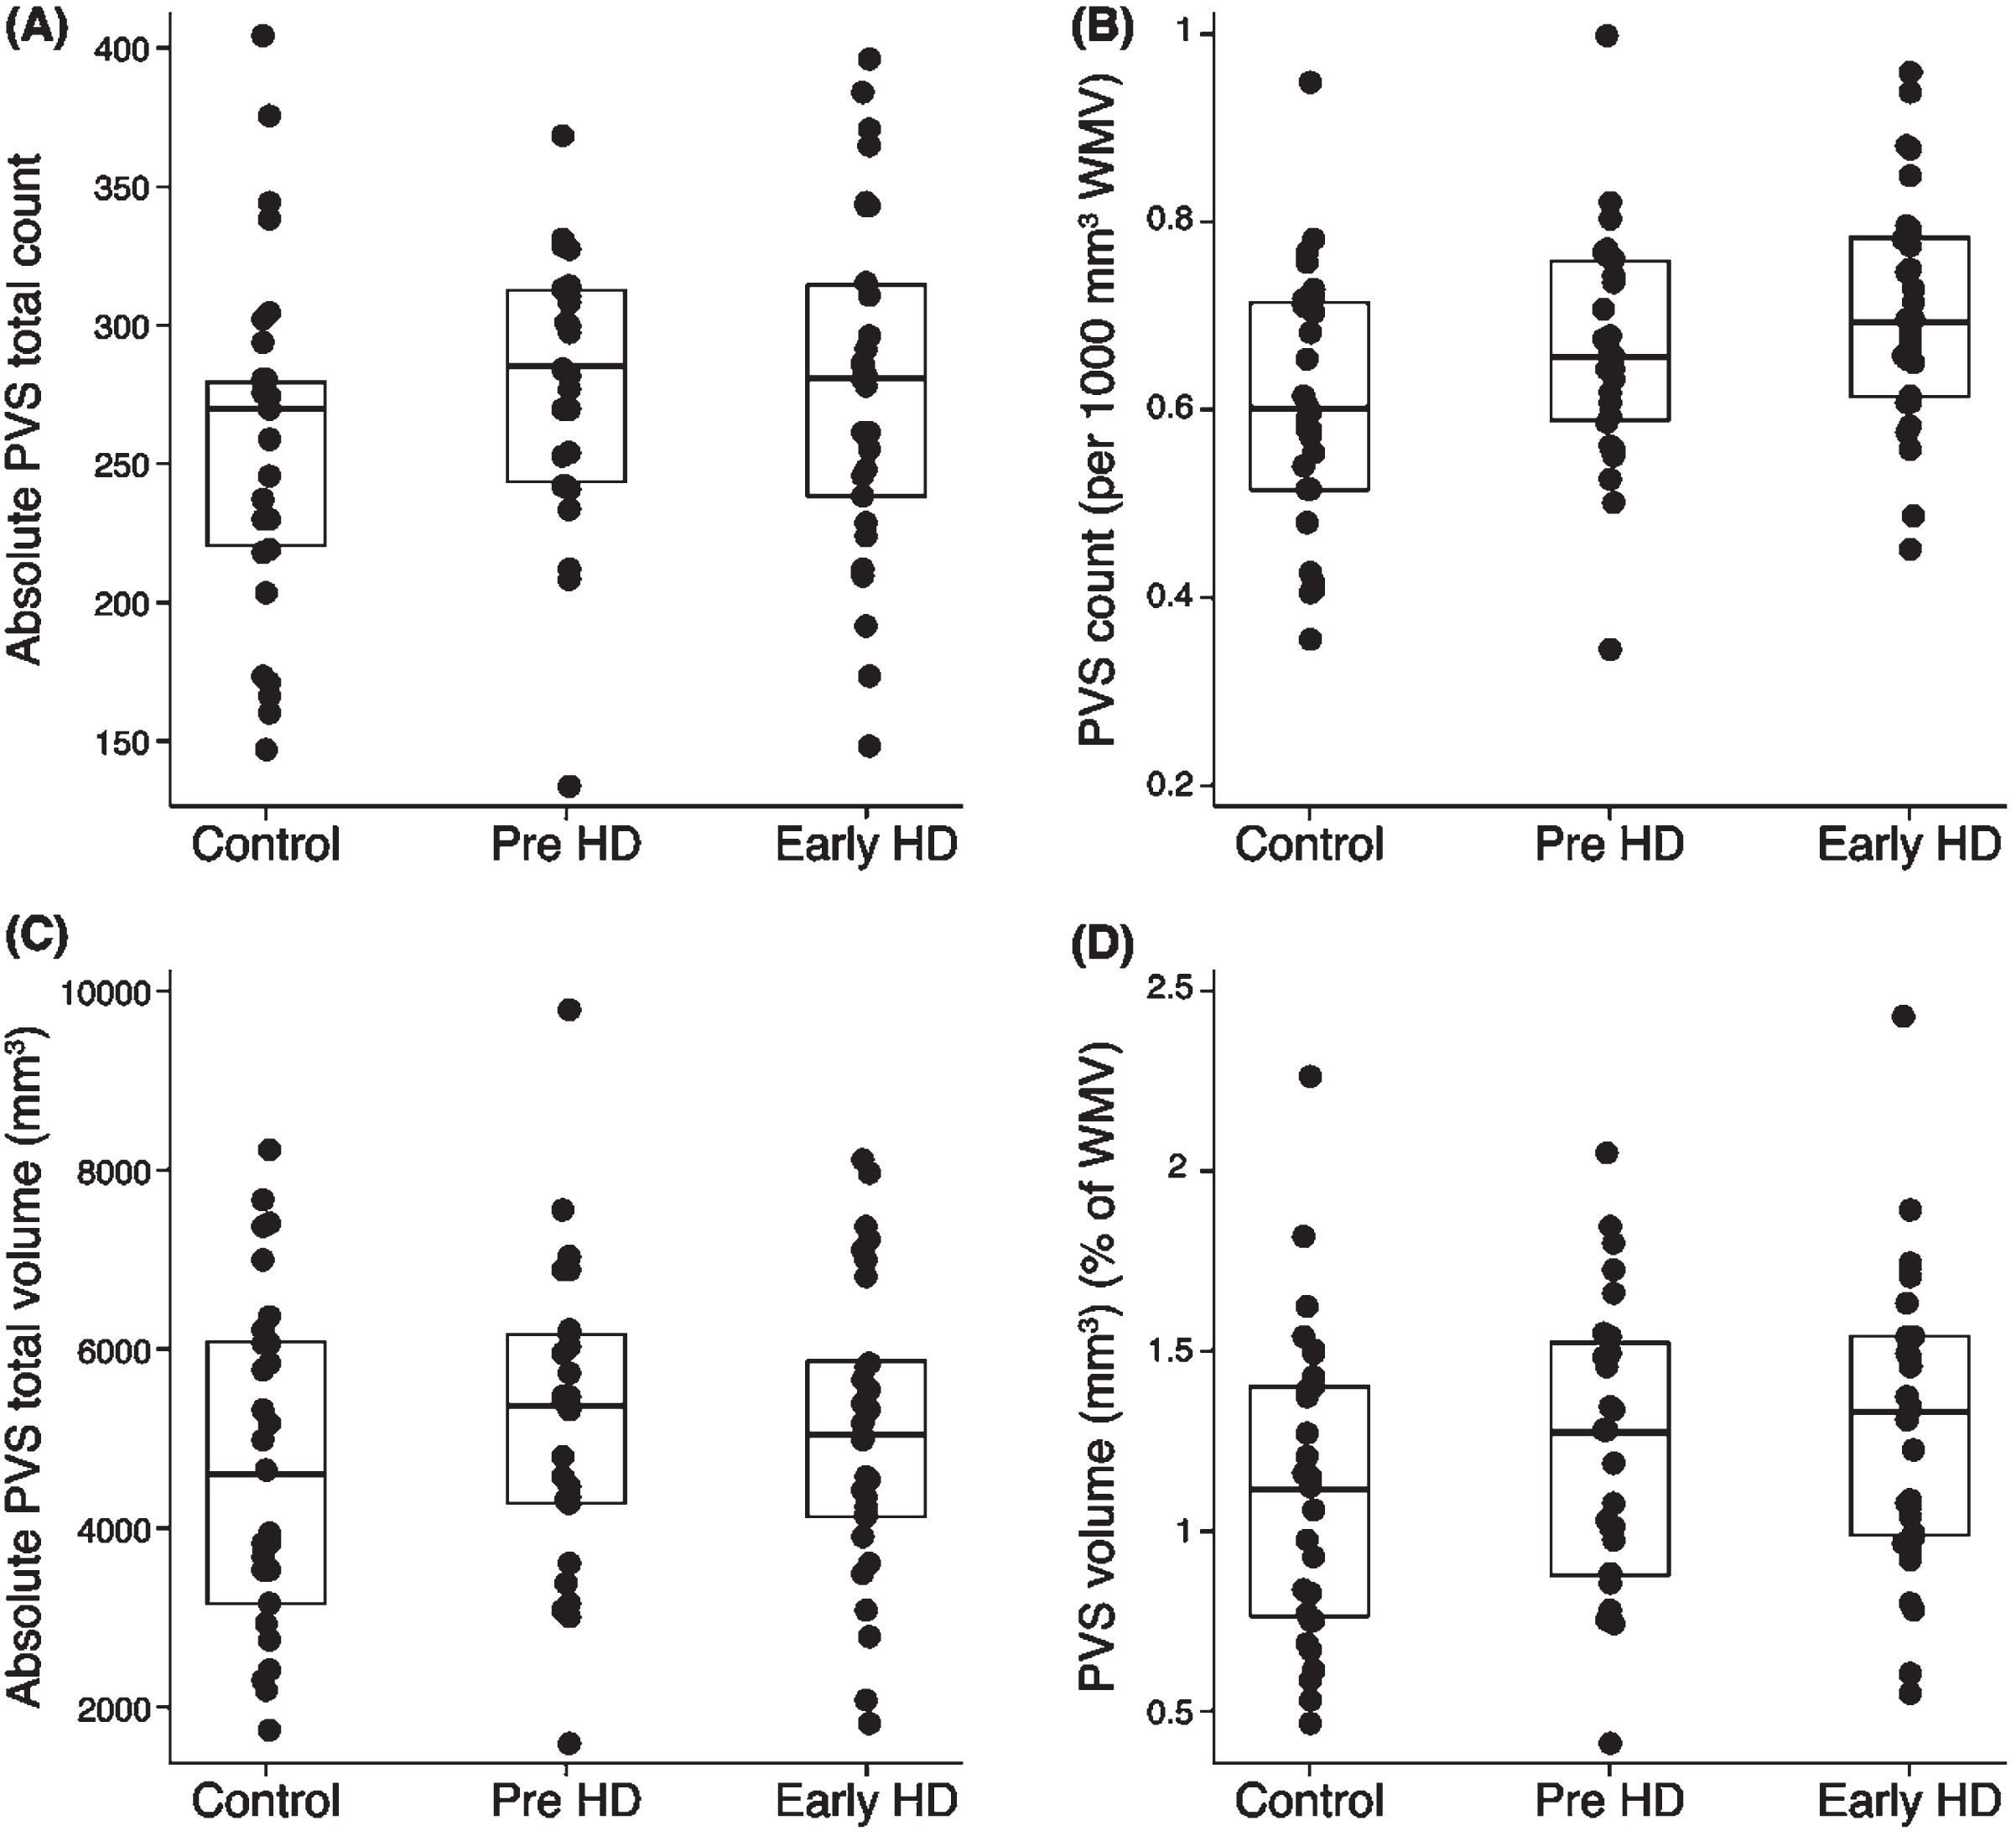
Scatter plots for (A) absolute PVS total count, (B) PVS count density, (C) absolute PVS total volume, and (D) PVS volume (as a percentage of white matter volume) between groups with overlayed box plots. Age, sex, and TIV were controlled for as nuisance variables in the regression analysis.
Mean between-group differences in white matter and PVS metrics
Table of group mean differences with 95% CIs and corresponding p-values from group linear regressions with age, sex, and TIV controlled for as nuisance variables. *Statistically significant (p < 0.05). CI, confidence interval; WMV, white matter volume; WM, white matter; SD, standard deviation.
Absolute PVS count was on average 8.1% higher in pre-HD compared to healthy controls (p = 0.027), adjusted for age, sex, and TIV. Although the mean PVS count in early-HD was similar to pre-HD (mean of 278 and 279, respectively, Table 2), it was not statistically significantly different between early-HD and healthy controls (p = 0.23), most likely due to higher standard deviation in early-HD. Overall, absolute PVS count shows large overlap between groups with considerable variability in the data (Fig. 2A).
PVS count density was statistically significantly higher in both pre-HD (8.2% on average) and early-HD (16.4% on average) compared to healthy controls (p = 0.004 and p = 0.005, respectively; Table 3; Fig. 2B), adjusted for age, sex, and TIV. Differences between the two HD groups were small and non-significant (p = 0.92).
Absolute PVS volume was not statistically significant between groups (Table 3, Fig. 2C). However, there was a statistically significant increase in PVS volume as a percentage of white matter in pre-HD compared to healthy controls (9.1% increase in pre-HD on average; p = 0.044, Table 3), adjusted for age, sex, and TIV. Although the mean PVS volume (as a percentage of white matter volume) also increased in early-HD compared with healthy controls, the mean difference was not statistically significant (Table 3) and there is considerable overlap in the data (Fig. 2D).
Relationship between PVS measures and burden/severity measures of HD
As PVS count density and PVS volume (as a percentage of white matter volume) yielded significant results between healthy controls and HD groups (Table 3), further exploration of these variables and their association with measures of disease burden and severity in HD were assessed. This included DBS in both HD groups combined and TMS in early-HD (Supplementary Table 5). There were no statistically significant relationships between PVS measures and DBS in both pre-HD and early-HD participants combined or between PVS measures and TMS in early-HD participants (Supplementary Table 5).
DISCUSSION
Few studies have explored PVS in both pre-HD and early-HD individuals and across the white matter with this being the first study to apply a semi-automated PVS segmentation tool to part of the TRACK-HD cohort. We assessed PVS metrics in healthy controls, pre-HD and early-HD participants and sought to explore the relationships between PVS measures with HD DBS and motor function. Overall, there were no marked abnormalities in PVS morphometry in the white matter of both pre-HD and early-HD individuals in this study. Subtle morphometric abnormalities are implied but require confirmation in a larger cohort. We found PVS count, PVS count density and PVS volume (as a percentage of white matter volume) to be subtly statistically significantly higher in pre-HD participants compared to healthy controls. Early-HD participants showed subtle statistically significantly higher PVS count density compared to controls. No associations between PVS measures with HD DBS and motor function were found.
The main findings of this study show a statistically significant increase in absolute PVS count, PVS count density and PVS total volume (as a percentage of white matter volume) in the white matter of pre-HD participants compared to healthy controls. Group differences in early-HD compared with controls were similar in direction and magnitude to pre-HD compared with controls, but only reached statistical significance for PVS count density over the white matter. The underlying causes of subtle increases in PVS enlargement in HD are unknown; however, HD is a disease caused by the accumulation of mHTT protein [13] and there have been reports that clearance of mHTT occurs through PVS in the glymphatic system [14]. This suggests that mHTT might amass within PVS, leading to detectable PVS enlargement on 3T MRI, potentially due to the accumulation of debris around vascular cells [6]. This postulation would need to be investigated, for example, using positron emission tomography (PET) radiotracers to track mHTT through the glymphatic system to identify any accumulation in PVS. One limitation of this proposed investigation is that no PET tracer targeting mHTT has been fully validated to date [35]; although, much work is currently underway in this area [36].
Previous studies have indicated ePVS potentially contributes to HD pathologies. Both BBB dysfunction and impaired cerebrovascular reactivity (CVR) have previously been reported as pathological consequences of ePVS in small vessel disease [6], and both neurovascular impairments have been reported in participants with HD [12, 37]. This is speculative but suggests a bidirectional link between BBB dysfunction, impaired CVR, and ePVS in HD. While exploring the connection between BBB dysfunction and ePVS in HD requires further investigation, recent research examined CVR in relation to PVS and identified regional CVR impairments in subcortical white matter regions among pre-HD and early-HD participants [12]. The authors reported greater dilated PVS load to overlap with subcortical white matter regions showing reduced CVR, which could be due to reductions in cerebral blood flow and hypoxia, resulting in increased PVS burden [12]. This differs from our study’s findings, which revealed only subtle volumetric PVS changes.
Our study has several limitations. Inclusion of manual intervention allows correction of automated segmentation errors, but user-error risk increases. Whilst we showed excellent intra-rater reliability, same-scan differences remain and reproducibility is critically dependent on rater expertise. Fully automated techniques have the advantage of efficiency and consistency which makes them practical for large datasets, but segmentation errors may be problematic particularly when anatomy deviates from normality, e.g., due to atrophy or other pathology. For example, a recent study used a fully automated computational quantification method to assess PVS in the centrum semiovale of 700 participants from the 1936 Lothian Birth Cohort [18]. Since manual refinement of segmentations was not possible, 23% of the cohort was excluded due to falsely segmented artefacts [18]. Fully automated methods are superior for efficient and consistent analysis in large datasets, however, if a large amount of the cohort is excluded due to the inability to refine segmentations, then a semi-automated method could be advantageous.
That being acknowledged, our study was limited by the small sample size, hence it could be considered a pilot study. However, the use of a smaller sample facilitated the parameter optimization process for PVSSAS, as site-specific parameter optimization is necessary for this technique. This is time-consuming and could be difficult to standardize for multi-site studies [19]. Therefore, for this study, we only used one site of the TRACK-HD cohort.
Prior research has observed a more substantial increase in PVS volume within subcortical grey matter structures in HD compared to the findings in the global white matter in this study [3], suggesting that PVS morphometry may be relatively preserved in the white matter in HD and more pronounced in the grey matter. PVSSAS was developed and validated for the quantification of PVS in T2-weighted images across the global white matter [16]. This software was selected for the current study as our focus was to investigate PVS abnormalities over the white matter—an area that has been relatively underexplored for PVS in HD, despite the fact that pronounced white matter changes, e.g., atrophy, are evident early in the course of the disease [25–28]. The results from our study suggest that PVS morphological changes over the white matter appear to be much more subtle compared to PVS findings in subcortical grey matter in early-HD found in other studies. Because of this, we would recommend that further work focuses on PVS in the grey matter to understand the impact of PVS in the striatum where pathological alterations begin earliest in the disease [38].
Footnotes
ACKNOWLEDGMENTS
The authors would like to thank the participants who took part in this study.
FUNDING
The TRACK-HD study was funded by CHDI. SJT is partly supported by the UK Dementia Research Institute which receives its funding from DRI Ltd., funded by the UK Medical Research Council, Alzheimer’s Society, and Alzheimer’s Research UK. SJT holds a Wellcome Trust research grant (ref. 223082/Z/21/Z) which provides funding for RIS and NZH. AC is funded by the Medical Research Council (ref. MR/W026686/1).
CONFLICT OF INTEREST
Blair R. Leavitt is an Editor-in-chief and Sarah J. Tabrizi is an Associate Editor of this journal, but they were not involved in the peer-review process nor had access to any information regarding its peer-review.
DATA AVAILABILITY
The data supporting the findings of this study are available on request from the corresponding author. The data are not publicly available due to privacy, ethical restrictions, or other concerns.