
Abstract
Background:
Huntington’s disease (HD) is a fatal neurodegenerative autosomal dominant disorder with prevalence of 1 : 20000 that has no effective treatment to date. Translatability of candidate therapeutics could be enhanced by additional testing in large animal models because of similarities in brain anatomy, size, and immunophysiology. These features enable realistic pre-clinical studies of biodistribution, efficacy, and toxicity.
Objective and Methods:
Here we non-invasively characterized alterations in brain white matter microstructure, neurochemistry, neurological status, and mutant Huntingtin protein (mHTT) levels in cerebrospinal fluid (CSF) of aged OVT73 HD sheep.
Results:
Similar to HD patients, CSF mHTT differentiates HD from normal sheep. Our results are indicative of a decline in neurological status, and alterations in brain white matter diffusion and spectroscopy metric that are more severe in aged female HD sheep. Longitudinal analysis of aged female HD sheep suggests that the decline is detectable over the course of a year. In line with reports of HD human studies, white matter alterations in corpus callosum correlates with a decline in gait of HD sheep. Moreover, alterations in the occipital cortex white matter correlates with a decline in clinical rating score. In addition, the marker of energy metabolism in striatum of aged HD sheep, shows a correlation with decline of clinical rating score and eye coordination.
Conclusion:
This data suggests that OVT73 HD sheep can serve as a pre-manifest large animal model of HD providing a platform for pre-clinical testing of HD therapeutics and non-invasive tracking of the efficacy of the therapy.
Keywords
INTRODUCTION
Huntington’s disease (HD) was first described in 1872 and continues to be relentlessly handed down from generation to generation in an autosomal dominant fashion [1]. HD patients develop classical movement disorder phenotypes (ataxia and chorea) that are proceeded by years of profound depression, cognitive and psychiatric disease [2]. HD patients also experience a generalized metabolic disruption in the central nervous system (CNS) and systemically [3–9]. Death occurs approximately 10–15 years after onset of symptoms. HD is caused by a trinucleotide repeat expansion in exon 1 of the HTT gene (≥40 CAG repeats) and is characterized by loss of medium spiny neurons in the striatum and pyramidal neurons of layers 5 and 6 of the motor cortex [10, 11]. Damage later extends to most areas of brain including the thalamus and cerebellum [12–18]. Aggregation of the expanded mutant Huntingtin protein (mHTT) in the brain results in cellular dysfunction, and the rate of aggregation is directly proportional to the uninterrupted CAG repeat length [19–22]. Additionally, the CAG repeat expansion affects splicing of exon 1, leading to retention of intron 1 and production of two aberrant transcripts (2.7 and 7.3 kb), which may also contribute to the pathogenesis of HD [23].
The number of candidate therapies for HD is increasing worldwide, and there is still considerable controversy over whether it is safe to completely silence
It remains unclear if the negative readouts from the recent clinical trials are due to HTT knockdown or are a result of toxicity inherent to ASO chemistry in the diseased HD brain. Regardless, these data point to a need for testing therapies in a large animal model of HD, to better understand efficacy and disease related toxicities. Although rodent models of HD mimic some neuropathological and metabolic features of human HD, their brain anatomy and size differ from humans which limits their usefulness for evaluation of therapeutic outcomes and translation to the human brain [40, 41]. This highlights the need for the development and further characterization of large animal models of HD with anatomical similarities to human brain [42–44]. Also, clinically relevant non-invasive biomarkers and neurological outcome measures used in the assessment of therapeutic efficacy in patients can be applied to large animal HD models. As examples, neurological deterioration has been captured using the Unified Huntington’s Disease Rating Scale (UHDRS) and more recently the composite UHDRS (cUHDRS), which assesses motor and cognitive function, behavioral abnormalities, and functional capacity [45]. mHTT in cerebrospinal fluid was among the biochemical readouts used in the aforementioned clinical trials, as it is able to distinguish between control and HD. These assessments can be adapted to large animal models.
At the time of clinical diagnosis, significant degeneration and brain atrophy is present in HD patients; therefore, therapeutic intervention before onset of clinical symptoms is of great importance [18]. The autosomal dominant inheritance pattern of HD allows for the study of pre-manifest HD in patients with affected family members. In pre-HD patients, noninvasive neuroimaging revealed abnormalities in brain volume, neurochemistry (magnetic resonance spectroscopy; MRS) and microstructure of brain (diffusion tensor imaging: DTI), which are detectable years before onset of clinical symptoms [46–51]. Additionally, these MRI metrics correlate with clinical scores (cUHDRS) of disease progression [48, 51]. These sensitive neuroimaging metrics could facilitate tracking of the disease progression in pre-HD patients enrolled in future clinical trials.
To enable therapeutic testing in a large animal of HD, we applied the same clinical metrics used in HD patients to the OVT73 HD sheep model. The OVT73 HD sheep express a full-length human huntingtin cDNA encoding 73 polyglutamine repeats, exhibit huntingtin-positive inclusions without obvious neuronal loss and develop deficits in circadian behavior [5, 52–54]. Here we report that 7–10-year-old HD sheep recapitulate disease similar to pre-HD patients including neurological impairments, presence of mHTT in CSF, and MRI based neurochemical and microstructural alterations.
MATERIALS AND METHODS
Animals and tissue collection
Sheep were maintained at the South Australian Research and Development Institute (SARDI) in accordance with the SARDI/PIRSA Animal Ethics Committee (Approval number 19/02). Animals are kept in large paddocks typical for South Australian farming conditions in mixed control/transgenic groups of similar ages with male cohorts separate from female. A total of 62 aged-matched sheep consist of 17 males (7 HD transgenic, 10 normal) and 45 females (28 transgenic, 17 normal) were used in this study. Males were sacrificed at 7 years of age and females were sacrificed at either 9 or 10 years of age. A group of sheep (5 transgenic female, 4 normal female) were studied twice at 9 year and 10 years of age for the longitudinal study. Cerebrospinal fluid (CSF) and blood samples were collected from all sheep at the time of imaging. For sheep in the longitudinal study, an additional blood and CSF collection was also performed one year before the humane endpoint. Sheep were euthanized using 150 mg/kg sodium pentobarbital overdose. Brain, spinal cord and peripheral tissues were collected for storage at either –80°C or in 10% neutral-buffered formalin. Sheep genotypes were confirmed by PCR amplification of genomic DNA (DNeasy Blood and Tissue Kit; Qiagen, Valencia, CA, USA), extracted from liver, using primers described in [53].
Neurological examination
Standard veterinary neurological examinations including gait, proprioception, and strabismus (loss of eye coordination) assessments were performed on aged-matched transgenic and control male (7 years old) and female sheep (9 and 10 years old). The neurological exams were scored using discrete numbers from 1 to 5 with increasing scores as the response worsens. However, the clinical rating score is calculated by taking the average of all scores, therefore, clinical rating scores contain decimal numbers.
Measurement of mHTT in CSF
Measurement of mHTT was performed by Evotec SE (Hamburg, Germany) using single molecule counting (SMC) assay on CSF collected from control and transgenic sheep in longitudinal study (HD female, n = 5; normal female, n = 4). Evotec’s SMCxPro assay 142 (utilizing antibody combination 2B7/ MW1) was performed with CSF in dilution ratios of 1 : 2 in artificial CSF (aCSF; supplemented with 1% Tween-20 and complete protease inhibitor), applying 150μl of diluted CSF per well for analysis. Technical triplicates of each sample were analyzed for expanded mutant HTT levels by SMCxPro assay 142. HTT levels per sample (in fM) were calculated in reference to the standard curve (using recombinant protein HTT-Q73, a large fragment of 1-573 aa of human HTT, as a standard for assay 142) and analysis was done with 5PL-fit for the dilution curve by GraphPad PRISM software. Measurements were performed in technical triplicates. Several samples were below LOD (for the normal control) and thus not quantifiable.
T1-weighted MRI acquisition
A total of 62 aged-matched sheep consisting of 17 males (7 transgenic, 10 normal) and 45 females (28 transgenic, 17 normal) underwent 3T magnetic resonance imaging (MRI) (Siemens Magnetom Skyra, Siemens Healthcare, Erlangen, Germany) and T1-wieghted images were collected. Before imaging, sheep were pre-medicated with dexmedetomidine (15μg/kg). Sheep were anesthetized using isoflurane administered via a face mask followed by intubation. During MRI anesthesia was maintained by isoflurane gas (1–3%). Age-matched transgenic and normal males and females were imaged simultaneously. Males were imaged at 7 years of age. Females were imaged at either 9 or 10 years of age. For the longitudinal study, five transgenic and 4 normal females were imaged at both 9 and 10 years of age. T1-weighted images were acquired using the following sequence parameters: repetition time (TR)=2360 ms, echo time (TE)=2.78 ms, inversion time (TI)=1190 ms, 3 signal averages, voxel size of 0.6X0.6X0.6 mm3 and were used for structural identification and a template for the MRS voxel positioning and DTI image registration.
MRS and analysis
MR spectra were obtained using single-voxel spectroscopy method in right striatum following shimming. Scan parameters included 9X9X15 mm3 voxel size, repetition time (TR)=2170 ms, echo time (TE)=30 ms, 144 signal averages and spectral bandwidth was 1200 Hz. The LCModel basis set for Philips was used for analysis (https://www.s-provencher.com/pages/lcmodel.shtml). Standard deviations higher than 30% were excluded. The examined metabolites include: tNAA (summed N-acetylaspartate [NAA] and N-acetylaspartylglutamate [NAAG], neuronal integrity marker), tCr (summed creatine [Cr] and phosphocreatine [PCr], brain energy metabolism and potential gliosis marker), tCho (predominantly glycerophosphocholine [GPC] and phosphocholine [PCh], marker of neuronal membrane turnover), Glu+Gln (glutamate [Glu], glutamine ([Gln], neurotransmission), glutathione ([GSH], oxidative status), and myo-inositol ([Ins], gliosis marker). Each metabolite concentration in the transgenic and normal cohort was normalized to the average of that metabolite concentration in the normal sheep cohort collected at the same time point. The percentage of difference of average normalized concentration of each metabolite between transgenic and control group was calculated and plotted. For longitudinal MRS study, spectra of five transgenic and 4 normal female sheep were acquired at both 9 and 10 years of age, and concentrations were normalized to average of concentrations of normal females in the longitudinal study for that age. The normalized metabolite concentration for 9 and 10 years of age were plotted.
DTI and analysis
Diffusion images were acquired using a 2D EPI diffusion sequence. DTI data were collected at b-value of 1000 s/mm2 with 256 diffusion directions, diffusion mode of MDDW and diffusion scheme of Bipolar. DTI was acquired, at two different voxel sizes. Seven-year-old males, a group of 9-year-old females and sheep in the longitudinal study were imaged using the sequence with voxel size of 2.5X2.5X2.5 mm3, TR = 3000 ms, TE = 87 ms. To acquire data at higher resolution, a group of 9-year-old females and 10-year-old females were imaged using the sequence with voxel size of 2X2X2 mm3, TR = 3000 ms, TE = 99 ms. Transgenic and normal sheep DTI data were grouped and compared based on the voxel size and gender. The diffusion images were processed using the DSI Studio software package (June 22, 2016 version, http://dsi-studio.labsolver.org) using tract-based analysis method. Quality of images were inspected before analysis and any image affected by motion or any other artifact was rejected. In DSI-studio, diffusion MR images were converted into SRC file. A brain mask was then conformed onto the source image and the mask was adjusted by alteration of a threshold to select the brain tissue precisely. Adjustment of the mask was completed based upon an individual basis and included removing external fragments as well as smoothing and dilating the mask as necessary. Upon finalizing the mask, the image was reconstructed into a FIB file using the DTI reconstruction method. Regions in motor, parietal and occipital cortices, corpus clausum, rostral and caudal internal capsule and midbrain were defined. To draw the ROIs, voxels were selected manually to include the white matter within the target structure. A deterministic fiber-tracking algorithm was used within DSI Studio, and a seeding region was placed at whole brain in addition to the ROI. Within each region a maximum of 10,000 tracts were analyzed with fiber length min/max of 30/300 mm, 60° angular threshold and 1 mm step size. DTI scalars including fractional anisotropy (FA), apparent diffusion coefficient (ADC), axial diffusivity (AD) and radial diffusivity (RD) were calculated.
Statistical analysis and power analysis
Graphpad Prism 8.0 (GraphPad Software, San Diego, CA) was used for statistical analysis. Significant difference was defined as p < 0.05. Clinical rating scores for neurological deficits were analyzed by Mann Whitney tests, and effect was determined by a Hodges-Lehmanm test. Neurological scores compared by sex (Fig. 1B, HD vs. normal and male vs. female) were analyzed using two-way multiple comparison ANOVAs following with appropriate post-hoc analysis using Bonferroni’s and t-tests. To perform statistical analysis on DTI scalars and MRS, we tested for Gaussian distribution of each group of sheep using D’Agostino and Pearson test. 7-year-old males and 9-year-old females did not follow Gaussian distribution, therefore, to compare HD sheep vs. age/sex matched control sheep, non-parametric Kruskal-Wallis test followed by Dunn’s test was performed. 10-year-old HD sheep followed Gaussian distribution, therefore, to compare them with their age/sex matched control sheep one-way ANOVA was used followed by Dunn’s test. Statistical comparison of slopes of lines connecting DTI scalars of 9- to 10- year-old sheep was done using non-parametric Kruskal-Wallis test followed by Dunn’s test due to non-Gaussian distribution of slopes (tested by D’Agostino and Pearson test). To perform correlation analysis, Normal distribution of data was investigated using D’Agostino and Pearson test. Correlation analysis for data with normal distribution was performed using Pearson test. For non-normal distribution, Spearman correlation analysis was used. A two-tailed p-value determined the significance of correlation. Power analysis was performed using the sample size calculator (ClinCalc.com) where two independent groups with continuous mean were used to determine the sample size (Alpha 0.05, Power 80%). Effect size was calculated by dividing the difference of the means of two group by standard deviation.
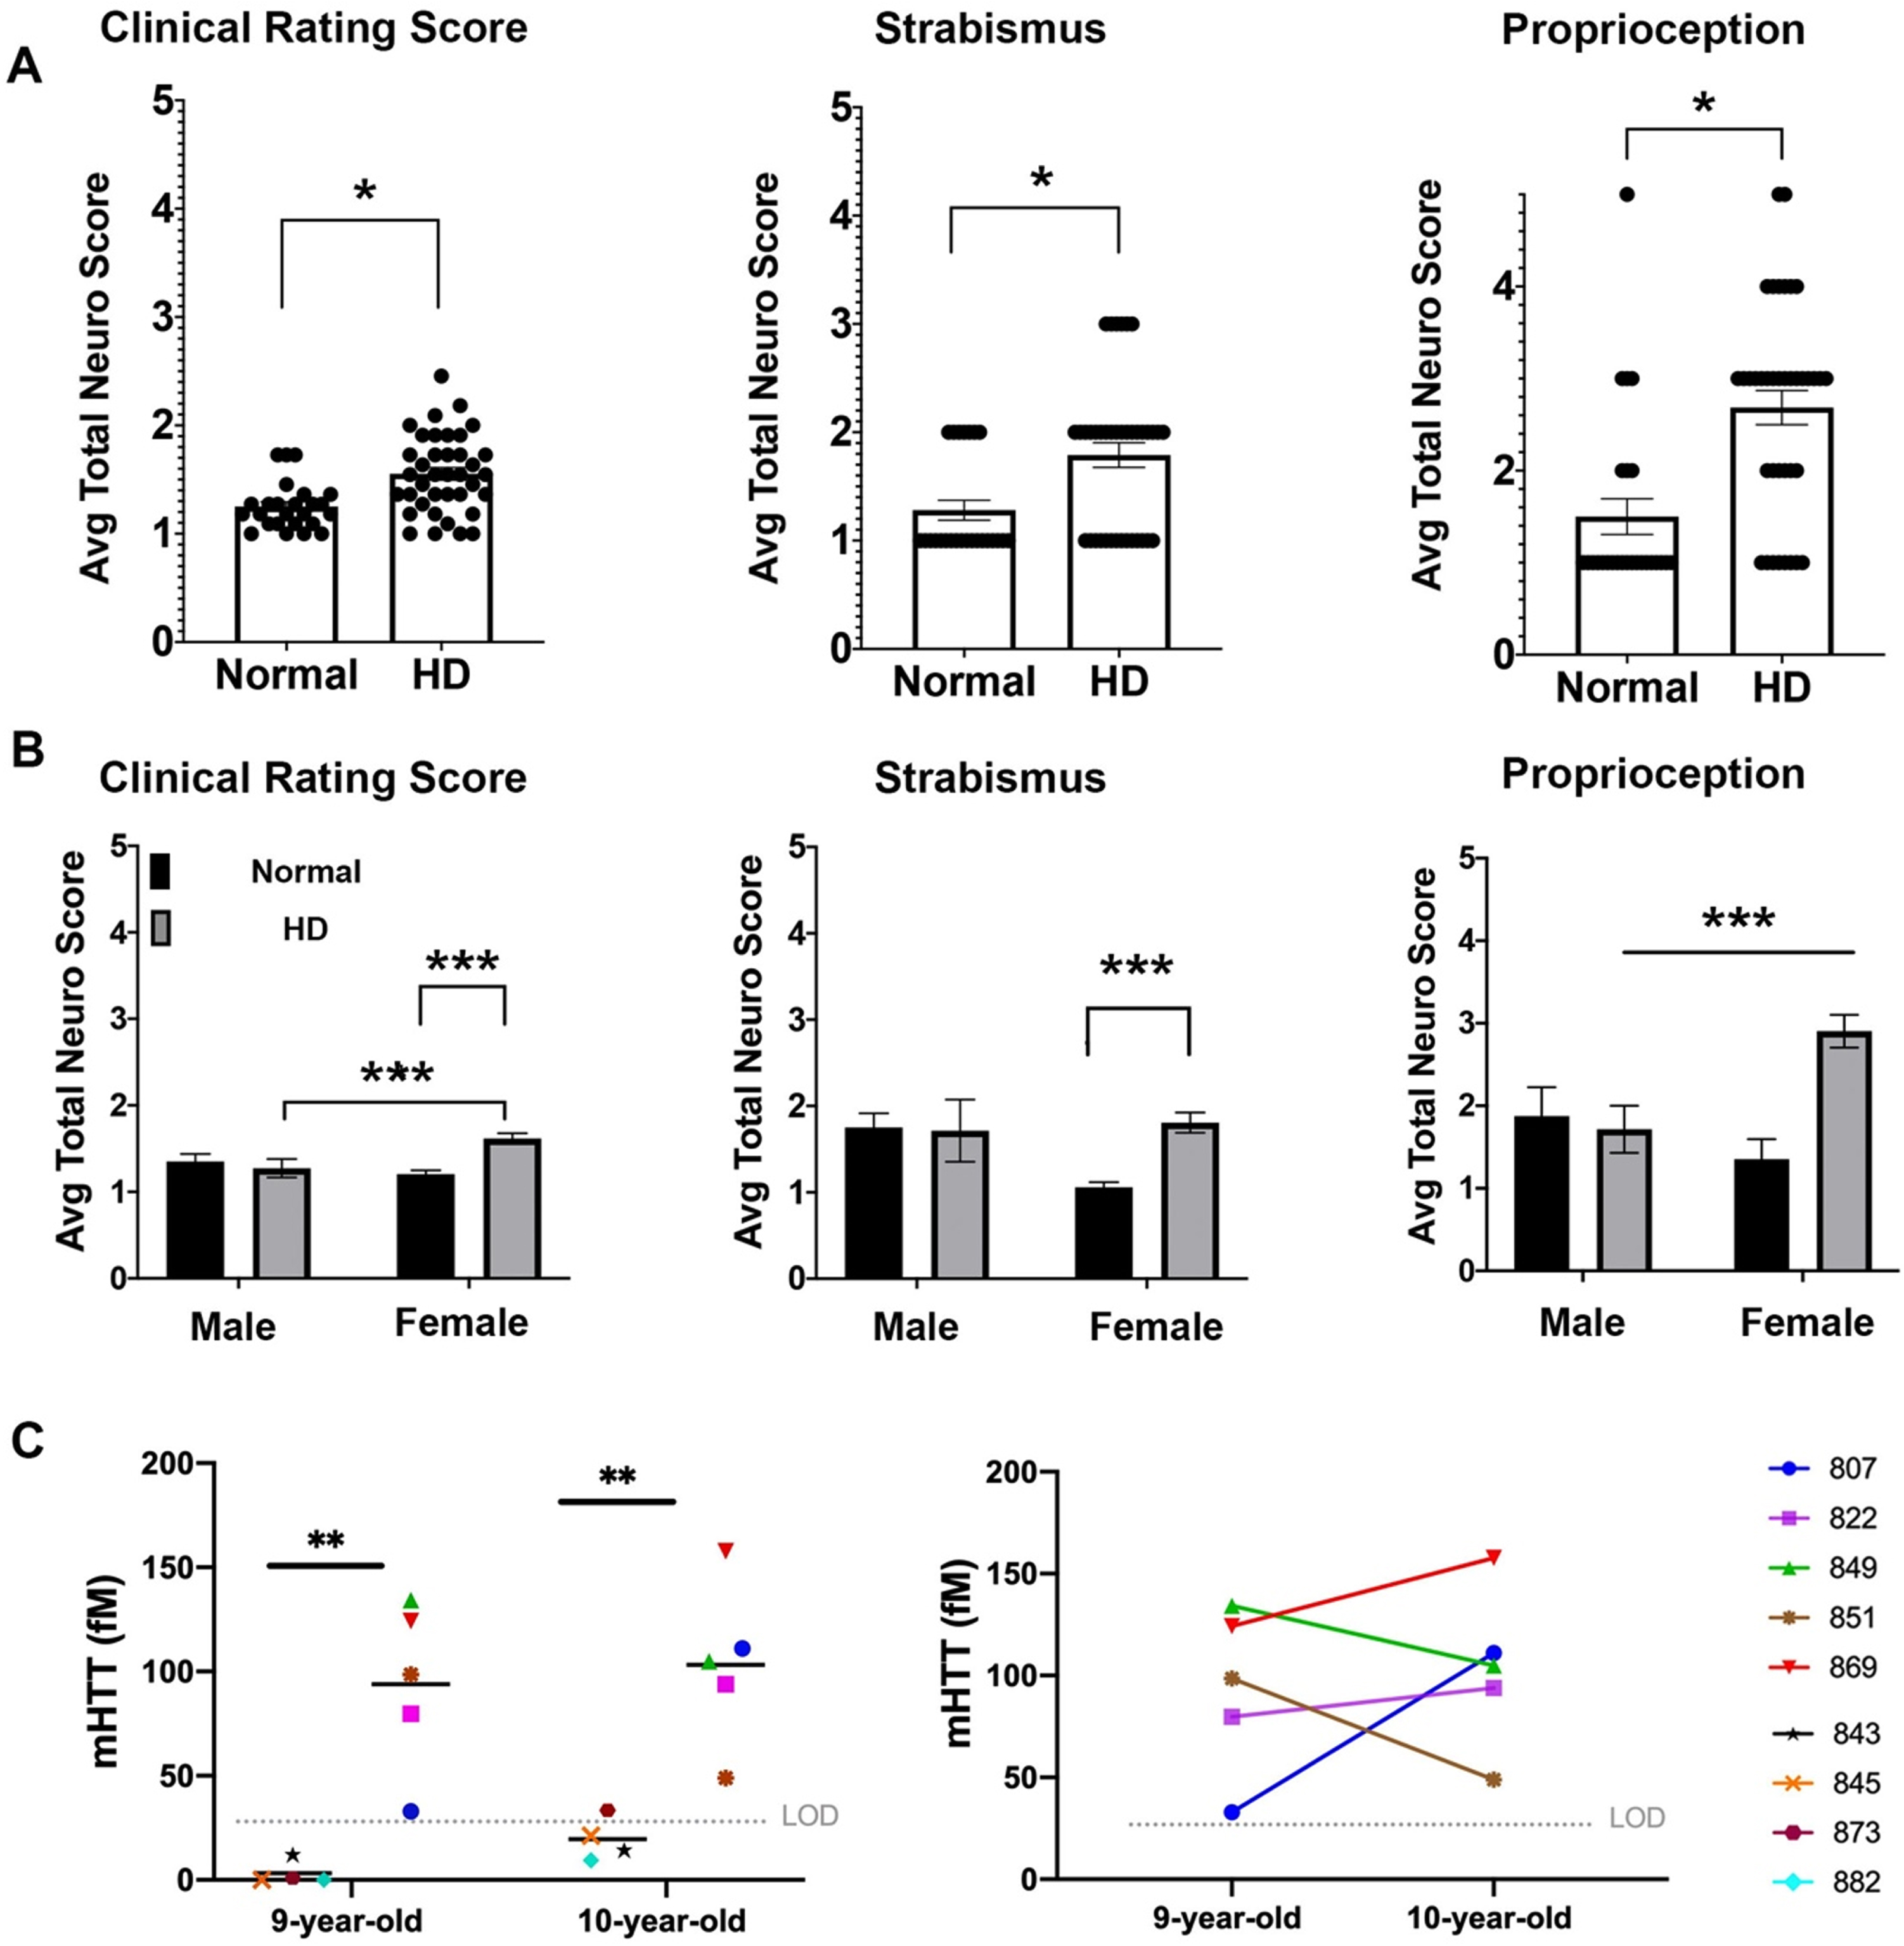
Neurological deficits of HD sheep. Neurological response of sheep described by scoring from 1 to 5. Normal score is 1 and scores increase as responses worsen. A) Clinical rating scores of HD male and female were significantly higher than normal sheep. In particular, HD sheep showed significant deficit in strabismus and proprioception (*p < 0.05). (HD total n = 38, normal total n = 25, HD females n = 31, HD males n = 7, normal females n = 17, normal males n = 8). B) HD females showed sever signs of neurological deficit as compared to males (***p < 0.001). C) Cerebrospinal mHTT levels in females sampled at 9 and 10 years of age (HD n = 5, normal controls n = 4). mHTT levels for normal sheep was below the limit of detection (left, **p < 0.006). Three HD females showed an increase in mHTT level from 9 to 10 years of age (right).
RESULTS
Neurological impairment noted in HD sheep
To assess neurological status of the HD sheep, standard veterinary neurological exams were performed on HD (n = 7 male, n = 28 female) and normal sheep (n = 10 male, n = 17 female) [55]. The neurological exam was consolidated to parameters with abnormalities exhibited by the HD sheep that inform on eye coordination, proprioceptive deficits, gait, and postural changes. These parameters were then aggregated in a clinical rating scale (1 to 5; normal = 1 with increasing scores as the response worsens). The clinical rating score of the HD sheep is significantly higher (p < 0.05) as compared to normal sheep (Fig. 1A). This score can be subdivided into the following parameters: HD sheep exhibit difficulties in maintaining their eye coordination while their head is lifted (strabismus, p < 0.05) and they have reduced correction of their hind limbs when legs are crossed over each other while standing (proprioception, p < 0.05). The gait and postural scores are not different than normal control animals. The clinical signs were more predominant in HD females (Fig. 1B) as compared to normal females and HD male sheep (p = 0.001 and p < 0.001 respectively, interaction score 0.0068 (clinical rating score)). Strabismus score was significantly higher in HD female than normal female sheep (p = 0.0007). HD female sheep scored significantly higher on proprioception compared to normal female sheep (p < 0.001) and HD males (p = 0.383) (interaction score = 0.0076, column score = 0.028); however, male sheep were 7 years old and female sheep were 9 and 10 years old. Therefore, significant decline of clinical rating scores and proprioception in HD female as compared to HD males could be, in part, driven by age differences (Fig. 1B).
Mutant huntingtin concentrations in CSF correlates with neurological scores
To determine the concentrations of mutant huntingtin (mHTT) in CSF of HD sheep and investigate change over a year, CSF of female HD sheep (n = 5) and normal female sheep (n = 4) were sampled and analyzed at 9 and 10 years of age. The mHTT concentrations at both time points were significantly higher than normal, where normal levels remained in lower limit of detection except one 10-year-old normal sheep (Fig.1C-left, p < 0.006). This discrepancy is attributed to assay variability. Three HD sheep showed an increase in mHTT level, and two HD sheep showed a decrease over the course of one year (Fig.1C-right). Levels of mHTT for sheep in longitudinal study summarized in Supplementary Table 1.
Microstructural changes in HD males and females indicate white matter alterations
To assess the microstructural changes of white matter in HD sheep model, diffusion tensor imaging (DTI) was performed on HD sheep (n = 7 male, n = 28 female) and normal sheep (n = 10 male, n = 17 female). The female cohort was subdivided into two groups due to changes in the DTI acquisition voxel sizes between years; where one group of 9-year-old female sheep were imaged at voxel size 2.5 mm and another group of 10-year-old females were imaged at voxel size 2 mm. DTI scalars were calculated in seven ROIs of brain including motor, occipital and parietal cortices, rostral and caudal internal capsule (Fig. 2A), corpus callosum and mid brain (data not shown). Our results demonstrate that directionality of water diffusion along the axon in white matter, represented by fraction of anisotropy (FA, Fig. 2B), trends towards a reduction throughout the HD sheep brain compared to age-matched controls (1% –9% reduction of FA; Supplementary Figure 1).
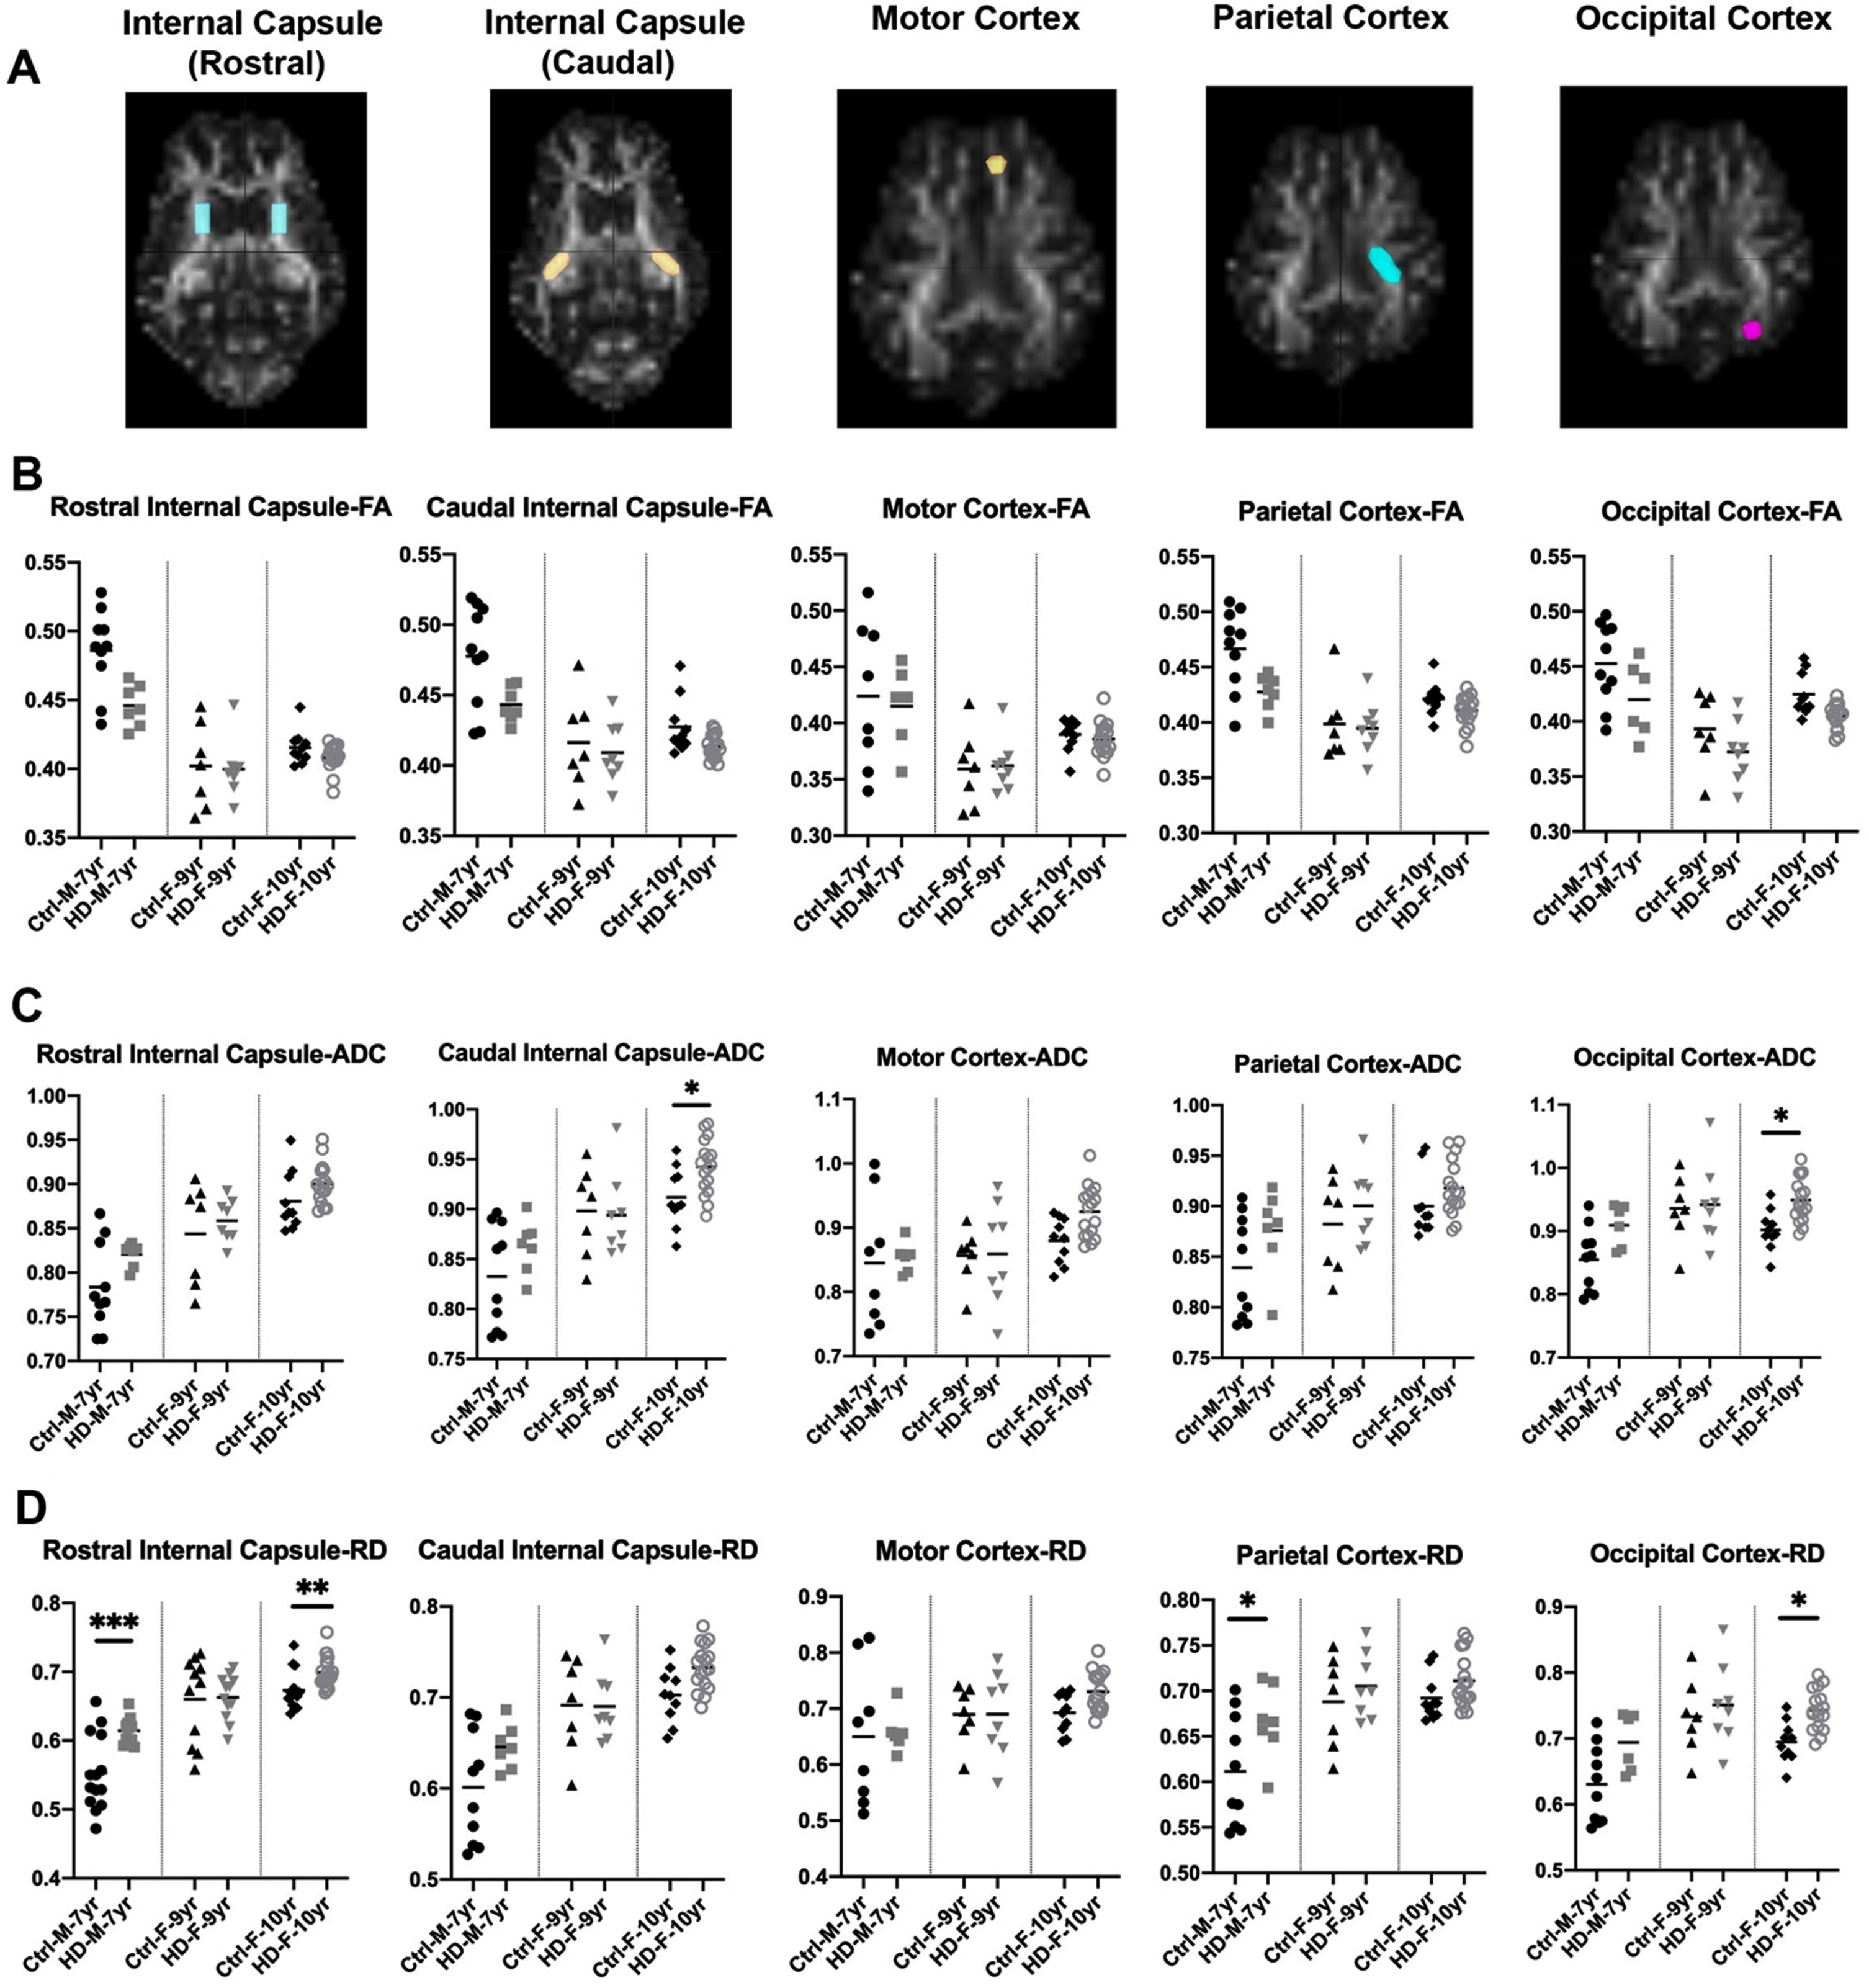
DTI scalars in HD and 7-year-old control male sheep (HD n = 7, normal n = 10) and 9-year-old female sheep (HD n = 8, normal n = 7) and 10-year-old female sheep (HD n = 17, normal n = 10). A) DTI scalars were calculated in regions of interest (ROIs; colored on MRI images) located in rostral and caudal internal capsule, motor cortex, parietal, and occipital cortex. B) HD males and females showed trends towards a reduction in the directionality of water diffusion in white matter along the axon (FA) as compared to control sheep. HD males and females showed significant increase or trends toward increased water diffusion in (C) all directions of white matter (ADC) and (D) throughout the white matter boundaries perpendicular to the axon (RD) as compared to control sheep (*p < 0.05; **p < 0.01; ***p < 0.001). M and F in the title of X axis represent male and female sheep respectively.
To better evaluate loss of boundaries and organization of white matter in HD sheep model, additional three DTI scalars were calculated that describe overall diffusivity (ADC), diffusion parallel to (AD; data not shown) and perpendicular (RD) to the axonal white matter (Fig. 2C, D). Overall water diffusion in white matter, represented by ADC, trends towards an increase in all directions throughout the HD white matter compared to age-matched controls (1% –20% increase in ADC; Supplementary Figure 1). Significant increases in ADC in caudal internal capsule and occipital cortex of 10-year-old female HD sheep (p < 0.05) was noted (Fig. 2C). HD sheep trend towards increased water diffusivity throughout the white matter boundaries (perpendicular to the axon), represented by RD, as compared to age-matched controls (1% –25% increase in RD; Supplementary Figure 1). This increase is significant in the rostral internal capsule (p < 0.001) and the parietal cortex of HD males (p < 0.05), and rostral internal capsule (p < 0.05) and occipital cortex of 10-year-old HD females (p < 0.05), shown in (Fig. 2D). A significant increase was noted in water diffusion along the white matter (AD) in corpus callosum of 7-year-old rams (p < 0.05) and motor (p < 0.01) and occipital cortex (p < 0.02) of 10-years-old HD females (data not shown). Water diffusion in the corpus callosum (ADC, RD) and midbrain was not statistically different between HD and normal sheep (data not shown).
HD sheep white matter shows longitudinal disease worsening
Figure 3 evaluates disease progression over time. DTI was conducted on HD females (n = 4) and age-matched normal females (n = 3) over a course of one-year. Figure 3 shows the DTI scalars (FA, ADC, RD) of individual HD and normal sheep. Normalized DTI scalar values in control sheep remained around 1±0.1 over course of one year (Fig. 3B–D bottom; n = 3). Directionality of water diffusion in white matter (FA) in 9-year-old HD females (Fig. 3B top, n = 4) suggest a decrease in FA in three of the HD females over a year. Water diffusion in all directions in white matter (ADC) over a year increased for majority of nine-year-old HD females as compared to controls in (Fig. 3C top). An increase in diffusivity through the white matter tracts (RD), was noted in the majority of nine-year-old HD females in the selected regions (Fig. 3D top) over a year when compared to controls. The same trend was observed for diffusivity along the white matter tracts (AD) (data not shown).
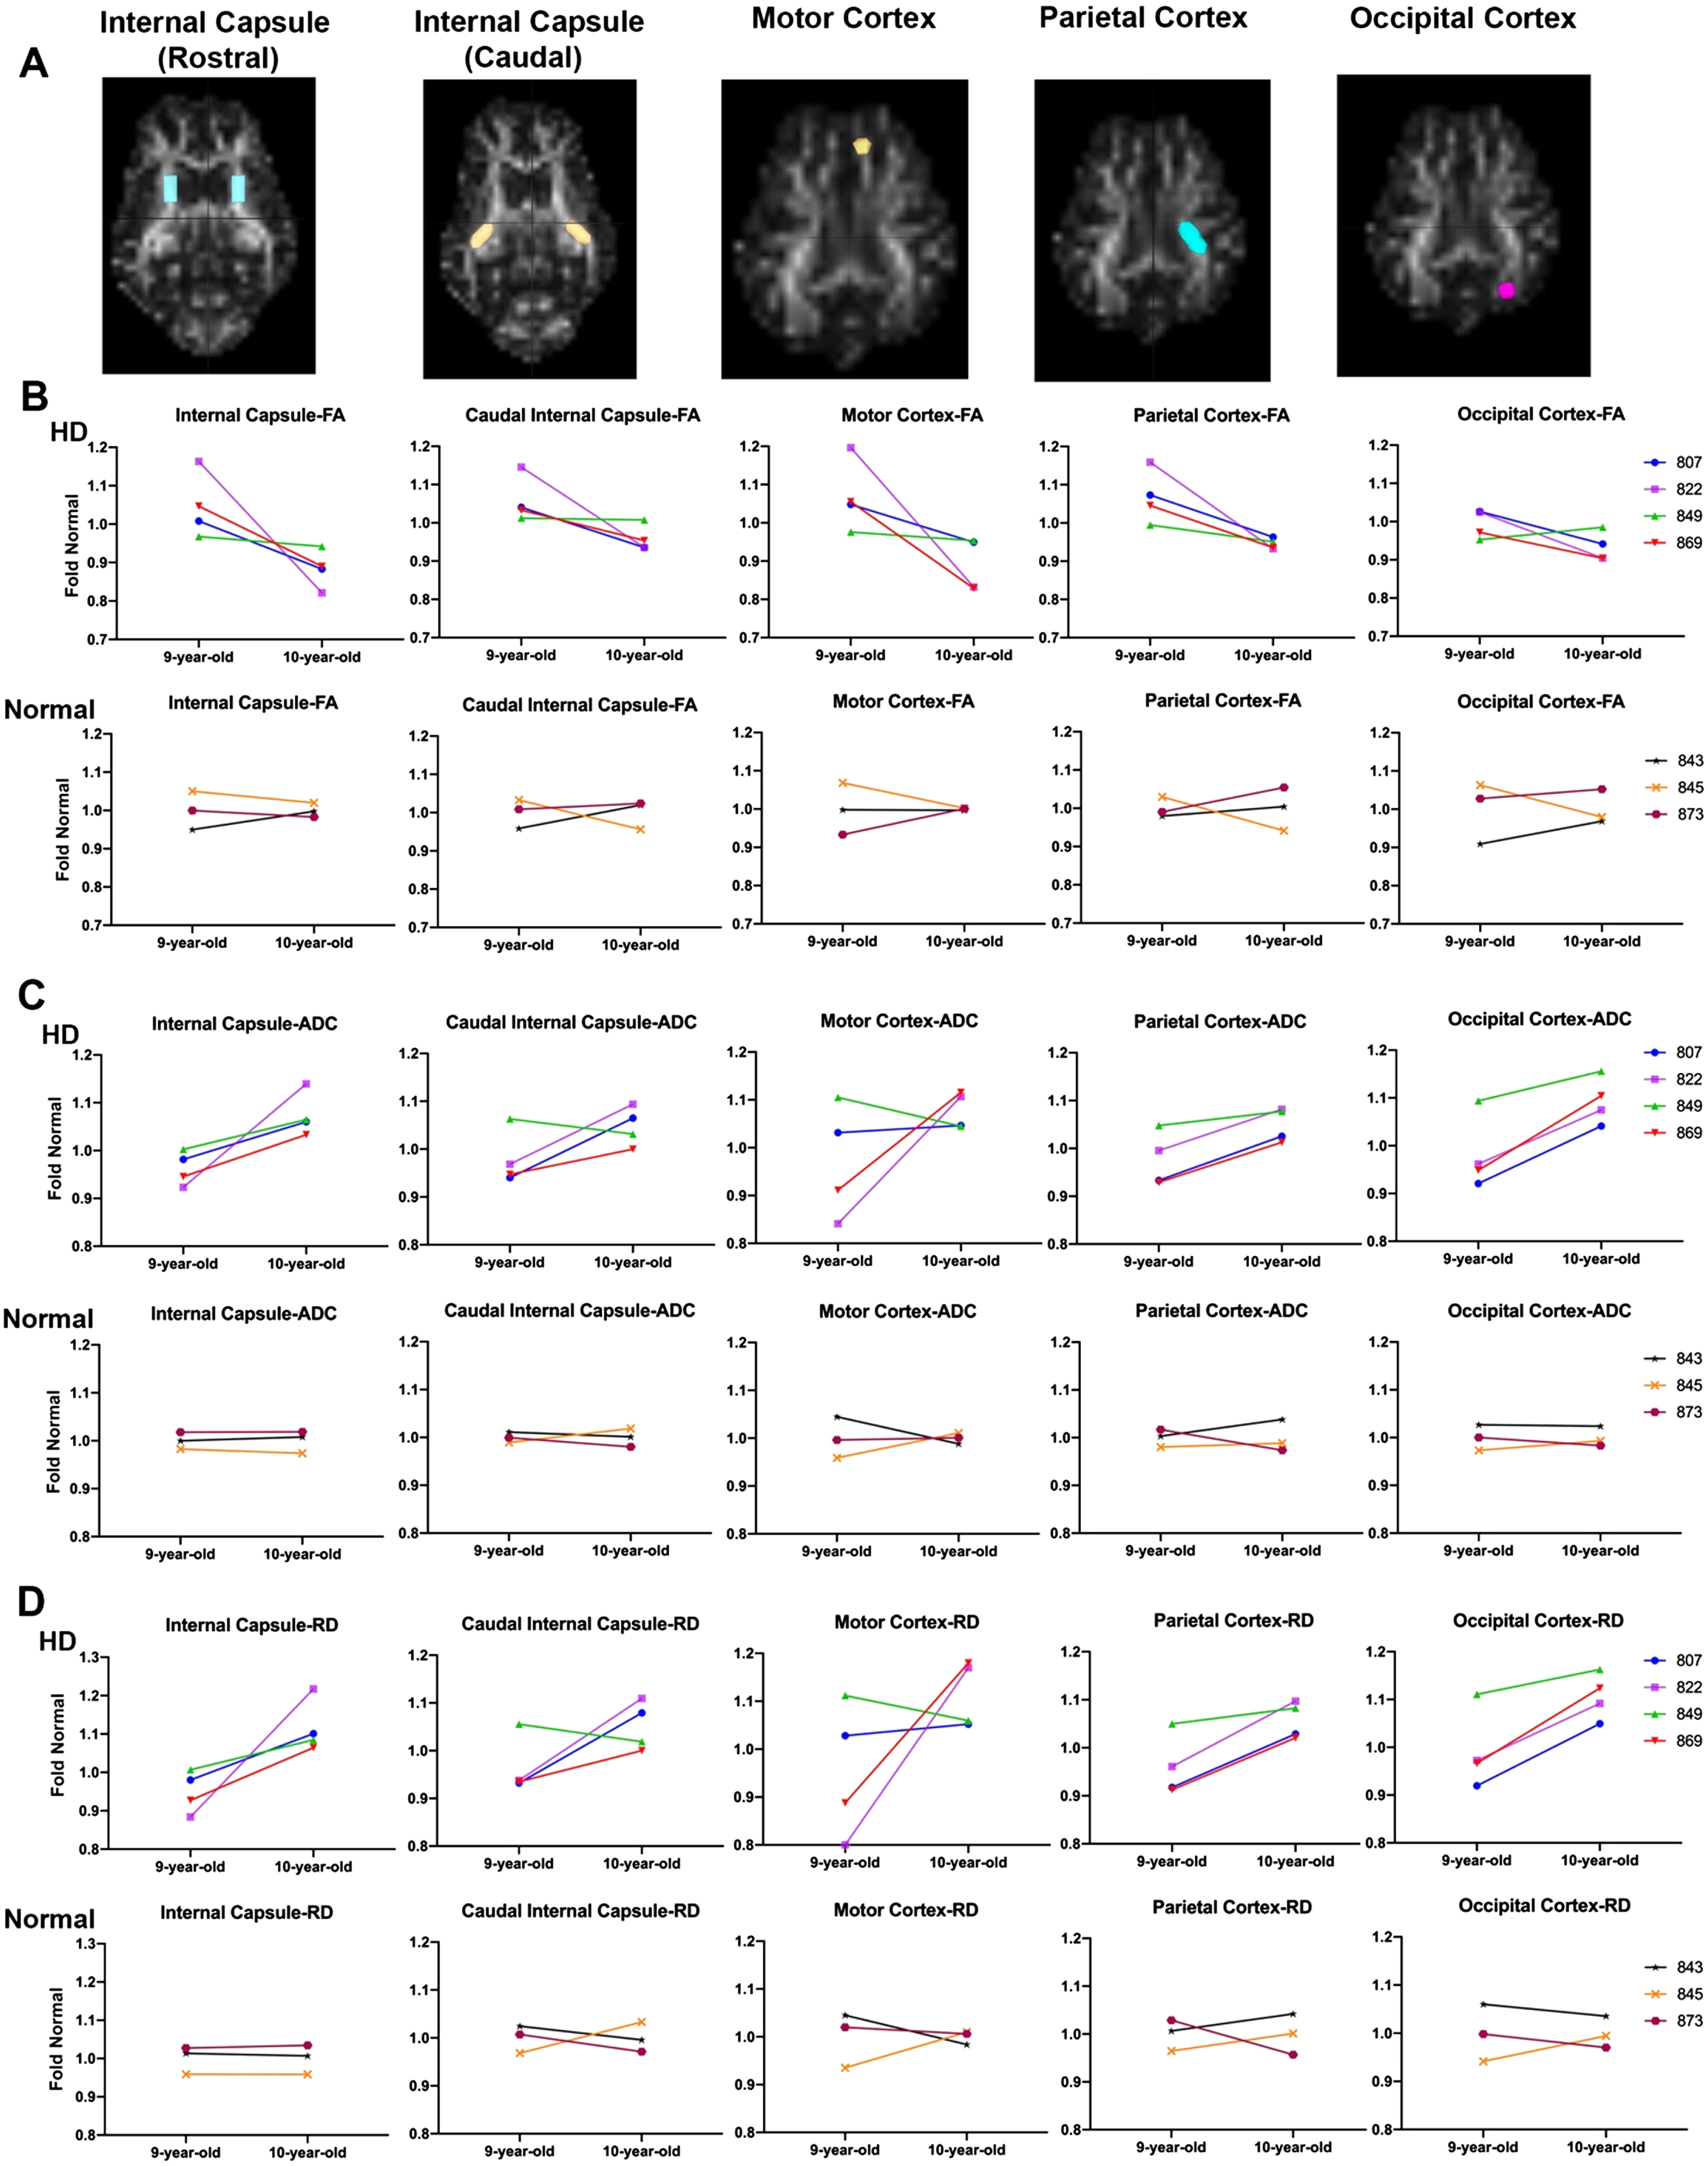
DTI scalars calculated longitudinally in HD (n = 4; purple, top panel) and control females (n = 3; bottom panel) at 9 years of age and again at 10 years of age. A) DTI scalars were calculated in regions of interest (ROIs) located in rostral and caudal internal capsule, motor, parietal and occipital cortex. B) Directionality of water diffusion along the axon in white matter (FA) decreased in females from 9 to 10 years of age (top; in red, green, purple, and blue) compared to normal controls (bottom; in orange, maroon and black). B) Similarly, water diffusion increased in all directions of white matter (ADC; C) and throughout the white matter boundaries (RD; D) over one year. DTI scalars for control sheep remained 1±0.1.
Comparison of the slopes of lines connecting fold normal of DTI scalars from 9 to 10 years in HD and normal sheep indicates a significant difference between HD and normal controls in RD, calculated in rostral internal capsule region (Fig. 3D, p < 0.046). This is best appreciated in comparing the slopes of fold normal of DTI scalars from 9 to 10 years. The slope measured longitudinally in individual HD sheep varies in severity across animals, but animals with the most significant DTI scalar change tend to represent it across brain regions. For example, HD sheep 822 (Fig. 3-shown in purple) shows maximum change in all DTI scalars calculated in the rostral and caudal internal capsule as well as the cortices (maximum decrease in FA and maximum increase in ADC and RD). On the other hand, HD sheep 849 (Fig. 3, shown in green) shows the minimum change in all DTI scalars calculated in rostral and caudal internal capsule and cortices. No statistical difference in slope differences was noted across other brain regions.
White matter changes in HD males and females correlates with mHTT levels and neurological scores
mHTT in CSF of HD females at 9-and 10-years of age (n = 4, each time point) nearly correlates with DTI scalars in the occipital cortex of HD sheep (Fig. 4A). This includes trends towards significance for correlation of mHTT in CSF with directionality of water diffusion (FA) in occipital cortex (r = –0.7030, p = 0.0518), overall diffusivity (ADC) in occipital cortex (r = 0.5968, p = 0.1183) and diffusion throughout the white matter boundaries (RD) of occipital cortex (r = 0.6458, p = 0.0836).
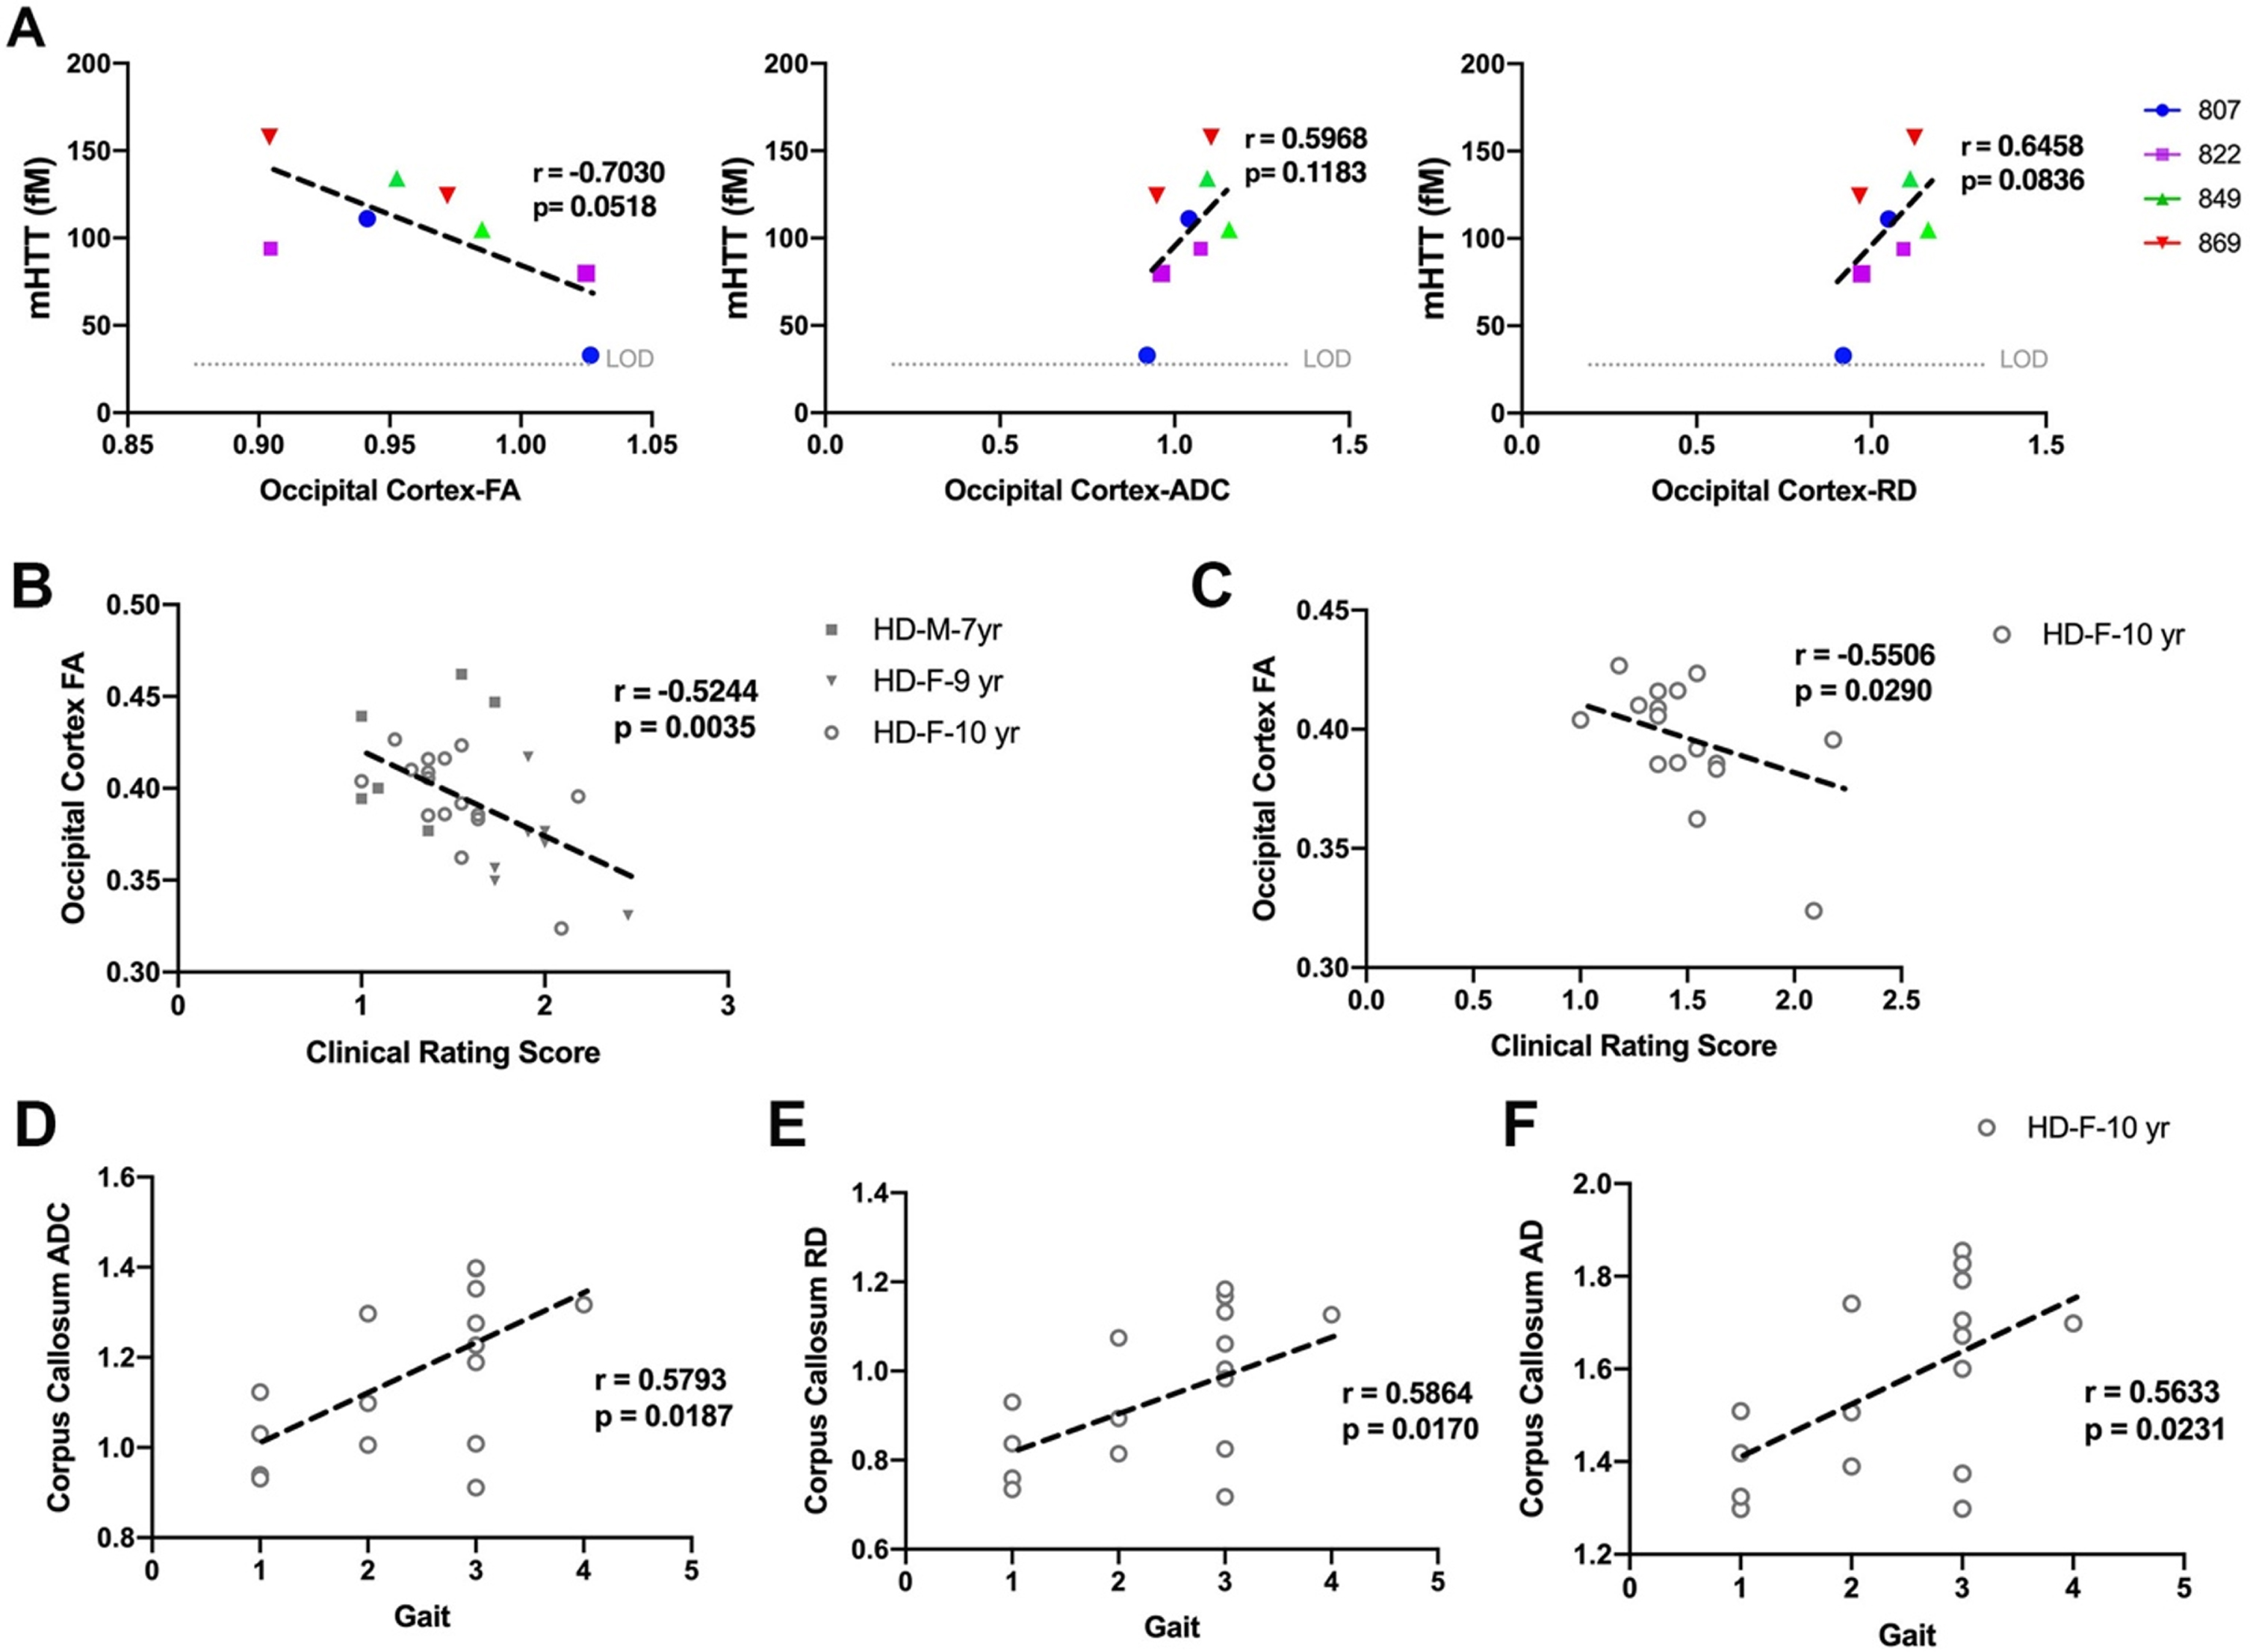
Correlation of DTI scalars with mHTT levels in CSF and neurological scores. A) mHTT levels in CSF of HD females (n = 5) sampled at 9 and 10 years of age nearly correlates with directionality of water diffusion (FA), overall diffusivity (ADC), and diffusion through the white matter boundaries (RD) of occipital cortex. Occipital cortex-FA showed significant correlation with clinical rating score in B) males (n = 7) and females (n = 25) combined and C) 10-year-old females. D–F) DTI scalars (ADC, RD, AD) calculated in corpus callosum of 10-year-old females (n = 17) showed significant correlation with gait scores. M and F in the legends represent male and female sheep respectively.
DTI scalars calculated in white matter of HD males and HD females, showed significant correlation with neurological scores (Fig. 4B–F). The decrease in directionality of water diffusion in occipital cortex (FA) of HD males and HD females showed significant correlation with clinical rating scores (Fig. 4B, r = –0.5244, p = 0.0035). Decreased directionality of water diffusion through the white matter boundaries (FA) in occipital cortex of 10-year-old HD females significantly correlated with their clinical rating scores (Fig. 4C, r = –0.5506, p = 0.0290). Corpus callosum of 10-year-old HD sheep showed correlation of ADC, RD, and AD with gait scores (Fig. 4D–F, ADC: r = 0.5793, p = 0.0187; RD: r = 0.5864, p = 0.0170; AD: r = 0.5633, p = 0.0231).
Changes in brain metabolites of HD sheep indicate disease condition and correlates with neurological scores
To assess the neuro-chemical status of HD sheep brain, MRS spectra were obtained from striatum of 9- and 10- years old HD females (n = 28), age-matched normal females (n = 17), 7-year-old HD males (n = 7), and age-matched normal males (n = 10). The position of voxel located in the right striatum of sheep and a summary of the changes in metabolite concentration (%) of HD females compared to control is shown in Supplementary Figure 2A and 2B. Brain metabolite concentrations in 9-year-old HD females (Fig. 5A top, n = 5) showed longitudinal increase in gliosis (Ins) and decrease in neuronal health (NAA, NAA+NAAG) as compared to age-matched normal females (Fig. 5A bottom, n = 4) over a year. Two HD females showed an increase in markers of demyelination (GPC+PCh) from 9-to 10-years of age (Fig. 5A top, n = 5).
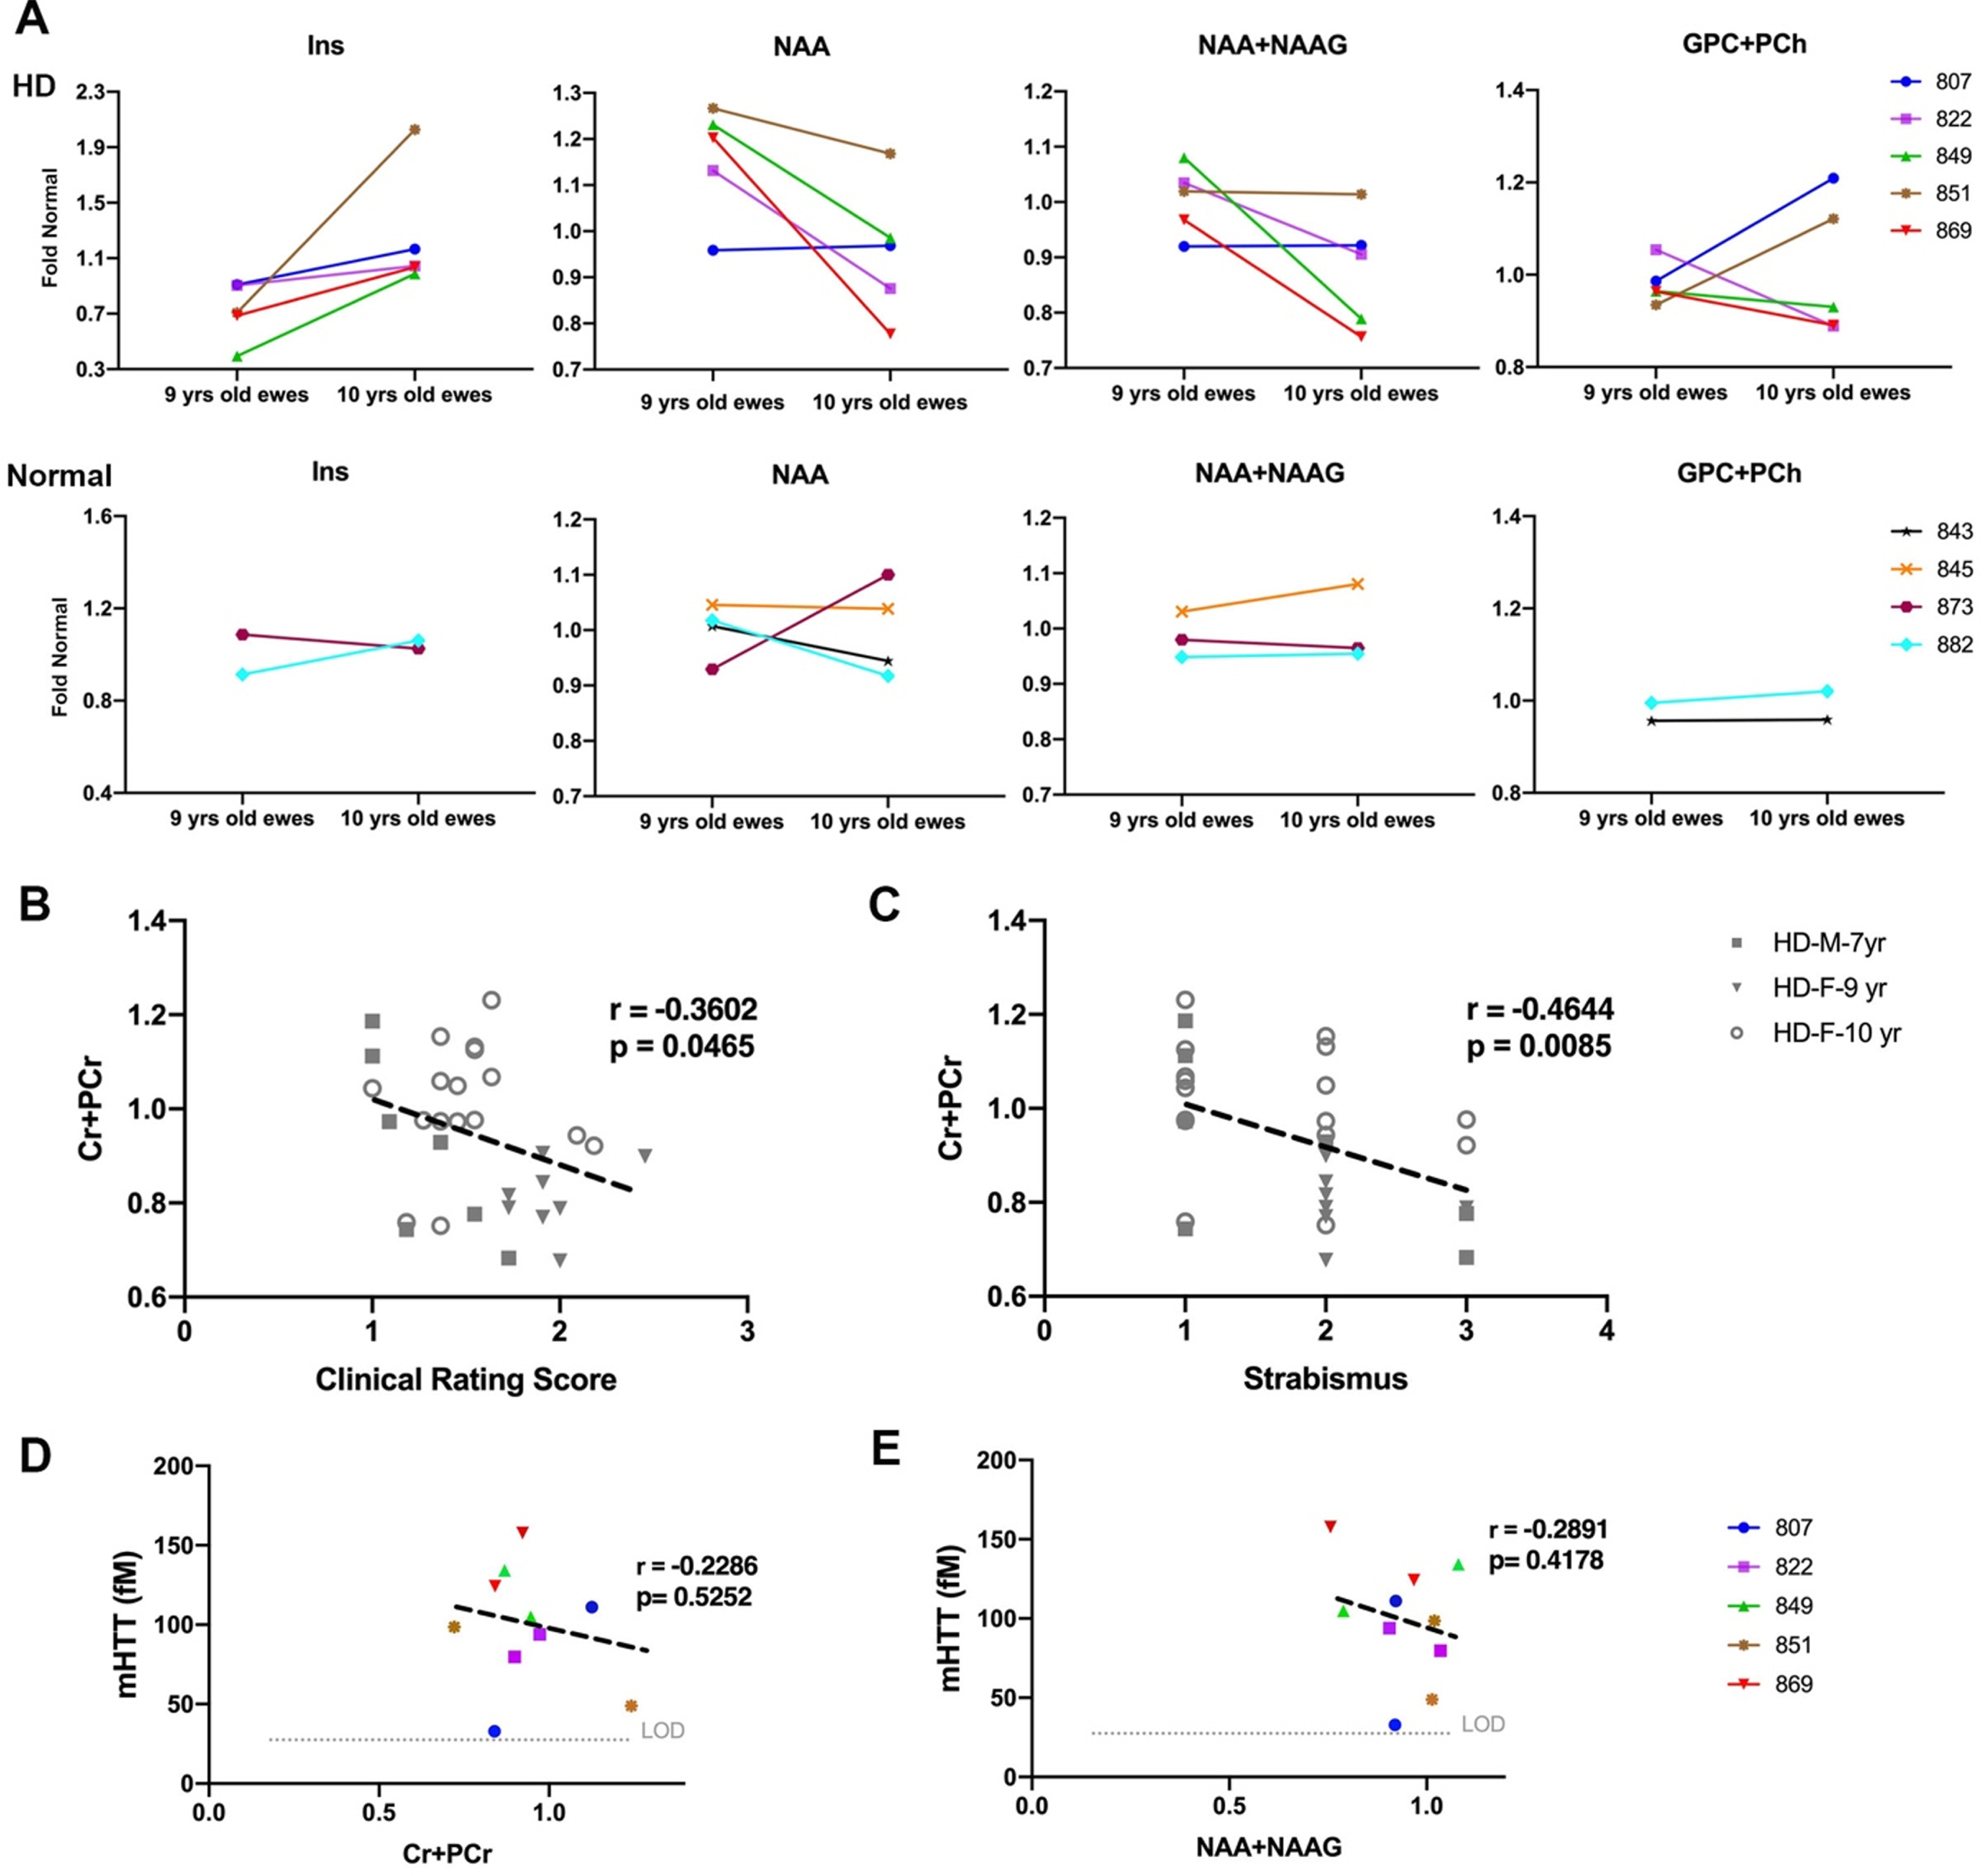
Change in metabolite concentration of HD sheep. A) Top row shows metabolite concentration of individual HD females (n = 5) sampled at 9 and 10 years of age illustrating increases in gliosis marker (Ins), decrease in neuronal health marker (NAA, NAA+NAAG) over 1 year. Two HD sheep showed increase in marker of demyelination (GPC+PCh). Bottom row shows metabolite concentrations of control females (n = 4) sampled at 9 and 10 years of age. Metabolite concentrations are normalized to the mean metabolite concentration in normal sheep. Marker of energy metabolism (Cr+PCr) for all the HD males (n = 7) and HD females (n = 25) showed significant correlation with (B) clinical rating score and (C) strabismus. mHTT levels in CSF of HD females (n = 5) sampled at 9 and 10 years of age showed negative association with (D) marker of energy metabolism (Cr+PCr) and (E) marker of neuronal health (NAA+NAAG). M and F in the legends represent male and female sheep respectively.
To evaluate correlation of metabolite concentrations with neurological scores and mHTT, correlation analysis was performed (Fig. 5B–E). For all the HD males and HD females in the study, marker of energy metabolism (Cr+PCr) showed a significant correlation with clinical rating scores (Fig. 5B, r = –0.3602, p = 0.0465) and strabismus (Fig. 5C, r = –0.4644, p = 0.0085). No significant correlation was noted between metabolite concentrations of 10-year-old female and neurological scores. Levels of mHTT in CSF showed negative association with Cr+PCr (Fig. 5D; r = –0.2286, p = 0.5252) and NAA+NAAG (Fig. 5E; r = –0.2891, p = 0.4178).
White matter changes and brain metabolite concentrations show correlations
To evaluate the relationship of white matter changes in different regions of brain with MRS metabolite concentrations in the striatum, correlation analysis was performed for HD sheep (Fig. 6). Overall diffusivity (ADC), diffusion parallel (AD), and perpendicular (RD) to axonal white matter in midbrain showed significant correlation with marker of neuronal health (NAA) for all HD sheep in the study, regardless of sex (Fig. 6A ADC: r = –0.5439, p = 0.0023; Fig. 6B AD: r = –0.5203, p = 0.0038; Fig. 6C RD: r = –0.5454, p = 0.0022).
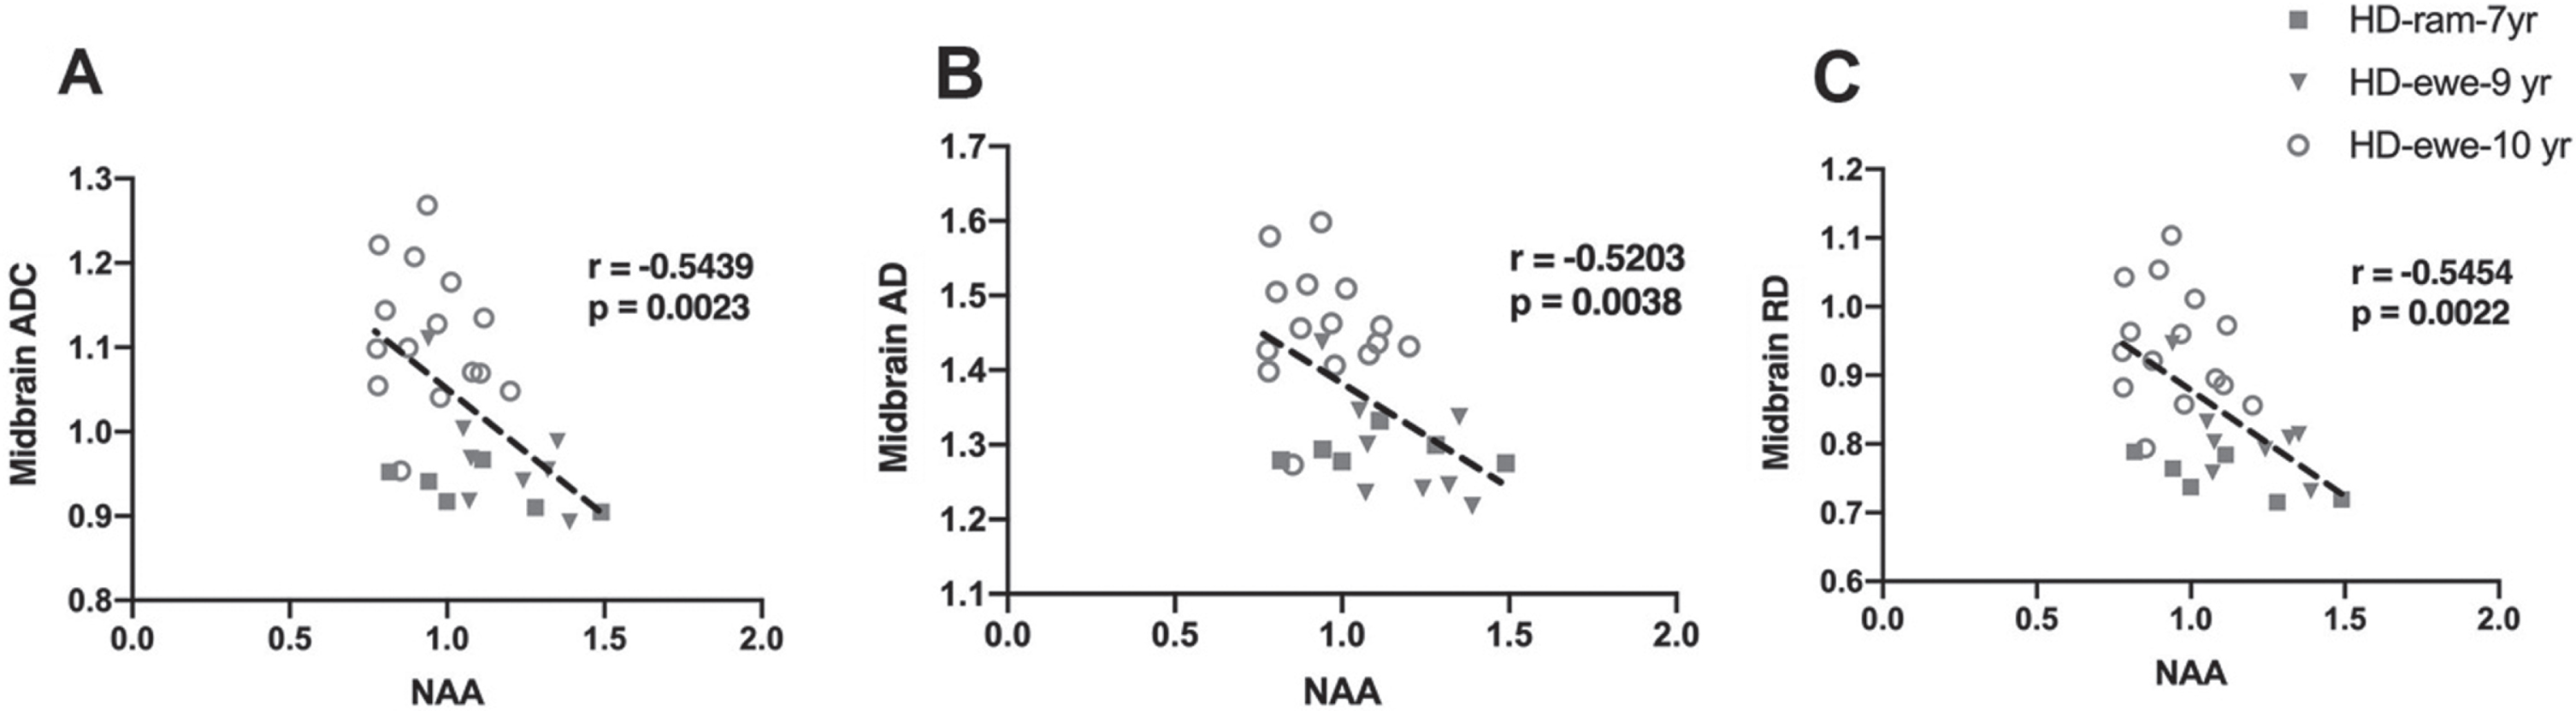
Correlation of DTI scalars with brain metabolites concentrations. A–C) Midbrain ADC, AD, and RD significantly correlated with NAA for HD males (n = 7) and HD females (n = 25).
DISCUSSION
This study characterizes changes in neurological behavior, mHTT levels in CSF, white matter microstructure, and brain metabolite concentrations of aged HD males and females as compared to their age- and sex-matched controls. White matter alterations have been reported at different stages of HD progression in animal models and HD patients as well as postmortem patients [14, 56–61]. These alterations are detected years before clinical onset of HD using non-invasive MRI techniques and shown to correlate with clinical measures [48, 62]. Interpreting DTI alterations in the HD brain solely based on the quantified changes in directionality and diffusivity is not sufficient and results need to be interpreted in light of other clinical measures. Studies in pre-HD and HD patients reported decreased FA and increased ADC and RD in various regions of white matter compared to healthy controls; however, not all pre-HD comparisons were statistically different from controls [51, 58]. In line with this, regions of white matter studied in HD male and female sheep in this study showed similar changes with similar levels of significance as pre-HD, suggesting that the sheep model may serve as a large animal model to further study white matter changes observed in the pre-HD brain. Studies of contribution of sex on progression of HD suggests that slightly more severe phenotype and faster rate of progression is present in women in motor and functional domains [63–65]. In this study, HD females showed significant worsening in proprioception, strabismus and overall clinical rating scores as compared to HD males. However, age-related differences may be at play and cannot be ruled out, as male and female groups are not age-matched and exhibit a 2–3-year difference. Further studies in age- and sex-matched cohorts are needed to address this question.
Reports from an HD-CSF study indicate that mHTT in CSF is the earliest detectable change in HD prior to changes in caudate volume and total motor score [66, 67]. The mHTT concentration in CSF reflects brain levels, increases by disease progression, and can accurately distinguish between HD mutation carriers and controls [67–69]. mHTT levels in CSF was used in the first phase I/II clinical trial of a huntingtin-lowering therapy, the intrathecally administered antisense oligonucleotide HTTRx/RG6042, to demonstrate huntingtin lowering (NCT02519036). Currently, two recruiting clinical trials have listed CSF mHTT as an outcome measure (NCT04000594 and NCT04120493). In line with HD clinical trials, mHTT was used as an outcome measure in preclinical HD sheep studies. We observed in female HD sheep that mHTT in CSF differentiated HD from normal controls similar to human studies. Interestingly, a report of longitudinal measurement of mHTT levels in CSF of pre-HD and manifest HD patients revealed a decrease of mHTT levels in a few HD patients [70]. Likewise, an increase in CSF mHTT in three HD females and a decrease in two HD females was noted over the course of 1 year. We hypothesize that the decrease in mHTT levels of the two HD female sheep in this study may recapitulate that reported in HD patients and stems from inherent longitudinal sampling variability of CSF mHTT. Reports from premanifest and early/mid manifest HD individuals showed significant correlations of several motor and cognitive measures with CSF mHTT protein levels [67–69]. In this study the correlations of CSF mHTT levels with neurological scores were not statistically significant, which could be result of small number of HD females (n = 5) that were analyzed for measurement of CSF mHTT levels.
Performance deficits in cognitive tasks involving a visual component have been reported in both pre- and early HD [49, 71–73]. Although visual deficits and degeneration of occipital lobe are not considered as hallmarks of HD, cumulative evidence from HD patient studies suggests that occipital regions are affected by HD at early stages [18, 75]. Additionally, atrophy of occipital cortex in pre- and manifest HD is reported [18, 77]. Associations between reduced occipital cortex thickness or grey matter volume and poorer performance on tasks with visual component is found in pre-HD and early HD patients [71, 78]. While decreased neuronal function at rest was present in associative visual cortices in manifest HD, postmortem studies have found a marked reduction in number of neurons in the occipital cortex [60, 61]. Similarly in this study, both HD male and female sheep showed abnormalities in DTI parameters in the occipital cortex that correlated with strabismus suggesting that this region of the brain may be affected to a greater degree in HD sheep. mHTT levels in CSF trended towards significance in correlation with DTI scalars measured in the occipital cortex of HD females where CSF mHTT levels increased along with alterations in directionality and diffusivity of white matter of occipital cortex of HD females.
Motor dysfunction is a common feature of HD, and in HD sheep we observed significant abnormalities in proprioception. We believe this is in part due to differences in brain organization that prevents extrapyramidal basal nuclear lesions in ungulates from resulting in movement disorders or gait propulsion abnormalities [55, 79]. In HD patients, significant correlations were reported between motor symptoms and mean diffusivity in the corpus callosum [80]. In line with this, we found significant correlation of DTI scalars (FA, ADC, AD, RD) calculated in corpus callosum with gait (proprioceptive ataxia).
Some studies have interpreted the increase in RD as indicator of myelin breakdown [58, 81]. Myelin damage has been reported in human in pre-HD and HD brain [58, 83]. In this study, in addition to increased RD in white matter of males and females, we found a trend towards an increase in the marker of demyelination (GPC+PCh) in HD females as compared to controls. These DTI and MRS findings might be an indicator of myelin damage in aged HD male and female sheep. Brain metabolite concentrations of HD females showed the same trends observed in pre-HD and HD patients [84–88], although these changes are not significant in HD sheep. As mentioned above, many of the metabolite changes reported in pre-HD patients are not significantly different from healthy controls [87]. Although previous reports of pre- and HD patients indicated the correlation of tNAA with disease burden score, this was not observed in the HD sheep. A trend towards a reduction in tNAA was noted in the HD sheep, and this discrepancy may be overcome with increased power. Interestingly in both male and female HD sheep we found significant correlation of marker of energy and metabolism (Cr+PCr) with the total clinical rating score and strabismus [84].
This study illustrates clear correlations between the DTI findings and other measures, but significant statistical difference in DTI scalars between normal and HD sheep was not achieved in the most of the analyzed brain regions. We believe this is due to low powering of the cohorts. We estimated sample size and effect size for DTI analysis based on the sheep data in this study for future study planning. Considering that regions of brain are affected differently by HD, the sample size and effect size varies by region. For brain regions that difference in DTI measure between HD and normal sheep was strongly significant (p < 0.01, p < 0.001), sample size of 12 sheep (n = 6 per group) with effect size of 1.49 was estimated (example: occipital cortex ADC-female sheep). For brain regions that show the trend in absence of significance or show weak significant difference (p < 0.05) between HD and normal sheep, sample size was in range of 50 sheep (25 per group) and effect size became in range of 0.7–0.8 (example: parietal cortex ADC male sheep, caudal internal capsule female sheep).
In summary, clinical translation of efficacious therapies in rodent models of HD requires additional testing in large animals that have closer similarities in CNS and immunophysiology to humans [89]. Here in OVT73 sheep model of HD, we showed significant correlation of MRI findings with decline in proprioception, gait, strabismus, and clinical rating scores similar to what is reported for HD patients. Although HD human studies reported significant correlation of mHTT levels with MRI findings, we did not achieve significance in this study, which could stem from analysis of CSF mHTT in a small number of sheep. These findings could be used to non-invasively assess efficacy of candidate therapeutics to modify the course of HD progression in pre-manifest sheep model of HD.
Footnotes
ACKNOWLEDGMENTS
The authors acknowledge the facilities and scientific and technical assistance of the National Imaging Facility, a National Collaborative Research Infrastructure Strategy (NCRIS) capability, at the South Australian Health & Medical Research Institute (SAHMRI). The authors would like to thank Dr. David Howland (CHDI) for his comments and helpful insight. This work was supported in part by the CHDI Foundation and BioMarin Inc.
CONFLICT OF INTEREST
The authors have no conflict of interest to report. Charles A. O’Neill is an employee of BioMarin Pharmaceutical Inc. and Sundeep Chandra was previously employed by BioMarin Pharmaceutical Inc. which has an active therapeutic development program for Huntington’s disease.