
Abstract
With the development of the economy, people’s demand for green energy has increased significantly. However, the traditional single fossil energy supply system cannot meet the needs of low-carbon. Therefore, this study employs energy hub to establish a multi-energy flow network that enables the integration of carbon flow within the network. Additionally, by utilizing the multi-energy flow trend, a carbon flow tracking method is adopted to achieve real-time carbon flow calculation. Results show that this network calculates the electricity cost of 20043 yuan, gas cost of 67253 yuan, and carbon emission cost of 3152 yuan. Compared with the traditional energy flow system, gas cost is reduced by 4.3% and 1.7%, electricity cost by 21.3% and 15.0%, and carbon emission cost by 8.7% and 6.6%. The two-way sharing carbon flow calculation model calculates that the user side and power supply side of the node each bear half of the network loss, proving two-way sharing effectiveness. Test results on IEEE5 machine 14-node system show that the calculation method can accurately find high-emission and low-emission areas, making the carbon emission allocation between power generation and user more fair and reasonable. This research can effectively reduce emissions cost, accurately calculate emissions flow in real time, and facilitate reasonable emission reduction planning.
Keywords
Introduction
The multi-energy flow network is the various energy sources interconnection network in energy center. In this network, different types of energy sources are supplied, transmitted, and utilized through various energy devices [1]. In the calculation of carbon flow (CF), it is necessary to evaluate and calculate the carbon emission (CE) of energy in this network. For different energy types, its carbon emission factor needs to be considered. By conducting comprehensive calculations of energy consumption and carbon emission factors, it is possible to determine the carbon emissions associated with different energy sources. By comprehensively considering the carbon emissions and the carbon flow between energy sources in the multi-energy flow power flow network, carbon emission reduction potential of energy centers can be evaluated and calculated more comprehensively. By analyzing the path and characteristics of carbon flow, we can equationte corresponding carbon emission reduction strategies, optimize energy flow and carbon emissions, and achieve low-carbon development and sustainable energy utilization [2]. Therefore, based on the energy center multi-energy flow network (MEFN) and carbon flow mapping relationship model, this study constructs a calculation method that can be used for real-time calculation of carbon flow distribution and couples with the above mapping model to realize real-time calculation and analysis of energy center carbon flow distribution. In addition, the current combination of multi energy flow network and carbon emission calculation is relatively rare, and it focuses on modeling and optimizing the operation of multi energy flow systems, as well as overall analysis of the multi energy flow system. There is a lack of overall research on the operating characteristics of other aspects of the system, such as renewable energy and residual energy circulation. Therefore, the carbon and sulfur distribution calculation method proposed in the study is innovative. It innovatively expands the research on the relationship between multi energy flow networks and carbon flow mapping, and provides theoretical support for the calculation method of carbon flow distribution in load intensive regional energy centers. This study is divided into four parts. First is the research findings regarding multi-energy flow networks and the calculation of carbon flow. Second is the construction of multi-energy and power flow network coupling model and carbon flow calculation model. The third part tests and analyzes the model, and the fourth part summarizes the article and points out the shortcomings.
Related works
The multi-energy flow network can realize the coupling between different energies to meet different energy demands. Some experts and scholars have related research based on this. Xie et al. addressed the related issues of energy coupling in multi energy flow power flow networks in power transportation, and constructed a corresponding coupling network based on considering the node electricity price of road charging stations, thereby effectively improving the efficiency of energy transfer [3]. Ding et al. comprehensively discussed the coupling method of energy hubs based on the consideration of multi energy flow networks to address the issue of conversion efficiency of different renewable energy sources, thereby reducing carbon emissions while strengthening energy control [4]. Yang et al. addressed the relevant issues of promoting energy marketization in multi energy coupling and proposed an indirect multi energy trading method based on the multi energy flow network, effectively improving energy utilization efficiency [5]. Wang et al. proposed an architecture for energy planning in the power system by considering the high penetration rate of renewable energy and considering the coupling of multiple energy sources, which effectively improves the reliability and safety of the energy system [6].
Jiang et al. addressed the relevant issues in power control in the Pengdian network and comprehensively discussed energy conversion and industrial time in distribution networks based on multi energy flow networks, providing data support for improving the efficiency and flexibility of energy utilization in distribution networks [7]. Wang et al. proposed a multitask architecture model based on the analysis of energy coupling relationships in integrated energy systems to address related issues in multi energy load forecasting, thereby improving the accuracy of multi energy load forecasting [8]. Yang et al. found that existing carbon allocation methods are mainly based on the principle of maximum efficiency or the principle of constant efficiency, however, these two principles are extreme cases and are particularly difficult to achieve in reality. Based on this, an alternative approach based on the principles of step-by-step efficiency planning and emission reduction planning is proposed. Applying the proposed method to the allocation of carbon emission quotas in various provinces in my country, some conclusions with practical guiding significance have been drawn [9].
To sum up, reducing carbon emissions has become an important research object in the field of environmental protection, and MEFN can realize coordination and dispatching of various energy sources. However, existing methods seldom combine the multi-energy flow network with the calculation of CE flow. Therefore, the CE calculation method using multi-energy flow constructed in this study has important implications in the fields of energy and environmental protection. D.
Carbon flow distribution model construction in load-intensive areas
To calculate CE in load-intensive areas and realize the requirements of emission reduction, this chapter is divided into two parts for model construction. The first part is optimized using MEFN to realize the coupling between carbon flow and MEFN. The second part realizes the real-time calculation of carbon flow using the carbon flow tracking method of multi-energy flow.
MEFN optimization model construction
MEFN is the interconnection of various energy sources in the energy center. In MEFN, different types of energy are supplied, transmitted and utilized through various energy devices [10]. Its system operation mainly depends on the coupling between various energy sources, which is usually described by an energy hub. Its schematic system diagram is shown Fig. 1.
MEFN system schematic diagram.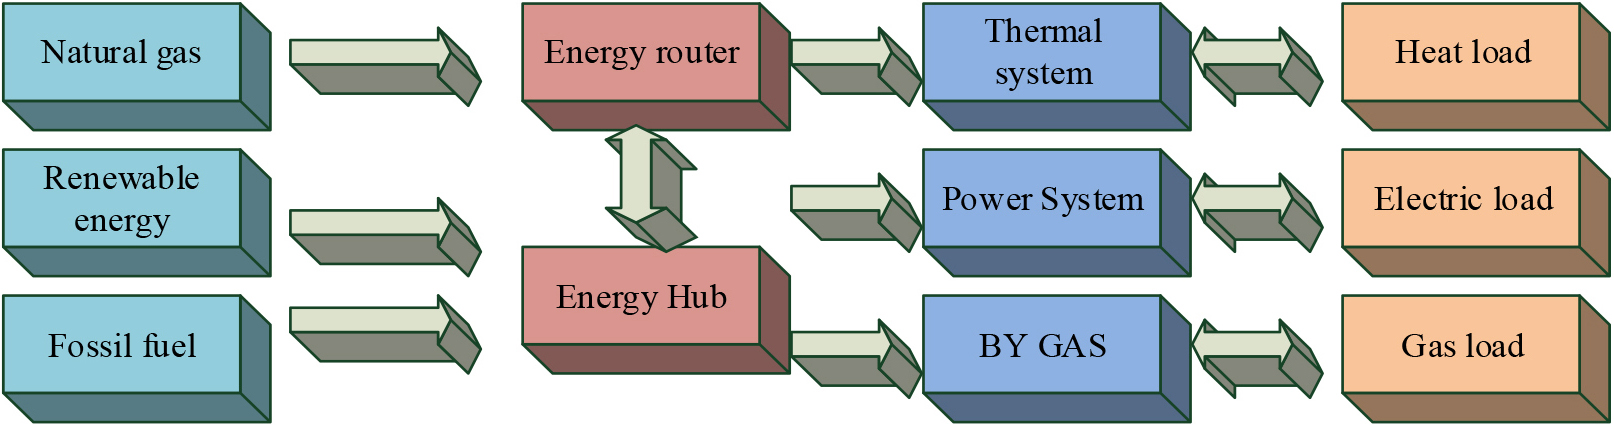
In the energy hub, conversion, transmission, and storage among various energy forms mainly rely on the coupling matrix to express [11], as shown in Eq. (1).
In Eq. (1),
represents the output variables of various energy components, and
represents the coupling matrix of energy, and the elements in it
Energy hub schematic diagram.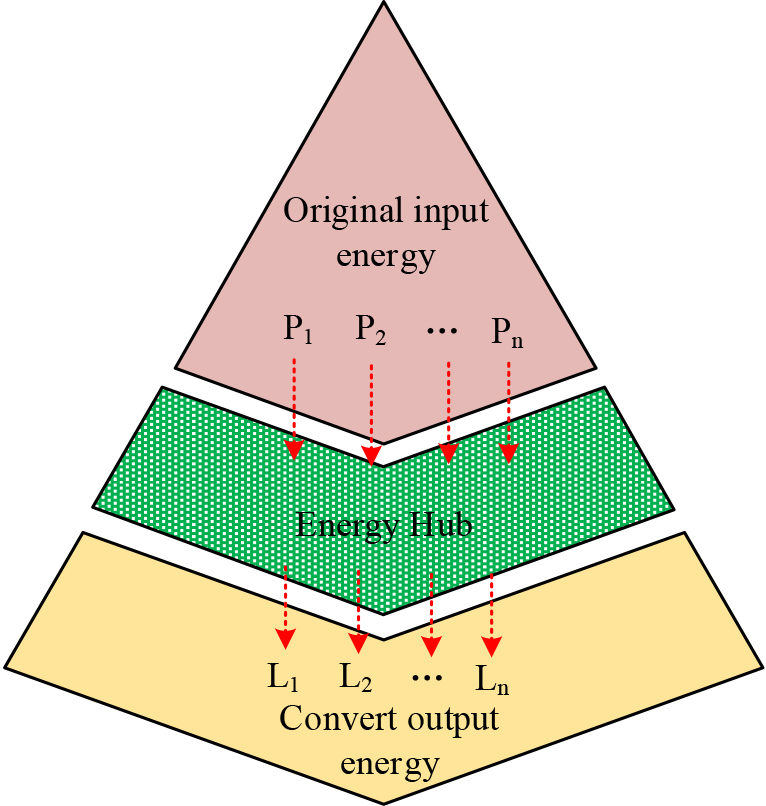
The calculation equation of energy conversion efficiency is shown in Eq. (2)
In Eq. (2),
In Eq. (3),
In Eq. (4),
In Eq. (5),
In Eq. (6),
In Eq. (7),
In Eq. (8),
In Eq. (9),
In Eq. (10),
In Eq. (11),
Flow chart of the coupling model for a MEFN system.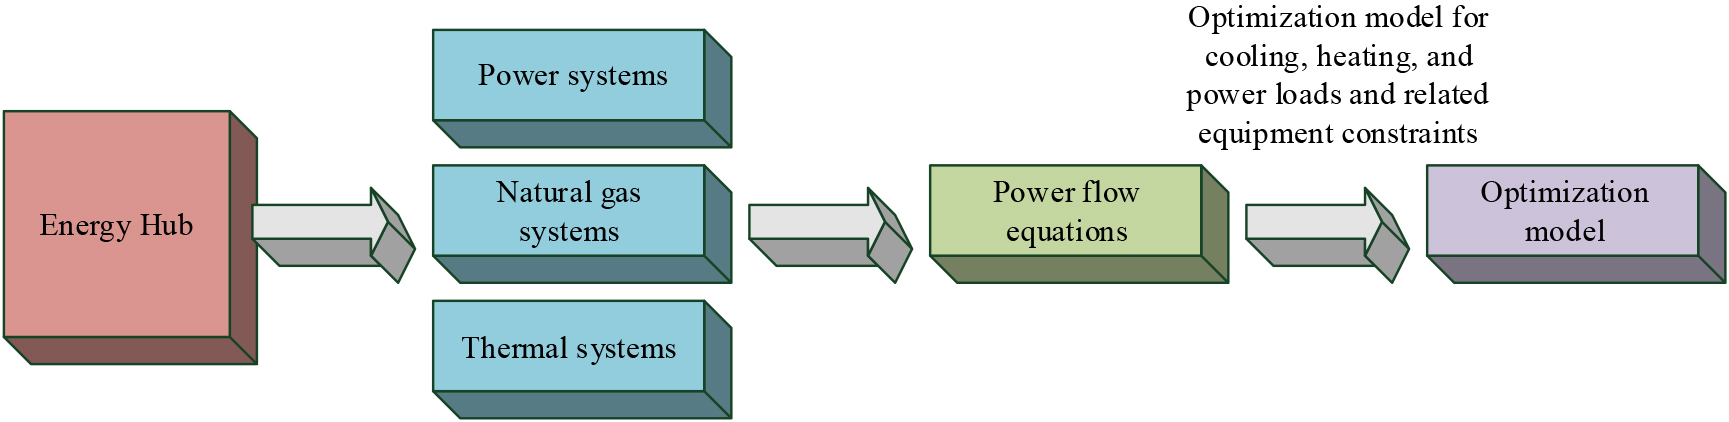
Intensive regional energy centers refer to centralized energy supply and multi-energy complementary energy systems built in urban centers or dense urban areas. The purpose is to utilize energy efficiently, reduce its consumption and carbon Emissions [18]. Figure 4 shows the energy supply system frame diagram in the load-intensive area.
Framework diagram of energy supply system in densely loaded areas.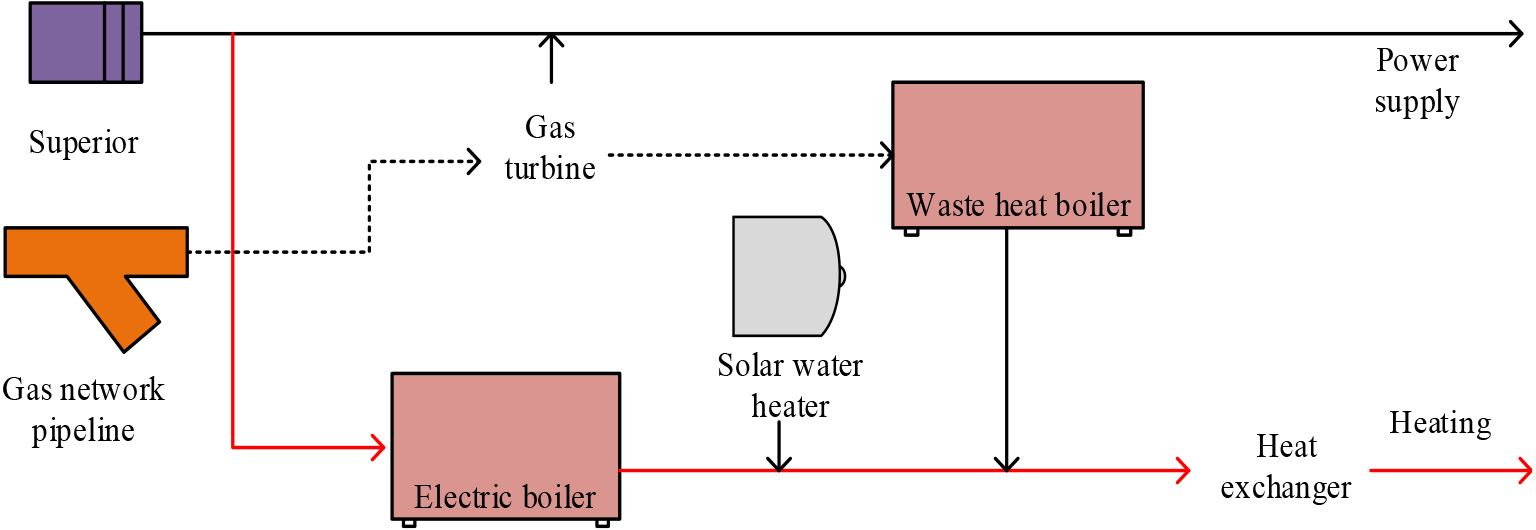
Multi energy complementary mode diagram.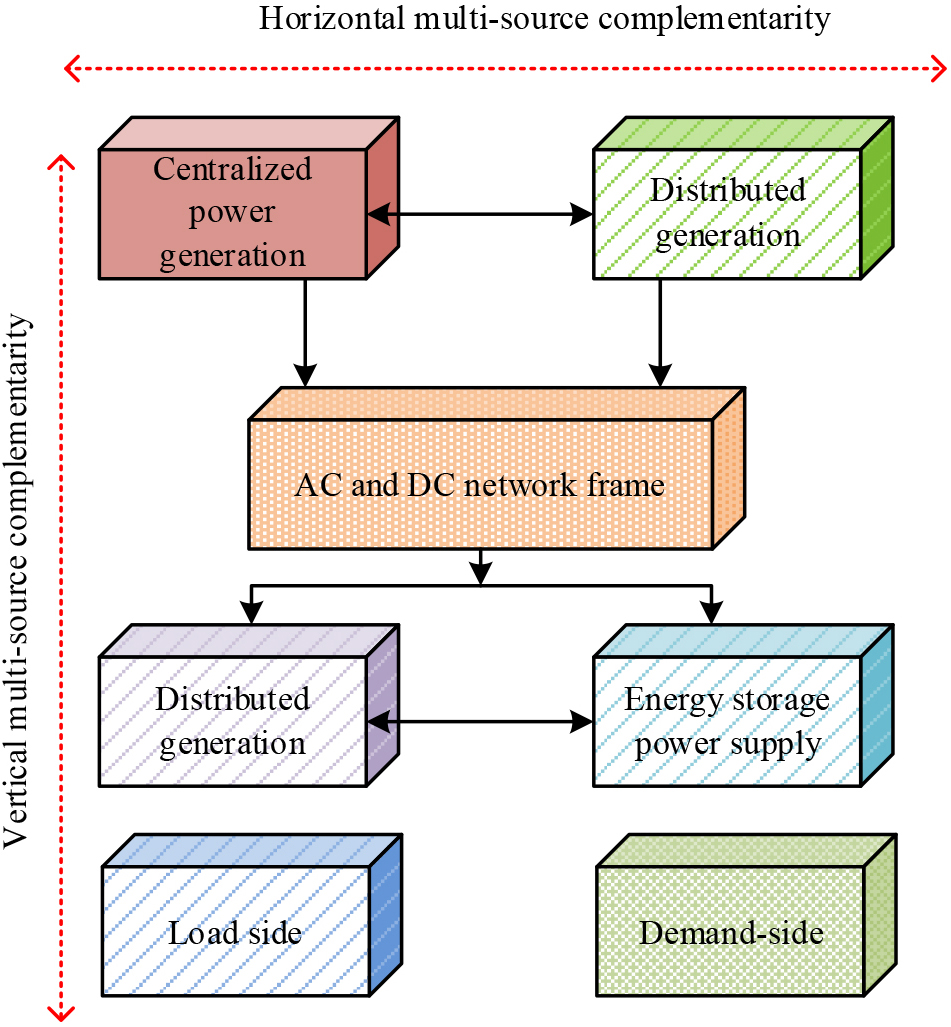
In order to further realize the statistics of CE and reduce it, CF analysis method is used. This method utilizes the CF tracking method of the multi-energy flow trend, by tracking CE generated during the flow and conversion of energy in different links, as well as the carbon flow transfer between different energy sources, to comprehensively understand and evaluate energy. The carbon emissions of the system [19]. The multi-energy complementary mode diagram is shown in Fig. 5.
The carbon flow tracking method is divided into forward tracking and countercurrent tracking. In the forward tracking, the active power flow is set as the positive direction of the branch. Therefore, the power output of the node, branch inflow power, and the load contribution are as follows Eq. (12) shown.
In Eq. (12),
In Eq. (13),
In Eq. (14),
In Eq. (15),
In Eq. (16),
In Eq. (17),
In Eq. (18),
In Eq. (19),
In Eq. (20),
In Eq. (21),
In Eq. (22),
In Eq. (23),
In Eq. (24),
In Eq. (25),
CF calculation flowchart.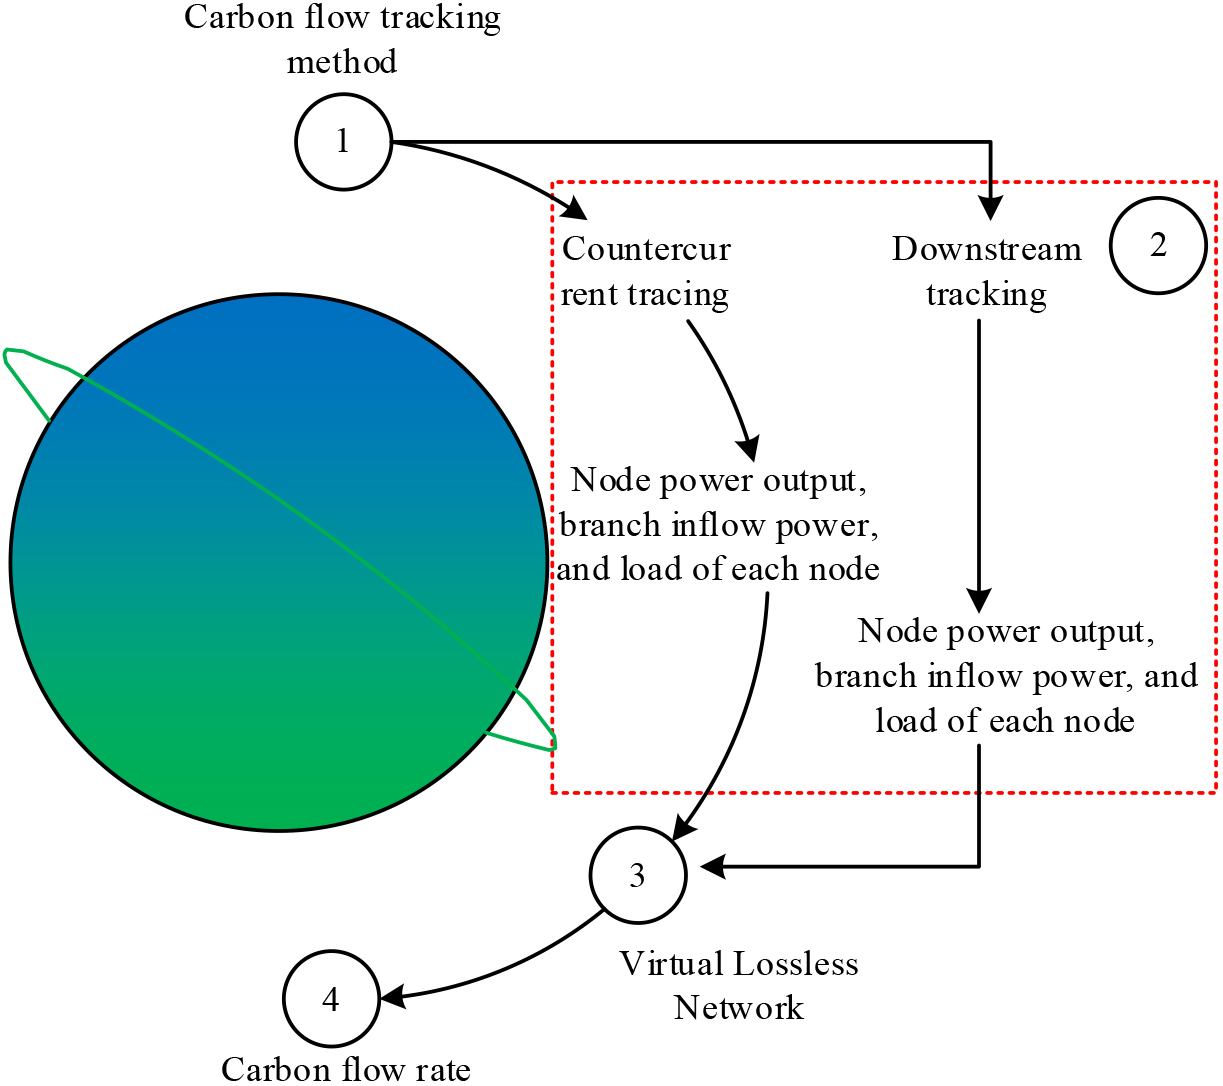
To test the emission reduction performance of MEFN optimization and the correctness of the carbon flow calculation model, this chapter is divided into two parts for testing. The first part tests and analyzes the multi-energy flow optimization model, and the second part tests and analyzes the carbon flow calculation model.
Practical case analysis of MEFN power flow optimization model
The industrial park of a certain city is selected as the research object, which includes a residential area with an area of 1.5 km2, an industrial area with an area of 1.8 km2 and a commercial area with an area of 0.8 km2. To test the generality of MEFN optimization model, three different cases were selected for analysis. The first type adopts the traditional cogeneration system, and the second type introduces renewable energy systems, including photovoltaic and wind power generations, on basis of the first type. The third type introduces an energy storage system on basis of the second type. Assuming that the system is connected to the grid, the supply of internal power generation and renewable energy is insufficient to purchase electricity from the external grid. Meanwhile, there is no natural gas source in the park, which is supplied by the urban natural gas pipeline network. Related equipment parameters are shown below.
Related equipment parameter settings table
Related equipment parameter settings table
Assuming that the day-ahead power consumption of electric heating and cooling loads before optimization and the day-ahead prediction of photovoltaic, wind power, and electric heating and cooling loads are accurate, the day-ahead forecast power and day-ahead output power are demonstrated in Fig. 7.
Daily predicted power and daily output power.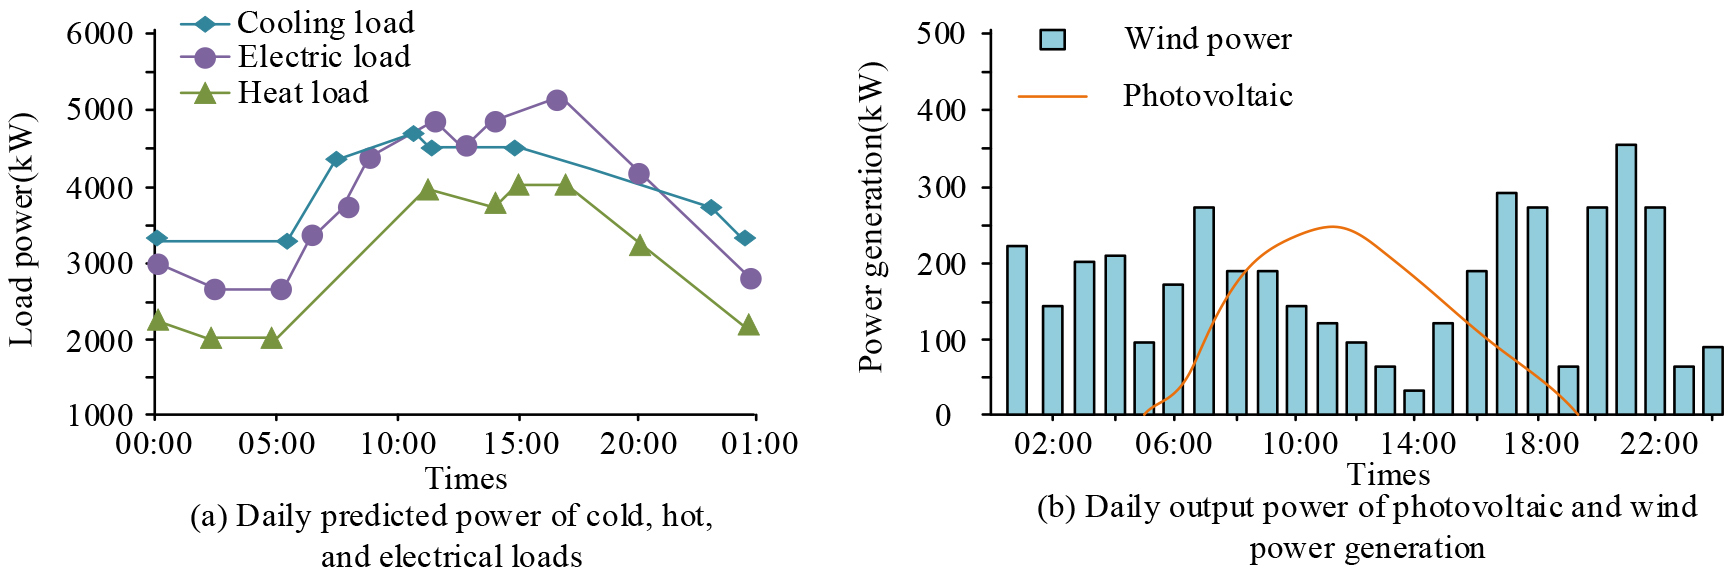
Figure 7a shows the predicted power of cooling, heating, and electric loads. It can be seen that the cooling load reaches a peak value of 4600 kW at 11:00, the heat load reaches a peak value of 4000 kW at 12:00, and the electric load reaches a peak value of 4000 kW at 17:00. When it reaches a peak value of 5100 kW. Figure 7b shows the daily output power of photovoltaic and wind power generation. Their peak values are 250 kW at 12:00 and 350 kW at 21:00, relatively. The multi-energy flow optimization model is divided into energy sources on each energy node, and the daily average value of a standard month is used as data. During peak hours, electricity price is 0.65 yuan/(kW h), and natural gas price is 0.36 yuan/(kW h). During off-peak hours, the price of electricity is 0.26 yuan/(kW h), and natural gas price is 0.36 yuan/(kW h). During normal hours, electricity price is 0.45 yuan/(kW h), and natural gas price is 0.36 yuan/(kW h). The results of electric power optimization in three different cases are shown in Fig. 8.
Electric power scheduling results of multi energy flow systems in three scenarios.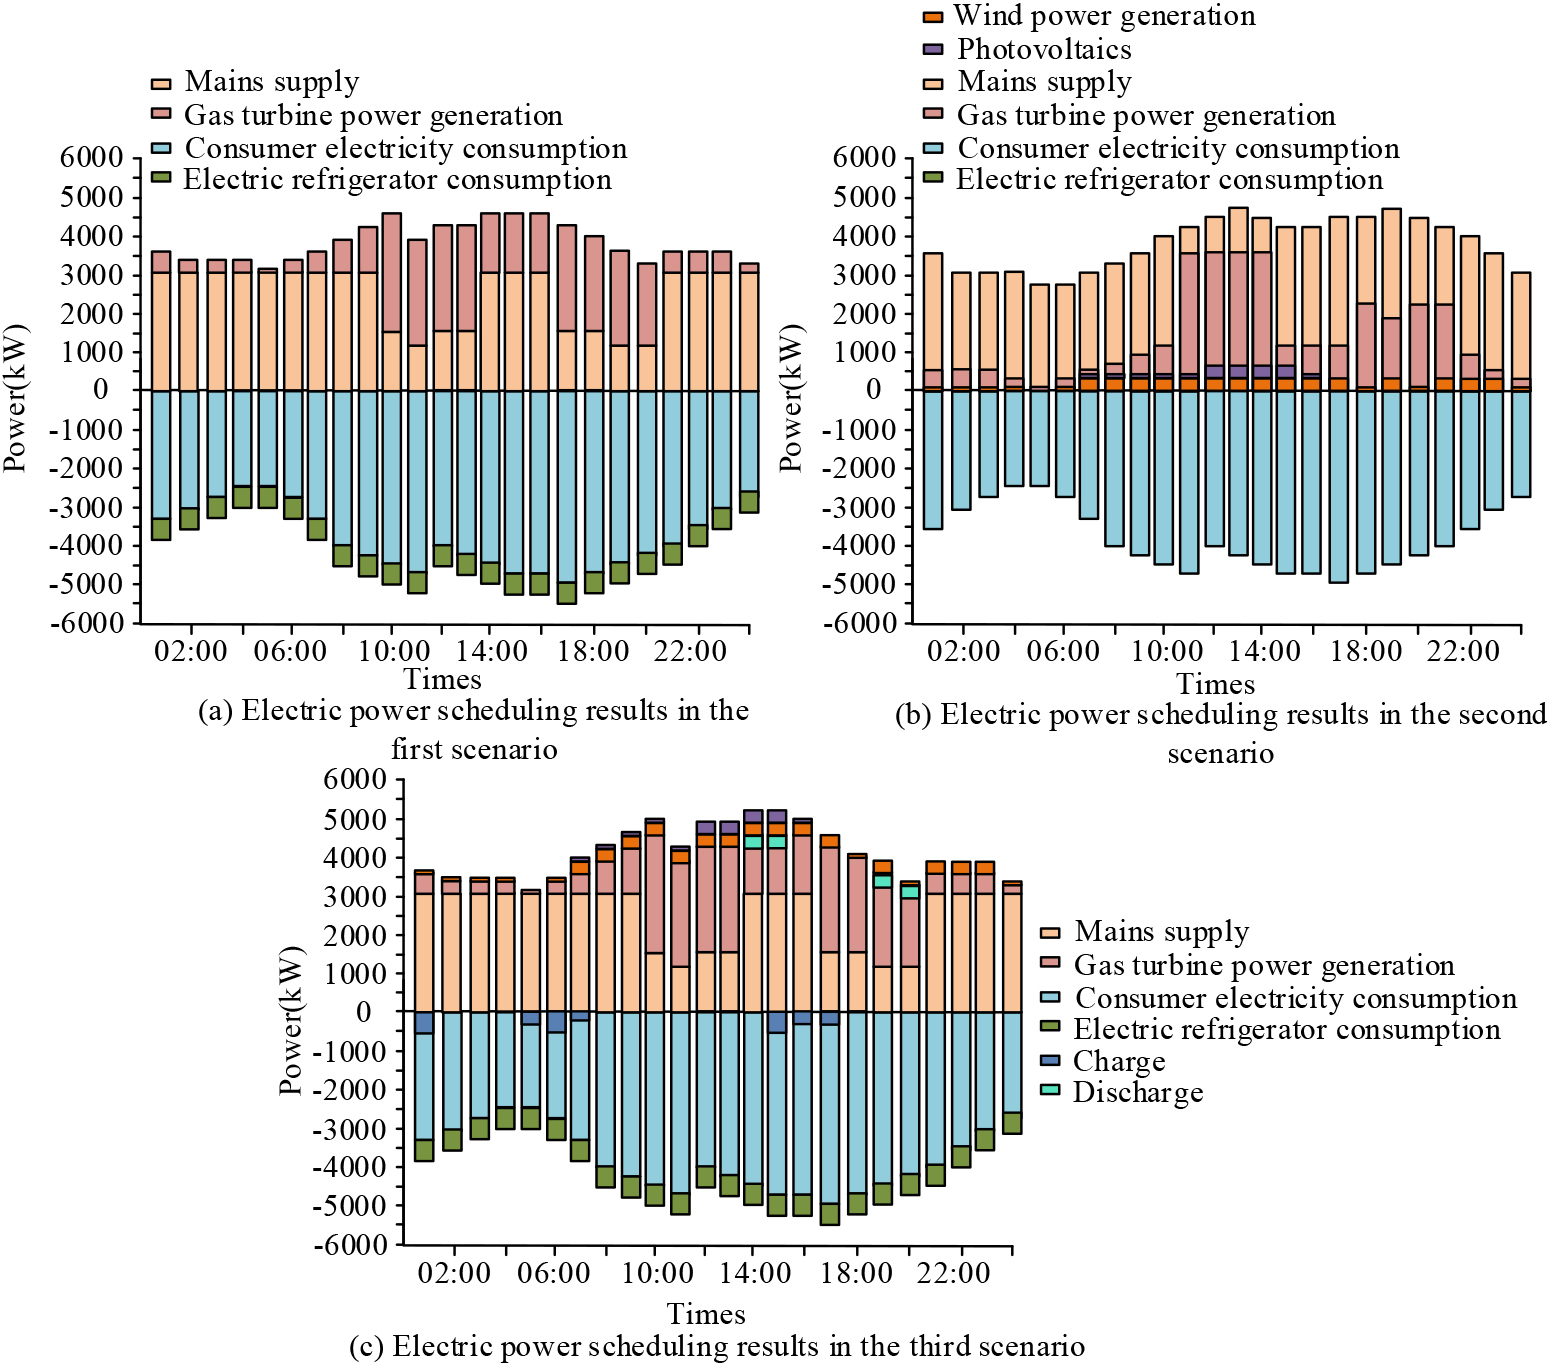
Figure 8a shows electric power dispatching results of the traditional cogeneration system, which mainly uses the functions of the external power grid and natural gas pipeline network. It is calculated that the electricity purchase cost is 25,482 yuan, the gas purchase cost is 70,259 yuan, and the carbon emission cost is 3,455 yuan. Figure 8b introduces renewable energy, and the optimized power part decreases and the peak value is also flat. It is calculated that the electricity purchase cost is 23,592 yuan, the gas purchase cost is 68,429 yuan, and the carbon emission cost is 3,376 yuan. Figure 8c adopts a multi-energy flow optimization model, which reserves and transmits the idle power consumption to the peak power consumption stage, which increases the utilization efficiency of renewable energy and reduces carbon emissions. It is calculated that the electricity purchase cost is 20,043 yuan, the gas purchase cost is 67,253 yuan, and the carbon emission cost is 3,152 yuan. Compared with the first and second cases, the gas cost is reduced by 4.3% and 1.7%, electricity cost by 21.3% and 15.0%, and carbon emission cost by 8.7% and 6.6%.
A node system is selected to verify the carbon flow calculation model. A total of 4 nodes are set in the node system, and the units connected to each node are different. Node 1 is a balance node, the coal consumption characteristic parameters are set to 0.0014, 0.12 and 0.25, the voltage amplitude is 1.050pu, the correction parameter is 1.01, the carbon content rate is 0.80, and the carbon oxidation rate is 0.98
Unit, load, and branch allocation.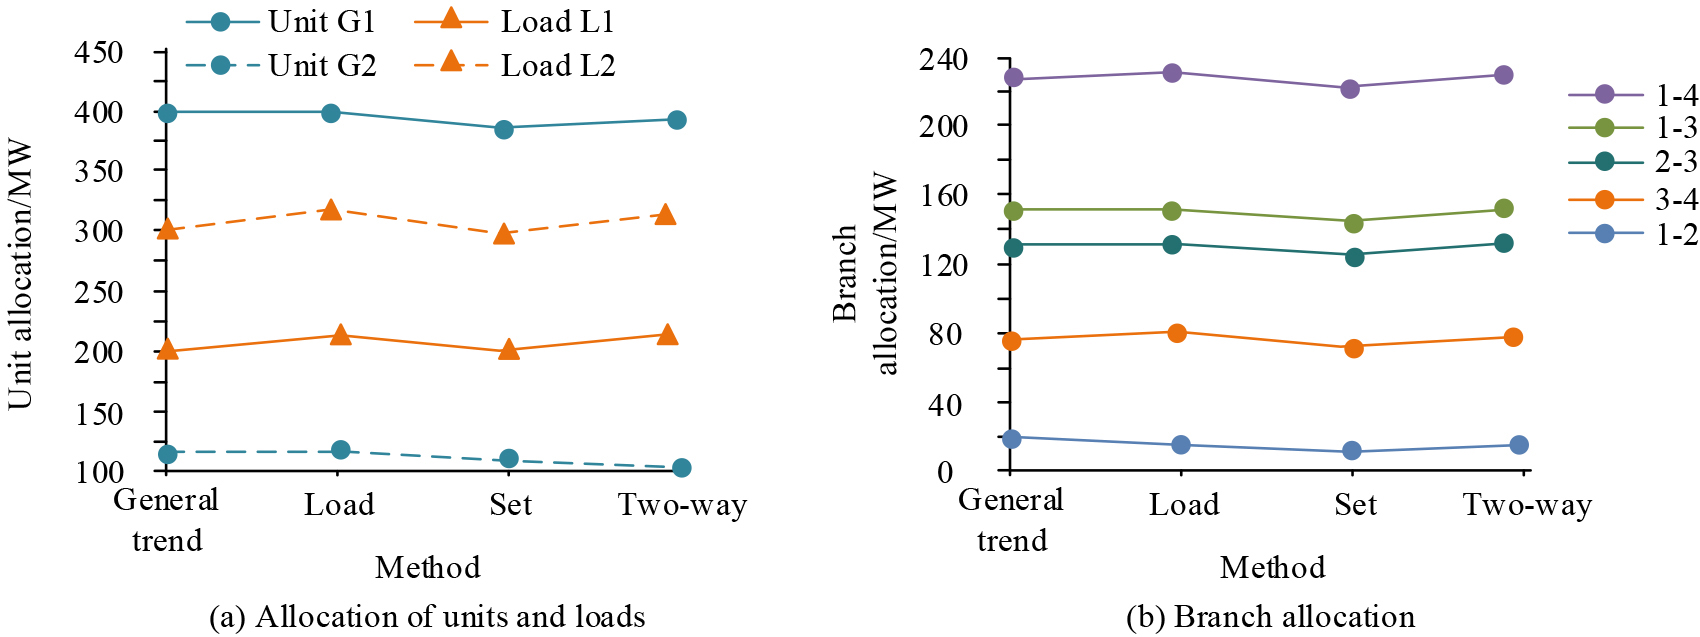
From Fig. 9, units-shared total load is 515MW. When the network loss is allocated to user, the load allocation increases to 536MW, and G1 and G2 remain unchanged. When the network loss is allocated to the power generation, the units G1 and G2 bear the active power loss of 18MW and 3MW. When two-way sharing is used, the active power losses borne by loads L1 and L2 are 3.2MW and 8.1MW respectively, and the active power losses shared by units G1 and G2 are 9.4MW and 1.9MW respectively. The user and power sides each bear half of the network loss, which proves the effectiveness of two-way sharing. Set the predicted load carbon flow rate L1 to 34 t/h, L2 to 66 t/h, unit carbon flow rate G1 injection to 82 t/h, G1 network loss to 1.5 t/h. The current actual carbon flow rate is shown in Fig. 10.
Actual CFR before the day.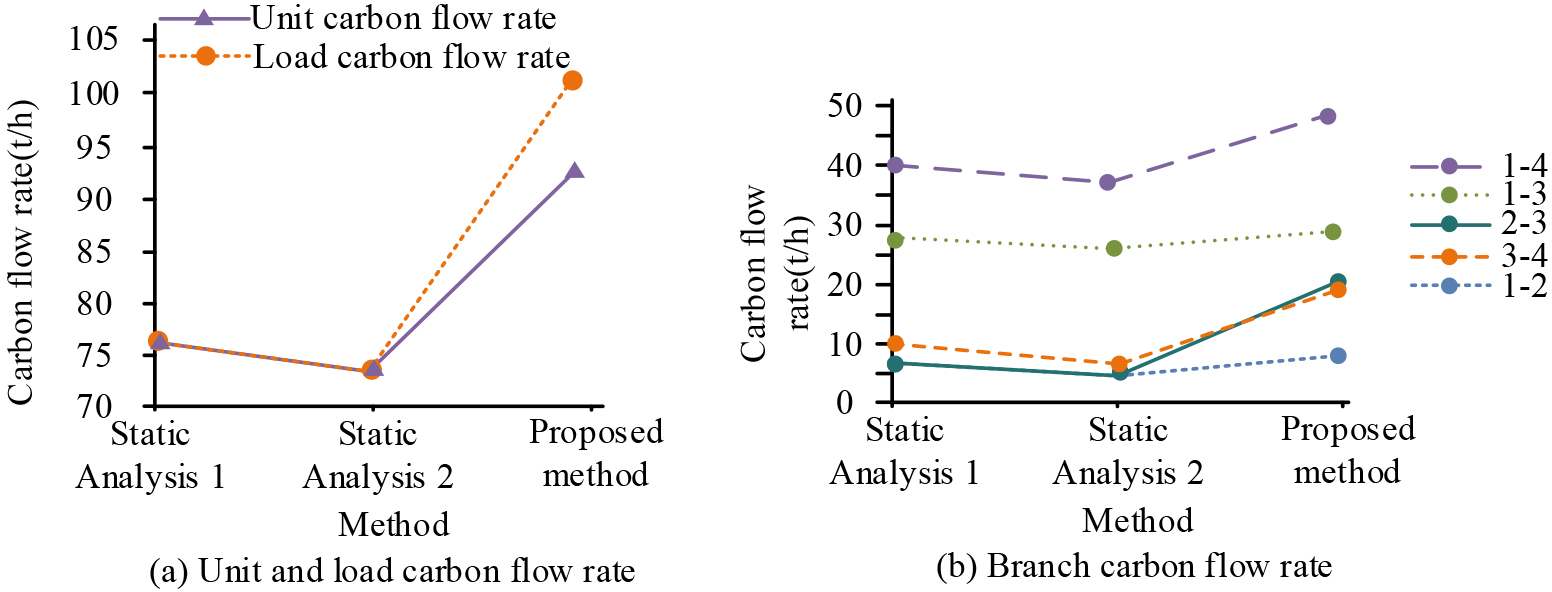
Figure 10, static analysis method 1 represents network loss distribution to the load, and the static analysis method 2 represents the distribution of network loss to the power supply. Static analysis method 1 is compared with static analysis method 2, the G1 injection of static analysis method 1 is 76 t/h, and the network loss is 0. The G1 injection of static analysis method 2 is 73 t/h, the network loss is 3.6 t/h, and CFR has increased. The incremental sum of load actual CFR and predicted CFR shows that the change in system carbon emissions is shared by unit and load. To further prove method’s effectiveness, a test is carried out on an IEEE5 machine 14-node system, and the results are shown in Fig. 11.
Load CFR and unit injection CFR.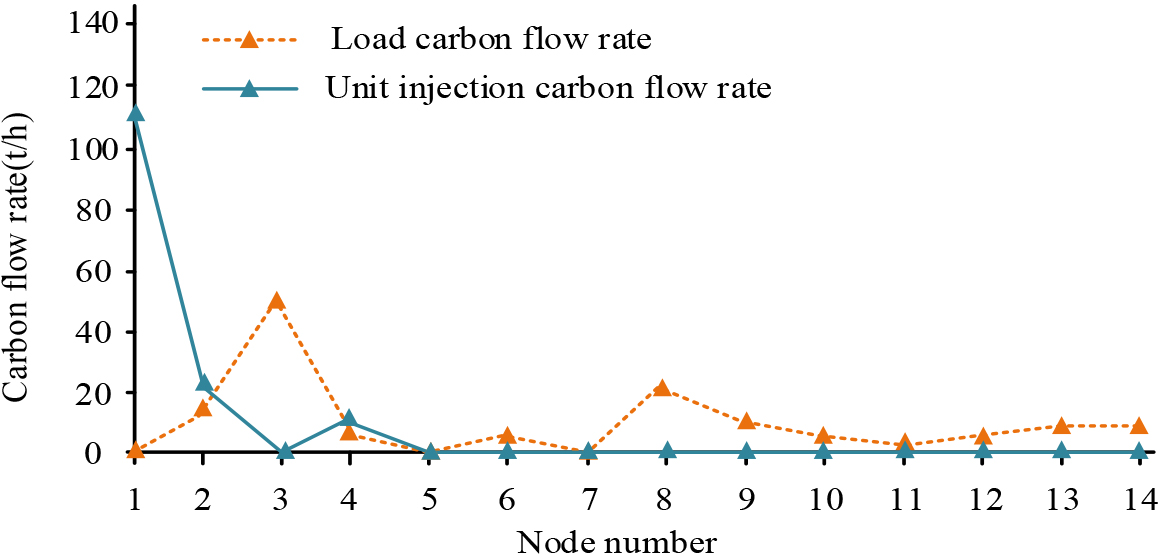
CFR and active power flow of each branch.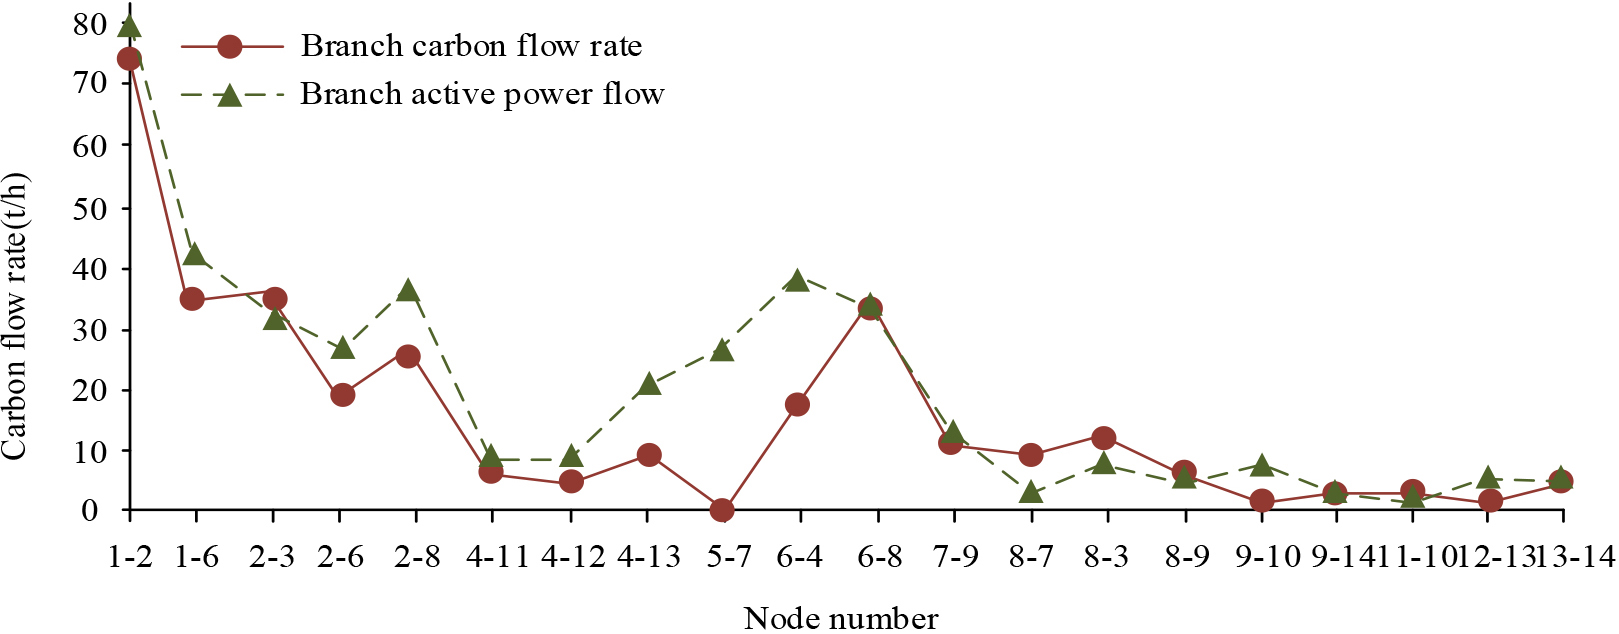
Figure 11 is the CFR of each node calculated from the power drawn by the load node. CE generated by the network loss is attributed to the power supply side, and the load side does not bear this part of CE. The total load CFR of grid loss is 138.5 t/h, and the total CFR of unit injection is 139.8 t/h. Therefore, CFR generated at the grid loss site is 1.4 t/h. CFR and active power flow of each branch are shown in Fig. 12.
From Fig. 12 that generator set’s CE intensity at node 1 is relatively large, and the generated electric energy is also more, which belongs to the area with heavy carbon emission. Therefore, the 16 branches and 12 branches connected to node 1 are the power to withstand is also greater, and CFR is also greater. The branch 23 bears CE caused by the transmission power of the generator sets 1 and 2, so branch CFR is also relatively large. Since CE from the node 5 generator is 0, CFR is also 0. This calculation method can accurately find high-emission and low-emission areas, and provide a basis for subsequent emission reduction planning.
To realize the real-time calculation of carbon flow in the load energy center, this research is based on the MEFN optimization to realize the coupling between carbon flow and MEFN, and achieve the purpose of real-time calculation of carbon flow. The results show that the traditional cogeneration system calculates the electricity purchase cost of 25,482 yuan, the gas purchase cost of 70,259 yuan, and the carbon emission cost of 3,455 yuan. After the introduction of renewable energy, the optimized power part has declined, and the peak value is relatively flat. The calculated electricity purchase cost is 23,592 yuan, the gas purchase cost is 68,429 yuan, and the carbon emission cost is 3,376 yuan. The multi-energy flow optimization model calculates that the electricity purchase cost is 20,043 yuan, the gas purchase cost is 67,253 yuan, and the carbon emission cost is 3,152 yuan. Compared with the former two, gas cost has been reduced by 4.3% and 1.7%, electricity cost has been reduced by 21.3% and 15.0%, and CE cost was reduced by 8.7% and 6.6%. Reserve and transmit the idle power consumption to the peak power consumption stage, which increases the utilization efficiency of renewable energy and reduces CE. The test results on the IEEE5 machine 14-node system show that the calculation method can accurately find high-emission and low-emission areas, and find the key points in the low-carbon link, making CE sharing between the power generation side and the user side fairer and more reasonable. There are deficiencies in this study. In MEFN system construction, the complex disturbance at the source was not considered. In the next study, the relationship between the system load and photovoltaic and wind power generation should be considered.
Footnotes
Acknowledgments
This work was financially supported by the Scientific and Technological Project of China Electric Power Research Institute, (Study on Low-carbon Operation Strategy of Integrated Energy System in Park under the Goal of Double Carbon, No.: YD80-22-001).