
Abstract
With the rapid development of renewable energy and the urgent need for global carbon emission reduction, virtual power plants have become a high-profile energy management model that can integrate multiple energy resources. How to effectively integrate renewable energy to reduce carbon emissions, how to optimize the use of different energy resources, and how to fairly distribute economic benefits within virtual power plant clusters while encouraging the reduction of carbon emissions are issues that need to be addressed in research. The study first established a virtual power plant model and conducted in-depth optimization for its economic and environmental indicators. Subsequently, the study constructed a game model within the virtual power plant cluster, aiming to solve the problem of income distribution in this diversified energy system. The research results found that commercial users have the highest carbon emissions, followed by industrial users, while residential users have the lowest carbon emissions. In terms of optimized user electricity consumption behavior, the peak-to-valley difference rate of industrial users has been reduced by 17%, and the daily load rate has increased by 6%; the peak-to-valley difference rate of commercial users has been reduced by 12%, and the daily load rate has increased by 6%; The peak-to-trough difference rate for residential users decreased by 8%, and the daily load rate increased by 4%. In addition, the research also proposes a method of internal revenue distribution of virtual power plant clusters based on a carbon reward and punishment mechanism, which provides a new way for the synergy effects and economic benefit distribution of virtual power plants. Research is of positive significance in solving pressing issues in the field of energy management and provides strong support for the development of future sustainable energy systems.
Keywords
Introduction
With the increasing global concern about climate change and environmental protection, carbon incentive and penalty mechanisms have become one of the important means to promote low-carbon transition and reduce carbon emissions. Virtual Power Plant (VPP) clusters, as a new type of energy management model, integrate and optimize the utilization of distributed energy (DE) resources, which has the potential to improve energy use efficiency and reduce carbon emissions [1]. However, the problem of revenue sharing within VPP clusters has been a challenging topic [2]. Studying the revenue sharing issue within VPP (Virtual Power Plant) clusters is crucial as it relates to sustainable energy supply, cost-effectiveness, market incentives, reliability and environmental protection. VPP clusters contain diverse distributed energy resources and require effective coordination and management. Appropriate revenue sharing mechanisms can incentivize participants, reduce costs, reduce risks, promote the use of clean energy, help keep up with the development of technology and policies, and ensure the reliability and sustainability of the system. To address this issue, this study focuses on the revenue sharing methodology within VPP clusters considering carbon incentives and penalties, which is innovative and unique compared with the traditional revenue sharing methodology [3]. The innovation of the study is to incorporate the carbon incentive and penalty mechanism into the benefit sharing of VPP clusters, and to propose a VPP based on the Shapley value for addressing the problem of benefit sharing. By considering the carbon reduction benefits and the contribution of the participants, this study aims to establish a feasible and fair benefit sharing mechanism to incentivize the participants within the VPP cluster for participating in carbon reduction actions and promoting the advancement of sustainable energy. Through the innovative work of the study, it is expected to provide important theoretical and practical guidance for the construction of VPP clusters with carbon emission reduction awareness and fair distribution mechanisms, and to make positive contributions to the promotion of low-carbon energy transition and sustainable development.
The research is separated into four, the first part is the summary on the revenue distribution of VPP. The second part is the model construction and optimization of VPP on the ground of carbon reward and punishment mechanism. The third part is the analysis of the revenue sharing method of VPP clusters under the carbon reward and punishment mechanism. The fourth part is the summary of the whole paper.
VPP is a newly proposed carbon cycle concept in recent years. For addressing the flexibility assessment problem of VPP in managing a large amount of DE, Wang and other scholars proposed to adopt an opportunity constrained optimization model to formulate the flexibility assessment problem, represent the flexibility assessment as a combination of virtual generators and virtual batteries and decompose it by a robust optimization algorithm, and then introduce a boundary based on high-dimensional polyhedra contraction method is introduced to estimate the parameters of virtual generators and virtual batteries [4]. Zhang and Hredzak in order to aggregate DE storage systems into heterogeneous VPP, two kinds of VPP are constructed for supplying high volume power demand and high frequency power demand respectively, and a distributed secondary control system is introduced to regulate each of the storage systems in order to maintain a balanced charging state of all the energy storage systems within the VPP [5]. For addressing the issue of optimal bidding strategy for VPP, Vahedipour-Dahraie et al. constructed VPP including dispatchable energy, renewable energy (REN), energy storage systems and demand flexible customers, and determined bidding/offer strategies for VPP in day-ahead, real-time and rotating standby markets to maximize profits [6]. Gough et al. for exploring the potential of blockchain technology in the energy trading market, proposed a multilevel interactive energy optimization model to study the DE sources within a VPP, constructed a multilevel interactive energy optimization model, and introduced a relevant layer to ensure the automation and documentation of energy transactions [7]. To address the coordination problem in VPP operations to facilitate market and network integration of DE resources, Naughton et al. proposed a framework to jointly optimize multiple markets, systems and local network services provided by VPPs to maximize their revenues, decomposing the framework into three sequential coordination optimization problems. A robust scenario-based optimization approach is used for day-ahead resource scheduling and a second-order cone relaxation method is utilized for obtaining more accurate power flows [8]. These related studies provide strong connections and references for this study. In particular, they explore key issues in virtual power plant management, energy aggregation, optimal bidding strategies, blockchain technology applications, and VPP operations, which are closely related to the carbon reward and punishment mechanism and internal revenue sharing of virtual power plant clusters in this study Related. By drawing on the experience and methods of these studies, research can better explain the operation and management of virtual power plants, and how to effectively allocate internal benefits under the carbon reward and punishment mechanism.
The intra-cluster revenue sharing methodology has been studied by scholars in various fields. Ji et al. found that over-allocation of carbon credits by the government may be detrimental to manufacturers’ profitability under wholesale price and increase the difficulty of enforcing cap-and-trade regulation (CATR). The study investigates the production decision and contract setting under CATR in supply chains through a two-stage Stackelberg game model, and provides suggestions on optimal cap setting [9]. In order to understand the development trend of global carbon emissions research, Abeydeera et al. used scientometric analysis methods to review the literature related to global carbon emissions, spanning from 1981 to 2019, and examined the research literature on the assessment of greenhouse gas emissions and Carbon footprint content, and key topics related to climate change and the environmental impact of carbon emissions [10]. Liu et al. constructed a three-party evolutionary game model involving the relationship between transportation carbon deficit provinces, transportation carbon surplus provinces and the central government. The study discusses the evolutionary stability of the game in the various strategies. Finally, simulations using Matlab were conducted to validate the findings and provide strategic recommendations for the central government in cross-regional transportation emission reduction [11]. Wang et al. for addressing the issues of environmental pollution as well as multi-stakeholder conflict of interest in integrated energy systems. The study adopts an approach based on the carbon trading mechanism and Stackelberg game to realize the low-carbon economic co-optimization of the integrated energy system, proposes a multi-stakeholder low-carbon trading mechanism, establishes the mathematical model of each stakeholder, and solves the model by using a two-stage optimization algorithm [12]. Liu et al. explored the multi-stage low-carbon technology investment in the evolutionary model between the manufacturer and supplier strategy analysis, constructed an evolutionary model between manufacturers and suppliers using a bilateral matching and evolutionary theory-based approach, and established a green supply chain profit optimization model from the perspectives of centralized matching, decentralized matching and mismatching [13].
In summary, many experts have conducted research on VPP and cluster revenue sharing methods, but there is still room for optimizing the economic benefits shared by members under these methods, and the research is based on the carbon reward and punishment mechanism to study the revenue sharing methods of VPP clusters, with the expectation of enhancing the economic benefits shared by members.
Modeling of VPP based on carbon incentive and penalty mechanisms
Carbon incentives and disincentives possess an essential influence on combating climate change as well as achieving carbon reduction targets [14]. For meeting the challenge of carbon emissions and promote the advancement of clean energy, VPP modeling has become an effective solution. The VPP model integrates multiple decentralized REN sources and energy storage devices (ESD) into a unified energy system to improve energy reliability, economy and environmental protection.
VPP optimization model construction
A VPP is a generalization of a centralized virtual electric power plant by integrating and coordinating the energy and energy demand of DE resources and flexible loads (e.g., electric vehicles, electric water heaters, etc.) [15]. The VPP operation is showcased in Fig. 1.
How the VPP works.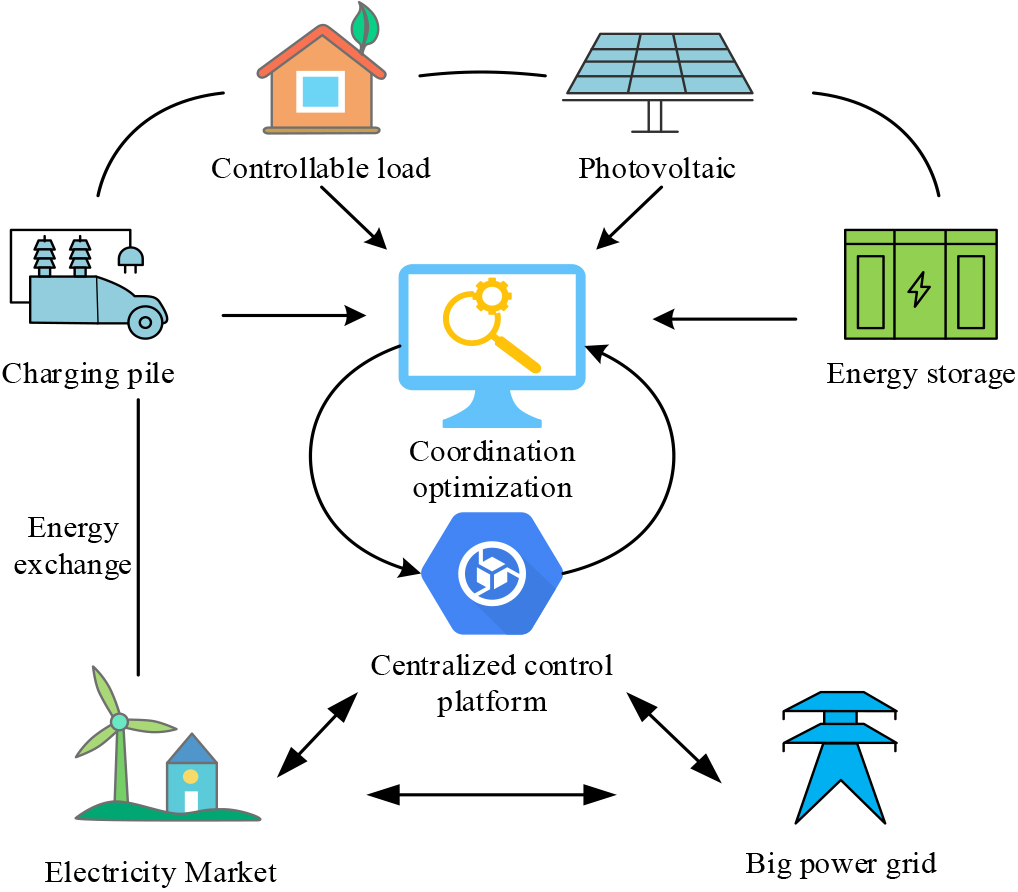
As shown in Fig. 1, upstream basic resources include adjustable loads, distributed power supplies and energy storage equipment. Controllable loads vary in different sectors, such as industry, commerce, public buildings and residents, each with different load management difficulties. Distributed power refers to small photovoltaic, wind power, thermal power and hydropower units. Energy storage technologies include mechanical energy storage and chemical energy storage. Midstream virtual power plant operators are mainly divided into resource aggregators and technical service providers. Resource aggregators use technologies such as the Internet of Things and big data to integrate data from various fields to realize the core coordination and control functions of virtual power plants. Technical service providers focus on the construction of virtual power plant software platforms and provide technical support to resource aggregators. Downstream power demanders include public utility enterprises (grid companies), energy retailers (power sales companies) and other market transaction participants, who conduct power trading, peak frequency regulation and demand side response to obtain economic benefits. These actors have an important impact on the reliability and economics of the power system. Four modules are usually considered for VPP modeling, which are dispatchable generating units, controllable loads, distributed power sources, and ESD. Among them, dispatchable generating units refer to power generation equipment that can be adjusted and controlled according to demand, including traditional coal-fired power plants as well as REN generation equipment like fuel cells and gas turbines (GTU). Controllable loads are consumer equipment that can be adjusted and controlled according to demand, and the modeling of controllable loads needs to take into account their power demand, adjustment response time, load optimization strategy, and other factors. Distributed power refers to small-scale energy generation devices dispersed in the power grid. By modeling distributed power, the VPP can achieve centralized management and coordinated control of distributed power to maximize the use of REN and enhance the reliability and stability of the power grid. ESD are devices used to store energy and release it when needed, and the modeling of ESD needs to take into account factors such as their capacity, efficiency, and charge/discharge rate. The VPP modeling process is showcased in Fig. 2.
VPP modeling process.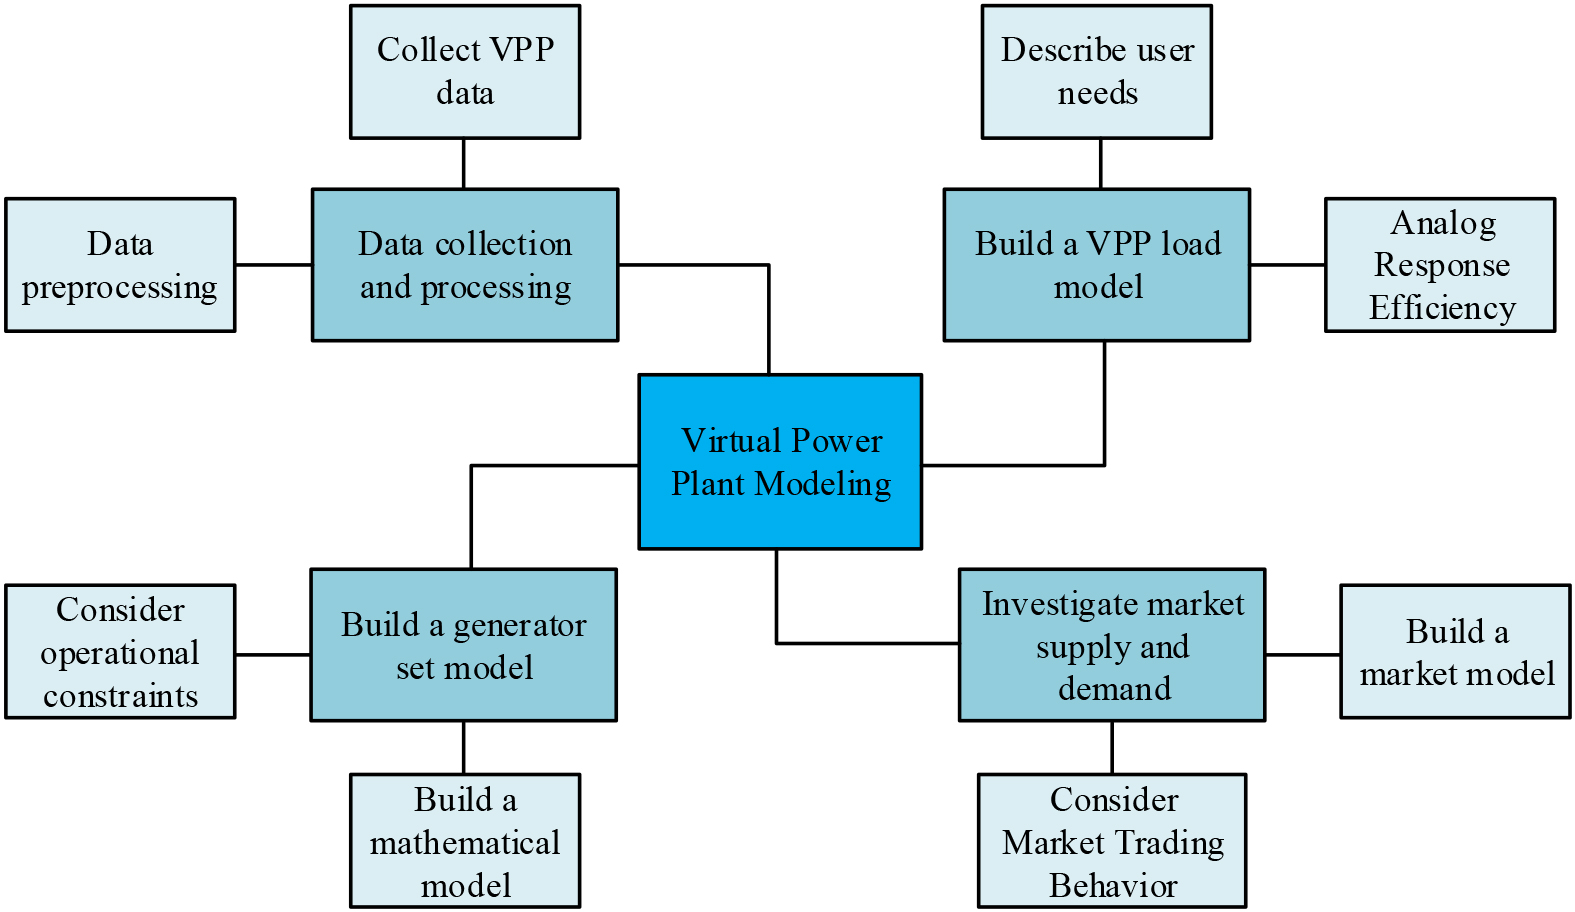
The study is based on the GTU and energy storage equipment (ESE) of dispatchable generating units to start, the cost function of GTU (Gas Turbine) is usually based on its fuel cost, maintenance cost and operating cost composition, set the cost function as
In Eq. (1),
In Eq. (2),
In Eq. (3),
In Eq. (4),
In Eq. (5),
In Eq. (6),
The study optimizes the VPP model by optimizing the ESE, where the objective function consists of two parts, which are the expected return and the conditional value-at-risk of the return of the VPP cluster. The operating cost of the VPP is shown in Eq. (8).
In Eq. (8),
In Eq. (9),
In Eq. (10),
The two-stage Stackelberg (Stackelberg) game model for VPP is a model used to analyze the competitive strategies and distribution of benefits of VPP in the electricity market [16]. The model can be modeled and solved in two stages, in the first stage, the VPP cluster acts as a leader to develop its bidding strategy. The leader can decide its bidding volume and bidding price based on market demand, cost, generation capacity and other factors. In the second stage, other market participants as followers respond accordingly to the leader’s bidding strategy. Followers can choose to participate in the bidding, adjust their bidding volume or price, etc. Based on the results of the model, revenue sharing and benefit analysis can be performed [17]. The two-stage Stackelberg game model of VPP is showcased in Fig. 3.
Two-stage Stackelberg game model of VPP.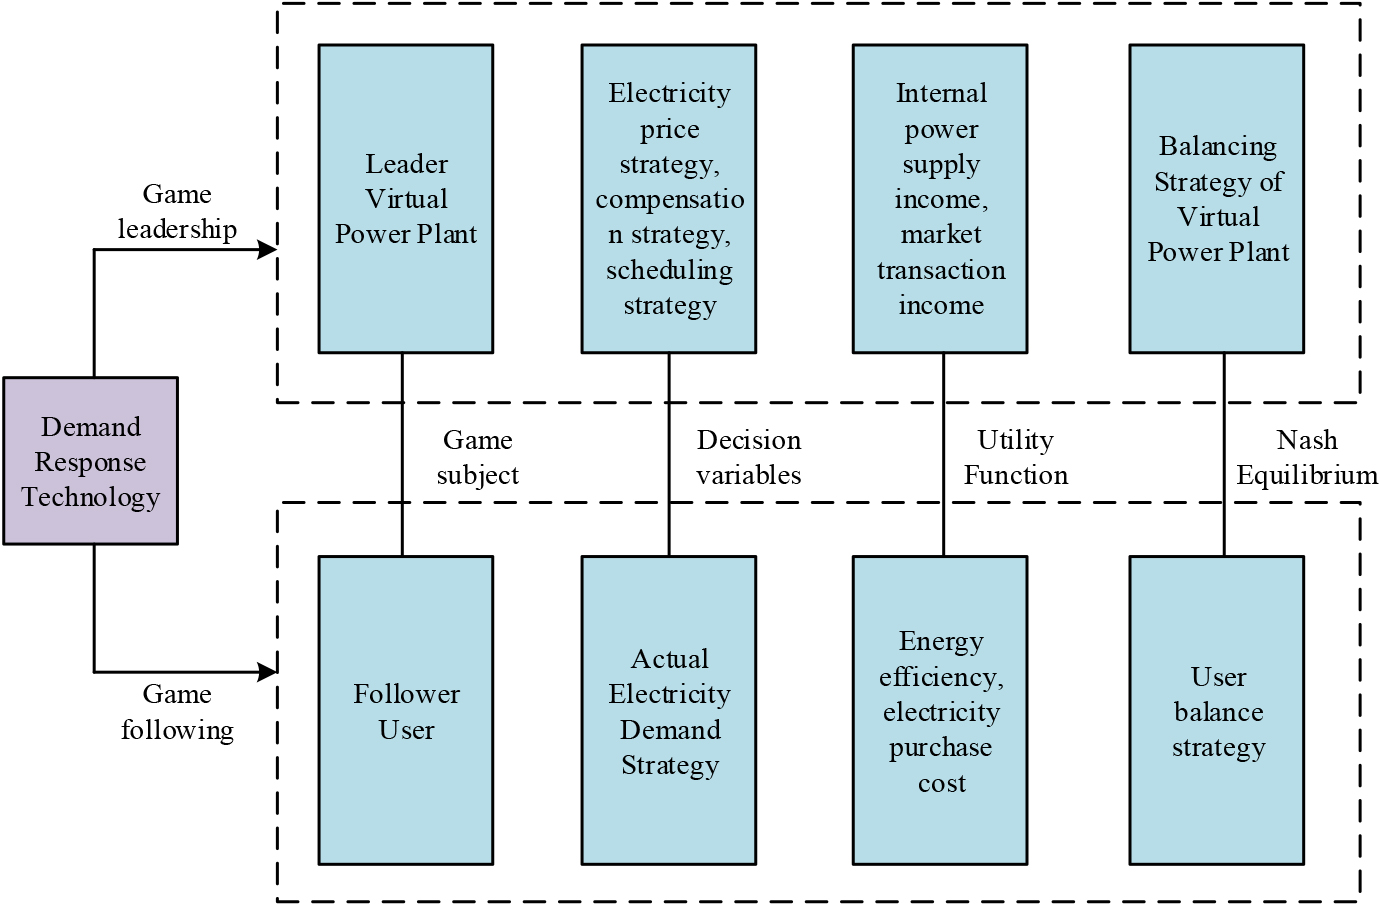
The objective of the VPP operator in the upper level optimization problem is to guide the power consumption demand of the users in the system in the coming day by setting the internal power consumption price for each time period and encouraging the users to actively participate in incentive-based demand response with certain allowances. Such an objective aims to achieve the peaking role of the VPP and to maximize the benefits of the VPP itself while ensuring stable system operation. For ensuring that the real-time electricity consumption price set by the VPP operator for internal users remains within a reasonable range, it is necessary to set limits on the maximum and minimum values of the electricity consumption price, as well as the constraint expression is shown in Eq. (11).
In Eq. (11),
In Eq. (12),
In Eq. (13),
The objective function is approximated in the form of a convex function, thus realizing the proposed convex objective. This is shown in Eq. (15).
The game between the operator and the users of the VPP system can be expressed by a two-layer optimization model. By solving the two-layer optimization model, the Nash equilibrium solution of the optimization model of the VPP system could be gotten. The scheduling problem of the VPP system is formulated as a two-layer optimization issue and the mixed integer decision variables are used to describe the problem.
VPPs can develop reasonable bidding strategies to optimize their returns in the carbon trading environment and ensure that participants receive fair returns in carbon trading through appropriate revenue sharing mechanisms. First, based on collected data and market forecasts, VPPs develop bidding strategies, including selecting markets to participate in, determining the amount of electricity to bid for and the bidding price. Second, VPP establishes a day-ahead bidding model, which takes into account market supply and demand, competitors’ behavior, technical constraints, and carbon rewards and penalties, and solves the day-ahead bidding model using appropriate optimization algorithms or numerical methods to obtain the optimal bidding strategy and results. Consider the impact of carbon rewards and penalties, and incorporate carbon emission reduction contributions into allocation considerations to encourage low-carbon emission power generation and energy consumption behaviors. The revenue allocation process for a specific VPP is showcased in Fig. 4.
VPP day-ahead bidding model and revenue distribution flowchart considering carbon trading.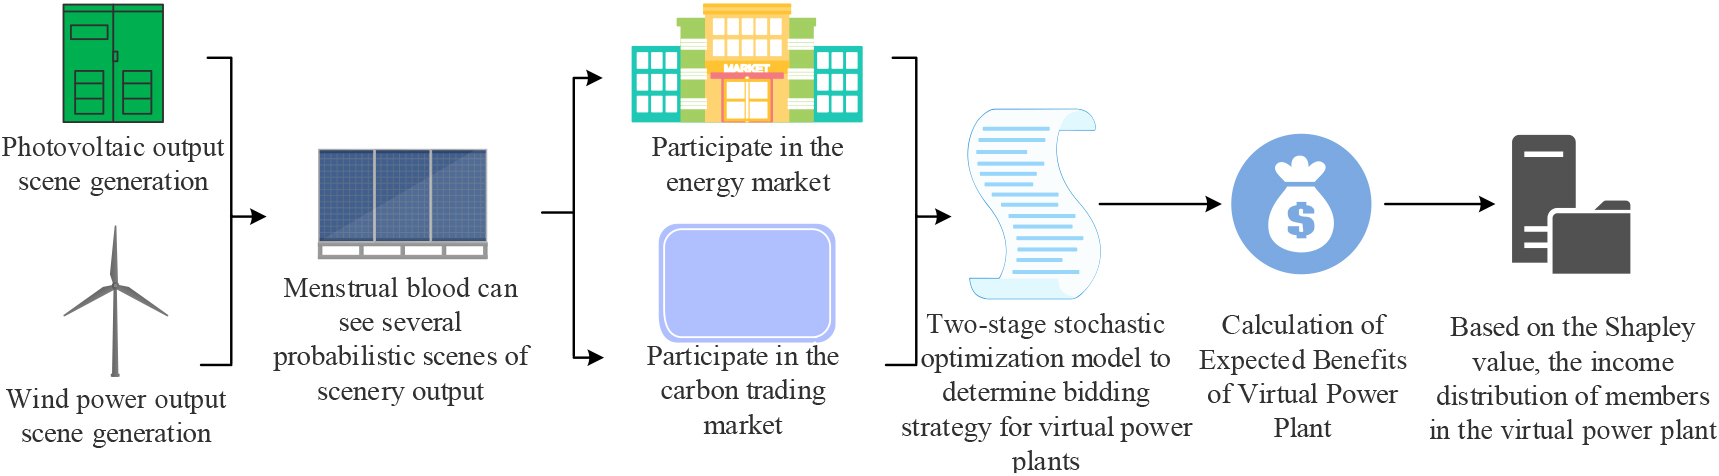
The last part of the revenue allocation is the VPP revenue allocation on the ground of Shapley value, and the study explores how to equitably allocate the revenue of each participant within the VPP cluster by combining the game model. Shapley value is a concept in game theory used to measure the degree of each participant’s contribution to the outcome of the game [20]. The allocation method of Shapley value is utilized for distributing the benefits of the VPP cluster, and the distribution of benefits of each VPP member is shown through Eq. (16).
In Eq. (16),
Benefits of different alliances
According to Table 1, the benefit distribution model under the carbon reward and punishment mechanism can be derived as shown in Eq. (17).
In Eq. (17),
Under the carbon incentive mechanism, VPP clusters are able to provide electricity supply in a more environmentally friendly and sustainable manner and receive corresponding economic incentives. The study will analyze the benefits of VPP clusters based on carbon incentives and penalties, and explore the operation strategies and benefit distribution of VPP under the influence of the carbon market, through which targeted strategies and decision support can be provided for the operation of VPP clusters to achieve a win-win situation in terms of carbon emission reduction and economic benefits.
Analysis of VPP strategies under carbon incentive pricing
The study aims to investigate the operational strategies of VPP operators for different types of user scenarios. The VPP operator dispatches its internal equipment for satisfying the requirements of industrial, commercial and residential customers, and participates in the external energy market. Meanwhile, in order to respond to the “dual carbon target” policy, the virtual plant operator also obtains carbon allowances by participating in the traditional carbon trading market. The focus of the study is to analyze the behavioral characteristics of users and construct a VPP model to maximize the utility function of supply and demand for achieving the optimal equilibrium strategy of supply and demand. The optimization results of the game equilibrium between VPP and users are showcased in Table 2.
Game equilibrium optimization results of VPP operators and industrial users
Game equilibrium optimization results of VPP operators and industrial users
By analyzing the results of the 24-hour day-ahead scheduling, it is possible to observe differences in the performance of different types of users in terms of carbon emissions. Commercial users have the highest carbon emissions, followed by industrial users, while residential users have the lowest carbon emissions, which is due to the fact that commercial users have the best performance in terms of the total customer load and the amount of interruptible load during the peak hours, leading to their relatively high carbon emissions. Commercial users achieved the best performance, followed by industrial users, and residential users performed the worst in terms of operating revenues of the VPP operator and subsidized revenues of users during peak hours. The optimization results for the three user types are showcased in Table 3.
Optimization results for three user types
In accordance with the outcomes presented in Table 2, the price-based demand response (PBDR) strategy was adopted for different types of follower users to optimize their electricity consumption behavior. For industrial users, the implementation of PBDR resulted in a 17% reduction in peak-to-valley differentials and a 6% increase in daily load factor, indicating that industrial users benefited from system peak shaving and operational economics. Commercial customers experienced a 12% reduction in peak-to-valley differentials and a 6% increase in daily load factor, which is not as pronounced as industrial customers, but still shows that PBDR has a significant impact on commercial customers. However, the peak-to-valley differential for residential customers was reduced by only 8% and the daily load factor increased by 4%, indicating that residential customers are less responsive to PBDR, and especially weak in peak shaving and valley filling. The tariff strategies developed by the operators of the three types of users are shown in Fig. 5.
The electricity price strategy formulated by the operators of the three types of users.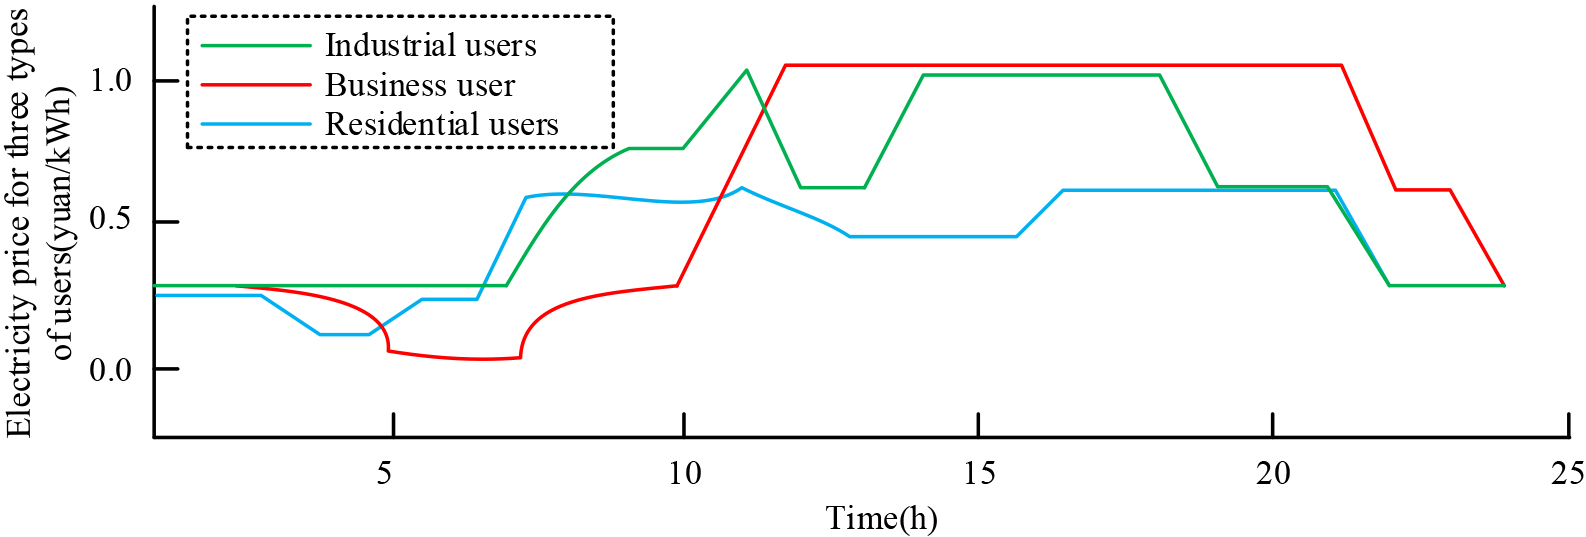
According to the observation results in Fig. 5, the following key points can be summarized. First, the electricity consumption tariffs of users show obvious differences in different time periods, and usually, the electricity consumption tariffs are the highest in the peak hours, the second in the normal hours, and the lowest in the valley hours, and this trend reflects the positive correlation between the increase in the demand of the users’ electricity loads and the market tariffs. Secondly, there are disparities in the characteristics of electricity tariffs for various types of users at various times of the day. Industrial users’ electricity load during peak hours, especially during 8–11 hours, is accompanied by an increase in wind power (WPO) and PV output, and the electricity output in the system is borne by clean energy sources; therefore, although the market electricity price continues to rise, the price of electricity consumption by internal users decreases instead, for improving the efficiency of electricity consumption as well as promoting the consumption of clean energy sources. Residential customers also show low values of electricity prices during the 7–13-time period, similar to the case of industrial customers. However, commercial customers’ electricity loads are consistently in the peak hours during the 10–21-time period, during which they have higher loads and clean energy has been sufficiently consumed, and thus higher electricity prices are needed to guide customers’ electricity consumption. Finally, except for the variability in specific time periods, consumer electricity prices gradually converge to the time-of-day tariffs in the external electricity market in other time periods, which coincides with the decrease in the output of clean energy sources, like WPO. The PBDR response power loading strategies for the three types of users are shown in Fig. 6.
PBDR response power load strategy for three types of users.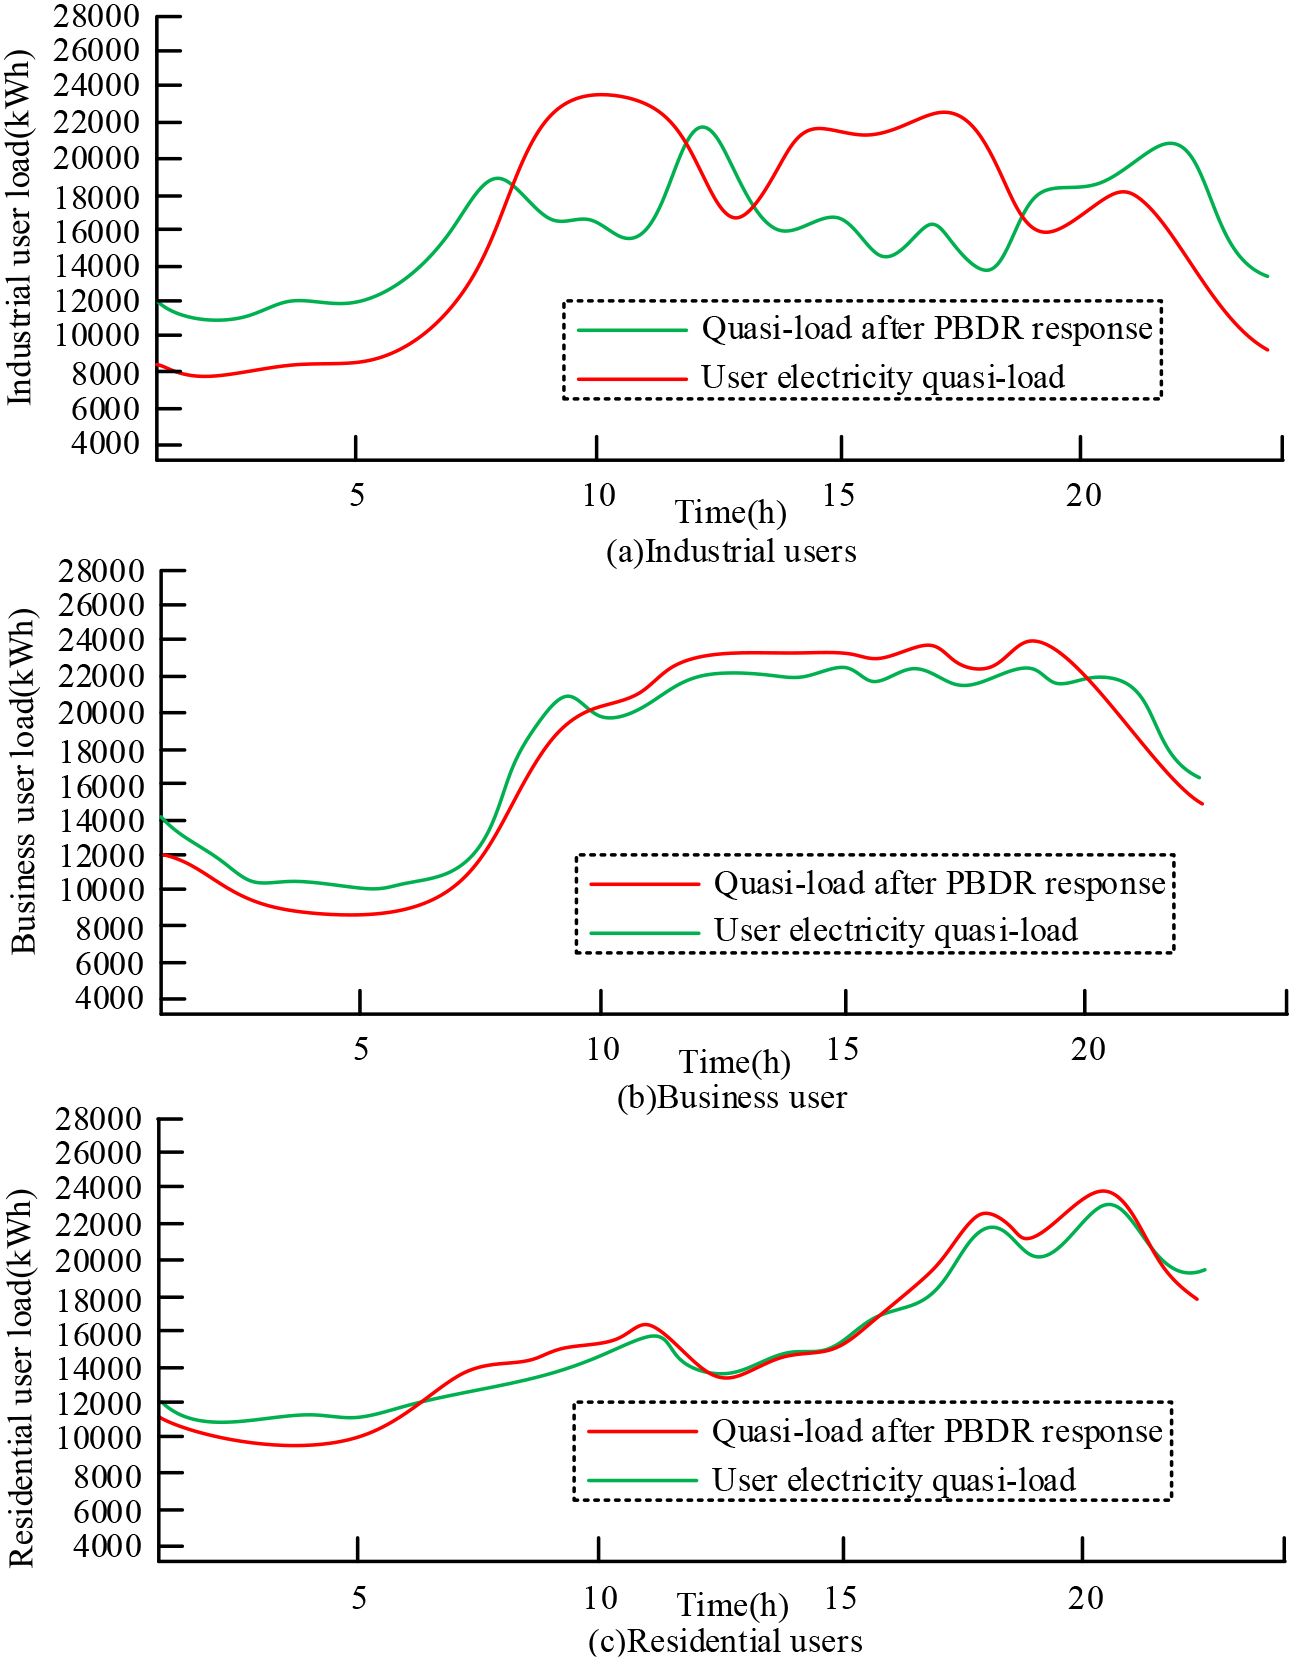
The following key observations can be made from the analysis results in Fig. 6. First, by implementing the PBDR strategy and using price changes to guide the electricity consumption behavior of internal users, different types of users show obvious differences in electricity load changes, especially industrial users, whose electricity load curves show obvious cuts. Peak fill valley characteristics. During valley hours, the electricity load of industrial users increases significantly, while during peak hours, the electricity load decreases significantly. This shows that industrial users are highly sensitive to price and can flexibly adjust their electricity consumption behavior to adapt to price changes in different time periods. In contrast, the electricity load curve of commercial users presents a typical peak period that lasts for a long time. There are also certain fluctuations in the electricity load curve of residential users, but the changes are smaller. Because residential users have regular lives, stable electricity demand, simple equipment, and do not involve complex management, so the changes in electricity consumption are small. IBDR’s response contract compensation strategy for three types of users is shown in Fig. 7.
IBDR response contract compensation strategy for three types of users.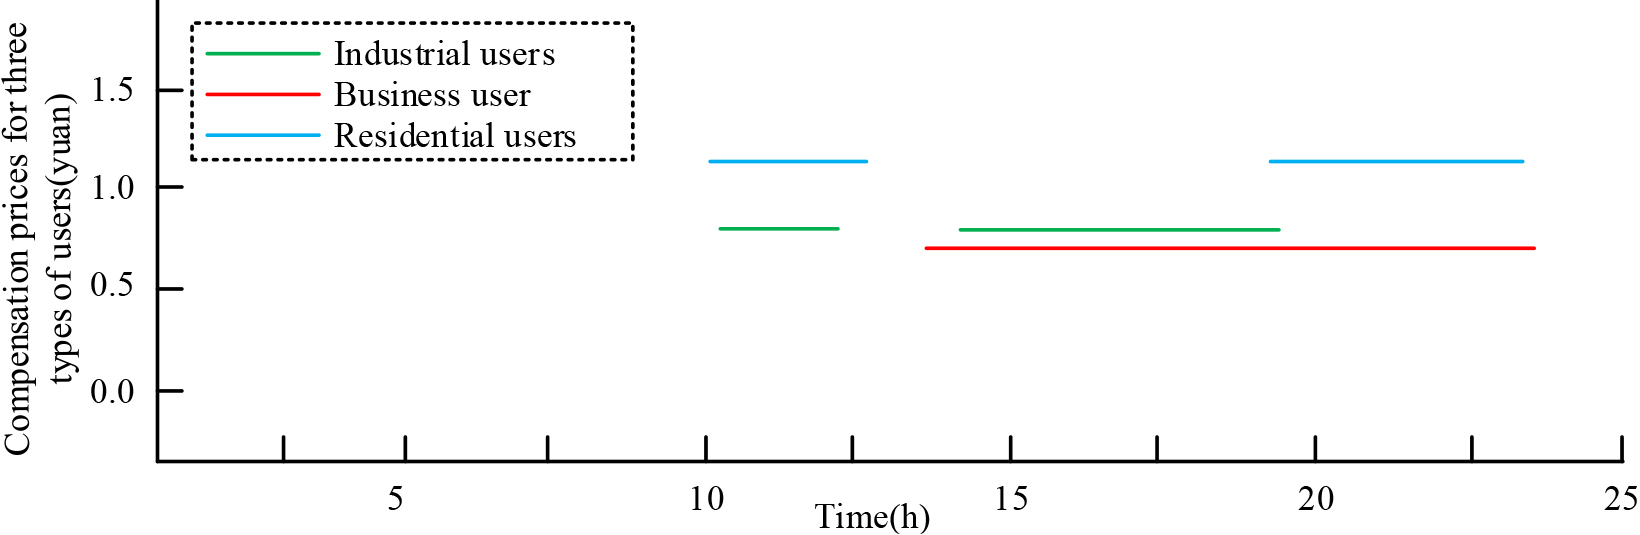
By looking at Fig. 7, firstly, different types of users have different utility and willingness to participate due to their own electricity consumption, which leads to the VPP providing them with different peak subsidy prices. Specifically, the peak subsidy price is RMB 1.8/kWh for industrial users, RMB 1.7/kWh for commercial users, and RMB 2.15/kWh for residential users. This implies that the VPP provides targeted incentives to users according to their types of characteristics and needs to motivate them to take actions to conserve electricity during peak hours. IBDR The interruptible load strategy for the three types of user response is shown in Fig. 8.
IBDR response interruptible load strategy for three types of users.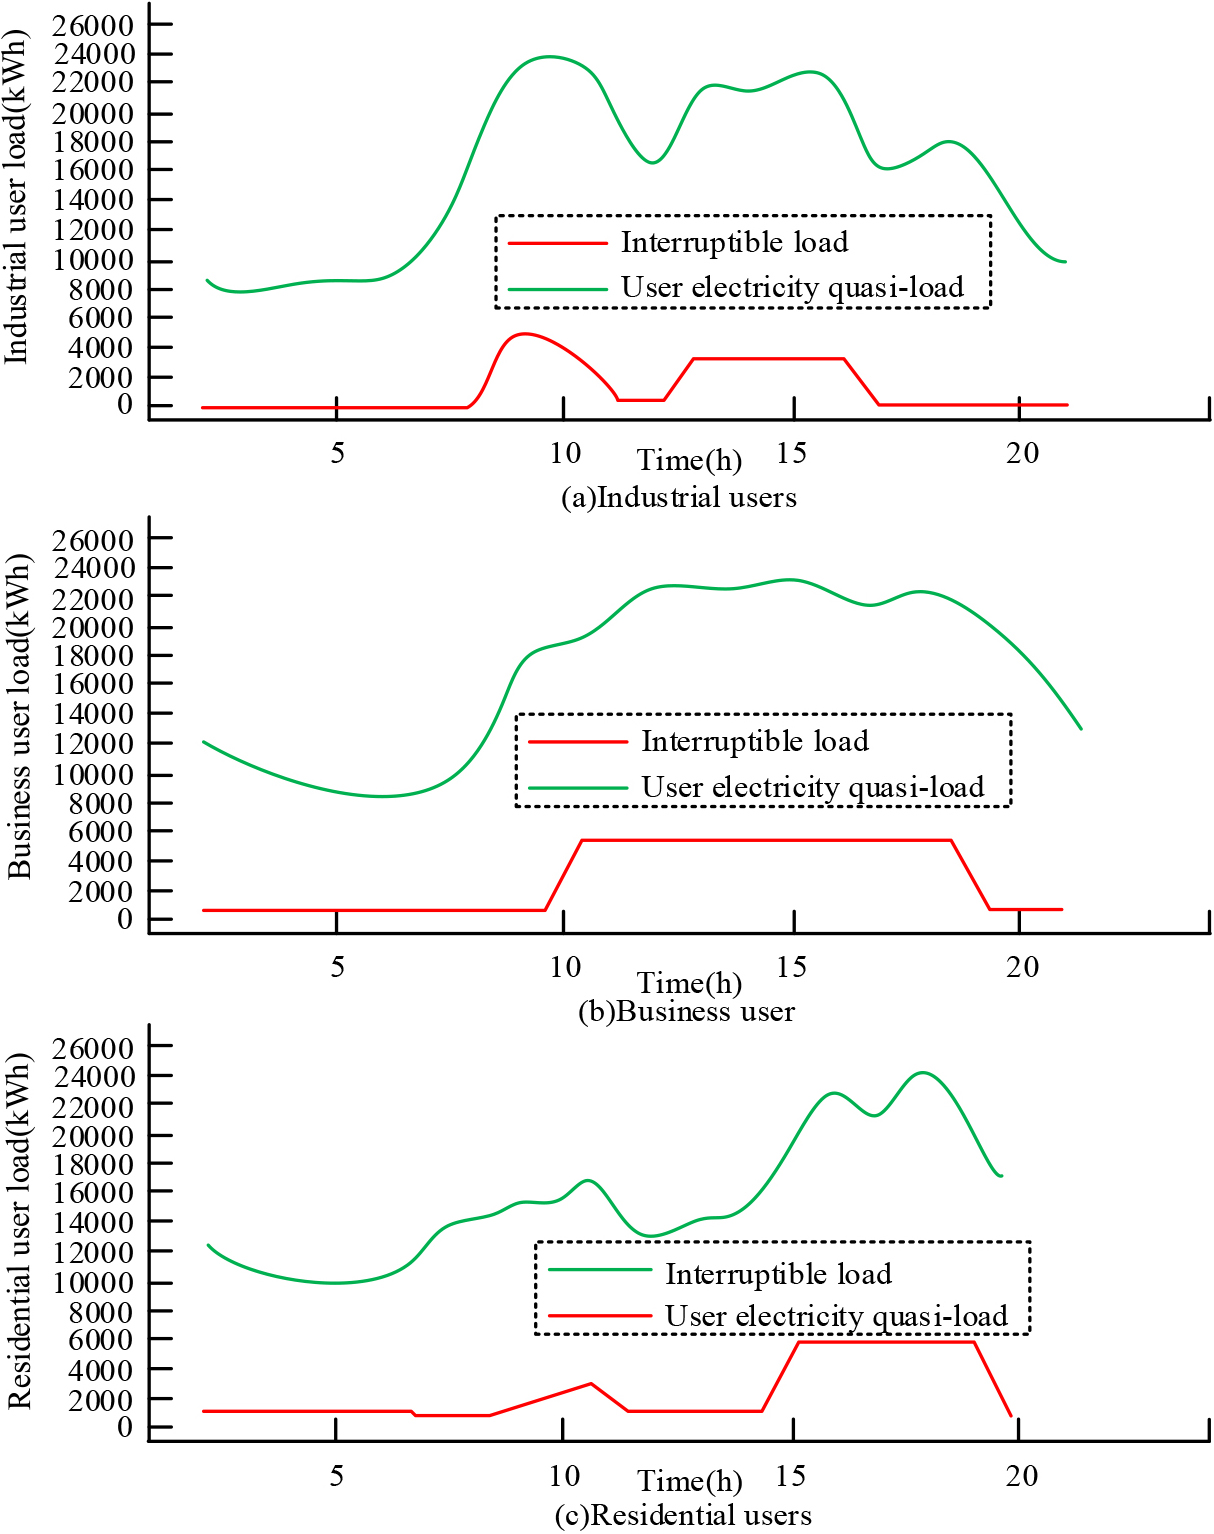
As can be seen from Fig. 8, residential customers show a positive attitude in IBDR, with a total interruptible load of 33.6 MW; commercial and industrial customers also have a high degree of demand response, with a total interruptible load of 30.1 MW and 55.0 MW, respectively. However, industrial customers have a relatively low degree of responsiveness, which is mainly limited by the peaking potential of their electricity-using process equipment. The commercial users performed well in terms of concentration of peak hours and smoothness of load profiles, making them suitable as interruptible users. To further promote demand-side management, the study should enhance the dissemination of smart electricity demand response policies to increase user participation and awareness of electricity saving.
The study proposes an optimal operation model of a VPP cluster considering carbon trading, which aims to achieve carbon emission reduction by optimizing the allocation of power resources, and involves the linear programming solution of a mixed integer linear programming problem and a Shapley-valued revenue sharing problem. For addressing these issues, the study used the YALMIP/CPLEX tool in MATLAB to solve the model in order to obtain the optimal operation strategy and revenue allocation scheme. Finally, a VPP containing 10 micro GTU units MT, a WPO producer WP, a photovoltaic producer PV, and an energy storage system is considered in the study, where these components work together to provide a reliable and low carbon emission electricity supply. The amount of bids and OPO at risk is shown in Fig. 9.
Risk-neutral bidding volume and OPO.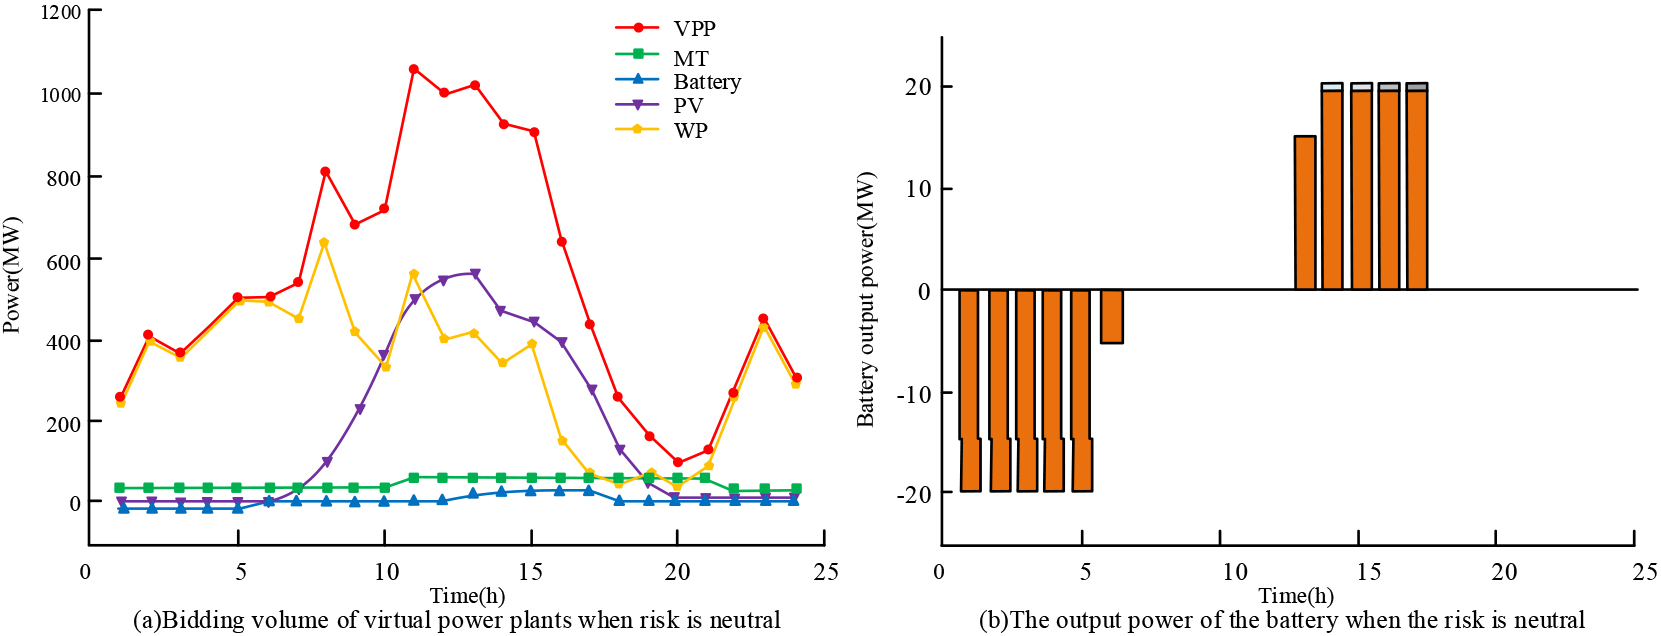
By observing the OPO curves in Fig. 9a, it demonstrates that the battery performs charging and discharging operations at different times. During low demand and peak WPO output, the batteries are charged to store power, while during high demand and low WPO output, the batteries are discharged to release the stored power. This charging and discharging strategy helps to balance the power supply and demand in the system. Meanwhile, the bidding results in Fig. 9b can be used to observe the participation of VPPs in the carbon and electricity markets. In addition, when the risk appetite coefficient
According to the results of the analysis, the returns of VPP are affected by the value of
Comparison of revenue outcomes of VPP
Yield profile and bidding strategy.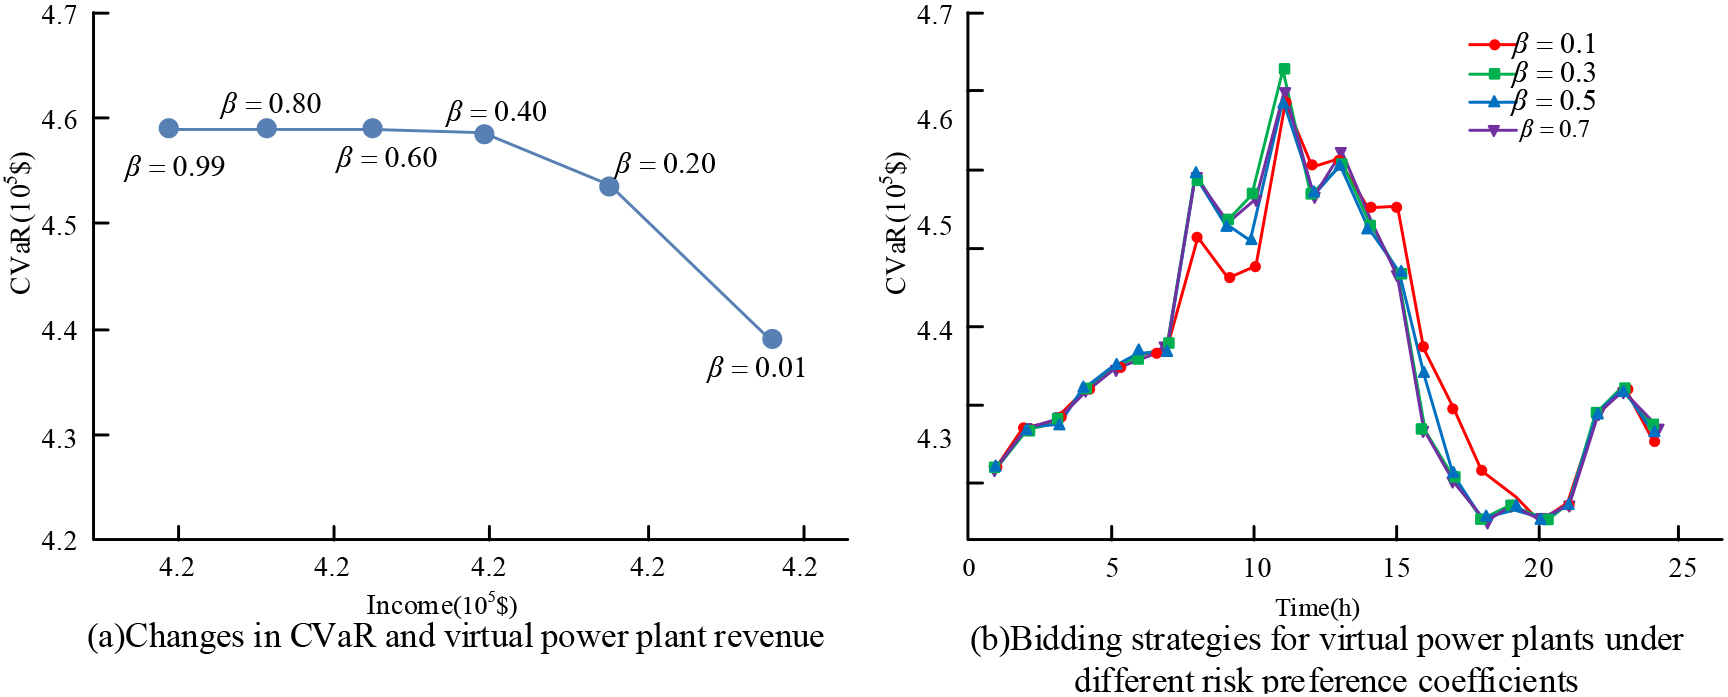
Collaboration and carbon trading bring significant benefits to the VPP. First, the VPP consists of four main players: micro GTU units, storage batteries, wind turbine operators and photovoltaic generators, which are replaced by 1, 2, 3 and 4 in the table, with a total of 15 non-empty sub-consortia. When carbon trading is considered, the total revenue of the VPP increases by about 5.55% compared to when it operates alone, which means that through cooperation and carbon trading, synergies are realized among the members of the VPP and higher revenues are obtained. According to the results of the Shapley value, the micro GTU unit has a gain of 1.88
For promoting the use of REN and carbon emission reduction, the study presented a VPP cluster revenue allocation method on the ground of the carbon reward and punishment mechanism, which first establishes a VPP model, then optimizes it so that the model can preferentially supply electric energy units with low carbon emissions, then constructs a game model within the cluster, and finally allocates the revenue of each VPP of the VPP cluster on the ground of the revenue contribution. The results show that there are differences between different types of users in terms of carbon emissions and economic benefits. Commercial users have the highest emissions, followed by industrial users, and residential users have the lowest emissions. In the optimized user behavior, the peak-to-valley ratio of industrial users is reduced by 17% and the daily load factor is increased by 6%. For commercial customers, the peak to valley differential is reduced by 12% and the daily load factor is increased by 6%. Peak to valley differentials for residential customers were reduced by 8% and daily load factor increased by 4%. Collaboration and carbon trading provide significant benefits to the VPP, with total VPP revenues increasing by approximately 5.55% compared to stand-alone operation. Micro-GTU units yielded 1.88
Footnotes
Funding
The work was financially supported by Science and Technology Projects from State Grid Corporation of China, (Research and Application of Key Technologies for Economic Operation of Virtual Power Plant Considering Real-time Carbon Flow, 5108-202218280A-2-383-XG).