
Abstract
The rise of social networking in today’s society has brought convenience to people’s lives, but at the same time people are also suffering from cyberbullying. How to check these bullying languages has become a popular problem. As text is an important vehicle for online social networking, the natural language learning, representation, and training becomes a necessary work for cyberbullying detection. In this paper, we summarize and analyze the existing work by studying it, and then finally propose new ideas and experiments. The specific method is based on the LSTM model, in which the parameters and dimensions are adjusted to demonstrate the best results of the model. And a user rating system is used to detect bullying more effectively.
Introduction
Cyberbullying, also known as cyberbullying, is the act of using the virtual world of the Internet to cause real emotional harm to others, i.e. repeatedly abusing, humiliating or intimidating others through social software, online interactive platforms, mobile phone and computer game exchanges. With the rise of various social networking software, “cyberbullying” has become a global trend and a growing social problem [6]. This phenomenon can cause tremendous psychological damage to people and affect their healthy development and growth.
The objective of this paper is to propose a more accurate identification of bullying speech on the Internet, so we analyze and summarize the existing work in terms of both research subjects and research methods, and propose a innovative experimental combination based on previous research.
In this paper, our paper describes the specific process of this experiment, describing the specifics from datasets selection to data pre-processing, model building, model training, to deriving experimental data, and concludes with user directions. We have also performed some experiments containing the most important algorithms and parameters for this experiment. It describes the work of the algorithms under study in the form of pseudo-code and explains the two mathematical parameters in the experimental results of this paper.
In the presentation of the experimental results, we show the effect of adjusting different whole parameters on the experimental results and synthesize the summary of the most suitable parameter values for this study, and add the basic analysis and classification of the network users to the traditional text training as a way to increase the accuracy of bullying detection, which is the purpose and result of the experiment.
Our study has been organized as follows: Section 2 describes the academic background and reference sources for this experiment; Section 3 gives the details of our method; Section 4 offers experiments to verify our method and our conclusions are presented in Section 5.
Related work
In fact, many experiments and studies on cyberbullying detection have been presented today. We can classify the established literature according to three different aspects, namely Different Research Objects, Different Research Methods, and Different Metric and Factors. as shown in Tables 1 and 2 above.
Different research objects
Different research objects
Different research methods
Table 1 divides the investigated objects into methods with language as the object of detection and methods with users as the object of detection. In addition, the algorithm has many implementation purposes, which are mainly divided into bullying detection purposes and prediction purposes. In Table 1, two separate and distinct criteria will be used to classify the objects of study into different types.
1) User purpose. There are two kinds of purposes for establishing relationships here. Detection or prediction. The purpose of detection is to better analyze the social cyberbullying phenomenon, usually by extracting features from existing information and then training an effective model to detect cyberbullying, while prediction is based on detection and can predict the occurrence of bullying one step ahead.
It is worth mentioning that no suitable method has been found to predict bullying one step ahead of time, and one of the aims of this paper is to provide a basis for future research on bullying prediction, which will be the future direction of research.
2) Data features. There are two types here. Using user relationships or no user relationships. The traditional detection method is trained by published content, so most of the existing articles use this method. However, experimental methods with a user perspective have also emerged, specifically by analyzing individual user information, language patterns, and user-user interactivity to detect verbal bullying.
According to Table 2 it can be seen that in the choice of investigation methods can be distinguished in terms of datasets and training models. There are two types of datasets: multiple datasets or single datasets. A single dataset indicates that only one dataset is used for each experiment, including the same data source or multiple data sources mixed to form one dataset. And multiple datasets mentioned in the classification represent that different datasets are used in the experiments, and the experimental results of each dataset are controlled separately. There are two approaches in model training methods: no combination model or presence of combination model. The training models for text are divided into traditional machine learning models and models that combine multiple algorithms.
Since the extant studies have been done by combining the three tables mentioned above, in summary we conclude that the combined method of Object I of Table 1 and Method I of Table 2 is unstudied. So this experiment uses two datasets for research based on this, we get the user information and comment information of Twitter and YouTube through crawlers, and these two datasets are trained separately in the experiment, and finally the average level of each training is taken as the final result. As for the research method, we need to combine text training and user analysis to perform bullying detection, and the specific process is detailed in Chapter 3. And for the final evaluation and parameters, we vary the algorithm to derive the precision, recall and f-measure values.
This chapter describes in detail the workflow and implementation process of this experiment, and the framework is shown in Fig. 1.
Experimental procedure.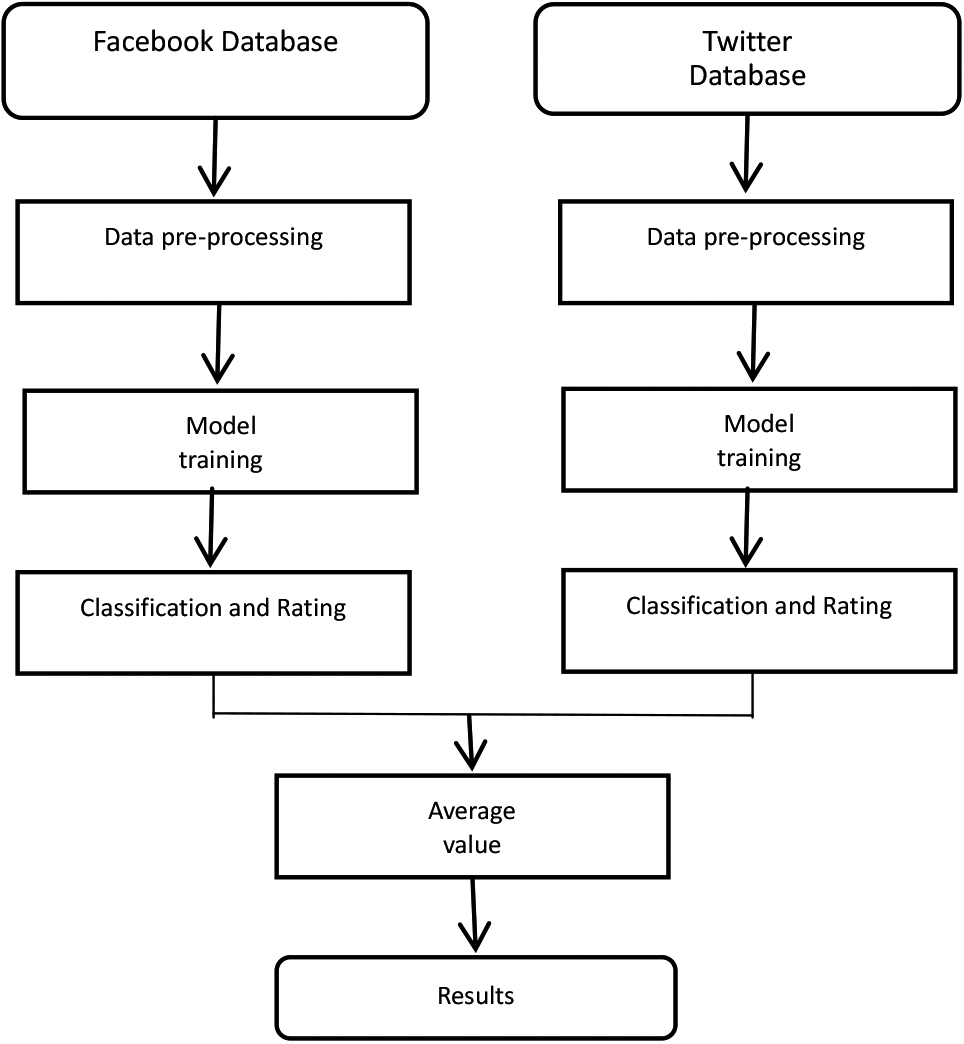
Firstly, the prepared datasets from two different sources are preprocessed with data separately as described in 3.1. Next, the processed data are put into the setup model for training respectively. Finally, the results of the two training sides are combined and an average value is taken out as the final complete result.
The pre-processing process consists of removing deactivated words and converting words into word vectors. Firstly, the text content in the datasets is removed from the deactivated terms, which are words filtered out during natural language processing and manually entered and generated non-automatically. The deactivated words for this experiment come from a corpus, Natural Language Toolkit (NLTK). NLTK is an open-source project containing: Python modules, datasets, and tutorials for natural language research and development. NLTK was developed by Steven Bird and Edward Loper at the University of Pennsylvania’s Computer and Information Science Department [11].
The following method used to convert the filtered words into word vectors is the word2vec model. word2vec is a set of related models for generating word vectors. These models are shallow two-layer neural networks trained to reconstruct linguistic text. The web is represented by words that must be inferred for all input words in adjacent positions. Under the assumption of the bag-of-letter-words model in word2vec, the order of the words does not matter. After the training results have been done, each word can be mapped out as a vector by using the word2vec model; this vector can also be widely used to express the relationship between the mapping from words to other words; this vector is the hidden layer of the neural network [12]. Finally, the processed word vector is fed into the model for training.
Model training
This paper uses an improved model of RNN: Long Short Term Memory (LSTM), which is what we call LSTM, this model is specially designed to solve the long-standing problem of RNN [18]. RNN has some memory when coping with short sequence problems, but once the text is too long, the interval between sequence data will increase, to some extent. All recurrent neural networks have a chain structure of recurrent modules, and the part of this chain that is recurrent3 is a neural network module. In some standard recurrent neural networks, this repeating structure of the module is very simple.
LSTM is also a recurrent, repetitive module chain structure, however, each recurrent module will possess a different chain structure from a normal RNN [19]. Unlike a single neural network layer, there are also only four, and they interact very specifically on the network. This experimental model implements the long-term and short-term memory of the network model through input gates, forgetting gates, and output gates. Since the LSTM model is carefully designed to avoid the long dependency problem, its default behavior is remembering longer history information.
Cyberbulling classification and user ratings
This experiment first classifies the text data into three categories: positive, negative and neural by model classification. It labels them with corresponding labels to rate the speech according to the classification. Positive represents all speech expressing positive emotions, such as compliments and encouragement to other users, etc. neural represents ordinary, non-intense emotional Neural represents ordinary, non-emotional speech. Negative, on the other hand, stands for aggressive bullying language. Our scoring criterion is that speech classified as negatively labeled is rated as 0, text classified as neural is rated as 2, and text classified as positive is rated as 4. The classification of speech is to detect bullying, while the scoring is to differentiate between each network user. After we finish scoring the text, we calculate each user’s score. The scoring is done by averaging all of the user’s remarks after scoring them. Scoring users will make it easier to distinguish users prone to cyberbullying, and this data can be referred to and combined to help research on cyberbullying.
Performance analysis
Performance metric and workload
Experimental settings
We have conducted data retrieval and crawling on social platforms Twitter and YouTube, and the data is collected based on users. We collect basic information about the users and their remarks on the online platforms so that the datasets are not isolated remarks, but have their relational vein, which is more helpful to explore the relationship between users and remarks. Finally, we collected two datasets, each of 800,000 in length, from Twitter and YouTube. Both datasets contain bullying speech, which we classify as negative, positive speech, which we classify as positive, and normal speech, which we classify as normal. Both datasets are trained separately in the experiment, and the final results are taken as their mean values.
The main environment of this experiment is based on Keras, an advanced dynamic neural network API written in Python. The experimental server configuration is: graphics card model GeForce RTX 3060, the number of CPUs is 2, the number of CPU cores is 16, and the disk capacity is 250 G. Among the systems we choose is Ubuntu, Python version 3.8.5, and TensorFlow and Keras version 2.4.0.
Metric
In our experiments, we use 3 metrics to evaluate the performance of our models. First introduce the confusion matrix where the rows of the matrix denote the factual categories of the samples before classification, and the rows of the matrix shows the prediction of the type of the sample after classification.
Confusion matrix
Confusion matrix
The specific evaluation method is as follows:
The first is the metric precision, which is usually defined as the proportion of samples with the correct actual category and the correct predicted category among all samples with the correct predicted category. The formula is
TP in the formula indicates true positive and FP indicates false positive.
The second metric is recall, which is defined as the proportion of actual positives. The formula is
The FN in the formula stands for false negative.
Precision and recall are a pair of metrics with opposite trends; typically when precision is high, recall values are low, while when precision values are low, recall values tend to be higher. In order to be able to consider these two metrics together, F-measure is proposed (a weighted summed average of Precision and Recall), and the formula is calculated as follows [13].
The core idea of F1 is to make accuracy and recall as high as possible, but at the same time to ensure that the differences between them are as small as possible.
Parameter values for different number of layers
In our experiments, in order to evaluate the performance of the algorithm for this experiment, the LSTM model is utilized in the case of using two identical datasets, and their precision, recall and F1 score are compared under different LSTM layers by adjusting different parameters of the algorithm to find out the more suitable parameters for this experiment. The specific experimental results are plotted in the following comparison graph.
Precision with different LSTM layers.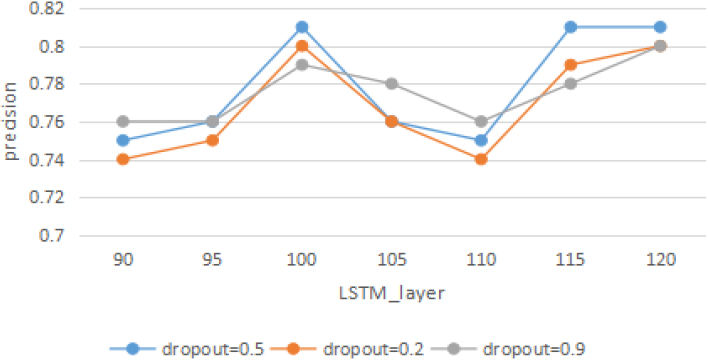
In Fig. 2, the horizontal axis is the number of LSTM layers and the vertical axis is the precision rate. It is obvious from the figure that the LSTM layers are between 90 and 95, there is a significant increase from 95 to 100 layers, and all the three lines reach their respective highest points. The precision reaches 0.81 when the word embedding layer dropout is 0.5. While there is a decreasing trend from LSTM layers 100 to 110, dropping approximately to a starting point between 0.74 and 0.76. However, when the number of layers reaches 115, the precision rises sharply again, and after the number of layers is greater than 115, the precision stays around 0.8.
Recall with different LSTM layers.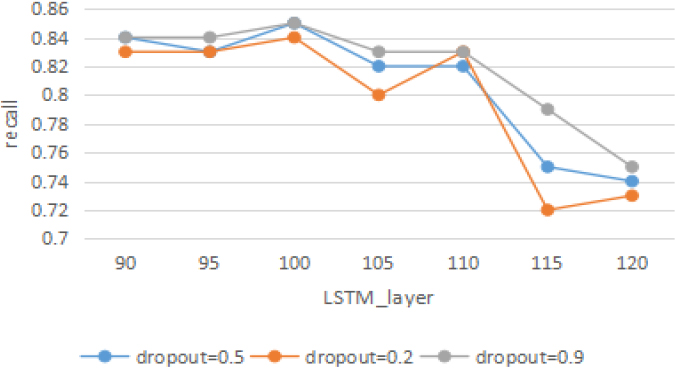
Figure 3 shows that the LSTM layers are between 90 and 95, and the recall value remains relatively high, stabilizing between 0.82 and 0.84. There is a slow increase from 95 to 100 layers, with all three lines reaching their respective highs of 0.84, 0.85, and 0.85, respectively, and from LSTM layer 100 to 105 decreased by 0.02 to 0.04. However, in the process of reaching 110 layers, there is no change in the precision of the word embedding layers with dropout of 0.5 and 0.9. The recall with dropout of 0.2 increases by 0.03 and drops sharply to 0.72 between layer 110 and layer 115, it is the lowest point of this figure. After greater than 115 the change is slower and the recall value converges to 0.74 overall.
F1-score with different LSTM layers.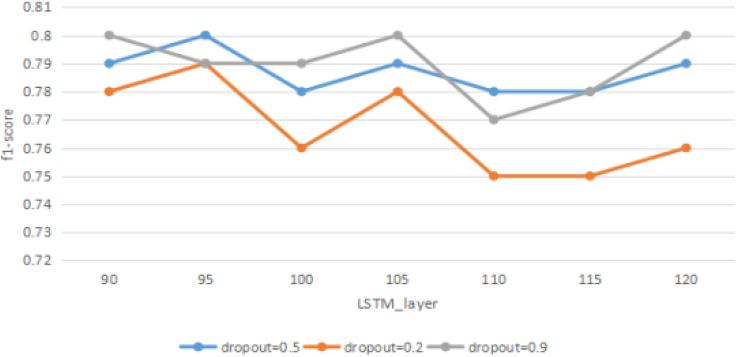
Figure 4 shows that LSTM layers fluctuate and change in f1-score values between 90 and 105, where the three different dropout values are the same at layers 90 and 105, which is 0.78. The importance of the f1-score drops to the lowest point during layers 105 to 110, where the lowest value of dropout is 0.2 for the word embedding layer, reaching 0.75. The value increases slowly after it becomes more significant than 110.
The above three figures can be summarized that the value of the f1-score reaches the peak when the number of LSTM layers is 95, so the number of LSTM layers in this experiment is chosen to be 95.
In order to continue to evaluate the performance of the algorithm for this experiment, we utilize the LSTM model in the case of using two identical datasets and compare their precision, recall, and F1 score under different LSTM dropouts by adjusting various parameters of the algorithm to find out the parameters that are more suitable for this experiment. The specific experimental results are plotted in the following comparison graph.
Precision with different LSTM-dropout.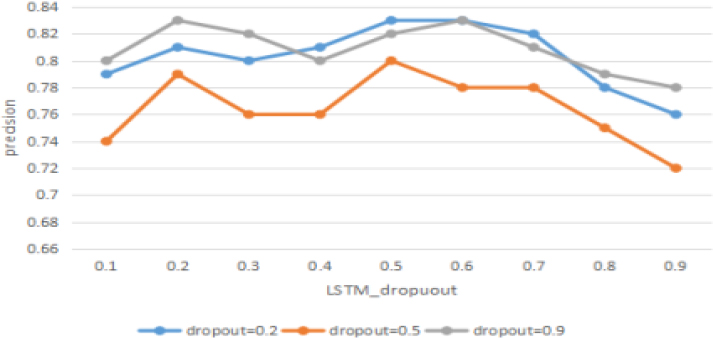
Figure 5 shows that the accuracy trend increases sharply when the LSTM-dropout value is between 0.1 and 0.2, and there is a slight decrease from 0.2 to 0.3. When the LSTM-dropout value reaches 0.5, the accuracy peaks at 0.8 to 0.83. Finally, it keeps a decreasing trend from 0.5 to 0.9.
In Fig. 6, it shows that the LSTM-dropout values range from 0.1 to 0.3, the recall values remain at a relatively high value without significant changes, with the three lines distributed around 0.62, 0.72,0.82, respectively. From 0.3 to 0.5, there is a significant decrease to the lowest point of the three lines, 0.58, 0.61, and 0.76, respectively, while from LSTM-dropout values of 0.5 to 0.8, there is a slow decreasing trend until 0.9 stabilizes.
Recall with different LSTM-dropout.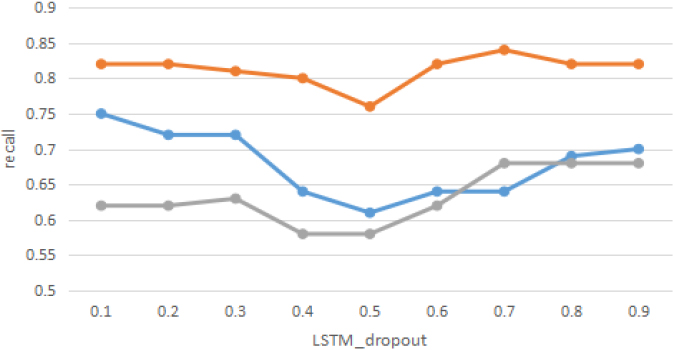
F1-score with different LSTM-dropout.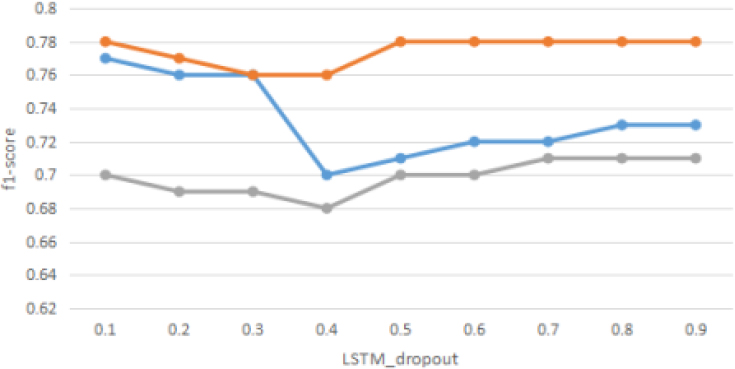
Figure 7 shows the f1-score values have a slight decrease in LSTM-dropout values between 0.1 and 0.3. And in the interval from 0.3 to 0.4, the trend of the word embedding layer dropout value of 0.9 remains slowly decreasing, and the value of the word embedding layer dropout value of 0.5 remains unchanged. In contrast, the word embedding layer dropout value of 0.2 decreases rapidly from 0.76 to 0.7. Finally, in the process of LSTM-dropout value from 0.4 to 0.9, the tending to three lines converging to 0.78, 0.73, and 0.71, respectively.
From the above three tables, it can be concluded that the accuracy value is higher when the LSTM-dropout values are at 0.2, 0.5, 0.6, and 0.7, while the recall values are higher at 0.1 to 0.3 and 0.6 to 0.9. Therefore, the integrated f1-score value is also chosen as 0.2 in this experiment in order to prevent overfitting.
In this paper, we provide a bullying detection algorithm based on user relationships, multiple datasets and a single model. We summarize the existing work to create innovative methods for bullying and detection. In the future, we will continue our research in the following directions: Rating and categorizing users based on their textual speech and the relationships between them, thus requesting predictions about which groups and address users are more likely to engage in bullying behavior. Having predicted potential bullying behavior, appropriate measures can be taken to reduce the probability of bullying behavior, for example, by recommending less information to users about groups they may be bullying or by reminding users to be aware of what they say beforehand.