
Abstract
Introduction
Nowadays the change of lifestyle in modern society has highlighted new crucial aspects from nutritional point of view. Diet is not considered anymore a tool to satisfy the appetite, but it is becoming an essential factor closely related to human health. Indeed, the excessive or inadequate food intake could be one of the causes of various diseases onset, while the careful choice of food can help to maintain a good well-being and to prevent chronic illnesses [1]. From this point of view, fruits and vegetables are the foods with the highest amount of bioactive compounds, demonstrating remarkable beneficial effects on human health. Among edible fruits, berries of the family Rosaceae (Rubus and Fragaria) are especially rich in antioxidant compounds [2–5] and among them strawberry (Fragaria x ananassa) is the most commonly consumed in the Mediterranean diet [6–9].
Regarding nutritional composition, one of the most relevant aspects is its high content of vitamin C (about 60 mg per 100 g fresh fruit) [6, 7], that confers to strawberry a high antioxidant power and a relevant nutritional value. Also the remarkable concentration of folates (20–25 mg/100 g FW, one of the highest concentrations observed among fruits) assumes a preponderant role in the definition of strawberry nutritional quality [10]. In addition, strawberry contains other vitamins, such as thiamine, riboflavin, niacin, pyridoxine, vitamins A, E and K and is a notable source of manganese (a portion of about 150 g of strawberry can provide more than 20% of the daily requirement), and a good source of iodine, magnesium, copper, iron and phosphorus. Furthermore, strawberry fruits present an important content of dietary fiber which may contribute to regulate blood sugar levels by slowing digestion, and to control calorie intake by its satiating effect [7]. Beyond nutritive compounds, the strawberry is a rich source of non-nutritive elements, as phytochemicals, which may greatly influence the nutritional and organoleptic qualities of this fruit [11–17]. The main phenolic compounds present in strawberry are anthocyanins, flavonols, flavanols, and possess important antioxidant, anti-inflammatory, anticancer, and antineurodegenerative biological properties [18–22]. Indeed, strawberry consumption seems to be associated to the maintenance of a good health and well-being and to the prevention of many chronic pathologies, such as cardiovascular diseases, certain types of cancers, type 2 diabetes, obesity and inflammation [23–29]. Despite their proven health benefits, strawberries also contain allergenic compounds, as protein Fra a 1 which is considered the main cause of allergic reactions after consumption of these fruits [30]. Up to now, literature data about the cytotoxicity of strawberry extracts are contradictory. For these reasons, the aim of this study was to evaluate the possible cytotoxic effects of a polyphenol-rich strawberry extract on three commonly used cellular lines: HDF, RAW macrophages, HepG2. The choice fell on these different cell lines for various reasons: (i) HDF cells represent a standard in vitro model for different kind of toxicity determinations [31–33]; (ii) even if macrophages are considered the cells predominantly involved in the inflammatory response, they play an important role in allergy [34, 35]; (iii) HepG2 cells are a widely used model for biochemical and nutritional studies where many antioxidants, bioactive compounds and conditions can be assayed with minor interassay variations [36, 37].
Material and methods
Strawberry fruit collection
Ripe fruits from strawberries of the “Alba” cultivar were harvested from plants grown in an open experimental field for strawberry breeding and germplasm collection at the Azienda Agraria Didattico Sperimentale “P. Rosati” in Agugliano (Ancona, Italy). Within 2 h after harvest, whole fruits were stored at –80°C for further analysis.
For the fruits analysis and cell treatment, the hydroalcoholic extract was obtained from 10 g of fruits homogenised for 2 min in 100 ml (1:10 w/v) of extraction solution (80% methanol aqueous solution acidified with 0.1% formic acid) using an Ultraturrax T25 homogeniser (Janke & Kunkel, IKA Labortechnik). After homogenization the extraction was maximised by stirring the suspension for 2 h at 4°C in the dark. The mixture was then centrifuged at 1200× g for 15 min (twice sequentially), to sediment solids, supernatants were filtered through a 0.45 μm Minisart filter (PBI International), transferred to 5 ml amber glass vials and stored at –80°C prior to analysis.
For the HPLC-DAD-MS identification and quantification of anthocyanin, extraction and purification was performed as previously described [38] using a C-18 SepPaks Vac 6cc cartridge (Waters, Milan, Italy). Frozen strawberries (50 g) were homogenized in methanol containing 0.1% HCl, kept overnight (∼14 h) at 4°C and later filtered through a Büchner funnel under vacuum. The solid residue was exhaustively washed with methanol and the filtrates obtained were centrifuged (4000× g, 15 min, 20°C). The resulting extract was washed with n-hexane to eliminate liposoluble substances and then an aliquot (4 mL) was deposited onto a C-18 SepPaks Vac 6 cc cartridge (Waters) previously conditioned with methanol and washed with ultrapure water. Sugars and more polar substances were eluded with 15 mL of ultrapure water while anthocyanin pigments were eluted with 5 mL of methanol: 0.1% TFA (95:5). The methanolic extract was concentrated under vacuum in a rotary evaporator and the extract was then collected, brought to 2 mL of volume with ultrapure water and filtered through a 0.45-mm membrane filter (PBI international, Milan, Italy) for HPLC analysis.
For vitamin C determination, fruits stored at –80°C were ground to a fine powder using a precooled coffee grinder (IKA A11 basic). Immediately before analysis, 2 mL of ice-cold extraction solution was added to 0.5 g FW frozen powder weighed in 10 mL ice-cold glass tubes, and the mixture sonicated at 4°C for 15 min in the dark. The extraction solution consisted in MilliQ water containing 5% meta-phosphoric acid and 1 mM EDTA, stirred well prior to use, sonicated until dissolved and stored in the refrigerator. After the ultra-sound assisted extraction, cell walls and proteins were precipitated by centrifugation at 2500 rpm for 10 min at 4°C, the surnatant was filtered through a 0.2 μm PTFE filter into 1.8 mL HPLC vials, and immediately analysed.
Measurement of total phenolic content
The total phenolic content of the hydrophilic extracts was determined using the Folin-Ciocalteu colorimetric method, as modified by Slinkard & Singleton [39]. Briefly, 100 μL of alternatively blank (milliQ water), water diluted strawberry extracts or gallic acid standard solutions (1/10) were added to 500 μL of Folin-Ciocalteau reagent previously water diluted (1/10) and kept at 4°C, in the dark. The mixture was incubated for 1 to 8 min at room temperature, then 400 μL of 0.7 M sodium carbonate (Na2CO3) was added and the mixture vortexed well. The solution was incubated for 2 h at room temperature (∼23°C), in the dark, then the specific absorbance at 760 nm was read. A methanol:water (80:20, v/v) solution of 6 mM gallic acid (GA) was prepared, and stored at 4°C for at maximum one week. Serial standard dilutions (0.5–3.0 mM) were daily prepared from the stock solution, for quantifications. Calibration was obtained by plotting the known GA concentrations versus the corresponding absorbance760, and final results were expressed as milligrams of gallic acid equivalents per gram of fresh weight of strawberry [mg GAEq/g FW] (mean value of eight technical replicates)±SEM.
Measurement of total flavonoid content
Total flavonoid content was determined by using a colorimetric method described previously [40]. Briefly, 250 μL of alternatively blank (water), strawberry hydrophylic extract or (+)-Catechin standard solution was mixed to 1.25 mL of MilliQ water in a test tube, following by addition of 75 μL of a 5% sodium nitrate (NaNO2) solution. After 6 min, 150 μL of a 10% aluminium chloride hexahydrate (AlCl3*6H2O) solution was added to the mixture, and allowed to stand for 5 min. Then, 500 μL 1M sodium hydroxide (NaOH) were added, the mixture was brought to 2.5 mL with MilliQ water and mixed well, and the absorbance was immediately read at 510 nm against blank. For quantitative results, from a methanol:water (80:20, v/v) stock solution of (+)-Catechin (1 mg/mL), serial standard dilutions were prepared (0.0125-0.1 mg/mL), and their known concentrations versus the corresponding absorbance were plotted. Results are expressed as mg of catechin equivalents per gram of fresh weight of strawberry [mg CEq/g FW] (mean value of eight technical replicates)±SEM.
Determination of Vitamin C
Vitamin C was measured as described by Helsper and co-workers [41]. Strawberry extracts were subjected to HPLC analysis immediately after the extraction procedure. The HPLC system comprised a Waters 600 controller, a Waters 996 Photodiode array (PDA) detector set at absorbances of 262 and 244 nm, and a column incubator at 30°C. The HPLC column used was a YMC Pack Pro 150×4.6 mm. The elution was isocratic with 50 mM potassium phosphate (KH2PO4) in MQ water, leading to pH 3.2 (below the pKa of the ascorbic acid) by adding orthophosphoric acid, and analysis consisted in a 10 minute run, after which the column was cleaned with 50% acetonitrile. Vitamin C eluted at RT ≈5.3 min. Quantification of the vitamin C content was carried out through a calibration curve prepared by running standard concentrations of vitamin C similarly prepared to the extracts, and measured in duplicate at the beginning and end of the analysis. Results are expressed as mg vitamin C per gram of fresh weight of strawberry [mg vit C/g FW] (mean value of three technical replicates±SEM).
HPLC-ESI-MS characterization of strawberry extract
HPLC-DAD/ESI-MS analysis was performed using a Hewlett-Packard 1100 series liquid chromatograph (Agilent Technologies, Waldbronn, Germany) coupled to an HP ChemStation data-processing station [38]. The stationary phase used was a 5 μm AQUA® C 18 150 mm×4.6 mm column (Phenomenex, Torrance, CA) thermostatted at 35°C and the mobile phase was: (A) 0.1% trifluoroacetic acid in water, and (B) HPLC-grade acetonitrile, using the following gradient: isocratic 10% B for 5 min, 10–15% B over 15 min, isocratic 15% B for 5 min, 15–18% B over 5 min, and 18–35% B over 20 min, with a flow rate of 0.5 mL min-1. Double on-line detection was performed using a diode array spectrophotometer (DAD) at 520 nm as the selected wavelength, and a mass spectrometer (MS) connected to the HPLC system via the DAD cell outlet.
The mass spectrometer (Finnigan LCQ, San Jose, CA) was equipped with an ESI source and an ion trap mass analyzer, controlled by LCQ Xcalibur software. Nitrogen was used as both auxiliary and sheath gas at flow rates of 6 and 1.2 L min-1, respectively. The capillary voltage was 4 V and the capillary temperature 195°C. Spectra were recorded in positive ion mode between m/z 150 and 1500. The MS detector was programmed to perform a series of three consecutive scans: a full scan, a zoom scan of the most abundant ion in the first scan and an MS–MS scan of the most abundant ion, using normalized collision energy of 45%. Anthocyanins were identified and quantified from the areas of chromatographic peaks by comparison with calibration curves obtained with external standards of Cyanidin-3-glucoside (Cy-3-gluc) and of Pelargonidin 3-glucoside (Pg-3-gluc).
Total antioxidant capacity
The Total Antioxidant Capacity (TAC) of the strawberry extract was determined by the Trolox Equivalent Antioxidant Capacity (TEAC), the Ferric Reducing Antioxidant Power (FRAP) and the 2,2-diphenyl-1-picryl hidrazilo (DPPH) assays.
The TEAC assay was carried out according to the modified method of Re and co-workers [42] and combined to a flow injection analysis (FIA) system [43]. The strawberry extract (10 μL) was injected into a serpentine-knotted reaction coil and allowed to react with the ABTS+ solution pumped at a flow of 1.2 mL/min into the coil. The extent of decolorization, expressed as percentage of inhibition of absorbance, is then plotted as a function of concentrations of the antioxidant capacity in the sample. TEAC results are expressed as micromoles of Trolox equivalents per gram of FW of strawberry (μmol TEq/g FW). Data are reported as a mean value±SEM for four measurements.
The FRAP assay was carried out according to the protocol proposed by Deighton and co-workers [44]. The FRAP reagent solution was prepared daily immediately prior to procedure, by combining ten volumes of sodium acetate (300 mM, pH 3.6) with one volume of TPTZ (10 mM in HCl 40 mM) and one volume of ferric chloride (20 mM) aqueous solutions. Briefly, 100 μL of alternatively blank, Trolox standard or 10-fold milliQ water diluted strawberry extract were added to 900 μL FRAP reagent. The mixture was then quickly vortexed for 15 seconds (starting the timer immediately) and allowed to stand for 4 min. After exactly 4 min, the absorbance of the solution was read at 593 nm (Beckman spectrophotometer, DU644 model) against blank. Trolox aqueous dilutions were used for calibration. Each sample was analyzed in eight replicates and FRAP results were expressed as micromoles of Trolox equivalents per gram of FW of strawberry (μmol TEq/g FW). Data are reported as a mean value±SD for four measurements.
The DPPH method is based on the ability of DPPH to react with the phenolic compounds present in strawberry extracts [45]. The DPPH radical is a persistent molecule, characterized by a violet color, which presents an absorption peak at 515 nm. As in the case of ABTS, when the radical species are added to the sample, a reaction of reduction is carried out proportionally to the antioxidant species present; for this reason, also in this assay, a decoloration proportional to the antioxidant activity of the sample will be detected and the percentage of absorbance decrease at 515 nm of DPPH, is calculated by the equation:
% inhibition515nm = [(control Abs515nm –sample Abs515nm)/control Abs515nm]×100
The preparation of the solution of DPPH is required fresh made. To prepare 5 mL of 3 mM DPPH solution in methanol, it is necessary to weight 5,91 mg of DPPH. The obtained solution is stirred with a vortex and is kept in the dark until the moment of its use. To perform the assay it is necessary to dilute the concentrated solution of DPPH with methanol, in a way that gives an absorbance from 0.6 to 0.7. The working solution was prepared in a test tube, putting 1.450 mL of DPPH diluted solution and 50 μl of sample, that could be water (for the control), strawberry extract, or Trolox (for the standards). Blank to set the spectrophotometer consisted in milliQ water. All the prepared solutions are stirred by vortexing and left in the dark for 1 hour; after that the samples absorbance is read at 515 nm. The evaluation of the antioxidant activity is always made through the construction of a calibration curve with Trolox: comparing the samples results (expressed as % inhibition) with the calibration line, it is possible to go back to their unknown antioxidant ability and quantify the strawberry antioxidant capacity. Each samples were analyzed in eight replicates and the results were finally expressed as micromoles of Trolox equivalents per gram of fresh weight of strawberry (μmol TEq/g FW). Data were generally reported as a mean value±SD.
Cell lines culture
Primary Human Dermal Fibroblasts (HDF) isolated from adult skin were purchased from provided GIBCO® Invitrogen cell culture-Life Technologies Corporation, while RAW 264.7 murine macrophage cell line was purchased from American Type Culture Collection (ATCC) and was derived from a murine tumor induced by Abelson leukemia virus. Hepatocellular carcinoma cells (HepG2), a perpetual cell line with epithelial morphology derived from human liver tissue, were kindly provided by the Biological Research Laboratory of the Sevilla University (Spain).
All the three cell lines were plated into a T-75 flasks and cultured in Dulbecco’s Modified Eagle Medium (DMEM) with high glucose, stable glutamine and sodium pyruvate, supplemented with 10% fetal bovine serum (FBS) heat-inactivated (65°C for 20 min) and 1% penicillin-streptomycin antibiotics (100 IU/mL penicillin and 100 μg/mL streptomycin). Cells were manteined in HeraCell CO2 incubator at 37°C with 5% CO2 and the medium was changed every 2–3 days. All the test and the different pellet preparations were conducted on cells between the 4th and the 6th passage.
Cell lines treatment
HDF, RAW macrophages and HepG2 cells were seeded into 96-well plates at a density of 5×10³ cells/well and treated with different concentrations of Alba. Strawberry extract was concentrated under vacuum to eliminate total methanol, dissolved in DMEM and applied at different concentrations to the cells (25, 50, 100, 250, 500, 1000, 2500, 5000, 7500 and 10000 μg/mL of medium), for 24, 48 and 72 h.
Cell viability assay
Cell viability was determined using the MTT assay [46], based on the reduction of the tetrazolium salt, 3-(4,5-dimethylthiazol-2-yl)-2,5-diphenytetrazolium bromide, by intracellular dehydrogenases of viable living cells, leading to the formation of purple formazan crystals. After strawberry incubation, 30 μL of RPMI medium containing 2 mg/mL of MTT were added in each well. In control group, cells were treated only with DMEM. After incubation for 2 h at 37°C in a 5% CO2 incubator, MTT solution was discarded and 100 μL of DMSO were added into each well to dissolve the formazan crystal. The level of colored formazan derivative was analyzed on a microplate reader (ThermoScientific Multiskan EX) at a wavelength of 590 nm. The percentage of cell viability was calculated according to the following equation:
% cell viability = (Abstreated cells / Abscontrol cells)×100
where Abs is absorbance.
Data were reported as a mean value of three independent analyses±SD.
Statistical analysis
Statistical analyses were performed using STATISTICA software (Statsoft Inc., Tulsa, OK, USA). Data were subjected to one-way analysis of variance for mean comparison, and significant differences among different treatments were calculated according to HSD Tukey’s multiple range test. Data are reported as mean±SD.
Results
Strawberry nutritional and phytochemical composition
As shown in Table 1, Alba cultivar is a notable source of phenols (2.52 mg GAEq/g FW) and flavonoids (0.66 mg CEq/g FW); five anthocyanin pigments were detected through HPLC-DAD/ESI-MS analysis, with Pg- and Cy-glycosides being the most representative anthocyanin strawberry components. Pg-3-glucoside is the most quantitative, with 39.74 mg/100 g FW, followed by Pg 3-malonylglucoside, with a concentration of about 6.69 mg/100 g FW.
An important antioxidant compound present in the strawberry is vitamin C. As previously reported, this vitamin is a versatile antioxidant, preventing both singlet oxygen and free radical mediated damage [47]. Based on these findings, we analysed the vitamin C content of the extract by HPLC-DAD (Table 1) and found a good content of this compound (about 58.02 mg/100 g FW), that could contribute to the high antioxidant capacity and free radical scavenging capacity of this cultivar.
The TAC of fruit extract was quantified by TEAC, FRAP and DPPH assays (Table 1). Alba extract showed a high TAC value, according to these methods, being 22.64, 22.85 and 7.71 μmol TE/g of FW for TEAC, FRAP and DPPH, respectively. We found that TAC values of the Alba cultivar were similar to those previously reported in other strawberry varieties, confirming that this cultivar possesses a high TAC [13, 20–22].
Cytotoxic effects of strawberry extracts
Cells were incubated for 24, 48 and 72 h with 200 μL of different concentrations of dried strawberry extract, in order to evaluate its possible cytotoxic effect. For HDF cells, an increase in cell viability was observed at 24 h in a dose-dependent manner, up to 157% compared to control when applied at 10000 μg/mL (Fig. 1). On the contrary, at 48 and 72 h, the strawberry extract exerted cytotoxic effects at 5000 μg/mL and 2500 μg/mL respectively, since the viability started to decrease at these concentrations (Fig. 1). However, the IC50, the dose of strawberry extract required to “kill” half of the cells, was never reached.
Regarding RAW macrophages, at 24 h an increase in cell viability was observed up to 1000 μg/mL of Alba (+24% respect to control group); after this concentration value, the viability starts to decrease in a dose-dependent manner (–25% with Alba at 10000 μg/mL). A similar trend was observed at 48 and 72 h, but in these cases the cell viability started to decrease from lower values of concentration, exerting a cytotoxic effect at 7500 and 2500 μg/mL, respectively (Fig. 2). The IC50 was reached already at 10000 μg/mL of strawberry extract after 48 h of treatment.
Regarding HepG2 after 24 h of treatment cell viability was not significantly affected (p < 0.05) by the dried methanolic extract up to 7500 μg/mL, while for longer treatment times cytotoxic effects were observed at lower concentrations, 1000 and 250 μg/mL for 48 and 72 h of treatment, respectively (Fig. 3).
MTT assay for the determination of cell viability in HDF cells treated with
different time-concentrations of strawberry extracts. Data are expressed as mean
values±SD. Values belonging to the same set of data with different superscript
letters are significantly different (p < 0.05).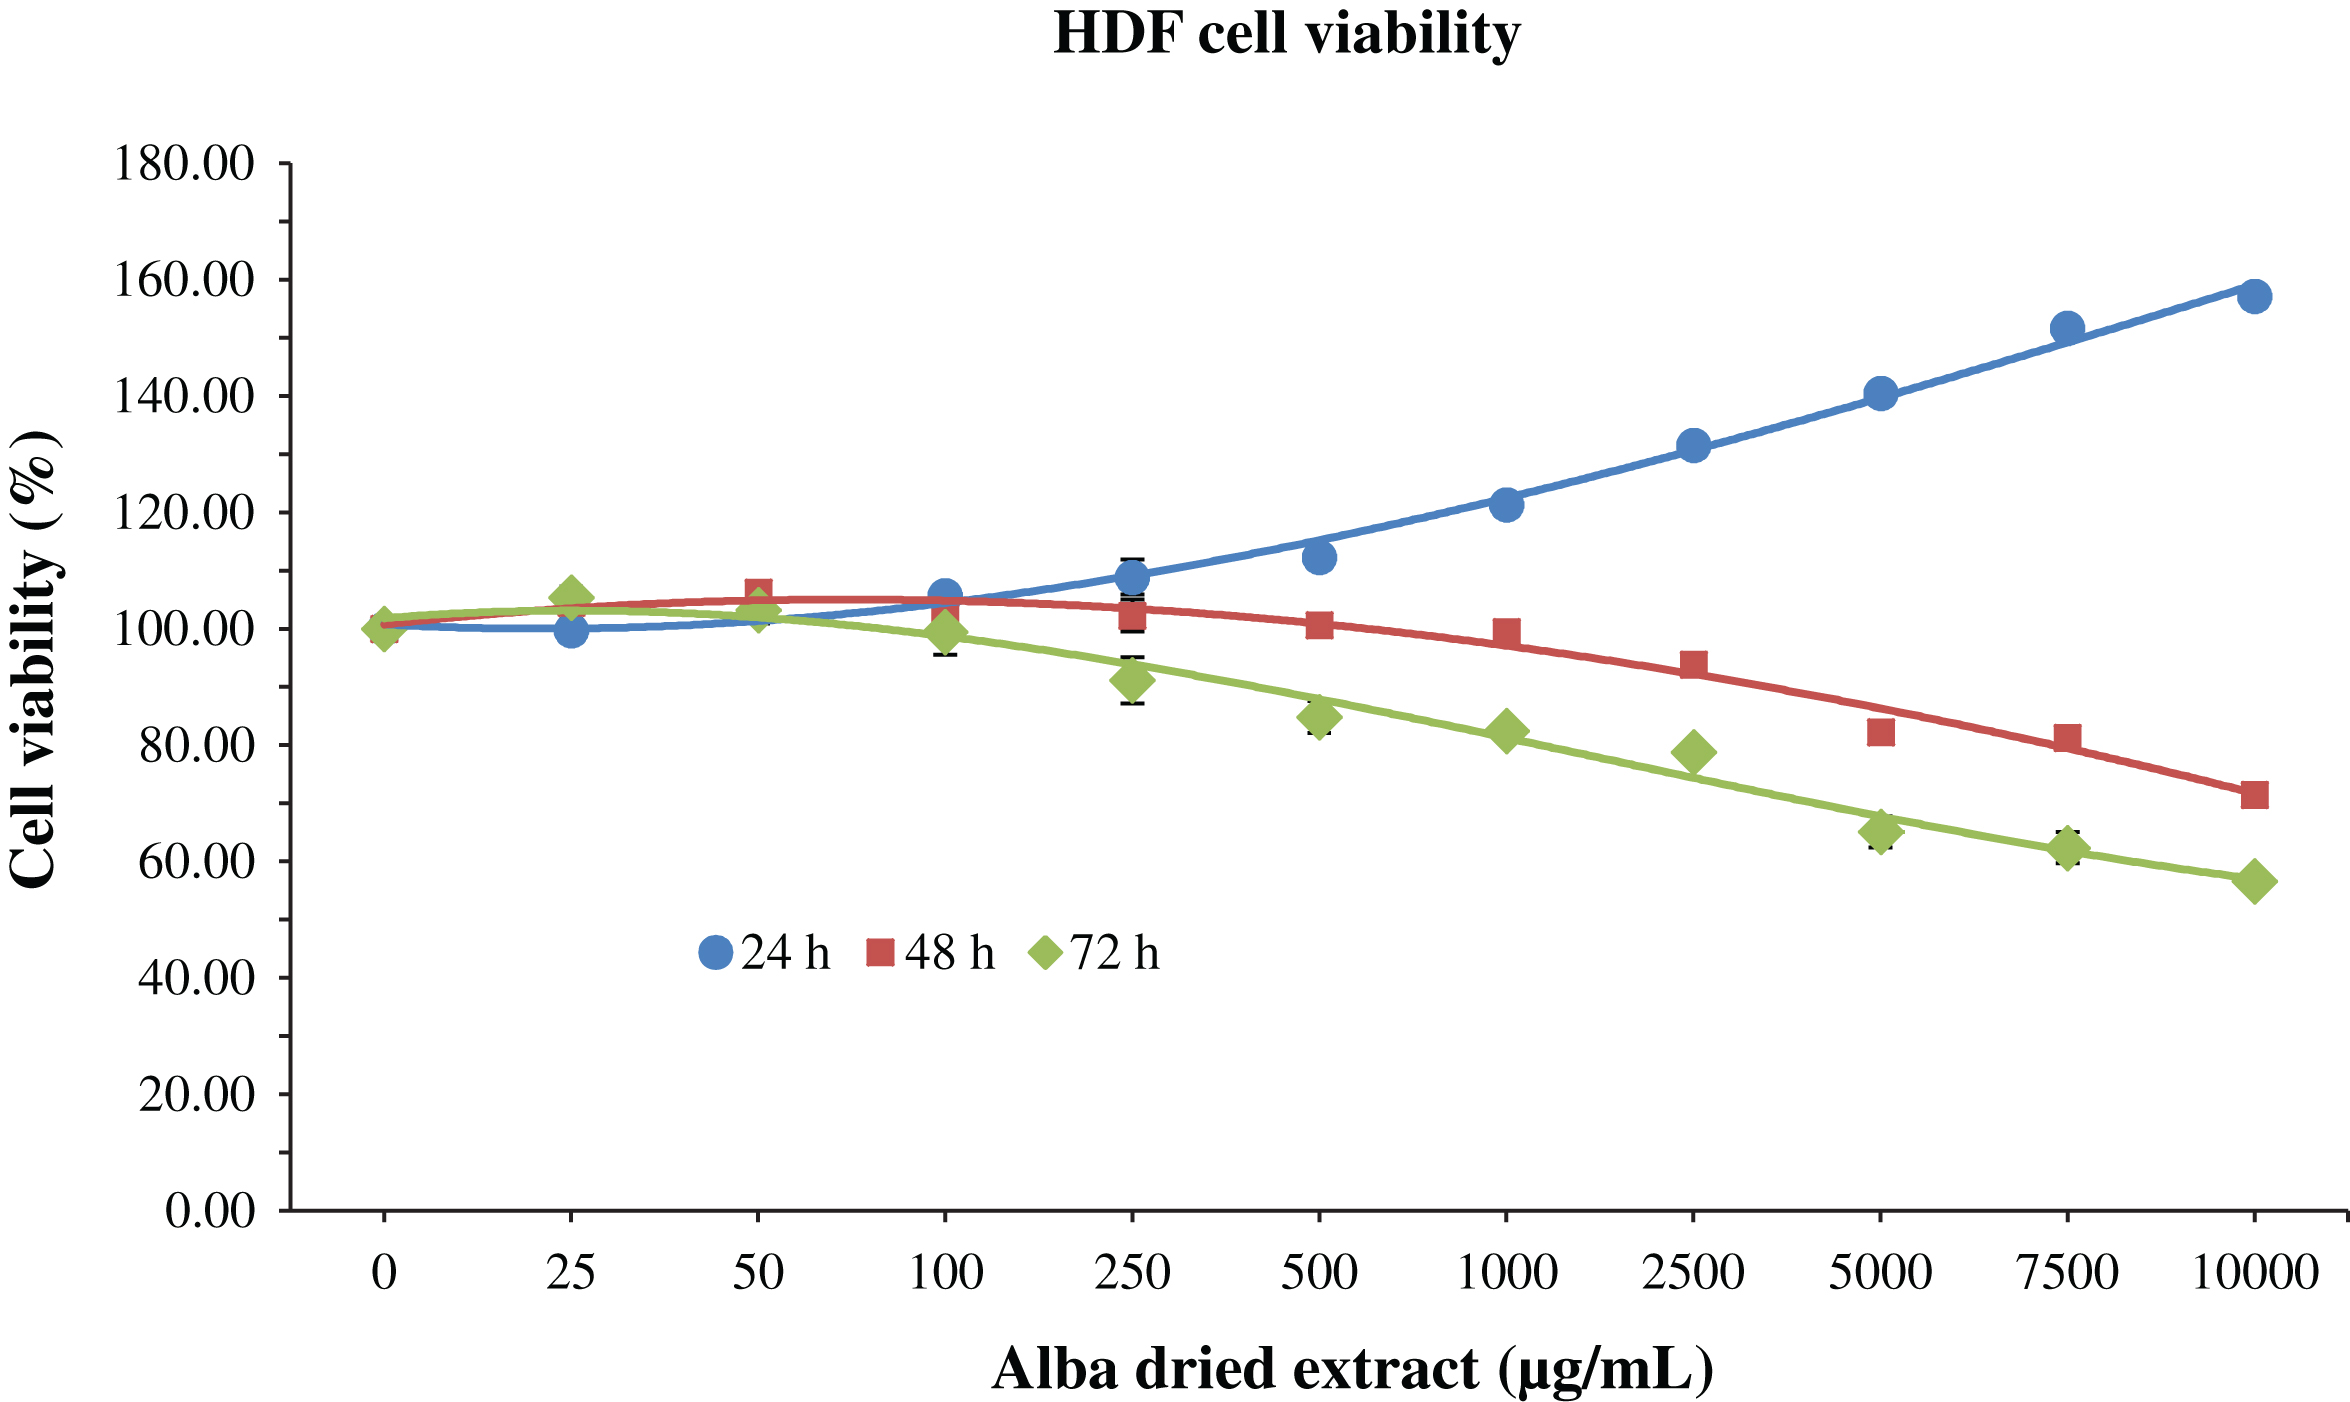
The aim of the present work was to evaluate the possible cytotoxic effects of Alba extracts on three different cell lines, HDF, RAW 264.7 macrophages and HepG2 cells. Strawberries (Fragaria x ananassa) were chosen as the fruit model for this study due to their high content of antioxidants and bioactive compounds [6, 29]. Many published studies have indeed showed that strawberries possess high antioxidant capacity and contain a significant amount of ascorbic acid, anthocyanins, phenolic compounds and folates [10, 48].
For the present study, the attention was selectively focused to Alba cultivar, a very interesting variety from the nutritional point of view, with a well-balanced micronutrient and phytochemical composition. In addition, in our previous study this cultivar showed a considerable health effect thanks to its phenolic contents and its ability to maintain the cell membrane integrity, to reduce the free radical-dependent lipid peroxidation and to preserve and/or activate endogenous antioxidant enzymes [23].
Regarding phytochemical and nutritional composition, the total polyphenol content (2.52±0.01 mg GAeq/g FW) was similar to the values reported by Tulipani et al. [13, 30] and Capocasa et al. [14] for other commercial varieties like Sveva (2.7 mg GAeq/g FW) and Camarosa (2.6 mg GAeq/g FW) and higher than the values reported for Adria (1.8 mg GAeq/g FW). Also the total flavonoids content (0.66±0.02 mg CATeq/g FW) was higher than the values reported for Adria (0.4 mg CATeq /g FW) and Sveva (0.60 mg CATeq /g FW) [30], while the vitamin C content (0.58±0.02 mg /g FW) was higher than the values reported by Tulipani et al. [13] who indicated that the average vitamin C content in five selected cultivars (Alba, Irma, Patty, Adria, and Sveva) and three advanced selections (AN94.414.52, AN03.338.51, AN00.239.55) of strawberries range from 0.23 to 0.47 mg/g FW. Anthocyanins derivatives were identified through their spectral and chromatographic characteristics. The individual quantified value of Pelargonidin-3-glucoside, the most representative compound of this group, was significantly higher (0.39±0.01 mg/g FW) (Table 1) than the values reported for Sveva (0.13–0.26 mg Pg-3-glu/g FW), and Adria (0.16–0.48 mg Pg-3-glu/g FW) [13, 30]. To the anthocyanin content is attributed the majority of the beneficial effects of strawberries on human health, since it is considered one of the biggest responsible for the antioxidant capacity of the fruit together with vitamin C and ellagic acid.
The antioxidant capacity per se is not correlated in all cases to the observed beneficial healthy effects of fruits and vegetables, but many of the biological actions of phytochemicals have been attributed to this property. Therefore, the antioxidant capacity of fruits or individual components may represent an useful parameter as starting point that should be complemented with other measurements in the evaluation of their biological activity.
MTT assay for the determination of cell viability in RAW macrophages treated with
different time-concentrations of strawberry extracts. Data are expressed as mean
values±SD. Values belonging to the same set of data with different superscript letters
are significantly different (p < 0.05).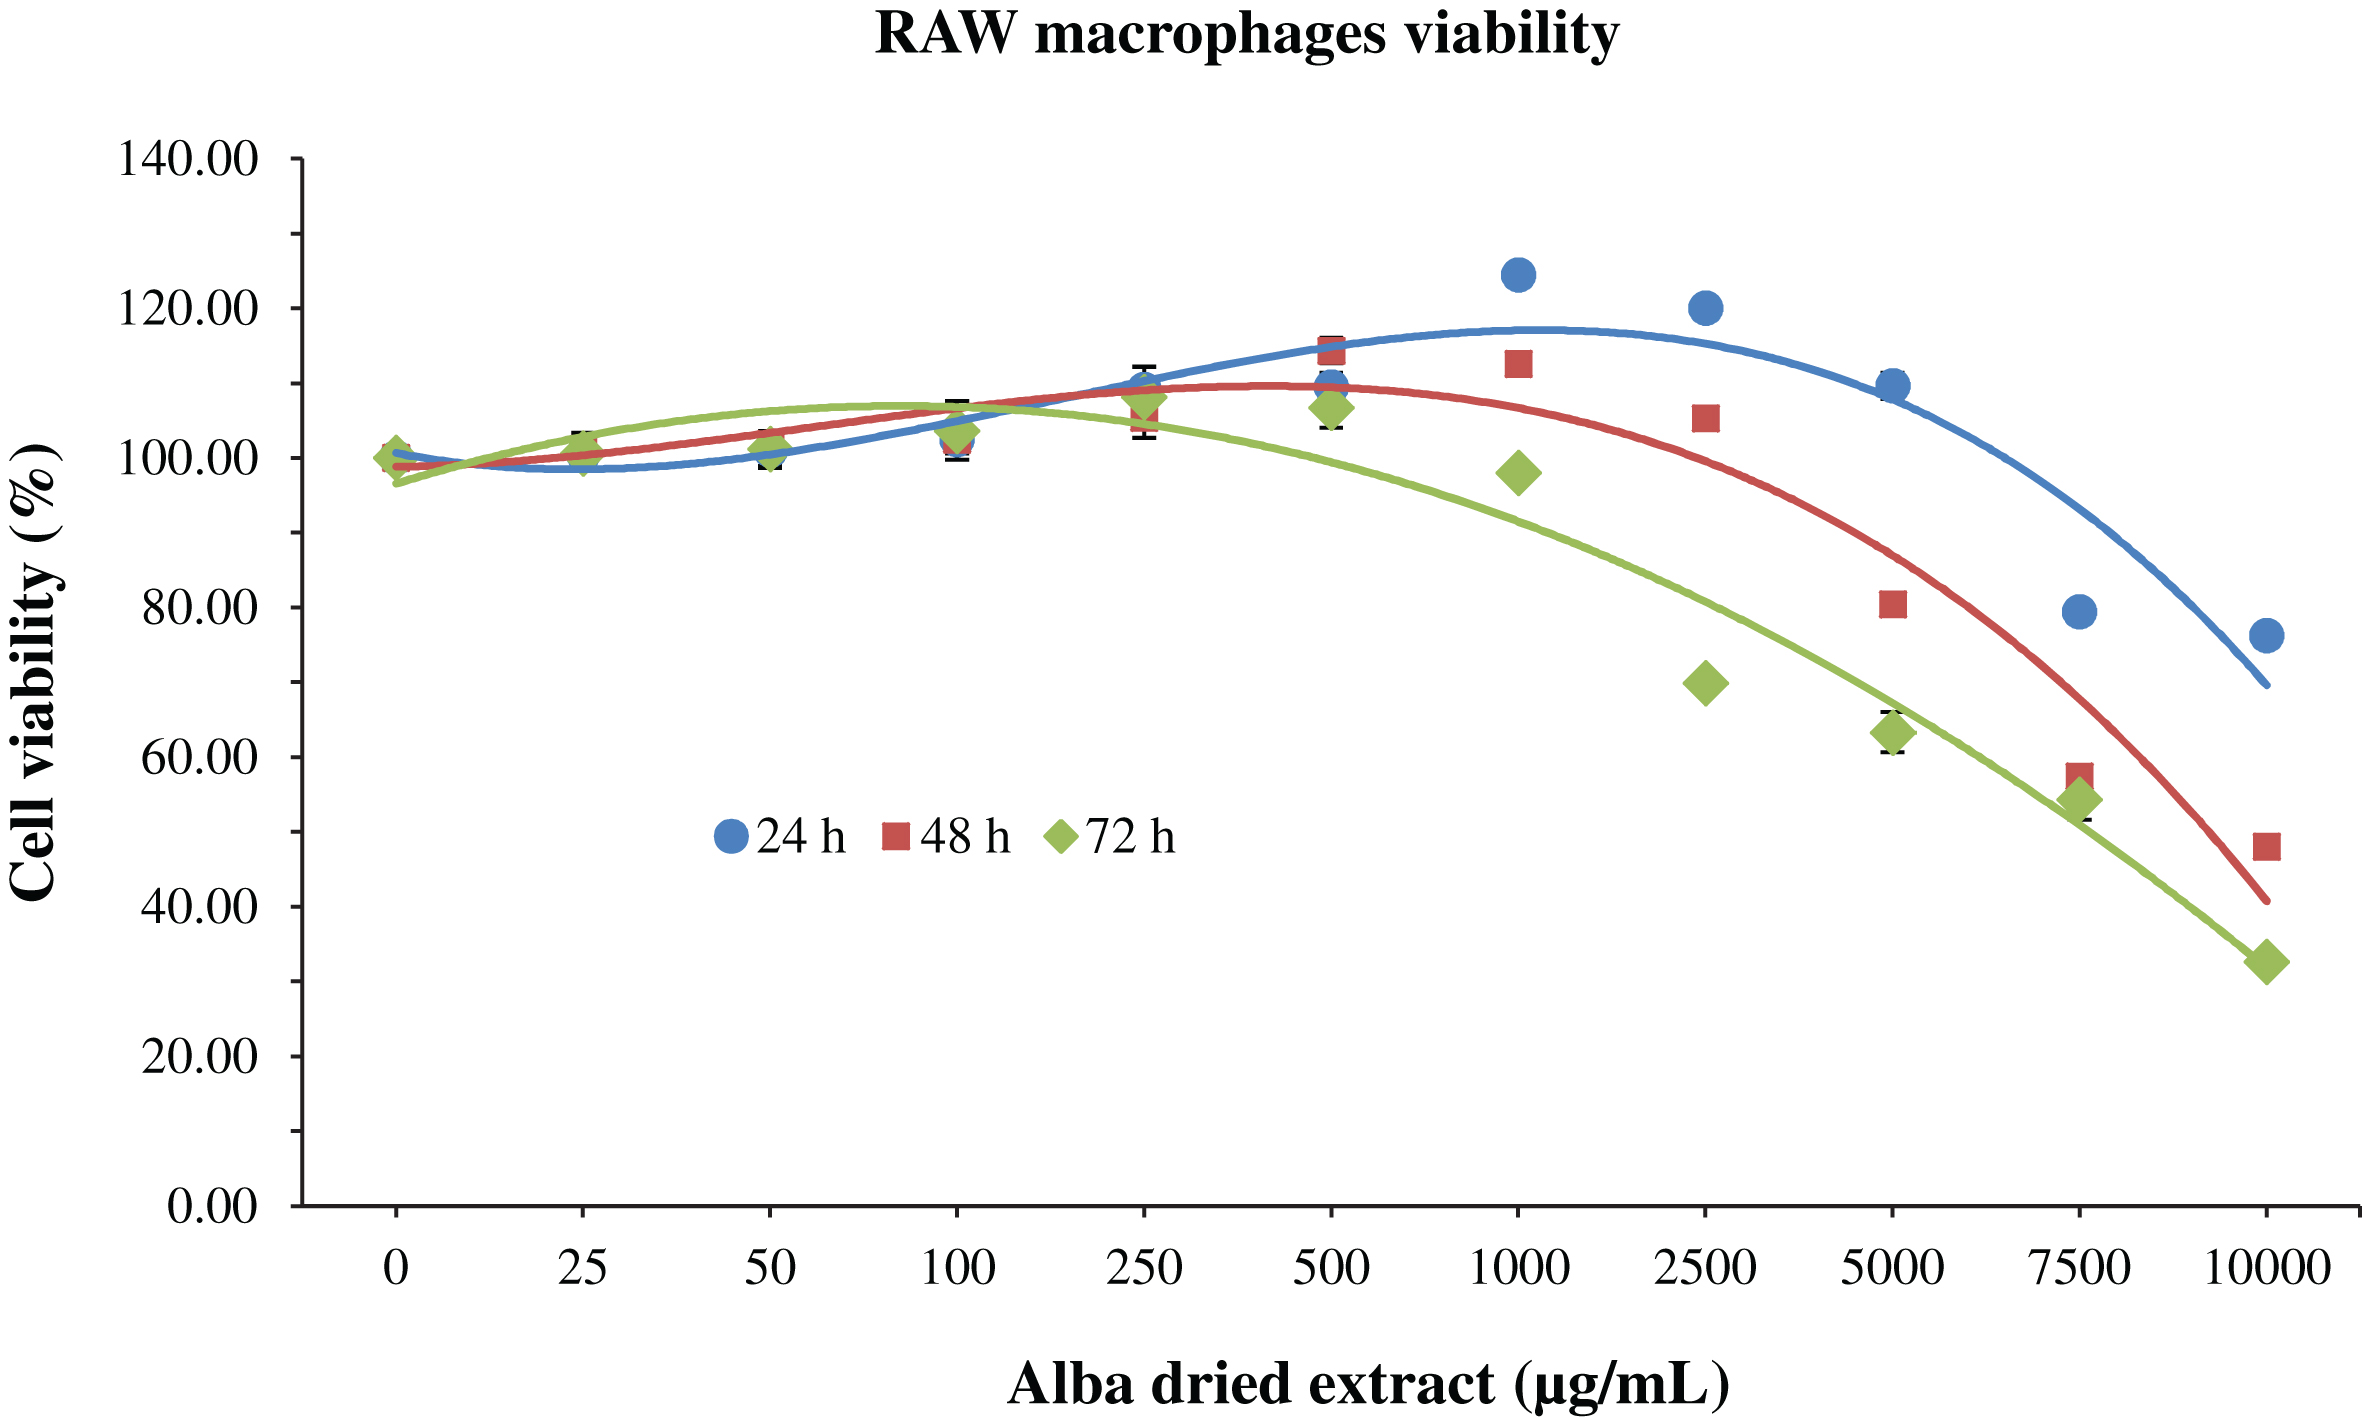
MTT assay for the determination of cell viability in HepG2 cells treated with
different time-concentrations of strawberry extracts. Data are expressed as mean
values±SD. Values belonging to the same set of data with different superscript letters
are significantly different (p < 0.05).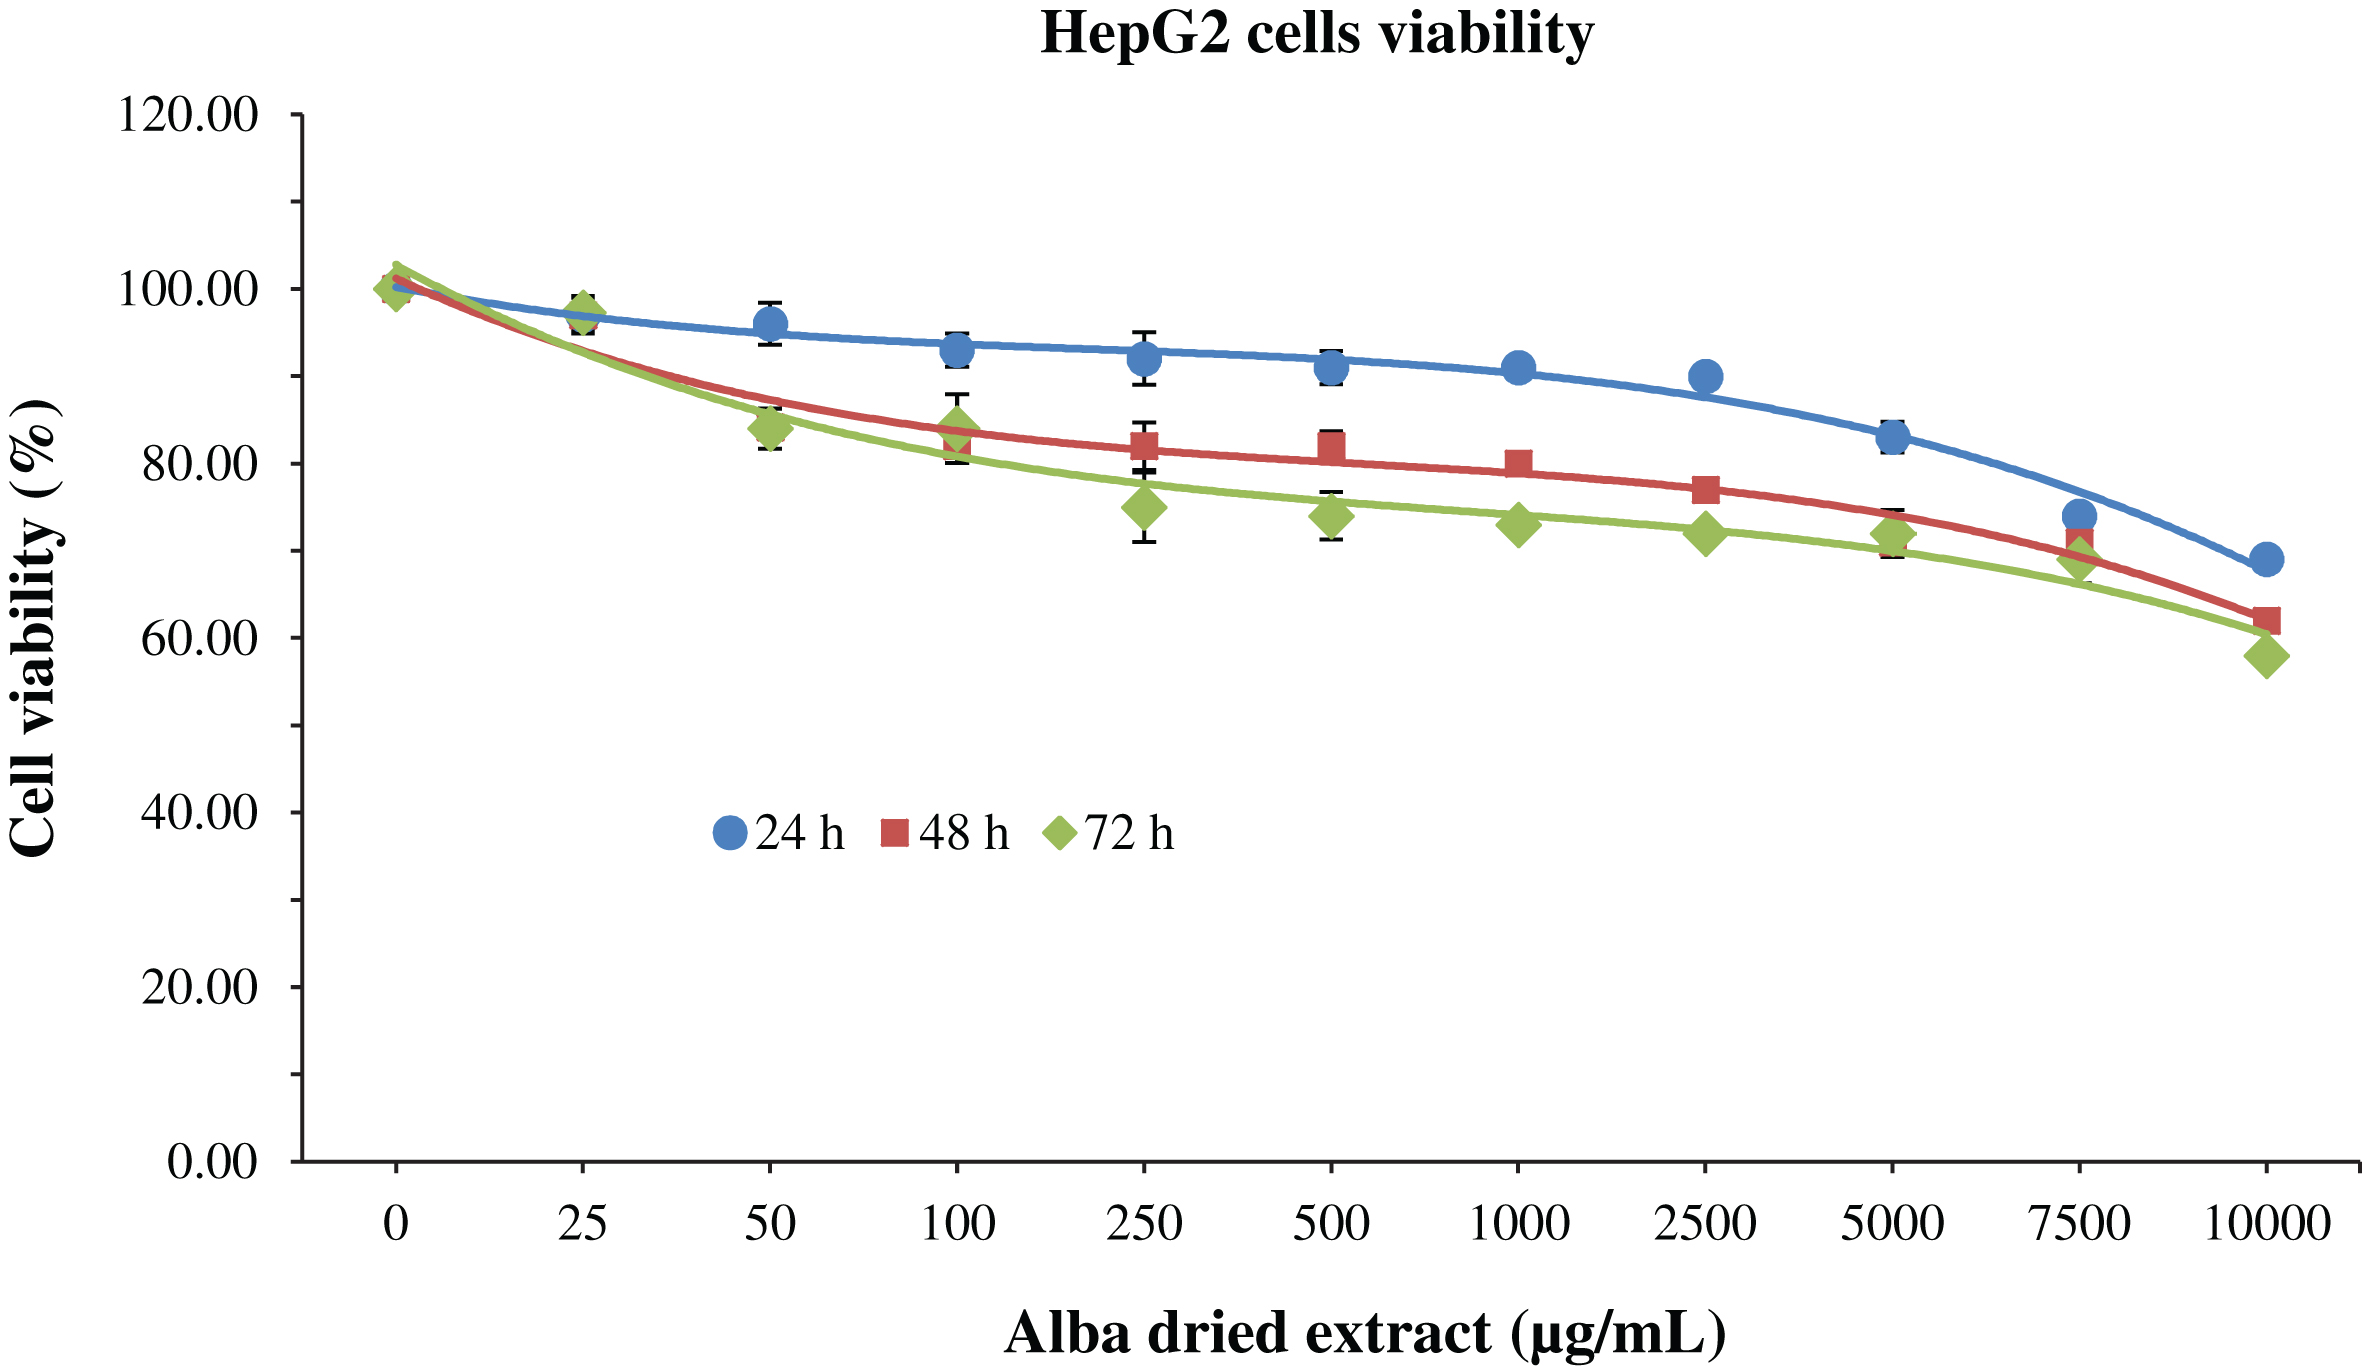
The most used assays to evaluate TAC are FRAP, based on ferric reducing ability, TEAC and DPPH, which are based on free radical scavenging. The obtained values for the fresh fruit through FRAP method are higher than the values reported for Romina, Sveva, Adria and Camarosa, confirming that the variety of strawberry Alba not only has a good nutritional quality but also a high antioxidant capacity [13, 30]. Similar trend was obtained with the TEAC assay, while the results obtained with the DPPH method were slightly lower.
To date, reports that investigated the cytotoxicity effects of Alba extracts are still scarce. Our results show that Alba dried extracts positively affected both HDF cells and RAW macrophages viability after 24 h of treatment, at all the different concentrations applied in case of HDF, and up to 5000 μg/mL in case of macrophages, confirming the stimulatory effect of strawberry treatment on cell viability for low concentrations as previously demonstrated with other varieties [20–22]. After 48 h of treatment strawberry significantly reduced cell viability at 5000 μg/mL for HDF and 7500 μg/mL for RAW macrophages, while at 72 h the cytotoxicity was detected at 2500 μg/mL for both cell lines.
In the case of HepG2, a decrease of cell viability was detected for all concentration applied and for all the different time of incubation. Cytotoxic effects were obtained for 7500, 1000 and 250 μg/mL at 24, 48 and 72 h, respectively. Nevertheless, the dose of strawberry extract required to kill half of the cells was never reached at the concentration tested.
Our results are in accordance with previous studies, where at the selected concentrations any cytotoxic effect has been reported for strawberry extracts in different cell lines, such as HDF, for which vitality values remained unaffected until 500 μg/mL of strawberry extracts [21, 22] or PC12 cells [49]. However, strawberry extracts decreased the proliferation of colon cancer cells HT29 and breast cancer cells MCF-7 at higher (>500 μg/mL) concentrations [50]. Therefore it is important to select carefully the concentrations to be used depending on cells’ type and the objectives pursued in the experimental design.
In conclusion, this preliminary study shows that strawberry may exert cytotoxic effects on different cell lines depending on incubation time and concentrations applied. In addition, this research may be the basis for deeper study with the aim of defining the cellular uptake, enzymatic biotransformation and localization of strawberry compounds in different subcellular districts, to confirm the potential use of strawberry as a natural source of antioxidants and bioactive compounds.
Footnotes
Acknowledgments
The authors wish to thank Prof. Celestino Santos-Buelga and Dr. Ana Gonzales-Paramas for HPLC-ESI-MS characterization of strawberry extract. Dr. F. Giampieri was supported by a Fondazione Umberto Veronesi Fellowship.