
Abstract
The dynamic response and operational reliability of high-speed solenoid valve (HSV) for diesel engine injector are the main indicators to measure their performance. At high-frequency, the eddy current energy and Joule energy generated by the HSV will be converted into heat, which has a significant impact on the service life of HSV. The optimization of HSV involves the interaction between energy loss and the dynamic response of HSV. To optimize the HSV dynamic response time considering energy loss, the HSV work process simulation model was established in this paper, and the model was verified based on armature lift experimental data. Without changing the structural parameters of the HSV, the four parameters of electroconductibility, spring stiffness, damping coefficient, and coil resistance were selected as the key parameters affecting the dynamic response and energy loss. The response surface models (RSMs) of opening response time, closing response time, eddy current energy and Joule energy of the HSV were constructed by using the smoothing spline-analysis of variance method. The multi-objective cooperation optimization of HSV under the interaction of dynamic response characteristics and energy loss was completed by using non-dominated sorting genetic algorithms. After optimization, the opening and closing response times of HSV were reduced by 15.1% and 16.6% respectively, while the eddy current energy and Joule energy were reduced by 5.2% and 48.4% respectively. In this paper, the dynamic response and energy loss were jointly optimized. The presented results provide theory instruction for multi-objective cooperative optimization of HSV.
Keywords
Introduction
With the increasing requirements for diesel engine economy and power, multiple injection technology, Miller cycle technology, and aftertreatment technology are applied to diesel engines to achieve higher thermal efficiency and lower emissions. The application of these new technologies all require high-pressure common rail fuel injection system for precise control of injection times and injection quantities [1–3]. Precise control of the control system to the injector is achieved by high-speed solenoid valve (HSV), so it is the core component of high-pressure common rail injector, and its dynamic response characteristics directly affect the control accuracy of injection [4,5].
HSV has been studied theoretically and experimentally by many scholars, and valuable conclusions have been obtained. Ertl et al. [6] conducted a simulation study of HSV and they concluded that the closing response time of HSV can be shortened by increasing the spring preload, but the spring preload should not be increased too much to prevent a significant effect on the HSV opening process. Sun et al. [7] carried out a simulation study on the static electromagnetic force of HSV on an electronically controlled unit pump. The results showed that coil turns, working air gap and magnetic pole area all influenced static electromagnetic force of HSV. To achieve greater electromagnetic force, the main structural parameters need to be globally optimized. Zhao et al. [8,9] analyzed the influence of driving circuit parameters on the dynamic respond characteristics of HSV. It was found that increasing the boost voltage can be reduced the HSV opening response time, but an excessive boost voltage had little effect on improving the opening response time, and there was a reasonable range of boost voltages. Farid et al. [10] and Bianchi et al. [11] studied the influence of peak-hold driving circuit parameters on the opening and closing process of HSV by combining simulation with experiment. The influence of different driving parameters on the HSV dynamic response were analyzed, as well as the intrinsic reasons. The aforementioned studies are more focused on the effect of single parameter on HSV performance, which was not comprehensive. In recent years, deep learning such as genetic algorithms and neural networks have been widely applied in fields such as automatic optimization, signal processing [12–14], and nonlinear control [15,16]. To obtain greater electromagnetic force of HSV, scholars have carried out multi-objective optimization of the electromagnetic characteristics of HSV using various algorithms such as simulated annealing algorithm [17], neural network algorithm [18,19], and particle swarm algorithm [20]. Liu et al. [21] used genetic algorithm with electromagnetic force and armature mass as the optimization objective and accomplished the optimization of 25.8% increase in electromagnetic force without increase in armature mass. Li et al. [22] developed a response surface model (RSM) of the HSV response time by adopting a central composite design method and carried out a multi-objective optimization of the response time using genetic algorithm, which reduced the opening and closing response times of the optimized HSV by 17.7% and 37.4%, respectively.
For pursuing faster dynamic response of HSV, it needs to be driven by a peak-hold circuit. Under the high frequency operating conditions, different forms of energy are generated and transformed to form eddy current energy and Joule energy, which in turn generate heat loss and have a large impact on the reliability of the HSV operation. Zhao et al. [8,9] showed that increasing the drive current rise rate by increasing the boost voltage could improve the electromagnetic conversion degree of the HSV within a certain range, but the rapidly increasing eddy current energy loss was the main reason why the HSV closing response time could not be reduced by increasing the boost voltage. Xie et al. [23] found that the driving strategy was one of the important factors affecting the power loss and thermodynamic characteristics of the HSV, the power loss was the main heat source for the temperature increase of HSV coil, and the high temperature of the coil had a great impact on the dynamic response and lifetime of the HSV. Cheng et al. [24] explored the influence of temperature on the HSV electromagnetic characteristics of the injector. It was found that the elevated temperature within the HSV reduced the magnetic flux density, weakened the magnetic induction strength, and increased the total energy loss, which in turn significantly affected the HSV lifetime.
Based on the literature mentioned above, most of the research work focused on the influence of structural parameters and driving parameters on the dynamic response of HSV and carries out optimization. However, during high-frequency operations of HSV, eddy current energy losses and Joule energy losses result in heat generation, which significantly reduces the reliability of HSV operation and affects its service life. When optimizing the dynamic response of HSV, it is necessary to consider the energy losses. Therefore, this paper focuses on the HSV of a common rail injector as the research object. The RSMs of dynamic response and energy loss are constructed, respectively. A multi-objective genetic algorithm is used to conduct a collaborative optimization of the dynamic response and energy losses of HSV, to achieve high dynamic response and low energy losses for it.
The remainder of the paper is organized as follows. Section 2 expounds the construction process of HSV finite element model, and verifies it based on experimental data. In Section 3, an analysis of the internal energy distribution characteristics during the operation of HSV is conducted, explicitly identifying the types and sources of energy losses generated during the electrical-to-mechanical energy conversion process in HSV. Moving on to the Section 4, the RSMs for HSV response time and energy losses are trained. Additionally, a multi-objective cooperative optimization of response time and energy losses is performed using the genetic algorithm, leading to the achievement of optimization objectives. Finally, a summary of the work presented in this paper is provided in the Section 5.
Numerical simulation
Establishment of HSV dynamic response simulation model
Mathematical models
HSV mainly consists of coil, iron core, armature and reset spring. When the coil was energized, the iron core made of soft magnetic material was rapidly magnetized and generated upward electromagnetic force on the armature, and when the electromagnetic force was greater than the pre-tightening force of the reset spring on the armature, the armature began to lift. When the coil was cut off, the armature began to fall down when the upward electromagnetic force on the armature was less than the spring pre-tightening force. As seen from the above working process, the action process of HSV is a nonlinear coupling process of electric-magnetic-mechanical motion. The relationship between current, voltage, resistance and inductance in the coil during HSV operation can be described as:
When the coil is energized, the core generates an electromagnetic force. The magnitude of the electromagnetic force is related to the magnetic flux, attraction area and magnetic permeability, which are related as follows:
The motion of HSV is the result of the interaction of several forces, which contain the electromagnetic force generated within the iron core, spring pre-tightening force, resistance force, etc. According to Newton’s second law, the equation of motion of HSV can be summarized as:
When the driving current of HSV changes, it will cause the magnetic field of the iron core to change, which in turn generates induced eddy currents, forming eddy current energy E
1, as:
The armature overcomes the force of the reset spring under the action of electromagnetic force, and the elastic energy E
2 generated by the compression of the spring is defined as:
The armature is subject to a certain frictional force during its movement, and the resulting damping energy E
3 is defined as:
During normal operation of the HSV, the resistance present in the coil generates a certain heat, defining this part of energy as Joule energy E
4, as:
When HSV is operating, the armature has kinetic energy E
5 due to its motion, defined as:
Before establishing the HSV finite element simulation model, it was necessary to simplify its local structure and working conditions: (1) The non-magnetic components of HSV, such as valve stem, spring and seal rings, were ignored in modeling, and only the iron core, armature, and coil were modeled. (2) Since HSV had an axisymmetric structure, a symmetrical half model was established. (3) The elastic collision between armature and solenoid and between armature and valve seat were ignored. (4) The deformation caused by the armature hitting the solenoid or the valve seat were ignored. In this paper, the HSV electromagnetic field simulation model was established using Ansys Maxwell three-dimensional electromagnetic calculation software, as shown in Fig. 1. Table 1 shows the detailed parameter information of the HSV.
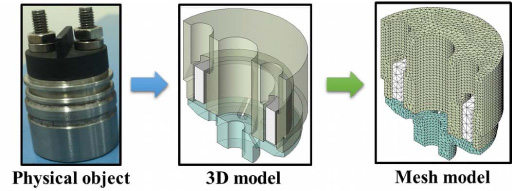
The simplified 3D simulation model of HSV.
In common rail injectors, to achieve a high dynamic response of the HSV, the peak-hold driving circuit mode was usually used, as shown in Fig. 2. The high voltage was loaded during the opening phase, and the current in the drive circuit was rapidly increased to the peak, which facilitated the rapid magnetization of the magnetic material, and the HSV opening response time was shortened. In the holding phase, a smaller persistent current was loaded to reduce the power consumption while maintaining a stable HSV state. During the closing phase, a larger negative voltage was supplied to accelerate the demagnetization process and the HSV closing response time was shortened. The Ansys Maxwell software was unable to implement the complex drive circuit described above, so the HSV drive control circuit model with high/low voltage drive current feedback was built based on the circuit-specific software Simplorer [25]. The coupling of the HSV drive control circuit model and the electromagnetic field model was realized by the Workbench platform of the Ansys software. The dynamic response simulation model of HSV with current feedback based on the Mawexll and the Simplorer software is shown in Fig. 3.
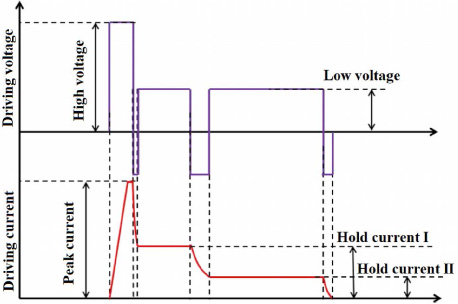
The schematic of driving current control for HSV.
Detailed information of the HSV
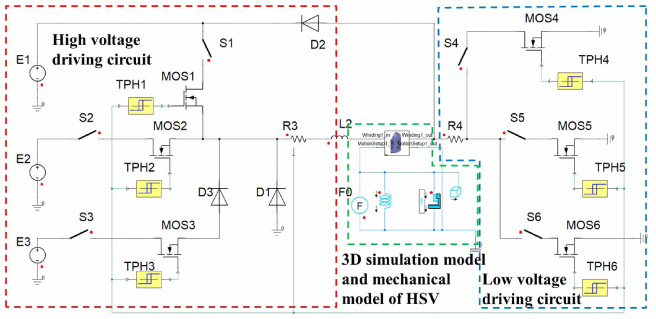
Dynamic response simulation model of HSV with current feedback.
After establishing the HSV finite element simulation model, the accuracy of the HSV needed to be verified using experimental data. Based on the HSV dynamic response testing bench, the armature displacement and the driving current loading process of the HSV were measured, and the testing bench layout diagram is shown in Fig. 4. The test bench consists mainly of displacement sensor, displacement signal processing units, drive control units and control computers. Main equipment of the dynamic response testing bench is shown in Table 2. The testing bench can achieve accurate measurements of armature lift in the range of 0–1 mm at a boost voltage of 42–80 V and a peak current of less than 25 A. In the test, the driving control unit was used to make the driving circuit work in peak-hold mode, the non-contact Hall sensor was used to measure the armature lift, the measured electrical signal was transmitted to the displacement signal processing unit, and the displacement result was displayed on the control computer in real time. To eliminate measurement errors during the experimental process, three identical experiments were conducted under the same conditions to ensure the accuracy of the data.
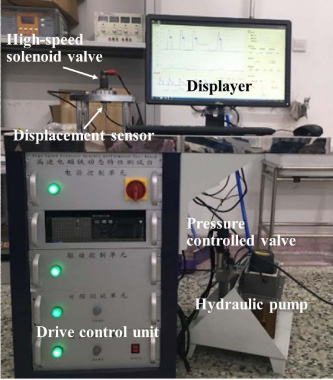
The dynamic response testing bench for HSV.
Main equipment of the dynamic response testing bench
A comparison of the experimental and simulated results of the HSV armature lift and driving current curve are shown in Fig. 5. It can be seen that for the experimental armature lift, there were certain fluctuations in the displacement of the armature during the holding phase due to the collision deformation between the armature and the core and the fluctuation of the drive current generated by pulse width modulation, but the difference with the maximum lift of the armature obtained from the simulation was not significant. By comparing the current curves, it can be observed that the HSV model coupling current feedback circuit model can effectively simulate the peak current, the hold current, and the current load time in the peak-hold driving strategy. The agreement between the simulation results and the experimental data was excellent during the armature rise and fall phases. The accuracy of the HSV dynamic response simulation model developed in this paper can be determined from the above analysis.
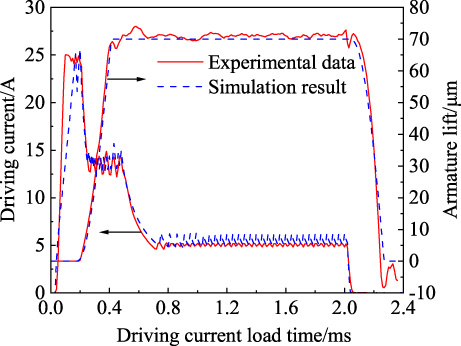
Comparisons between the FEM simulation result and the experimental data.
To optimize the dynamic response process of HSV, it was necessary to deeply investigate the electro-mechanical energy conversion rules during the operation and to clarify the internal energy distribution characteristics. Therefore, based on the verified finite element simulation model of HSV, the conversion process of internal energy of HSV and the energy loss in different stages were analyzed. Figure 6 shows the process of armature lift, driving current and different kinds of energy during the operation of HSV. During the stage of armature pull-in actuation, the drive current started to load rapidly and reached its peak within 0.2 ms. The electromagnetic force generated by the iron core was accompanied by great eddy current energy (E 1) and Joule energy (E 4). The maximum value of E 1 can reach 672 W and the maximum value of E 4 can reach 229 W. As the electromagnetic force gradually counteracted the reset spring pre-load, the armature started to absorb the motion and the peak current in the peak-to-hold mode was converted into a first-order holding current. In turn, E 1 and E 4 decrease significantly, and the elastic energy E 2, damping energy E 3, and kinetic energy E 5 started to increase, with E 5 peaking at 2.66 mJ. As the armature reached maximum lift, E 2, E 3, and E 5 gradually decreased to zero, and the drive current further decreased to about 5.5 A. E 1 and E 4 were also further reduced. When the drive current began to cut off, the HSV entered the stage of armature reset actuation and the armature initiated the reset motion when the electromagnetic force could not counteract the reset spring pre-load. Below this phase, E 5 increased again, while E 2 and E 3 became negative due to obstructing the armature movement.
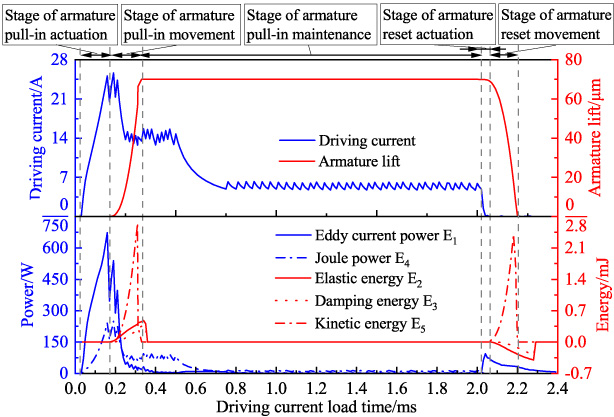
Different energy conversion in the working process of HSV.
After the above analysis, it was found that the process of electro-mechanical energy conversion generated many energy losses, which were mainly concentrated in the opening phase (including stage of armature pull-in actuation and stage of armature pull-in movement) and closing phase (including stage of armature reset actuation and stage of armature reset movement) of the HSV. Since E 1 and E 4 were process quantities in units of power, while E 2, E 3, and E 5 were instantaneously generated state quantities in units of energy. Thus, comparing the energy loss under different stages required the integration of different energies within each stage, as shown in Fig. 7. During the opening phase of the HSV, more eddy current energy and Joule energy were generated, due to the high transient change rate of the driving current, both of which account for more than 85% of the total energy and were the main source of heat generation in HSV. In the holding phase, the armature was in a relatively static state and did not generate the E 3 and E 5, but a large E 4 was generated because the holding current was always present in the coil. In contrast to the opening phase, the E 1 decreased from 61.7% to 17.3%, while the E 4 increased from 25.7% to 71.9% and the total energy decreased from 121.71 mJ to 42.22 mJ. In the closing phase, the driving current was reduced to zero and the E 4 disappeared, accordingly, the proportion of the E 1 increased and the total energy in this phase was further reduced to 24.40 mJ. The analysis showed that the E 1 and the E 4 were the most proportional energy losses during HSV operation, generating 90.91 mJ of the E 1 and 62.20 mJ of the E 4, both accounting for 81.29% of the total energy. Such a high E 1 and E 4 would generate a lot of heat in the HSV, which would have a large impact on the HSV lifetime. Therefore, the optimization of HSV required considering the interplay between the energy loss and the dynamic response, and how to reduce the energy loss while improving the dynamic response of HSV needed to be urgently explored.
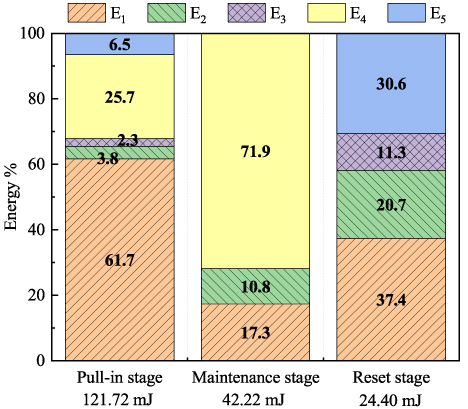
Comparison of energy proportion of HSV at different stages.
Development of RSMs for dynamic response characteristics and energy loss
To carry out the multi-objective optimization of HSV dynamic response and energy loss, it was necessary to develop RSMs for opening response time (T o ) and closing response time (T c ) describing the HSV dynamic response, and for eddy current energy (E 1) and Joule energy (E 4) describing the energy loss which decision of HSV heat generation. In conducting the RSM parameter selection, the electroconductibility, spring stiffness, damping coefficient and coil resistance, which affect the driving current, spring pre-tightening force and motion damping force, were selected as the input variables of the RSM in this paper without changing the HSV structural parameters. Table 3 shows the standard values and the variation ranges of each parameter during the numerical simulation. The standard values in the table represent the original structural parameters of the HSV samples. The selection range for each parameter is centered around the standard value, with the same numerical increment and decrement applied as the upper and lower limits for that parameter’s variation. When selecting the upper and lower limits of these parameters, it is essential to ensure that the HSV can operate correctly among all the combinations within the specified ranges for these four parameters. In developing the RSM, the simulation matrix needed to be formed using the design of experiments method. The regression equations established by the D-optimal experimental design method had the advantages of high fitting accuracy and low number of tests, and it was often used for the establishment of multidimensional experimental matrices with multiple constraints on multiple influencing factors [26]. In this paper, the simulation matrix of the RSM was constructed using the D-optimal experimental design method. The resulting 28 sets of numerical simulation sample points and the results of the calculations for T o , T c , E 1 and E 4 which obtained using the finite element simulation model are presented in Table 4.
Parameter standard values and variation ranges
Parameter standard values and variation ranges
Design and results of the simulation matrix
The RSMs in this paper were established by the smoothing spline-analysis of variance model (SS-ANOVA). SS-ANOVA is a statistical modeling algorithm based on a function decomposition similar to the classical ANOVA decomposition [27]. For multivariate regression problems, the accuracy of the nonparametric or semiparametric model developed by SS-ANOVA will better than the traditional second-order polynomial model [28]. Through training, the RSMs function of response time and energy loss were obtained. The polynomial form of the function and each coefficient are shown in Eq. (9) and Table 5.
Coefficients of the RSMs
Table 6 shows the evaluation of the four RSMs. The mean errors of all four RSMs were less than 0.09, and the R 2 of the models were greater than 0.90. Using the RSMs to predict and analyze the 28 sets of cases in Table 4, the numerical simulation results were compared with the prediction values of the functional model are shown in Fig. 8. Except for some cases, the residuals between the simulation results and the prediction values were kept within 3%. The overall evaluation and the residual analysis of the 28 sets indicating that the RSMs were more accurate and can be used for subsequent optimization.
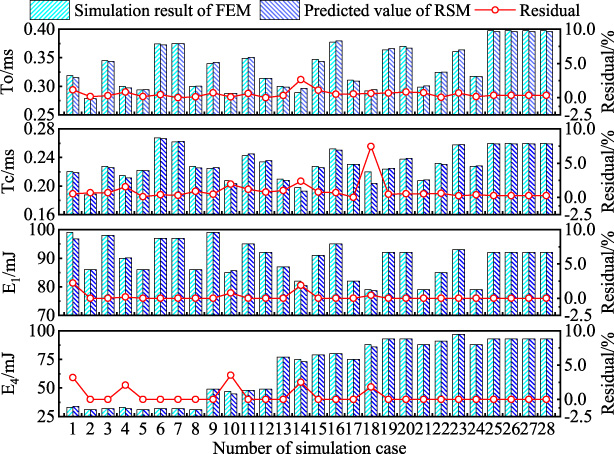
Comparisons and relative residuals between the simulated values and predicted values of T o , T c , E 1 and E 4.
Overall evaluation of the RSMs
Mathematical model of multi-objective optimization
Genetic algorithms are computer optimization algorithms that simulate natural selection and gene evolution processes for problem solving and outcome selection. Due to the promising potential of genetic algorithms for solving complex optimization problems, they have been developed over the years and various improvements have been made by scholars for different fields. For the multi-objective optimization problem, Srinivas et al. [29] proposed the non-dominated sorting genetic algorithms (NSGA) based on the principle of non-dominated sorting, which had strong advantages in multi-objective optimization, but the complexity of the computational process was high and the best individuals in the parent generation were easily eliminated. Deb et al. [30] proposed a non-dominated sorting genetic algorithm II (NSGA-II) by introducing an elite strategy as well as a crowding comparison method to address the shortcomings of NSGA. The algorithm had low computational complexity, and the individuals in the Pareto optimal solution frontier were uniformly extended throughout the Pareto domain, ensuring diversity in the population. In this paper, NSGA-II was used to carry out HSV optimization research on a multi-objective optimization mathematical model constructed based on the RSMs. The multi-objective optimization mathematical model contains optimization variables, optimization objectives, and constraints, which are defined and formulated for the four-objective optimization problem of this paper as follows:
(1) NSGA-II solution set.
During the calculation based on the NSGA-II, the number of termination iterations was set to 5000, the rate of crossover operator was set to 0.9, and the rate of mutation operator was set to 0.5. Figure 9 displays the variation of the best fitness value within the population with respect to the number of iterations. As the generations evolve, the objective function value decreased continuously, signifying the identification of parameter values that led to a short response time and minimal energy loss for the HSV. After 700 iterations, the best fitness value essentially remained around 3.1456, indicating that this value could be considered as the final objective function value.
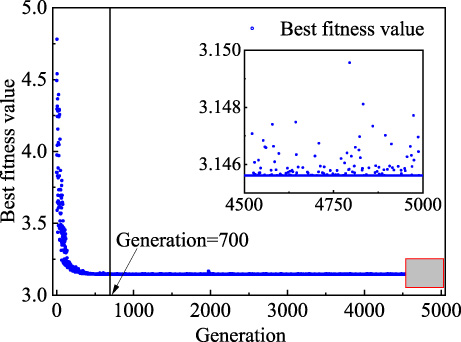
Fitness value of the best individual.
After iterative calculation, the distribution of the NSGA-II solution set that satisfy all constraints, the simulation set and the original HSV standard set are shown in Fig. 10. Figure 10(a) shows the distribution of the solution set as the result of HSV response time, and Fig. 10(b) shows the distribution of the solution set as the result of energy loss. The 28-simulation sets were distributed around the standard solution of the solenoid, indicating that the simulation matrix generated by the D-optimal experimental design method was reasonable. The virtual NSGA-II solution sets were mostly distributed at the edge positions of the 28-simulation sets, meaning that the genetic algorithm quickly searching near the optimal solution after very few steps of iteration, and iterating near the optimal results until the maximum number of iterations was calculated. The optimized T o , T c , E 1 and E 4 were all lower than the original HSV simulation values as judged from the distribution positions of most of virtual NSGA-II solution sets in the figure, showing that the optimization of parameters including electroconductibility, spring stiffness, damping coefficient and coil resistance can effectively improve the HSV response time and energy loss, and also proving that an effective simulation set can be obtained by considering energy loss when optimizing for response time.
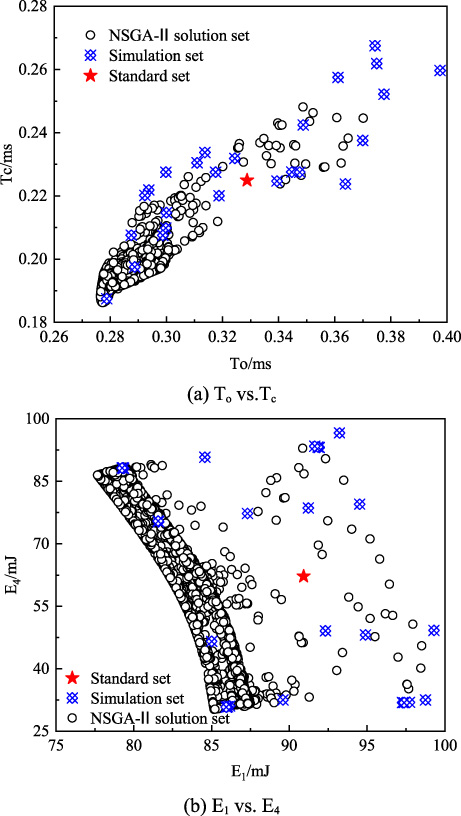
Distribution of NSGA-II solution set, simulation set and standard set.
(2) Pareto front and optimal solution set.
The virtual NSGA-II solution sets were selected to obtain the non-dominated solutions of the multi-objective function, or Pareto optimal solutions, which constituted the Pareto front of the multi-objective optimization problem by the objective function mapping. In this paper, the optimal solutions in three cases were evaluated as shown in Eqs (13)–(15). Equation (13) was the evaluation criterion considering only the response time, Eq. (14) considered only the energy loss, and Eq. (15) involved both.
For an optimization problem with two optimization objectives, the Pareto front was a line, while when the optimization objectives of the problem were three or more, the Pareto front obtained was a surface or hypersurface. Figure 11 shows the Pareto front surface and the projection of the front surface on each axis for the response time with energy loss of HSV. The optimal solutions obtained by selection using Eqs (13)–(15) were marked on the Pareto front surface. Opt1 was the solution that results in the shortest response time, which had a large energy loss. Opt2 was the solution that results in the smallest energy loss, which had a long response time. Opt3 was the optimal solution that had traded off the response time and energy loss. Overall, the opening response time was positively correlated with the closing response time, and the response time was negatively correlated with the eddy current energy loss and positively correlated with the Joule energy loss, which meaning that the eddy current energy loss would decrease and the Joule energy loss would increase when the opening and closing response times were extended. This was owing to the fact that the dynamic response time of HSV was strongly correlated with the current change time in the coil, both in the opening and closing phases. The dynamic response time of HSV depended on the time of the current increase in opening phase and the time of the current decay in closing phase. Since a reduction in the current change rate directly leaded to a reduction in the eddy current energy loss, and an extension of the current action time leaded to an increase in the Joule energy loss.
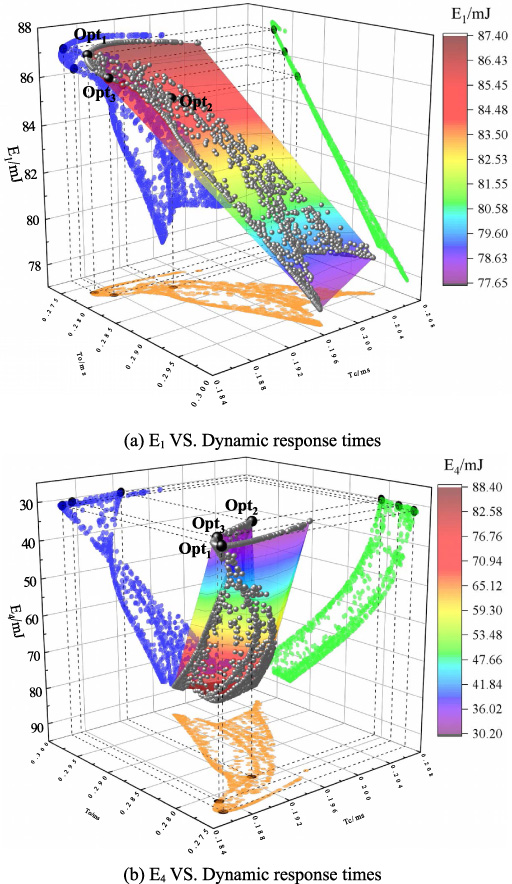
Pareto front of the T o , T c , E 1, E 4 and optimal solution set after selection.
(3) Comparison before and after optimization.
The comparison of the three optimization results sets and the original HSV parameters as well as the response times and energy losses are shown in Table 7. Compared to the original HSV parameters, the optimized parameters changed more significantly, with parameters such as electroconductibility, damping coefficient, and coil resistance remaining at the lower limit of the range of variation, while the spring stiffness under different evaluation criteria exhibited a large variation. Compared with the response time of the original HSV, the optimized results of Opt1 reduced the opening and closing response time by 15.7% and 17.1%, respectively. The optimized result of Opt2 reduced the eddy current energy and Joule energy loss by 6.3% and 49.8%, respectively, compared with the energy loss of the original HSV. The optimized result Opt3 had better response time than Opt2 and better energy loss than Opt1.
Comparison of parameters and results before and after optimization
To further validate the optimal solution of HSV obtained by optimization based on NSGA-II, the parameters of the original HSV were modified and numerical simulations were performed. Figure 12 shows the comparison of armature lift, eddy current energy and Joule energy of HSV before and after optimization. Compared with the original HSV, the optimized armature had a significantly improvement in pull-in speed and reset speed. In the three optimization sets, Opt1 had the shortest opening time, Opt2 had the longest opening time, and the HSV closing time was the opposite. The eddy current energies of the optimized HSV before and after the optimization were nearly the similar in the stage of armature pull-in actuation and the stage of armature reset movement, but in the stage of armature pull-in movement, the eddy current energies loss of the optimized HSV were lower than the original HSV. For the Joule energy, a large difference was shown before and after optimization. The optimized Joule energies were lower than the energy of the original HSV during the whole operating cycle.
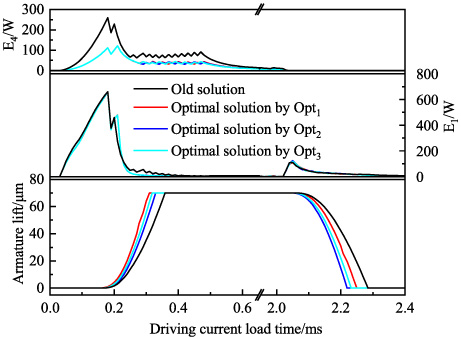
Comparison of driving current and armature lift before and after optimization.
Using Opt3 as the optimized result, Fig. 13 shows the distribution of eddy current energy loss density inside the HSV before and after optimization at different times. The changing current in the coil would produce an induced electric potential, which would form eddy currents in the armature and iron core, and the eddy current energy level was positively correlated with the rate of current change. When the coil inside the HSV began to be energized, the eddy current energy had started to spread from the outside of the coil and gradually penetrated into the iron core inside. At the moment of 0.10 ms, the difference in eddy current loss density before and after optimization was small, and the eddy current energy loss was mainly concentrated around the coil. The eddy current loss density on the inside and outside of the coil was lower than the loss density on the top and bottom sides, which was caused by the uneven distribution of the magnetic field in space. At the moment of 0.15 ms, eddy current loss appeared preferentially inside the optimized iron core and became increasingly larger with time. At the moment of 0.30 ms, the eddy current loss inside the optimized HSV was almost ceased, meaning that the eddy current energy was generated faster and decayed equally fast after the optimization of HSV parameters. On the whole, the optimized HSV showed a reduction in eddy current energy throughout the operating cycle.
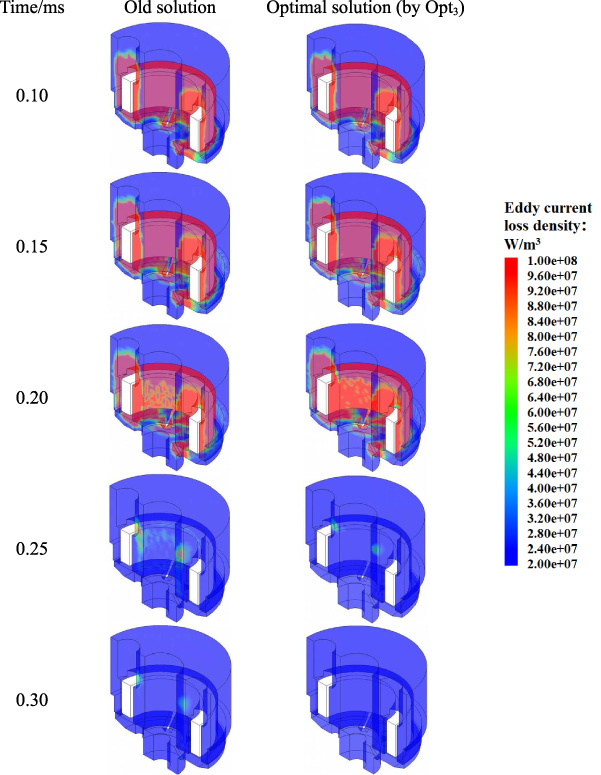
Comparison of eddy current loss density at different times before and after optimization.
The comparison in Fig. 14 shows the distribution of the Joule energy loss density inside the HSV before and after optimization at different times. With the working of HSV, the Joule energy started to spread from the coil outside to the inside of the iron core and armature. At the moment of 0.15 ms, more Joule energy appeared inside the original HSV iron core than the optimized iron core significantly. As the current inside the coil gradually increased over time, the Joule energy inside the HSV began to rise, and the original HSV always produced the most Joule energy. At the moment of 0.25 ms, the drive current in the HSV started to enter the first maintenance phase, and the Joule energy in the HSV was significantly reduced, but the Joule energy in the original HSV was still higher than that in the optimized HSV. At 0.30 ms, the highest Joule energy density inside the optimized solenoid valve was 6.6 × 10⁷ W/m3, while the highest Joule energy density inside the original solenoid valve was 1.2 × 10⁸ W/m3. After optimization, the appearance and decay moment of Joule energy inside the solenoid valve was significantly improved, and the energy loss was significantly reduced.
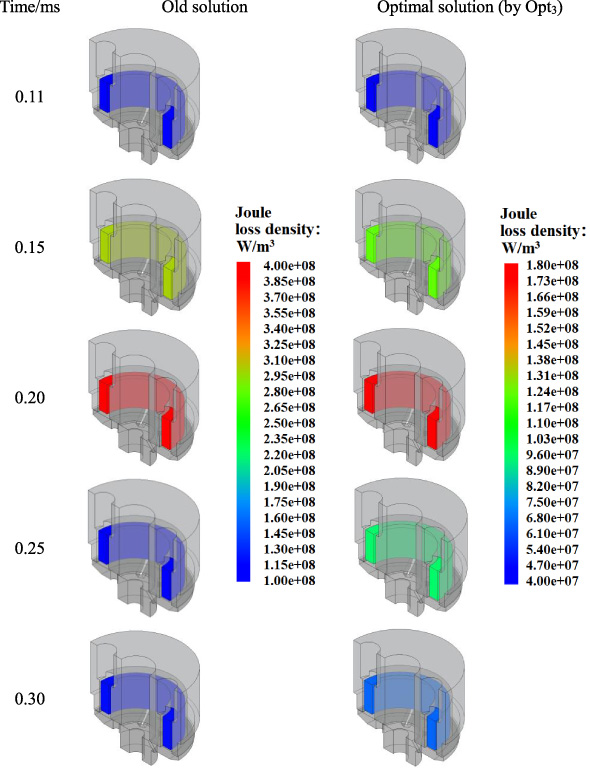
Comparison of Joule loss density at different times before and after optimization.
In this paper, considering the interaction between dynamic response characteristics and energy distribution, the multi-objective cooperation optimization on the response time and energy loss of HSV was carried out. The main conclusions are as follows: The finite element simulation model of HSV was established and the internal energy distribution characteristics during HSV operation were analyzed based on the validated model. During the opening phase of the HSV, the peak eddy current energy can reach 672 W and the peak Joule energy can reach 229 W, accounting for 61.7% and 25.7% of the total energy, respectively. The ratio of eddy current energy to total energy was 17.3% and 37.4%, respectively, and the ratio of Joule energy to total energy was 71.9% and 0.0%, respectively, during the HSV holding and closing periods. The D-optimal experimental design method with electroconductibility, spring stiffness, damping coefficient and coil resistance as parameters was used to develop RSMs for opening response time, closing response time, eddy current energy loss, and Joule energy loss. The R
2 values for these models were 0.940, 0.972, 0.985, and 0.997, respectively, and the residuals of the RSM and the HSV finite element simulation model were within the allowed range. Based on NSGA-II genetic algorithm, the established multi-objective optimization model of interaction between dynamic response and energy loss of HSV was optimized, and three groups of optimization results were obtained by using different evaluation criteria. After optimization, the opening response time of HSV reduced by 15.69%, 14.48%, 15.14%, the closing response time reduced by 17.09%, 14.27%, 16.63%, and the eddy current energy decreased by 4.25%, 6.30%, 5.23%, the Joule energy decreased by 47.41%, 49.75%, 48.44% respectively. The parameters of the HSV finite element simulation model were adjusted and the energy distribution was analyzed using the optimization results of RSMs. The eddy current energy generated and attenuated in the optimized HSV becomes faster, and the eddy current energy loss decreases throughout the working cycle. The Joule energy in the optimized HSV decreases earlier and the attenuation time decreased as a whole. Related conclusions show that the optimization method used in this paper is feasible and the optimization results are reliable.
Footnotes
Acknowledgements
This work was supported by the National Natural Science Foundation of China (Grant number: 52061135203) and the Key Research and Development Project of Ministry of Science and Technology of China (Grant number: 2021YFE0114600).
Conflict of interest
There is no conflict of interest about this article.