
Abstract
Background:
Gait, speech, and drawing behaviors have been shown to be sensitive to the diagnosis of Alzheimer’s disease (AD) and mild cognitive impairment (MCI). However, previous studies focused on only analyzing individual behavioral modalities, although these studies suggested that each of these modalities may capture different profiles of cognitive impairments associated with AD.
Objective:
We aimed to investigate if combining behavioral data of gait, speech, and drawing can improve classification performance compared with the use of individual modality and if each of these behavioral data can be associated with different cognitive and clinical measures for the diagnosis of AD and MCI.
Methods:
Behavioral data of gait, speech, and drawing were acquired from 118 AD, MCI, and cognitively normal (CN) participants.
Results:
Combining all three behavioral modalities achieved 93.0% accuracy for classifying AD, MCI, and CN, and only 81.9% when using the best individual behavioral modality. Each of these behavioral modalities was statistically significantly associated with different cognitive and clinical measures for diagnosing AD and MCI.
Conclusion:
Our findings indicate that these behaviors provide different and complementary information about cognitive impairments such that classification of AD and MCI is superior to using either in isolation.
INTRODUCTION
As the world’s elderly population increases, the number of people living with dementia is increasing rapidly, becoming a serious health and social problem. Alzheimer’s disease (AD) is the most common form of dementia and may account for an estimated 60 to 80% of cases [1, 2]. Although no cure of AD is available, there is an urgent need for the early identification of AD, especially at its early stages, e.g., mild cognitive impairment (MCI), to enable the individual and their carers to prepare for the future and receive appropriate care to help manage symptoms [3]. A growing body of evidence also suggests modifying risk factors and interventions that could prevent or delay progression to AD [3–5]. However, even dementia diagnostic coverage worldwide remains so low that only 40–50% of people with dementia have been diagnosed even in high-income countries [6]. In this context, there is growing interest in developing accurate and easy-to-perform screening tools for the early identification of AD and MCI.
Gait, speech, and drawing behaviors individually have been shown to change in AD and MCI patients [7–27], and discrete characteristics of these behavioral impairments are associated with specific cognitive impairments [7–13, 27]. For example, slower gait speed and greater gait variability (e.g., step-to-step fluctuations in time) occur even in the prodromal stages of AD and has been suggested to be particularly associated with impaired executive function [7–12]. Speech and language impairments, including changes in phonetic characteristics such as speech rate and pause as well as in linguistic characteristics such as lexical and semantic content, have been observed in the early stages of AD [15–18] and may enable to predict the onset of AD [14, 20]. The associations between quantitative speech characteristics and specific cognitive impairments have also been shown. For example, increased pauses as well as a reduction in relevant information during a picture description task were correlated with impairments in episodic memory [18, 21]. Drawing tasks, such as trail-making and clock-drawing tests, have been widely used for screening cognitive impairment and dementia. In addition to the drawing outcome, the characteristics of the drawing process such as reduced drawing speed as well as increased pauses between drawings have been reported as statistically significant signatures for detecting AD and MCI [22–25] and impaired global cognition [22]. Therefore, these behavioral analyses are expected to help in the early detection of AD and MCI as useful screening tools. Furthermore, a gait test may be incorporated into the clinical practice by using sensors, such as an electronic walkway or wearable sensors [13, 27–30], and speech and drawing data can be collected during standard neuropsychological tests for the diagnosis of dementia [19, 31]. Although most existing research investigated each behavior in isolation, the heterogeneity of the brain regions involved in their execution [12, 32–36] as well as of their behavior-cognitive relationships [7–13, 27] suggests that each of these behaviors may capture different and complementary profiles of cognitive impairments associated with AD. Therefore, we hypothesized that gait, speech, and drawing behaviors that provide complementary information about cognitive impairments can be combined to provide higher accuracy for AD and MCIdetection.
Here, we aimed to investigate if combining behavioral data of gait, speech, and drawing can improve classification performance compared with the use of individual modality and if each of these behavioral data can be associated with different cognitive and clinical measures for the diagnosis of AD and MCI. To this end, we collected gait, speech, and drawing behaviors as well as cognitive and clinical measures from the same participants and investigated them by using statistical analysis and machine learning models.
METHODS
Participants
We recruited outpatients from the Department of Psychiatry, University of Tsukuba Hospital, the spouses of the patients, and other participants either through local recruiting agencies or advertisements in the community in Ibaraki, Japan. Inclusion criteria for the patients were a diagnosis of AD or MCI. The AD patients were in mild to moderate stages. MCI subtypes were not examined. Controls were age-matched to the patients. Patients were excluded if they had diagnoses of non-AD dementia (dementia with Lewy bodies, frontotemporal dementia, vascular dementia, etc.), non-AD MCI, or other serious diseases or disabilities that would interfere with the behavioral data collection. All examinations were conducted in Japanese. This study was conducted under the approval of the Ethics Committee, University of Tsukuba Hospital (H29-065 and R01–168) and followed the ethical code for research with humans as stated by the Declaration of Helsinki. All participants provided written informed consent to participate in this study.
Cognitive performance of all participants was assessed using the following neuropsychological examinations conducted by neuropsychologists: the Mini-Mental State Examination (MMSE) for global cognition, immediate and delayed recall of the logical memory-story A of the Wechsler Memory Scale-Revised (LM-IA and LM-IIA) for episodic memory, the Frontal Assessment Battery (FAB) for executive function, Trail Making Test part-A (TMT-A) for information processing speed and Trail Making Test part-B (TMT-B) for executive function and attention, and the Clock Drawing Test (CDT) for visuospatial function. For clinical scales, all participants were administered the Clinical Dementia Rating (CDR), Geriatric Depression Scale (GDS), body mass index (BMI), Barthel Index of Activities of Daily Living (ADL), and Lawton Instrumental Activities of Daily Living (IADL). The severity of medial temporal lobe (MTL) atrophy was also evaluated using structural magnetic resonance imaging (MRI) (please see the Supplementary Material for more details).
Regarding the diagnosis of AD, MCI, and cognitively normal (CN), two psychiatrists (authors T.A. and K.N.), who were experts in dementia and blinded to the results of behavioral data analysis, discussed each case based on the clinical record as well as the neuropsychological scores and clinical scales, and confirmed the diagnoses of AD, MCI, and CN. AD patients fulfilled the National Institute on Aging and Alzheimer’s Association (NIA-AA) criteria for probable AD dementia [37]. They also fulfilled the AD Neuroimaging Initiative (ADNI) criteria for AD in terms of MMSE, CDR, and LM-IIA scores [38], except that we included patients with moderate AD based on Benoit et al.’s criteria [39]. Specifically, AD patients fulfilled the following criteria: MMSE score 10–26; the CDR global score 0.5 or 1; and LM-IIA score ≤8 for 16 years of education (YoE), ≤4 for 8–15 YoE, and ≤2 for 0–7 YoE. MCI patients fulfilled the NIA-AA criteria for MCI [40]: 1) cognitive concern by the subject, informant, or clinician; 2) impairment in one or more cognitive domains; 3) essentially normal functional activities; and 4) absence of dementia. They also fulfilled at least two of the three ADNI criteria for MCI [38]: MMSE score 24–30; the CDR global score 0.5, with the memory box score being 0.5 or greater; and LM-IIA score ≤8 for 16 YoE, ≤4 for 8–15 YoE, and ≤2 for 0–7 YoE. CN participants did not fulfill the NIA-AA criteria for MCI or dementia [37, 40]. They also fulfilled at least two of the three ADNI criteria for CN [38]: MMSE score 24–30; the CDR global score 0; and LM-IIA score ≥9 for 16 YoE, ≥5 for 8–15 YoE, and ≥3 for 0–7 YoE.
Behavioral data collection and feature extraction
For the gait task, participants walked at their usual pace over nine meters with a marker-based motion capture system with an eight-camera OptiTrack Flex13, sampled at 120 Hz using OptiTrack Motive software 2.1.0 Beta 1 (NaturalPoint, Inc, Corvallis, OR, USA), and we analyzed three trials per participants. Speech and drawing tasks were selected from a set of neuropsychological tasks frequently used for detecting AD or MCI [19, 31]. Participants performed five speech tasks with a tablet device (iPad Air 2): counting backwards, subtraction, phonemic and semantic verbal fluency, and picture description with the Cookie Theft picture adapted from the Boston Diagnostic Aphasia Examination [41]. Speech data were recorded by using the iPad’s internal microphone (core audio format, 44,100 Hz, 16-bit). Participants also performed the following five drawing tasks during the neuropsychological assessment using a digitizing tablet and pen (Wacom Cintiq Pro 16; sampling rate: 180 Hz, pen pressure levels: 8192): writing a sentence about anything and the copy intersecting-pentagon item of MMSE (hereinafter called Sentence and Pentagon), TMT-A and TMT-B, and CDT.
We extracted behavioral features based on previous studies to facilitate interpretations (for gait [7, 42], for speech [19, 43–51], for drawing [22–25]). Here, we provide an overview of the behavioral features, and a full description is provided in the Supplementary Material. The 35 gait features consisted of those associated with pace (e.g., gait speed and step/stride length), rhythm (e.g., step/stride time), variability (e.g., step/stride time variability), left-right asymmetry (e.g., the difference between left-right step/stride time), and postural control (e.g., maximum toe clearance). The 84 speech features consisted of acoustic features (e.g., Mel-frequency cepstral coefficients (MFCCs)) and prosodic features (e.g., pitch variability and proportion of pause duration) extracted from audio data as well as linguistic features (e.g., proportion of mistakes in both calculation tasks) extracted from manually transcribed text data. Linguistic features during the picture description task included Honoré’s statistics for measuring vocabulary richness [48] and the number of unique entities that a participant described in the picture, referred to as information units, for measuring informativeness [43, 49–51]. The 60 drawing features consisted of those associated with kinematics (e.g., drawing speed), pressure-related (e.g., pressure variability), time-related (e.g., pause durations between drawings), and TMT-specific features (e.g., time duration between nodes). For drawing, we focused on features that represent the drawing process, and thus did not investigate features representing the final product of drawing such as linguistic aspects of the sentence and characteristics of the clock face in CDT. Variability features of all modalities were calculated using the standard deviation (SD), except that variabilities of step/stride length and writing pressure were calculated using the coefficient of variation (CV).
Classification model
The classification models were built on the basis of behavioral features using multiple types of machine learning models with automatic feature selection. The models included k-nearest neighbors [52], random forest [53], and support vector machine (SVM) [54] implemented using the Python package scikit-learn (version 0.23.2). For the feature selection, we used a sequential forward selection algorithm. Model performances were evaluated by using accuracy and the area under receiver operating characteristic curve (AuROC) obtained from 20 iterations of ten-fold cross-validation methods. A three-class AuROC was computed as defined by Hand and Till [55]. For more details including model parameters, please see the Supplementary Material.
Statistical analysis
Group differences between CN, MCI, and AD in demographics and cognitive/clinical measures were examined by using the chi-square test for sex and one-way analysis of variance (ANOVA) tests for other continuous data. Shapiro-Wilk tests were used to check normality assumption and behavioral features that did not fit the normal distribution were power transformed to normalize the distributions. Between-group comparisons of behavioral features were conducted with one-way ANOVAs adjusted for age and sex. Pairwise multiple comparisons (Bonferroni adjusted p values) were performed when comparing individual diagnostic groups. We did not perform multiple-comparison corrections across behavioral features, and the statistical significance was set to a two-sided p < 0.05.
Multiple linear regression controlling for age and sex as covariates was used to investigate associations between cognitive/clinical measures and behavioral features selected in the classification model. Specifically, the dependent variable was one of the cognitive or clinical measures for MMSE, LM-IA, LM-IIA, FAB, TMT-A, TMT-B, CDT, GDS, ADL, IADL, and MTL atrophy. As for the independent variables, we first performed principal component analyses to limit multiple comparisons and extract uncorrelated behavioral factors. We then used the first two principal components (PCs) of each behavioral modality as the independent variables in addition to age and sex as covariates. Thus, the number of independent variables were eight.
RESULTS
Participant characteristics and behavioral data
A total of 135 participants were recruited for this study and met the inclusion criteria, and behavioral data collection was performed on them for all three behavioral modalities. 17 participants were excluded from this analysis because of problems in the data processing due to noise in the motion capture data. This yields a total of 118 participants: 47 CN participants, 45 MCI patients, and 26 AD patients. Table 1 lists the clinical and demographic information of all these participants. Regarding the demographics, age, and years of education did not differ between groups, while there was a significantly lower proportion of female participants in the MCI group compared with the control group (Table 1). For the cognitive and clinical measures, BMI, GDS, and ADL did not differ between groups, and other variables were different between the three diagnostic categories (Table 1).
Demographic, cognitive, and clinical measures for CN, MCI, and AD
Data displayed as mean±standard deviations were assessed using one-way ANOVAs, whereas number (percentage) were assessed using the chi-square test. Bold values highlight statistically significant differences. Pairwise multiple comparisons (Bonferroni adjusted p values) were performed when comparing individual diagnostic groups. Significant differences between groups are marked with C, M, or A (C: Different to CN, M: Different to MCI, A: Different to AD). †The CN group includes one participant with a CDR test score of 0.5. aThe total possible score ranges from 0 to 30. bLM-IA: immediate recall of the logical memory-story A of the Wechsler memory scale-revised; the total possible score ranges from 0 to 25. cLM-IIA: delayed recall of the logical memory-story A of the Wechsler memory scale-revised; the total possible score ranges from 0 to 25. dThe total possible score ranges from 0 to 18. eThe total possible score ranges from 0 to 7. fThe total possible score ranges from 0 to 15. gThe total possible score ranges from 0 to 100. hThe total possible score ranges from 0 to 8.
For the behavioral data collection, all participants completed the three gait trials and five drawing tasks and 114 of the 118 participants completed all five speech tasks. For full information of the missing data, please see the Supplementary Material.
Differences in behavioral features between AD, MCI, and controls
In an adjusted model controlling for age and sex, 18 of the 35 gait features, 13 of the 84 speech features, and 27 of the 60 drawing features showed statistically significant differences between the diagnostic groups (all p < 0.05; Table 2 and Supplementary Table 1). Among these 58 features with significant differences between diagnostic groups, 51 features (i.e., 87.9%) showed larger changes from CN in AD compared with MCI, indicating gradual changes of behavioral features from CN to MCI and to AD.
Examples of behavioral features with statistically significant differences between diagnosis categories of AD, MCI, and CN
Data displayed as mean±standard deviations were assessed using one-way ANOVAs adjusted for age and sex. Bold values highlight statistically significant differences. Pairwise multiple comparisons (Bonferroni adjusted p values) were performed when comparing individual diagnostic groups. Significant differences between diagnosis categories are marked with C, M, or A (C: Different to CN, M: Different to MCI, A: Different to AD). †Data were normalized by the length of the speech ‡Data were normalized by total stroke length.
Pairwise comparisons with Bonferroni corrections identified statistically significant differences in behavioral features between CN participants and patients with AD or MCI (Table 2 and Supplementary Table 1). We found features with statistically differences between CN participants and AD patients from all categories of behavioral features in each modality and from all tasks investigated in this study. Specifically, compared with CN participants, AD patients walked with slower gait speed related to pace (p < 0.001); with slower stride time related to rhythm (p = 0.027); with greater stride time variability (p = 0.044); with greater step time left-right asymmetry (p = 0.043); and with lower maximum toe clearance related to postural control (p < 0.001). Speech of AD patients showed significant changes in acoustic features such as lower MFCC1 during the picture description task (p = 0.023); in prosodic features such as less pitch variability during the counting backwards task (p = 0.009) and greater proportion of pause durations both in spontaneous speech during the picture description task (p = 0.001) and in word production during the semantic verbal fluency task (p < 0.001); and in linguistic features such as increased proportion of mistakes during both calculation tasks (p < 0.001) and lower vocabulary richness measured by Honoré’s statistics and less informativeness measured by the total number of information units normalized by the length of the speech during the picture description task (p = 0.019, p = 0.009). Drawings of AD patients showed significant differences in kinematics such as slower drawing speed in TMT-B (p < 0.001); in pressure-related features such as greater pressure variability in both TMT-A (p = 0.010) and TMT-B (p < 0.001); in time-related features such as longer pause duration between drawings normalized by total stroke length in all five tasks (Sentence: p = 0.005, Pentagon: p = 0.023, TMT-A and TMT-B: p < 0.001; CDT: p = 0.003); and in TMT-specific features such as longer time duration between nodes in both TMT-A (p = 0.008) and TMT-B (p = 0.026).
MCI patients had also statistically significantly different features from CN participants in parts of behavioral feature categories and in parts of tasks. Gait of MCI patients was significantly different in two categories of gait features: pace, such as lower peak gait speed (p = 0.030) and shorter step length (p = 0.040), and postural control, such as lower maximum toe clearance (p = 0.020). Speech of MCI patients showed significant changes in only acoustic features of MFCCs during the picture description tasks (p≤0.015) and no significant differences in other prosodic and linguistic features. Drawing features that were significantly different between MCI patients and CN participants were all those during the TMT-A or TMT-B. They consisted of all categories except for kinematics: pressure-related features such as greater pressure variability in TMT-B (p = 0.004), time-related features such as longer pause duration between drawings normalized by total stroke length in TMT-B (p = 0.008), and TMT-specific features such as longer task duration normalized by the number of answered edges in both TMT-A (p = 0.037) and TMT-B (p = 0.005).
Classification using gait, speech, and drawing data
We evaluated the model performance for classifying three diagnosis categories of AD, MCI, and CN on the basis of gait, speech, and drawing behavioral features by using iterative ten-fold cross validation. Consequently, combing multiple behavioral modalities improved the model’s performance compared with that using a single modality. The model using all three behavioral data achieved the best performance with an accuracy of 93.0% (AuROC of 0.98; Table 3 and Fig. 1). This was higher than an AuROC value of 0.86 calculated as a baseline value by using MMSE scores. The model using all three behavioral data was based on an SVM with a radial basis function (RBF) kernel using 13 gait features, 17 speech features, and 15 drawing features selected by the automatic feature selection procedure. The SVM with an RBF kernel also had the highest accuracies in the other settings using two or single modalities.
Model performance for classifying three diagnosis categories of AD, MCI, and CN. Values were obtained by 20 iterations of ten-fold cross validation
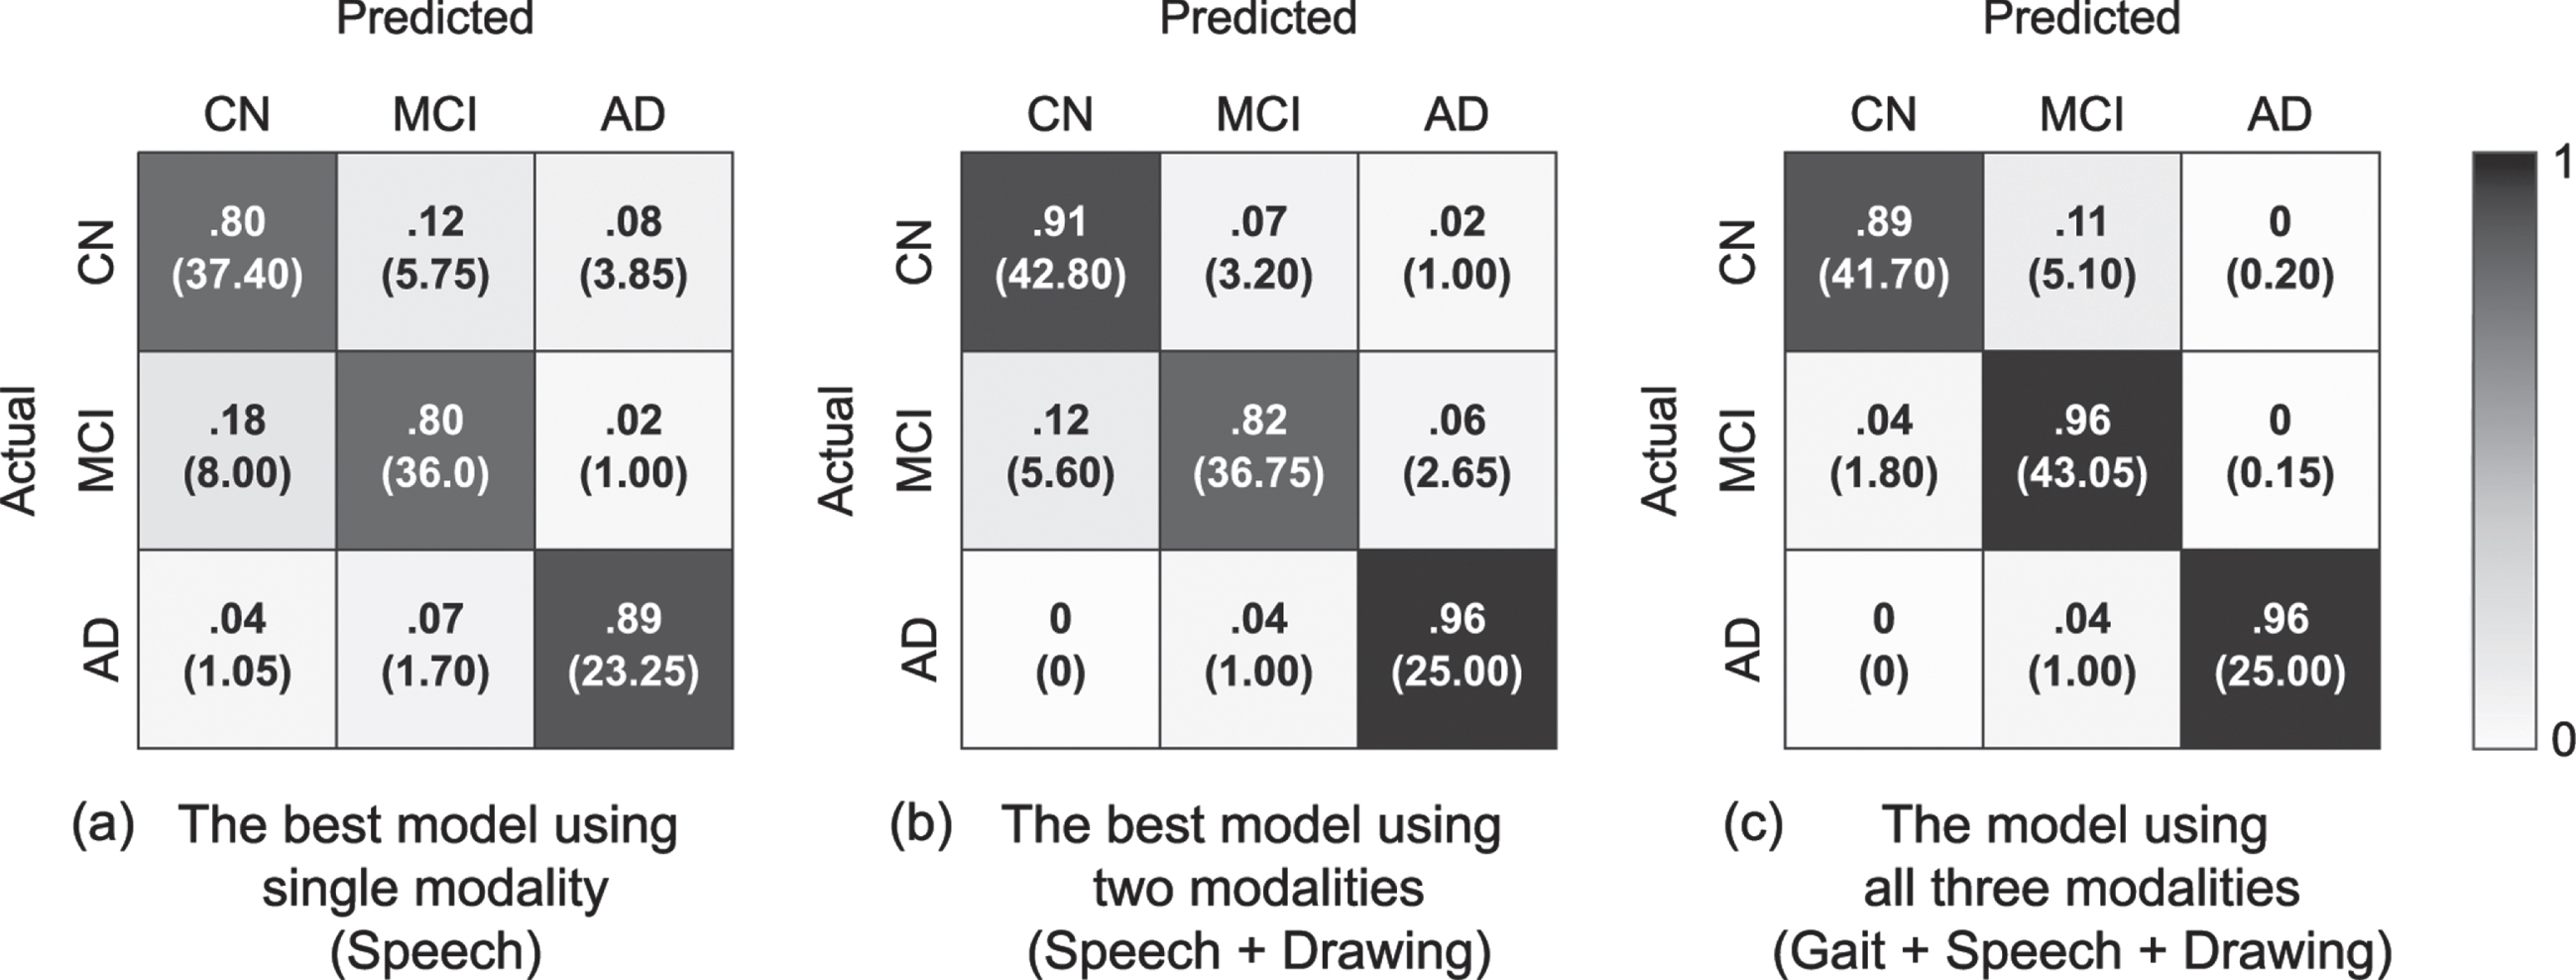
Normalized confusion matrixes of the three-class classification model for AD, MCI, and CN obtained using 20 iterations of ten-fold cross validation. The number in parentheses indicates the mean number of individuals with CN, MCI, and AD among the 20 iterations. (a) The best model using a single modality (when using speech features) with 81.9% accuracy and AuROC of 0.91. (b) The best model using two different modalities (when using speech and drawing features) with 88.6% accuracy and AuROC of 0.96. (c) The model using all three modalities of gait, speech, and drawing with 93.0% accuracy and AuROC of 0.98.
We also tested the performance of the classification models in discriminating AD (or MCI) from CN participants. The results of the iterative ten-fold cross validations showed similar trends to those of the three-class classification models: the model using the combined data of all three behavioral modalities achieved more accurate discrimination between AD (or MCI) patients and CN participants, followed by that using two modalities, and that using a single modality (Tables 4 5). Specifically, for discriminating AD from CN participants, the model using gait, speech, and drawing features achieved 100.0% accuracy (100.0% sensitivity, 100.0% specificity, 100.0% F1 score, AuROC of 1.00), while the best accuracy on a single modality was 96.2% when using drawing features (96.9% sensitivity, 95.7% specificity, 94.7% F1 score, AuROC of 0.98). For discriminating MCI from CN participants, the model using gait, speech, and drawing features achieved 89.5% accuracy (94.7% sensitivity, 84.5% specificity, 89.8% F1 score, AuROC of 0.96), while the best accuracy on a single modality was 83.0% when using speech features (82.4% sensitivity, 83.6% specificity, 82.6% F1 score, AuROC of 0.86). Both AuROC values using all three modalities for discriminating AD (or MCI) patients from CN participants were higher than those of 0.98 (0.62) calculated as a baseline value by using MMSE scores. All two-class classification models achieving the best accuracies on each setting were based on the SVM with an RBF kernel.
Model performance for classifying diagnosis categories of AD and CN. Values were obtained by 20 iterations of ten-fold cross validation
Model performance for classifying diagnosis categories of MCI and CN. Values were obtained by 20 iterations of ten-fold cross validation
Association of behavioral features with cognitive and clinical measures
To better understand how combining multimodal behavioral data could improve classification performance, we investigated the association of behavioral features selected in the model with cognitive and clinical measures. We first applied a principal component analysis to the selected features and obtained the first two PCs for each behavioral modality. They comprised 67.3%, 35.5%, and 54.0% of the total variance in the selected gait, speech, and drawing features, respectively. The estimated factor loadings indicated the characteristics of each principal component as follows: the PC1 of gait features was mainly related to gait acceleration and PC2 was related to stride time variability; the PC1 of speech features was mainly related to pause durations and PC2 was related to variances of the speech spectrum (i.e., variances of MFCCs); and the PC1 of drawing features was mainly related to drawing speed and PC2 was related to pause duration between drawings.
The results of multiple linear regression controlling for age and sex showed that different combinations of behavioral modalities were associated with cognitive and clinical measures (Table 6). Specifically, among the modalities, PCs of only speech features were associated with LM-IIA (p =0.003 for PC1; p = 0.010 for PC2), FAB (p < 0.001 for PC1 and PC2), GDS (p < 0.001 for PC1), and MTL atrophy (p < 0.001 for PC1); PCs of only drawing features were associated with TMT-A (p < 0.001 for PC1; p = 0.008 for PC2) and CDT (p < 0.001 for PC1); PCs of gait and drawing features were associated with ADL (p < 0.001 for gait PC2; p = 0.006 for drawing PC2); PCs of speech and drawing features were associated with LM-IA (p = 0.004 for speech PC1; p = 0.003 for speech PC2; p = 0.041 for drawing PC1) and MMSE (p < 0.001 for speech PC1; p = 0.006 for speech PC2; p = 0.031 for drawing PC1); PCs of gait, speech, and drawing features were associated with IADL (p < 0.001 for gait PC2; p = 0.004 for speech PC2; p = 0.036 for drawing PC1; p = 0.033 for drawing PC2) and TMT-B (p = 0.037 for gait PC2; p = 0.009 for speech PC1; p = 0.013 for speech PC2; p < 0.001 for drawing PC1 and PC2).
Associations of behavioral features with cognitive and clinical measures.
Data displayed as beta coefficient (standard error) were assessed using multiple linear regression adjusted for age and sex. The possible score range of all cognitive and clinical measures except for MTLa were rescaled from 0 to 1. In addition, TMT-A, TMT-B, GDS, and MTLa scores were reversed for the purpose of comparison with other variable coefficients, as higher scores indicate better performance. All gait, speech, and drawing variables were standardized by subtracting the mean and dividing by standard deviation. PC, Principal Component; MMSE, Mini-Mental State Examination; LM-IA, immediate recall of the logical memory-story A of the Wechsler memory scale-revised; LM-IIA, delayed recall of the logical memory-story A of the Wechsler memory scale-revised; FAB, Frontal Assessment Battery; TMT-A, Trail making test-part A; TMT-B, Trail making test-part B; CDT, Clock Drawing Test; GDS, Geriatric Depression Scale; ADL, Activity of Daily Living; IADL, Instrumental Activity of Daily Living; MTLa, Medial temporal lobe atrophy. *p < 0.05; **p < 0.01; ***p < 0.001 †Measures with statistically significant differences between diagnosis categories of AD, MCI, and CN assessed by ANOVAs.
We also found statistically significant associations of discrete behavioral characteristics with specific cognitive domains reported in previous studies on individual behavioral modalities, even considering the effects of other behavioral modalities. Specifically, they included the associations between stride time variability of gait PC2 and executive function measured by TMT-B (p = 0.037); between pause durations of speech PC1 and episodic memory measured by LM-IA (p = 0.004) and LM-IIA (p = 0.003); and between drawing speed of drawing PC1 and global cognition measured by MMSE (p = 0.031).
DISCUSSION
We investigated multimodal behavioral data of gait, speech, and drawing collected from 118 participants consisting of AD, MCI, and CN participants. Our first main finding was that combining multimodal behavioral data could consistently improve classification performance both for classifying AD, MCI, and CN as well as discriminating AD (or MCI) from CN participants. Combining all three behavioral modalities could consistently achieve more accurate classifications than combining any two modalities, and the model using two modalities could achieve better classification performance than that using a single modality. Our second finding was that each behavioral data may contain different and complementary information for cognitive impairments associated with AD. The regression analysis showed that each behavioral modality was associated with different cognitive and clinical measures for the diagnosis of AD and MCI. In addition, different modalities could achieve the best performance for differentiating AD (or MCI) from CN participants, i.e., drawing for AD versus CN and speech for MCI versus CN. Our findings suggest that gait, speech, and drawing behavioral data provides different and complementary information about cognitive impairments useful for the diagnosis of AD and MCI such that clinical diagnostic classification is superior to using either in isolation.
All three behavioral modalities had features that statistically significantly differentiated AD or MCI patients from CN participants and almost all features with significant differences between diagnostic categories showed larger changes from CN in AD compared with MCI. The trends in their changes were consistent with those reported in previous studies on AD or MCI (for gait [7, 42], for speech [19, 43–47], for drawing [22–25]). These behavioral sensitivities to the diagnosis of AD and MCI have been explained as follows: as these behaviors are complex tasks requiring coordination between widespread brain regions related to both motor and cognitive functions [12, 32–36], discrete characteristics of each behavioral modality may reflect neuropathological changes due to AD dementia [12, 56–59]. Our results align with those of previous studies that have shown statistically significant changes in behavioral characteristics from CN individuals and their larger changes in AD compared with earlier stages (i.e., MCI), suggesting the possibility of behavioral markers for detecting AD/MCI and neuropathological changes due to AD. In addition, we found statistically significant features for differentiating MCI patients from CN participants in specific feature categories (e.g., gait features related to pace and postural control) and specific tasks (e.g., TMTs), while those for differentiating AD patients from CN participants were found both in all categories and in all tasks investigated in this study. This result may help explore behavioral characteristics showing higher sensitivity to changes at early stages of AD in cognitive function and in neuropathological changes.
Our results show that combining gait, speech, and drawing behavioral data can consistently and substantially improve the classification performance of the individual-modality-based classification models. Combining all three behavioral modalities achieved 93.0% accuracy for classifying AD, MCI, and CN, and only 81.9% when using even the best single modality. Because the classification model achieving the best accuracy was based on the SVM with an RBF kernel, nonlinear interactions between behavioral features of different modalities might contribute to the improvement of classification performance by combining multimodal behavioral data. Many studies on biomarkers such as structural MRI, functional imaging, and cerebrospinal fluid have shown that their combinations enhance the classification accuracy of detecting AD or MCI [60, 61]. One of our contributions lies in providing the first empirical evidence that the benefit of combining different data modalities for detecting AD and MCI can be achieved even with combinations of daily behaviors.
We also suggest that the enhancement of classification performance by combining multimodal behaviors results from their complementary nature regarding 1) cognitive and clinical measures for the diagnosis of AD and MCI as well as 2) discrimination of AD or MCI from CN ones. The selective behavior-cognitive relationships that we showed includes those found in previous studies such as stride time variability and executive function [9–12], pauses during spontaneous speech and episodic memory [21], and drawing speed and global cognition [22]. By demonstrating these associations by using the multimodal behavioral data collected from the same individuals, our results strengthen the notion that these behavioral characteristics in each modality reflect different profiles of cognitive impairments associated with AD [7–13, 27]. In addition, gait, speech, and drawing behaviors each have been suggested to reflect neuropathological changes due to AD [13, 56–59]. Our results suggest that these behavioral modalities may also provide different and complemental information for estimating neuropathological changes. To confirm this suggestion, a further study with validated biomarkers for measuring neuropathological changes is required.
Behavioral data such as gait, speech, and drawing have been proposed as a non-invasive, easy-to-perform means of helping detect AD and MCI in clinical settings [26, 59]. For example, adding a gait test or speech analysis to a neuropsychological assessment has been found to improve the accuracy in detecting people with MCI [31] or a higher probability of developing dementia [29]. In addition, the behavioral data we analyzed in this study may be easily acquired in routine clinical practice. In fact, the speech and drawing data were collected during representative neuropsychological tests for the diagnosis of AD, and the gait data were collected through simple nine-meter walk trials. Although the marker-based motion capture system used in this study might not be readily available in clinical settings, wearable sensors instead might be used for measuring gait characteristics as studies suggested (e.g., [28, 63]). Given the accessibility to behavioral data in clinical practice, our results suggest that combining such behavioral data can help clinicians accurately detect patients with AD and MCI. This would be also useful as an easy-to-perform screening tool to select individuals who should be further examined with biomarkers both in clinical practice and clinical treatment trials.
Another clinical implication of this study is that our findings might help computerized detection of AD without specialists by improving the performance of computerized screening methods proposed in previous studies [13, 65]. Examples of such methods include automatic assessments of gait characteristics using electronic walkways or wearable sensors [13, 30] and those of drawing characteristics during neuropsychological tests using a digital pen [23]. These methods might benefit from being combined with other behavioral modalities. In addition, when comparing with approaches using computerized assessment tools including digitalized neuropsychological tests, this approach focusing on behavioral data may help promote future efforts towards the development of continuous and passive monitoring tools for the early detection of AD from data collected in everyday life. In fact, recent studies demonstrated the feasibility of using daily walking behavior collected in accelerometer sensors in a free-living setting [28] and daily conversational speech [66–68] for detecting AD or MCI patients. Although further research is needed to investigate the operability and acceptability of real-world data collection, the combination of multimodal behavioral data may be useful for developing an accurate screening tool using behavioral data collected in everyday life.
We acknowledge a number of limitations. First, our analysis did not include validated biomarkers such as cerebrospinal fluid and positron-emission tomography markers of amyloid-β and pathologic tau, even though these biomarkers have been recognized as a standard means of evidencing the biological state of AD [69]. A future study should confirm our findings with a diagnosis based on biomarkers. Second, parts of the cognitive measures we used for the diagnosis and regression analysis were based on the tablet version of drawing tasks instead of the standard paper-and-pencil version; however, given the previous studies showing high correlations between the resulting scores of the tablet- and paper-based tests [70, 71], its effect on our main findings is potentially small. Third, although to our knowledge this is the first study investigating combinations of gait, speech, and drawing data for detecting AD and MCI, the sample size was limited. This might affect the generalizability of our results. Fourth, residual confounding can still exist in addition to age and sex considered in the analysis. Fifth, in terms of statistical analyses, we did not adjust for multiple comparisons across behavioral features due to the exploratory nature of this investigation. However, our results showed that all three modalities had behavioral features with significant differences at the p < 0.0001 level and their trends in their changes were consistent with those reported in previous studies on AD or MCI [7, 42–47]. Thus, we believe that our first empirical evidence obtained from the investigation of multimodal behavioral data collected from the same participants could still provide support for the hypothesis that each behavior is sensitive to the diagnosis of AD and MCI, although results need to be replicated on large samples. Finally, all results of the classification performances reported in this work are cross-validation results due to the limited data samples, which is less ideal compared with using a separate validation dataset. To further confirm our results about the improvement of classification performance by combining data of multiple behavioral modalities, future studies should examine the model performance using a separate validation dataset or nested cross-validation procedure.
In conclusion, this pilot study provides initial evidence that multimodal behavioral data of gait, speech, and drawing provide different and complementary information about cognitive impairments such that clinical diagnostic classification for AD and MCI is superior to using either in isolation. Our findings may help develop non-invasive, easy-to-perform screening tools. A future study is needed to better understand the associations of behavioral characteristics with specific profiles of neuropathological changes.