
Abstract
Background:
Automatic analysis of the drawing process using a digital tablet and pen has been applied to successfully detect Alzheimer’s disease (AD) and mild cognitive impairment (MCI). However, most studies focused on analyzing individual drawing tasks separately, and the question of how a combination of drawing tasks could improve the detection performance thus remains unexplored.
Objective:
We aimed to investigate whether analysis of the drawing process in multiple drawing tasks could capture different, complementary aspects of cognitive impairments, with a view toward combining multiple tasks to effectively improve the detection capability.
Methods:
We collected drawing data from 144 community-dwelling older adults (27 AD, 65 MCI, and 52 cognitively normal, or CN) who performed five drawing tasks. We then extracted motion- and pause-related drawing features for each task and investigated the associations of the features with the participants’ diagnostic statuses and cognitive measures.
Results:
The drawing features showed gradual changes from CN to MCI and then to AD, and the changes in the features for each task were statistically associated with cognitive impairments in different domains. For classification into the three diagnostic categories, a machine learning model using the features from all five tasks achieved a classification accuracy of 75.2%, an improvement by 7.8% over that of the best single-task model.
Conclusion:
Our results demonstrate that a common set of drawing features from multiple drawing tasks can capture different, complementary aspects of cognitive impairments, which may lead to a scalable way to improve the automated, reliable detection of AD and MCI.
Keywords
INTRODUCTION
As the world’s older adult population increases, early detection and diagnosis of dementia have become a major societal challenge. Diagnosis of individuals with dementia at earlier stages, e.g., mild cognitive impairment (MCI), enables early interventions that may prevent or delay the onset of dementia [1–3], as well as provision of appropriate care to help manage symptoms [3]. In particular, with the possible advent of disease-modifying treatments for Alzheimer’s disease (AD) [4], the most common form of dementia, there is a growing need for early diagnosis of AD. However, diagnosis rates remain so low that globally 75% of people with dementia have not been diagnosed [5], and the rates are particularly low for earlier stages [5–7]. A possible solution for these low rates may be screening in non-specialist settings such as primary care [8]. In fact, statistics indicate that primary care physicians perceive barriers to recognizing the presence of dementia and making timely referrals to specialists [5]. Accordingly, easy-to-perform screening tools that can be used in primary care, or even at home, would help identify individuals who require further examination for AD diagnosis and thus improve the diagnosis rates.
Drawing tests are a commonly used tool for screening and clinical diagnosis of AD. Various drawing tests have been developed and applied, because changes in drawing capability are known to be sensitive indicators of AD and MCI [9]. These tests were each designed to capture impairments in specific cognitive domains according to test-specific scoring methods that evaluate the drawing outcome. For example, the Trail Making Test (TMT) measures an individual’s processing speed in terms of the task completion time [10], while the Clock Drawing Test (CDT) measures executive function through qualitative analysis of the clock face, numbers, and hands [11]. In clinical practice, combinations of multiple drawing tests have often been used for better performance in screening or diagnosis of AD by capturing multiple aspects of cognitive impairments [10, 12]. These drawing tests require clinical specialists to evaluate the outcomes. Thus, the development of automated drawing-based tools that work even in non-specialist situations would lower the barriers to AD screening.
Recent studies have proposed computer-based analysis of the characteristics of the drawing process rather than those of the drawing outcome. For example, patients with AD or MCI exhibit changes in drawing characteristics that are related to motion (e.g., slower speed [13–15]) and pauses (e.g., longer pauses [13, 16]). As a result, computer models that use features representing these changes have successfully classified AD, MCI, and control individuals [13, 17]. However, most of these studies examined individual tasks in isolation and thus did not explore an effective combination of multiple tasks. On the other hand, it has been reported that various drawing characteristics during a specific, individual task are associated with cognitive impairments in specific domains. For example, longer pauses in the TMT are associated with impairments in inhibitory control, switching ability, and processing speed [18], while those in the CDT are associated with impairments in processing speed and working memory [19]. As different drawing tasks are designed to capture impairments in different cognitive domains through evaluation of the drawing outcome, analysis of the drawing process in different tasks may also capture different aspects of cognitive impairments. Accordingly, we hypothesized that analysis of the drawing process in multiple drawing tasks could capture different, complementary aspects of cognitive impairments, with the idea that a combination of multiple tasks could effectively improve the detection capability for AD and MCI. We thus aimed to achieve better performance by applying the same analytical procedure to the drawing processes of multiple tasks. This approach contrasts with previous approaches that aimed to automate conventional paper-based scoring methods [20, 21] or that introduced task-specific, in-depth analysis of the drawing process [18, 22].
We collected drawing data from 144 participants (27 AD, 65 MCI, and 52 cognitively normal, or CN) who performed five drawing tasks and were evaluated on seven cognitive measures. The five tasks were selected as representative, commonly used drawing tasks that are related to different cognitive domains in terms of their drawing outcomes. We then extracted drawing features that represented the motion- and pause-related characteristics of the drawing process in each task. By using this dataset, we investigated 1) whether the drawing features extracted from different tasks were associated with a participant’s diagnostic status and cognitive measures; and 2) whether a combination of the drawing features from the five tasks could improve the performance of classification models over that of models based on a single task.
MATERIALS AND METHODS
Participants
We recruited outpatients from the Department of Psychiatry, University of Tsukuba Hospital, the spouses of the patients, and other participants either through local recruiting agencies or community advertisements in Ibaraki, Japan. The inclusion criterion for the patients was a diagnosis of AD or MCI in accordance with the National Institute on Aging and Alzheimer’s Association (NIA-AA) core clinical criteria for probable AD dementia [23] or MCI [24]. The AD patients were in mild to moderate stages according to Benoit et al.’s criteria [25]. Patients were excluded if they had diagnoses of non-AD dementia (e.g., dementia with Lewy bodies, frontotemporal dementia, or vascular dementia) or other serious diseases or disabilities that would interfere with the collection of drawing data. The CN participants were age-matched to the patients and did not fulfill the NIA-AA criteria for MCI or dementia. Two psychiatrists (authors T. A. and K. N.), who are experts in dementia and were blind to the results of the drawing data analysis, examined each case in terms of the clinical record, as well as the cognitive and clinical measures, and they confirmed the diagnoses of AD, MCI, and CN.
The study was conducted under the approval of the Ethics Committee, University of Tsukuba Hospital (H29-065), and it followed the ethical code for research with humans as stated in the Declaration of Helsinki. All participants provided written informed consent to participate in the study. All examinations were conducted in Japanese.
Cognitive and clinical measures
The cognitive performance of all participants was measured using seven cognitive assessments that were conducted by neuropsychologists and assessed global cognition and five specific cognitive domains. Specifically, the following assessments were administered: the Mini-Mental State Examination (MMSE) for global cognition [26, 27], the Frontal Assessment Battery (FAB) for executive function [28], immediate and delayed recall of Logical Memory Story A from the Wechsler Memory Scale-Revised (LM-immediate and LM-delayed) for episodic memory [29, 30], part A of the TMT (TMT-A) for processing speed [10], part B of the TMT (TMT-B) for executive function and attention [10, 31], and the CDT primarily for executive function [11, 32]. In addition to measuring global cognition, we primarily targeted the measures for episodic memory and executive function as representative cognitive measures, because deficits in these domains are recognized as early signs of MCI [33] and are known to have serious impacts on the individual’s quality of life [34, 35]. These cognitive assessments were conducted because they are established measures of impairments in multiple cognitive domains related to AD and MCI, and we used the scores to investigate their associations with the drawing process characteristics of multiple drawing tasks.
As for clinical measures related to the diagnosis of AD and MCI, we used the Clinical Dementia Rating (CDR) [36], the Geriatric Depression Scale (GDS) [37], the Barthel Index of Activities of Daily Living (ADL) [38], and the Lawton Instrumental Activities of Daily Living (IADL) [39], along with the severity of medial temporal lobe atrophy. The latter measure was not included in the diagnostic criteria but was evaluated as a reference related to AD pathology [40, 41]. The severity was evaluated from structural magnetic resonance imaging scans at 1.5 T with T1-weighted images and a 3D gradient-echo sequence. It was expressed as a Z-score relative to cognitively healthy adults by using a stand-alone, voxel-based specific regional analysis system for AD [42].
Drawing tasks and features
During the cognitive assessments, the participants performed five tasks by using a digitizing tablet and pen (Wacom Cintiq Pro 16; sampling rate: 180 Hz; pen pressure levels: 8,192; pen inclination resolution: 1 degree; Fig. 1A). Specifically, the following tasks were administered in the following order (Fig. 1B): the sentence-writing and pentagon-copying items of the MMSE [43], the TMT-A and TMT-B [10], and the CDT [11]. These tasks were selected because they are representative drawing tasks that are commonly used in clinical practice for screening and diagnosis of AD and MCI, and because they enabled us to test our hypothesis that the drawing process characteristics in different drawing tasks could capture impairments in different cognitive domains. Note that the characteristics of the drawing outcome and those of the drawing process may be associated with different cognitive measures. For example, the conventional scoring of the CDT is known to capture executive function, but the particular features characterizing its drawing process may also capture an individual’s processing speed, language functions, or memory functions [19].
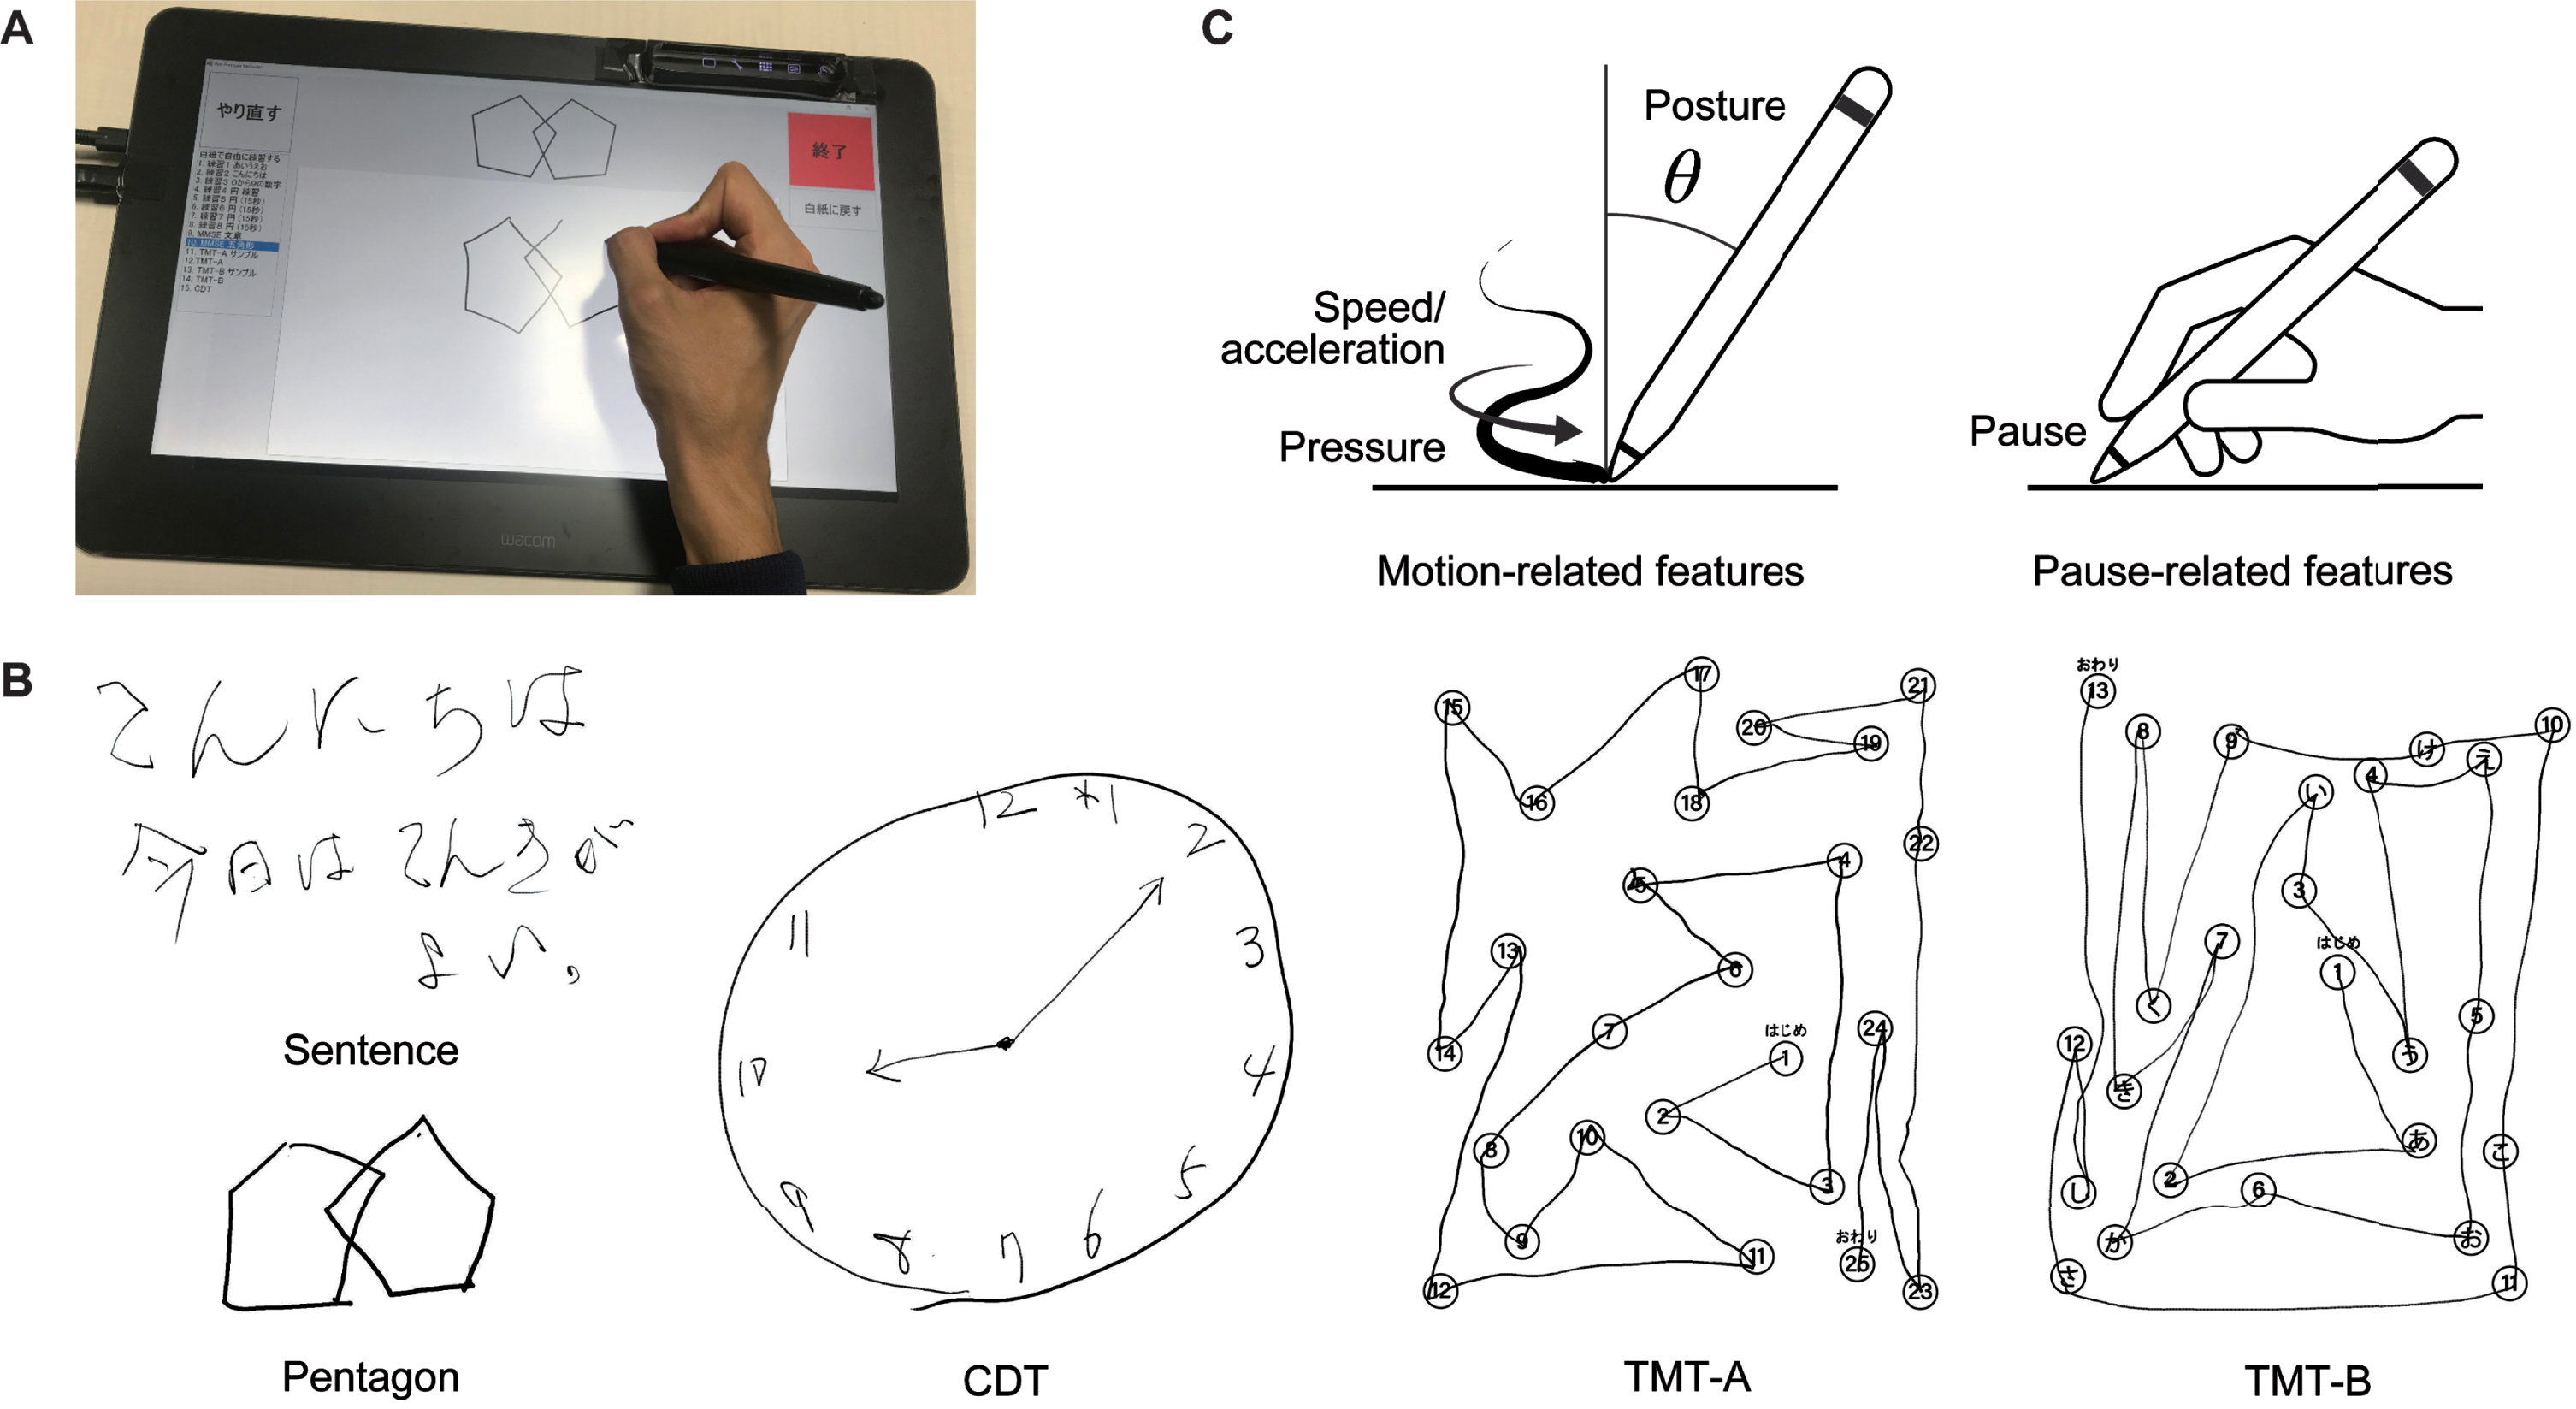
Illustration of the collection of drawing data from five drawing tasks and the extraction of drawing features. A) The digitizing tablet and pen used for data collection. B) Example outcomes of the five drawing tasks. C) Illustrations of the drawing feature categories: motion-related (speed/acceleration, pen pressure, and pen posture) and pause-related. Sentence, sentence-writing item of the Mini-Mental State Examination (MMSE); Pentagon, pentagon-copying item of the MMSE; TMT-A, Trail Making Test part A; TMT-B, Trail Making Test part B; CDT, Clock Drawing Test.
As for the specifics of the tasks, the sentence-writing task required writing a spontaneous sentence. The pentagon-copying task required copying a figure of intersecting pentagons. The TMT-A task required drawing lines to connect consecutive numbers distributed in space (i.e., 1-2-3 ... ). The TMT-B task required drawing lines to connect numbers and letters alternately in their respective sequences (i.e., 1-A-2-B-3-C ... ). Finally, the CDT task required drawing an analog clock face to show 10 minutes after 10 o’clock. All the assessments were conducted in the same room by using the same equipment to avoid the introduction of additional confounding factors.
We extracted 22 drawing features from each task (110 features in total), following previous studies on the use of drawing analysis with AD, MCI, and other neurological disorders [17, 44–48]. The features consisted of 17 motion-related features (six related to speed and acceleration, five related to pen pressure, and six related to pen posture) and five pause-related features. Figure 1C shows an overview of the feature categories, and Supplementary Table 1 gives a full description of the 22 features. The motion-related features for speed and acceleration included the mean, variability, and number of local extrema of the drawing speed and acceleration. The number of local extrema was used to characterize the non-smoothness of the drawing motion [49]. The motion-related features for pen pressure included the mean, variability, and number of local extrema (i.e., non-smoothness) of the pen pressure, as well as the median and variability of the speed of changes in the pen pressure. The motion-related features for pen posture included the variability of the pen’s horizontal and vertical inclinations (hereafter called “tilt-x” and “tilt-y”), as well as the median and variability of the speed of changes in tilt-x and tilt-y. The pause-related features included the mean and total pause duration between drawing motions (i.e., between strokes and within a stroke), the ratio of the pause and drawing durations, the total duration (i.e., the sum of the pause and drawing durations), and the number of drawing motions separated by pauses. The variability was generally calculated as the standard deviation, except that the coefficient of variation was used for the variability of the drawing speed and pen pressure. We adjusted the total pause duration, total duration, and number of local extrema by dividing each one by the total stroke length in order to make these features less sensitive to differences in the stroke lengths across tasks or individuals. Note that, to obtain a common set of drawing features for all five tasks, we did not include task-specific features such as linguistic features for the sentence-writing task [50, 51] or the number of errors for the TMT tasks [52, 53], even though previous studies often investigated these features.
Demographics and cognitive/clinical measures of the participants (n = 144)
The values are displayed as means (standard deviations in parentheses), except for sex, which is displayed as a number (percentage in parentheses). The bold values highlight statistically significant differences (chi-square test, p < 0.05, for sex; one-way ANOVA, p < 0.05, for the other data). Significant differences between individual diagnostic groups (chi-square test, p < 0.05, for sex; Tukey-Kramer test, p < 0.05, for the other data) are marked with C, M, or A (C: different from CN; M: different from MCI; A: different from AD). Logical Memory-immediate and Logical Memory-delayed refer to immediate and delayed recall of Logical Memory Story A from the Wechsler Memory Scale-Revised. *The total score ranges are as follows: Mini-Mental State Examination, 0 to 30; Frontal Assessment Battery, 0 to 18; Logical Memory (immediate and delayed), 0 to 25; Trail Making Test (parts A and B), 0 to 300; Clock Drawing Test, 0 to 7; Geriatric Depression Scale, 0 to 15; Activities of Daily Living, 0 to 100; Instrumental Activities of Daily Living, 0 to 8. CN, cognitively normal; MCI, mild cognitive impairment; AD, Alzheimer’s disease; ANOVA, analysis of variance.
Statistical analysis
To explore how the drawing features extracted from different tasks were associated with the participants’ diagnostic statuses and cognitive measures, we performed a statistical investigation from two different perspectives. First, we tested whether each drawing feature from each drawing task could statistically discriminate the three diagnostic categories of AD, MCI, and CN. The purpose here was to evaluate the discriminative power of the individual drawing features. Second, we evaluated the statistical associations between the set of drawing features extracted from each drawing task and the individual cognitive measures. Here, the purpose was to obtain a comprehensive view of how the different drawing tasks could capture impairments in different cognitive domains through the features characterizing the drawing process.
For between-group comparisons of the drawing features, as well as the demographics, cognitive measures, and clinical measures, we used one-way analyses of variance (ANOVAs) for continuous data and chi-square tests for categorical data. For multiple testing of the 110 drawing features, the Benjamini-Hochberg correction was applied. Post-hoc pairwise comparisons between the diagnostic groups were performed by using Tukey-Kramer tests for continuous data and chi-square tests for categorical data. To assess the effect size of each feature, we calculated the generalized eta-squared (η2), for which the values 0.01, 0.06, and 0.14 are considered to indicate small, medium, and large effects, respectively [54]. All the statistical analyses were performed using R (version 4.0.5) with an alpha value of 0.05 (p < 0.05, two-sided).
To investigate the associations between the drawing features and cognitive measures, we used multiple linear regression analysis and controlled for age, sex, and years of education as covariates. The dependent variables were the MMSE, FAB, LM-immediate, LM-delayed, TMT-A, TMT-B, and CDT scores. We included MMSE in the analysis, even though it represents global cognition rather than a specific aspect of cognitive impairments, because it is the most common measure for screening AD [55], and insights on its associations with drawing tasks could thus help improve the interpretability of drawing analysis results. As for the use of drawing features as independent variables, we first reduced the number of variables to avoid overfitting. To achieve this reduction, we applied principal component analysis on the 22 features for each task and selected the top components such that the cumulative variance exceeded 50%. We then applied varimax rotation with Kaiser normalization to increase the orthogonality among the resultant components and thus obtain a simpler structure with greater interpretability. Finally, we built multiple linear regression models to predict each cognitive measure via the selected principal components of the drawing features from the five tasks. To reduce the model complexity, we applied a backward stepwise variable selection procedure based on the Akaike information criterion [56].
Machine learning analysis
To investigate whether a combination of the drawing features from all five tasks could improve the classification accuracy between the diagnostic groups, we built classification models that used multiple machine learning algorithms with automatic feature selection. The models included a support vector machine (SVM) with a radial basis function kernel, k-nearest neighbors, and a random forest. The model training and evaluation were performed through tenfold cross-validation with 20 iterations. To reduce the number of features and thus avoid overfitting in classification, we only used drawing features that showed statistically significant differences between the diagnostic groups (one-way ANOVA, p < 0.05). The variables for demographics, cognitive measures, and clinical measures were not included in the classification models. For missing values, we applied multivariate imputation by chained equations [57]. For feature selection, we used a sequential forward feature selection algorithm. The following parameters were tuned through cross-validation: for the SVM, the regularization parameter, kernel coefficient, and class weights; for k-nearest neighbors, the number of neighbors; and for the random forest, the maximum depth of the tree and the class weight. All models were implemented using the Python package scikit-learn (version 0.23.2).
For the model performance, we evaluated the area under the receiver operating characteristic curve (AUC), the sensitivity, the specificity, and the F1 score, in addition to the accuracy, because the accuracy alone does not sufficiently reflect the performance for imbalanced datasets [58]. The three-class AUC was computed as defined by Hand and Till [59]. To assess the importance of each feature, we also calculated SHapley Additive exPlanations (SHAP) values [60] based on their impact on the model output, by using the Kernel SHAP method in the Python package SHAP (version 0.39.0). We defined important features as those with the highest mean absolute SHAP values—i.e., those with the highest impacts on the model output, such that the cumulative impact of the features exceeded 50% of the total impact on the model output.
RESULTS
Sample characteristics
The participants’ characteristics are summarized in Table 1. There was a total of 144 participants (53.5% female) with a mean age of 73.9 (SD = 5.2). They comprised three diagnostic groups of 27 AD patients, 65 MCI patients, and 52 CN participants. The AD and MCI patients were diagnosed according to the NIA-AA core clinical criteria for probable AD dementia [23] or MCI [24]. Of the MCI patients, 30 met the criteria for amnestic MCI [61]. Regarding the demographics, the age did not show any statistically significant differences among the groups (F(2,141) = 3.05, p = 0.051). The proportion of female participants was lower for MCI than for CN (χ2(2) = 7.05, p = 0.029; χ2(1) = 5.66, p = 0.017 for MCI versus CN). The years of education were lower for AD than for MCI (F(2,141) = 4.28, p = 0.016; t(141) = 2.86, p = 0.013 for AD versus MCI).
All seven cognitive measures were different among the diagnostic groups (one-way ANOVA, all p < 0.001; Table 1). The clinical measures showed statistically significant differences among all the diagnostic groups for the CDR (F(2,141) = 347, p < 0.001) and the severity of medial temporal lobe atrophy (F(2,141) = 35.9, p < 0.001). In contrast, the GDS did not show any statistically significant differences among the groups (F(2,141) = 0.620, p = 0.539). As for the measures related to activities of daily living, both the ADL and the IADL showed statistically significant differences among the groups (F(2,141) = 4.68, p = 0.011 for ADL; F(2,141) = 38.04, p < 0.001 for IADL), except that there were no statistically significant differences between MCI and CN (t(141) = 0.55, p = 0.848 for ADL; t(141) = 2.22, p = 0.072 for IADL).
A total of 110 drawing features (22 for each task) were extracted for 143 of the 144 participants. The features comprised 85 motion-related features (speed/acceleration: 30; pen pressure: 25; pen posture: 30) and 25 pause-related features. For one AD patient, one motion-related feature could not be calculated for the TMT-B task because of an insufficient number of drawing motions.
Associations of drawing features with clinical diagnosis and cognitive measures
We first investigated whether each of the five tasks showed statistically discernible differences in the drawing features among the diagnostic groups. One-way ANOVAs revealed that 28 of the 110 features showed statistically significant differences among the AD, MCI, and CN groups (Benjamini-Hochberg adjusted p < 0.05; Table 2). The 28 features included at least one feature from each individual task (sentence-writing: 1; pentagon-copying: 1; TMT-A: 9; TMT-B: 13; CDT: 4). All of the 28 features showed at least a medium effect size (η2 > 0.06). Post-hoc pairwise comparisons revealed the following patterns of statistically significant differences (Tukey-Kramer adjusted p < 0.05): for AD versus CN, each individual task derived at least one feature with statistically significant differences; for MCI versus CN, only the TMT-B task derived statistically significant features; and for AD versus MCI, the TMT-A, TMT-B, and CDT tasks derived statistically significant features.
Drawing features with statistically significant differences between the diagnostic groups (one-way ANOVA, Benjamini-Hochberg adjusted p < 0.05), ordered by the effect size for each task. All features had a medium-to-large effect size (η2 > 0.06)
The values were compared by using one-way ANOVAs with Benjamini-Hochberg correction for multiple testing. Significant differences between individual diagnostic groups (Tukey-Kramer test, p < 0.05) are marked with C, M, or A (C: different from CN; M: different from MCI; A: different from AD). CN, cognitively normal; MCI, mild cognitive impairment; AD, Alzheimer’s disease; Sentence, sentence-writing item of the Mini-Mental State Examination (MMSE); Pentagon, pentagon-copying item of the MMSE; TMT-A, Trail Making Test part A; TMT-B, Trail Making Test part B; CDT, Clock Drawing Test; CV, coefficient of variation; SD, standard deviation.
As for the overall trends of the 28 statistically significant features, 27 (96.4%) exhibited larger changes from CN for AD than for MCI, thus indicating gradual changes in the features from CN to MCI and then to AD (see Fig. 2A for a graphical summary of example features and Table 2 for the full list). In particular, the following changes were consistently observed in the majority of the five tasks: a greater pressure variability in the pentagon-copying, TMT-A, TMT-B, and CDT tasks; a longer mean pause duration in the sentence-writing, TMT-A, and TMT-B tasks; and a longer adjusted total pause duration, greater pause/drawing duration ratio, and longer adjusted total duration in the TMT-A, TMT-B, and CDT tasks.
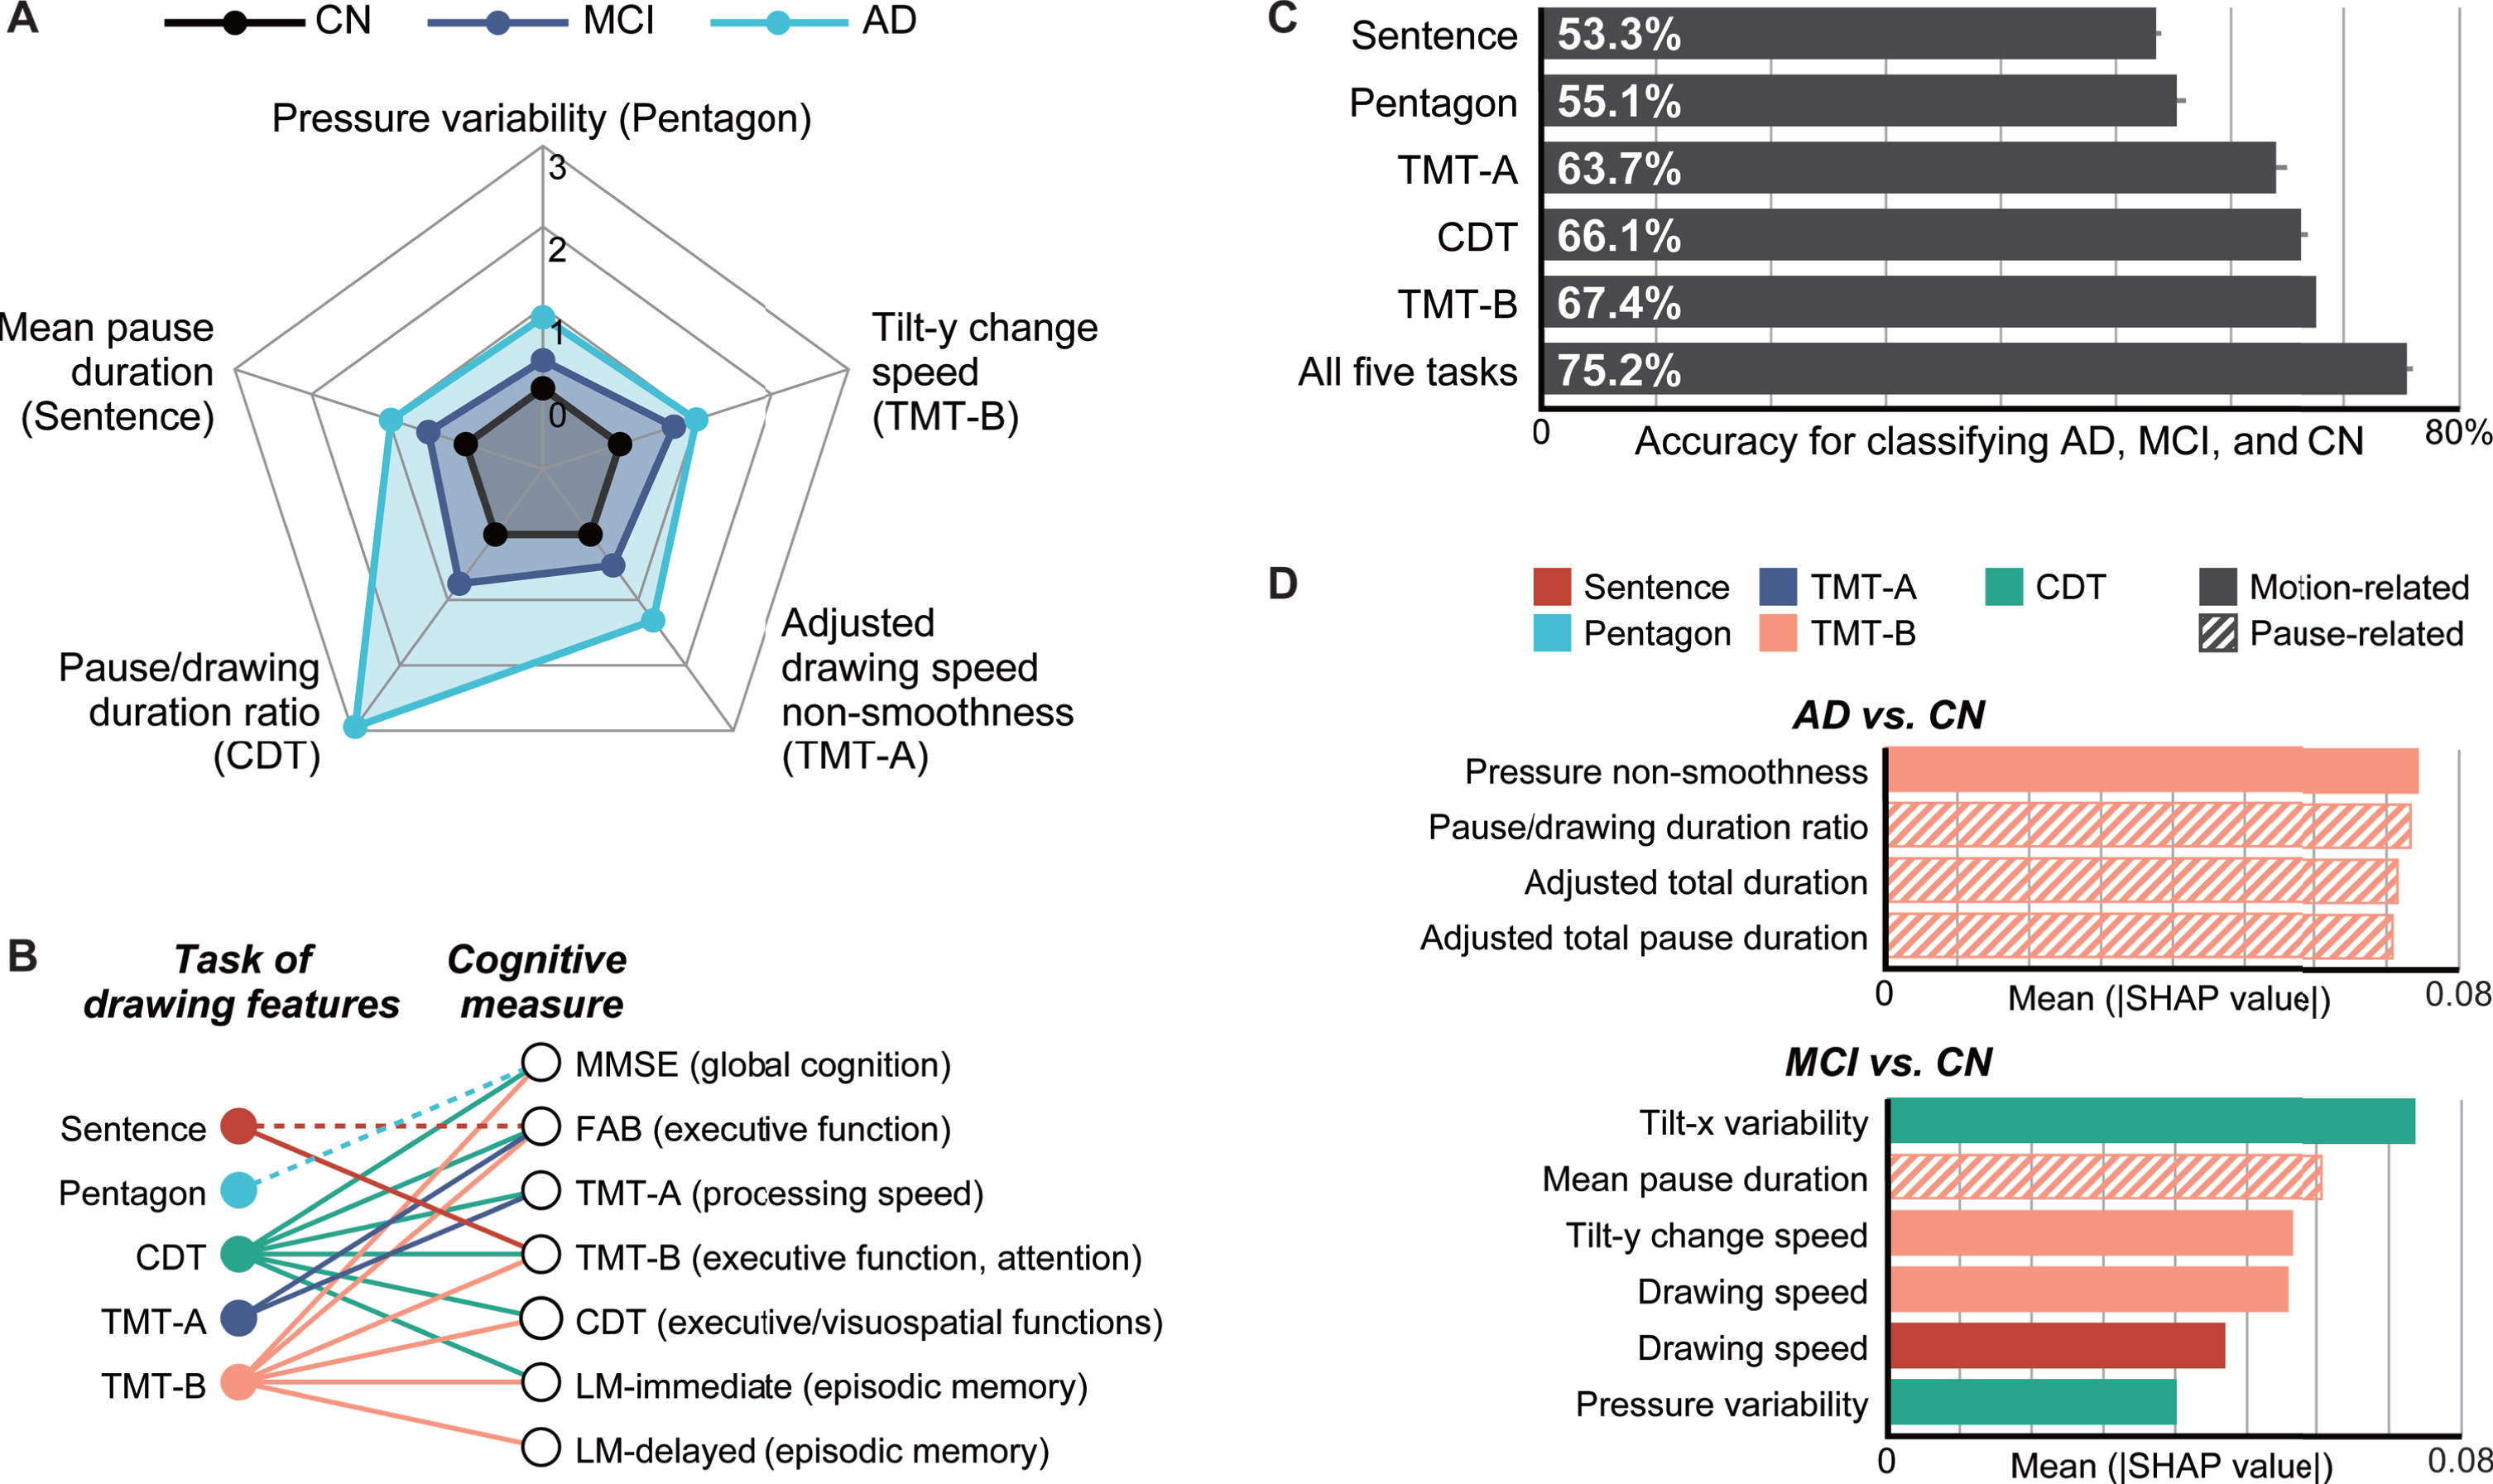
Summary of the analysis results. A) Radar plots illustrating the differences in the representative drawing features from each task for the cognitively normal (CN), mild cognitive impairment (MCI), and Alzheimer’s disease (AD) groups. The central black lines represent CN (control), and the other lines represent MCI and AD and indicate Z-scores based on the control means and standard deviations. B) Associations between the task of drawing features and cognitive measures, which were obtained by multiple linear regression analyses. The dotted lines represent statistically significant associations between either of the top two principal components of the drawing features from a task and a cognitive measure (multiple linear regression, p < 0.05; Supplementary Table 3). The solid lines represent associations that remained significant after controlling for the age, sex, and years of education as covariates (Supplementary Table 4). C) Comparison of the model accuracies (single-task models versus five-task model) with 95% confidence intervals, as assessed through 20 iterations of tenfold cross-validation and ordered by accuracy. D) SHapley Additive exPlanations (SHAP) values of important features in the classification models for AD versus CN (top) and MCI versus CN (bottom), where these features cumulatively accounted for 50% of the total impact on the model output. Sentence, sentence-writing item of the Mini-Mental State Examination (MMSE); Pentagon, pentagon-copying item of the MMSE; TMT-A, Trail Making Test part A; TMT-B, Trail Making Test part B; CDT, Clock Drawing Test.
Next, we performed principal component and regression analyses to investigate whether a common set of drawing features extracted from different tasks could be associated with impairments in different cognitive domains. First, principal component analyses with varimax rotation revealed that, regardless of the task, the first two principal components explained 50% of the total variance of the drawing features extracted from the individual task. Specifically, the first two components comprised 59.7%, 54.5%, 58.5%, 54.5%, and 56.5% of the total variance for the sentence-writing, pentagon-copying, TMT-A, TMT-B, and CDT tasks, respectively. In terms of factor loadings, for all five tasks, the first principal component (PC1) mainly represented motion-related features, whereas the second principal component (PC2) mainly represented pause-related features (Supplementary Table 2).
By using PC1 and PC2 for each task as independent variables and one of the seven cognitive measures as a dependent variable, multiple linear regression analyses revealed the following statistically significant associations between the drawing tasks and the cognitive measures (p < 0.05; see Fig. 2B for a graphical summary and Supplementary Table 3 for the full results). The sentence-writing task was associated with the FAB and TMT-B scores via at least one of the principal components. The pentagon-copying task was associated with the MMSE score. The TMT-A task was associated with the FAB and TMT-A scores. The TMT-B task was associated with all the cognitive measures except TMT-A. The CDT task was associated with all cognitive measures except for LM-delayed. The overall results were unchanged when the age, sex, and years of education were included as covariates in the model, except that the associations of the sentence-writing task with the FAB score and of the pentagon-drawing task with the MMSE score lost significance (p > 0.05; see Fig. 2B for a graphical summary and Supplementary Table 4 for the full results). The resultant multiple linear regression models included four to eight independent variables as a result of the stepwise feature selection procedure, which met the requirement for a power analysis (≤16) to detect an effect size of Cohen’s f2 = 0.15 with a power of 0.8 at α= 0.05.
Model performance for classifying Alzheimer’s disease (AD), mild cognitive impairment (MCI), and cognitively normal (CN). The values were obtained from 20 iterations of tenfold cross-validation
Sentence, sentence-writing item of the Mini-Mental State Examination (MMSE); Pentagon, pentagon-copying item of the MMSE; TMT-A, Trail Making Test part A; TMT-B, Trail Making Test part B; CDT, Clock Drawing Test; CI, confidence interval; AUC, area under the receiver operating characteristic curve.
Model performance for combination of multiple drawing tasks
Overall, the model combining the features from all five tasks outperformed all of the models based on features from a single task. For three-class classification of AD, MCI, and CN, the five-task model achieved the best performance with an accuracy of 75.2% (AUC: 0.899). This accuracy (AUC) was 7.8% (0.077) higher than the best single-task performance for the TMT-B task (Welch’s t-test, both p < 0.001; see Fig. 2C for a graphical summary and Table 3 for the details). The best model was based on the SVM, for which the automatic feature selection procedure included at least one feature from each of the five tasks.
For discriminating AD from CN, the five-task model achieved an accuracy of 96.8% (AUC: 0.971; sensitivity: 98.0%; specificity: 96.2%; F1 score: 95.4%). This result was 2.2% higher than the best single-task accuracy for the TMT-B task (Table 4). In this case, the model included a total of 13 features as a result of the feature selection. For discriminating MCI from CN, the five-task model achieved an accuracy of 82.8% (AUC: 0.822; sensitivity: 87.9%; specificity: 76.4%; F1 score: 85.0%). This result was 7.6% higher than the best single-task accuracy for the TMT-B task (Table 5). The model included a total of 19 features as a result of the feature selection. We also explored potential reasons for misclassification. To this end, we focused on the misclassification of CN as MCI, considering the relatively low specificity in discriminating MCI from CN. Among the 52 CN participants, 39 were correctly classified as CN and 12 were misclassified as MCI (1 as AD) in the majority of iterations. The main difference in cognitive measures between them was observed for the TMT scores. Specifically, the correctly-classified CN participants showed better performance in the TMT-A and TMT-B than the MCI patients (Welch’s t-test, both p < 0.001), while the CN participants who were misclassified as MCI did not statistically outperform the MCI patients (Welch’s t-test, p = 0.255 for TMT-A and p = 0.068 for TMT-B). Therefore, one of the reasons for misclassification may exist in the relatively lower performance in cognitive functions assessed by drawing tests in the CN participants.
Model performance for classifying Alzheimer’s disease (AD) and cognitively normal (CN). The values were obtained from 20 iterations of tenfold cross-validation
Sentence, sentence-writing item of the Mini-Mental State Examination (MMSE); Pentagon, pentagon-copying item of the MMSE; TMT-A, Trail Making Test part A; TMT-B, Trail Making Test part B; CDT, Clock Drawing Test; CI, confidence interval; AUC, area under the receiver operating characteristic curve.
Model performance for classifying mild cognitive impairment (MCI) and cognitively normal (CN). The values were obtained from 20 iterations of tenfold cross-validation
Sentence, sentence-writing item of the Mini-Mental State Examination (MMSE); Pentagon, pentagon-copying item of the MMSE; TMT-A, Trail Making Test part A; TMT-B, Trail Making Test part B; CDT, Clock Drawing Test; CI, confidence interval; AUC, area under the receiver operating characteristic curve.
To identify the important features driving the classification, we investigated the top features that cumulatively accounted for 50% of the total impact on the model output according to the SHAP values [60]. For the classification of AD and CN, the important features comprised four features extracted only from the TMT-B task, which included three pause-related features and one motion-related feature for pen pressure (see Fig. 2D for a graphical summary and Supplementary Table 5 for the details). For the classification of MCI and CN, the important features comprised six features extracted from the sentence-writing, TMT-B, and CDT tasks, which included one pause-related and five motion-related features (speed/acceleration: 2; pen pressure: 1; pen posture: 2; see Fig. 2D for a graphical summary and Supplementary Table 6 for the details).
DISCUSSION
We investigated the drawing process in five drawing tasks by using data collected from 144 participants in the AD, MCI, and CN groups, and we obtained two main findings as follows. First, the features characterizing the drawing process differed among the diagnostic groups, and those extracted from different tasks could capture impairments in different cognitive domains. Specifically, the statistical analysis revealed that 1) at least one feature from each task showed a statistical difference among the AD, MCI, and CN groups with a medium-to-large effect size; and that 2) the features from different tasks were statistically associated with different sets of cognitive measures. The second main finding was that the combination of drawing features from multiple drawing tasks improved the model performance in classifying the diagnostic groups. Specifically, the models using all five tasks consistently achieved higher accuracies than any of the models that used a single task: this was the case for both three-class classification of AD, MCI, and CN and binary classification to discriminate AD or MCI from CN.
Our statistical analysis found that many of the drawing features showed gradual changes among the diagnostic groups. Over 96% of the statistically significant features exhibited gradual changes from CN to MCI and then to AD, which indicates that changes in these features may reflect specific aspects of cognitive impairments and can be considered as potential markers for the progression of AD. Our analysis also identified several individual drawing features that showed gradual, consistent changes across multiple drawing tasks in patients with AD or MCI; these changes included longer pauses, lower smoothness in speed and acceleration, and greater pressure variability. Although these trends have been reported for specific drawing tasks [15, 62], to our knowledge this is the first study to demonstrate consistent trends across multiple drawing tasks performed by the same individuals. It is especially notable that the pressure variability consistently increased in the AD group for four of the five drawing tasks, with a medium-to-large effect size. Although the pressure variability during drawing tasks is known to increase for patients with Parkinson’s disease [63] and Huntington’s disease [64]—i.e., neurodegenerative diseases that typically involve motor symptoms—it has rarely been examined in the context of AD or MCI, except for a recent study on the CDT task by Davoudi et al. [22]. On the other hand, recent studies on other types of behaviors in AD patients, such as the patient’s gait [65–67] and finger tapping [68], have suggested that variability in motor control may be a useful marker for neuropathological changes. Because changes in drawing behavior are another typical example of motor control deterioration in AD [9], our findings imply that neuropathological changes in AD can be assessed by measuring the pressure variability during drawing tests. Confirmation of this implication will require a further study with validated neuropathological biomarkers. In our results, the discriminative power for some drawing features varied across tasks, which suggests that it is sensitive to the task characteristics. For example, the drawing speed variability was statistically discriminative only for the TMT tasks. Meanwhile, the gradual, task-consistent changes observed for many features suggest that we could obtain more reliable indices for an individual’s graphomotor characteristics by aggregating the same types of features from multiple tasks. In turn, this could enable accurate detection of AD. The development and validation of such indices will be another area of future research.
The results of the regression analysis showed that the common sets of drawing features extracted from different tasks were associated with different sets of cognitive measures. This indicates that the characteristics of the drawing process for different tasks could capture impairments in different cognitive domains. Our results align with the results of previous studies on a single drawing task, which reported statistical associations between cognitive measures and drawing features [18, 19]; moreover, our results extend those findings by showing inter-task differences in these associations through multiple regression models with multiple drawing tasks. In our study, most of the cognitive measures were statistically associated with drawing features that were extracted from two or more drawing tasks. This indicates that a combination of drawing tasks may improve models for estimating cognitive measures. Such estimation models could enable better interpretation of the output of drawing-based screening tools for AD by providing additional information about cognitive impairments in specific domains.
As mentioned above, the classification performance of the five-task models was consistently better than that of the single-task models, for both three-class and binary classification. In particular, for binary classification, the performance improvement due to the combination of multiple tasks was larger for detecting MCI than for detecting AD. In addition, the results of automatic feature selection and the analysis of feature importance showed that a model to discriminate MCI and CN required features from more tasks than a model to discriminate AD and CN. These results suggest that a combination of multiple drawing tasks could have more benefit for detecting MCI than for detecting AD. This approach might be facilitated by using multiple drawing tasks to capture more multifaceted information about cognitive impairments. In terms of the important features identified by the SHAP analysis, the classification of MCI and CN was mainly driven by motion-related features, in contrast to the classification of AD and CN. This finding could align with the notion in the literature that lower levels of motor performance may predict the development of AD at its earlier stages, because both motor and cognitive decline may share a common causation of AD neuropathology, and a loss of motor function can precede cognitive impairments by several years [69].
Regarding drawing-based machine learning models for AD detection, many studies have investigated automated analysis on a particular task such as the CDT and reported performance comparable to that of conventional paper-based tests in terms of the sensitivity and specificity [70]. Furthermore, there are at least two potential approaches to improve the performance by better capturing impairments in multiple cognitive domains: 1) extraction of task-specific features to capture multiple domains from one task; and 2) application of multiple tasks to capture multiple domains via a common set of features. The first approach has been well studied, and various types of task-specific features have been proposed, such as the time inside/outside circles in the TMT [18] and clock-face-related features in the CDT [22]. As for the second approach, in contrast, only a few studies have tested multi-task models [71]; moreover, to our knowledge, none of them considered effective ways to combine tasks with clinical relevance. Our analysis thus provides initial evidence that the drawing characteristics in multiple drawing tasks can capture different, complementary aspects of cognitive impairments to enable superior detection of AD and MCI, as compared to the use of a single task in isolation.
Our results also support the viability of automated screening for AD in non-specialist settings. Previous studies have proposed automated screening tools [72], including both digital versions of conventional tests [15, 73] and novel digital tests [74–76], and acceptance of those tools has been reported [44]. Our findings may improve the reliability of those tools by facilitating improved accuracy and a greater potential interpretability. Our multi-task approach may also have advantages in terms of scalability: our results suggest that a common set of drawing features, i.e., the same drawing analysis procedure, can capture different aspects of cognitive impairments by introducing different tasks. In addition, our results have implications for the operability of computer-aided AD screening and diagnosis in clinical practice. First, drawing data can easily and robustly be collected with a commercial-grade tablet device. Second, our findings can easily be incorporated in clinical practice, because all five tasks in this study are already widely accepted in practice for AD screening and diagnosis. As previous studies showed strong agreement between the results of digital and standard paper-based versions of drawing tests [18, 77], clinicians can benefit from our findings without significantly altering their current routines. In practice, there may exist a trade-off between classification performance and operational burden of performing multiple tasks. The best combination of drawing tasks should be explored further in future studies. Furthermore, other neurodegenerative diseases such as Parkinson’s disease [78] and Huntington’s disease [79] also involve cognitive impairments in multiple domains, and the usefulness of drawing analysis has been reported for detecting those diseases, too [63, 64]. Thus, our approach of capturing multifaceted cognitive impairments by analyzing drawing data also holds promise for improving the screening and diagnosis of those diseases.
The strengths of this study include a unique dataset consisting of digitized drawing data from multiple tasks and validated measures for multiple cognitive domains. Together, these data and measures enabled cross-task and cross-domain analysis with a view toward automated drawing-based screening of AD and MCI. However, the study has several limitations. First, the drawing data in our dataset were collected in a controlled setting with professional neuropsychologists. Our findings have yet to be confirmed in situ for the development of realistic applications that work even in non-specialist settings. Second, the sample size was small compared to the largest studies on a single task [80, 81], even though we kept the number of variables in each of the final models to a reasonable level. This might affect the generalizability of our findings, which will require further confirmation with larger samples. Third, the diagnostic labels in our dataset were not based on validated biomarkers for AD pathologies, such as cerebrospinal fluid or positron-emission tomography markers [82]. Fourth, given the participants’ diverse backgrounds due to the use of multiple recruitment channels, there may have been residual confounding factors besides those included in the analysis. For example, although the GDS did not statistically differ among the groups, differences in life circumstances might influence stress or affective states, which could impact on cognitive performance [83, 84]. A future study with control of these factors is required to confirm our findings. Fifth, the order of tasks was not counterbalanced during data collection. Finally, to simplify the multi-task procedure, we did not examine variations in each drawing task. For example, the CDT was only conducted under the command condition. In contrast, previous studies often used it under both the command and copy conditions, and they reported that the drawing features under each condition had different associations with an individual’s AD diagnosis or cognitive measures [19, 22].
In conclusion, this study provides initial evidence that the characteristics of the drawing process in different drawing tasks represented by a common set of drawing features are associated with different, complementary aspects of cognitive impairments. Moreover, these features could improve the performance in detecting AD and MCI. Accordingly, these results demonstrate how multiple digital drawing tasks could facilitate automated, accurate AD screening in the earlier stages.