
Abstract
Background:
Evidence suggests that the concordance between amyloid-PET and cerebrospinal fluid (CSF) amyloid-β (Aβ) increases when the CSF Aβ1–42/Aβ1–40 ratio is used as compared to CSF Aβ1–42 levels alone.
Objective:
In order to test this hypothesis, we set up a prospective longitudinal study comparing the concordance between different amyloid biomarkers for Alzheimer’s disease (AD) in a clinical setting.
Methods:
Seventy-eight subjects (AD dementia (n = 17), mild cognitive impairment (MCI, n = 48), and cognitively healthy controls (n = 13)) underwent a [18F]Florbetapir ([18F]AV45) PET scan, [18F]FDG PET scan, MRI scan, and an extensive neuropsychological examination. In a large subset (n = 67), a lumbar puncture was performed and AD biomarkers were analyzed (Aβ1–42, Aβ1–40, T-tau, P-tau181).
Results:
We detected an increased concordance in the visual and quantitative (standardized uptake value ratio (SUVR) and total volume of distribution (VT)) [18F]AV45 PET measures when the CSF Aβ1–42/Aβ1–40 was applied compared to Aβ1–42 alone. CSF biomarkers were stronger associated to [18F]AV45 PET for SUVR values when considering the total brain white matter as reference region instead of cerebellar grey matter
Conclusions:
The concordance between CSF Aβ and [18F]AV45 PET increases when the CSF Aβ1–42/Aβ1–40 ratio is applied. This finding is of most importance for the biomarker-based diagnosis of AD as well as for selection of subjects for clinical trials with potential disease-modifying therapies for AD.
INTRODUCTION
One of the core neuropathological hallmarks of Alzheimer’s disease (AD) is the parenchymal plaques composed of amyloid-β (Aβ), produced through the sequential proteolytic cleavage of the amyloid-β protein precursor by β- and γ- secretases [1, 2]. Aβ is thought to initiate and propagate disease pathology, including deposition of Aβ into neuritic plaques, neurofibrillary tangle formation, neuronal cell loss, and synaptic degeneration, which begins decades before symptom onset [3, 4].
The process of Aβ proteolytic cleavage generates the release of several Aβ isoforms [5], amongst which Aβ of 42 amino acids (Aβ1–42) has the highest propensity to aggregate into amyloid plaques. To date, cerebrospinal fluid (CSF) Aβ1–42, together with total tau protein (T-tau) and tau phosphorylated at threonine 181 (P-tau181), are integrated in the revised research criteria of AD [6 –10]. Concentrations of CSF Aβ1–42 are decreased in AD, whereas tau values increase in concentration. The inverse correlation between CSF Aβ1–42 and amyloid plaques is believed to be due to accumulation of Aβ into plaques [11]. Besides detecting Aβ in CSF, the amyloid burden may be directly visualized using amyloid positron emission tomography (PET) imaging. Visual assessment of amyloid-PET correlates closely with Aβ deposition at autopsy [12]. Total volume of distribution (VT) estimated from dynamic imaging with arterial blood sampling is the gold standard for quantification of fibrillar Aβ load [13]. However, due to practical considerations including invasive longitudinal scanning and an extensive pharmacokinetic modeling procedure, most studies have used a simplified quantification method, the standardized uptake value ratio (SUVR). This semi-quantitative measure is calculated as the ratio of radioactivity concentration in the target and reference regions, and is derived from a static scan. The entire cerebellum and cerebellar grey matter are widely used as reference regions as they are devoid of amyloid plaques in sporadic AD [14, 15].
Although both Aβ markers detect the same neuropathological characteristic, a proportion of subjects within the AD spectrum show discordance between CSF Aβ1–42 and amyloid-PET status, with either abnormal CSF Aβ1–42 and normal amyloid-PET or vice versa [16 –31]. As hypothesized by several groups, the abnormal amyloid metabolism in AD can be detected by CSF biomarkers at a very early stage, before PET imaging becomes abnormal [32], which should be in line with more individuals with discordant positive CSF (CSF+/PET-) compared to isolated discordant negative CSF (CSF-/PET+) [16 , 31]. However, CSF-/PET+ has also been reported in both MCI and AD patients [17 , 33]. To increase concordance between amyloid markers, it has been suggested to apply shorter isoforms of Aβ (Aβ1–40 and Aβ1–38) in order to calculate Aβ1–42/Aβ1–40 and Aβ1–42/Aβ1–38 ratios [25 , 31]. These ratios may indeed correct for inter-individual variability in the overall Aβ production, since Aβ1–40 and Aβ1–38 are expected to increase due to higher overall Aβ production, but not decrease (in contrast to Aβ1–42) as a result of AD pathology [34 –36]. Therefore, we set up a clinical study with a ‘combined assessment of amyloid-PET and CSF biomarkers as early diagnostic tools for AD’ (COMBAD) to investigate, as a primary aim, whether the concordance between amyloid-PET and CSF amyloid markers improves when the CSF Aβ1–42/Aβ1–40 ratio is used instead of CSF Aβ1–42 alone. A secondary aim consists of the quantitation of amyloid burden by comparing different reference regions (cerebellar grey matter and whole subcortical white matter). For both aims, the concordance between CSF and all available amyloid-PET measurements, namely visual, SUVR, and VT, were investigated.
MATERIALS AND METHODS
Study design
The COMBAD study consists of one baseline and two follow-up investigations for all subjects. As follow-up of subjects included is still ongoing, baseline results are reported only.
At baseline, all subjects underwent an extensive neuropsychological examination, collection of CSF by lumbar puncture (LP), brain magnetic resonance imaging (MRI) scan, a [18F]Fludeoxyglucose ([18F]FDG) PET scan, and a 60-min dynamic or 10-min static [18F]Florbetapir ([18F]AV45) PET scan. To validate the [18F]AV45 scans, the firstly included subjects (including controls, MCI, and AD dementia patients) were scanned dynamically [37]. Hereafter, the dynamic [18F]AV45 PET scans were replaced by static [18F]AV45 scans.
All examinations were/will be repeated in patients after one and two years. Controls were/will be followed-up annually for two years including the extensive neuropsychological test battery and a brain MRI scan.
In addition, patients were/will be clinically followed-up by the neurologist every six months.
This study was approved by the ethics committees of UAntwerp/Antwerp University Hospital (UZA) and Hospital Network Antwerp (ZNA), Antwerp, Belgium. The COMBAD study combines the assessment of amyloid-PET and CSF biomarkers as early diagnostic tools for AD with as main goal to improve diagnostic accuracy of early Aβ detection. In this, the quantification of SUVR [18F]AV45 measures is questioned as static SUVR could be incorrect when a scan is acquired in a non-equilibrium state [38] and differences in tracer delivery exist between the target region and the reference region in AD [39]. Our hypothesis is that vascular disturbances by (amongst others) amyloidosis, leading to regional heterogeneous flow/perfusion by amyloidosis are underestimated and accounts for variability in SUVR.
Study population
For this ongoing prospective longitudinal study, subjects with clinical suspicion of AD (both MCI and AD dementia) were recruited through the Memory Clinic of ZNA Middelheim and Hoge Beuken. Cognitively healthy elderly consisted of volunteers, mainly spouses of patients who visited the memory clinic.
Clinical diagnostic criteria
All subjects with cognitive decline as well as cognitively healthy controls were diagnosed by a panel of three MDs with expertise in neurodegenerative brain diseases and dementia (SE, SVM, TVDB). In order to keep the panel blinded for clinical diagnoses that were mentioned in the clinical files of the included subjects, the panel based their consensus diagnoses on standardized presentations (by EN) of the information gathered during the baseline clinical diagnostic work-up at enrollment in the study and was not biomarker-based.
The panel made a consensus clinical diagnosis of dementia due to AD by applying NIA-AA criteria [7, 10]. A consensus diagnosis of MCI due to AD was made by the panel based on the NIA-AA criteria [6 , 8–10], i.e., (1) cognitive complaint, preferably corroborated by an informant; (2) objective cognitive impairment, quantified as performance of more than 1.5 SD below the appropriate mean on the neuropsychological subtests; (3) largely normal general cognitive functioning; (4) essentially intact activities of daily living (basic and instrumental activities of daily living were determined by a clinical interview with the patient and an informant); and (5) not demented.
The inclusion criteria for cognitively healthy elderly were: (1) no neurological or psychiatric antecedents; (2) no organic disease involving the central nervous system following extensive clinical examination; and (3) no cognitive complaint or decline.
Based on the consensus clinical diagnoses, subjects were divided into three groups, namely cognitively healthy controls, MCI, and AD dementia patients.
Neuropsychological examination
The test battery included the confusion assessment method (CAM; delirium is considered by CAM if acute onset or fluctuating course is present in combination with either inattention or disorganized thinking and altered level of consciousness) [40]; Montreal cognitive assessment (score below 26/30 is indicative for cognitive decline) [41]; cognitive part of the Cambridge Examination for mental disorders of the elderly [42] (namely the CAMCOG (lower scores are indicative for more severe cognitive dysfunction)), Mini-Mental State Examination (MMSE; higher score corresponds to better cognitive performance) [43]; Frontal Assessment Battery (lower scores are indicative of more executive problems), visual association test [44]; Dutch-language version of the national reading test (scores range from 0 to 50 and translated into IQ estimations, higher score for higher IQ estimations) [45]; repeatable battery for the assessment of neuropsychological status (generates index scores for five neurocognitive domains as well as a total scale index score) [46]; Geriatric Depression Scale (score from 0–10 indicates no depression, 11–20 indicates a mild depression and 21–30 indicates a severe depression) [47]; and Apathy Evaluation Scale (score of 38 or higher is indicative for an apathy syndrome) [48].
In addition, caregivers or relatives of the subjects were asked to describe the patient’s history based on a demographic interview (including demographic information, medical history, medication use (cholinesterase inhibitors), and family history of dementia), and to fill out the Clinical Dementia Rating (higher score indicates more severe dementia symptoms) [49] part for the caregiver, instrumental activities of daily living (lower scores indicate more problems with daily life activity) questionnaire, and the neuropsychiatric inventory [50].
CSF sampling and storage
CSF samples were collected at ZNA Middelheim and Hoge Beuken according to standard collection protocols as described previously [51]. CSF was obtained by LP at the L3/L4 or L4/L5 interspace and the fluid was collected in polypropylene vials (Nalgene® cat.no.5000-1020, 1.5 mL). CSF samples were immediately frozen in liquid nitrogen and stored at –75°C until analysis.
CSF analyses and interpretation of CSF biomarker results
CSF levels of Aβ1–42, Aβ1–40, T-tau, and P-tau181 were determined with commercially available single-analyte ELISA kits (INNOTEST® β-AMYLOID(1–42), β-AMYLOID(1–40), hTAU-Ag, and PHOSPHO-TAU(181P); Fujirebio Europe). For each assay run, tests were performed as described earlier [52]. The only difference with the formerly published protocol was that the threshold of acceptance for intra-assay variation (calculated as (max-min) x 100/average) was decreased to 20%. The laboratory technician was blinded for the clinical diagnoses when performing the tests. The concentration ranges of the test kits are described in the package inserts (Aβ1–42: 125–2000 pg/mL, Aβ1–40: 7.8–1000 pg/mL, T-tau: 75–1200 pg/mL, P-tau181: 15.6–500 pg/mL).
For the interpretation of the CSF biomarker results, in-house validated cutoff values (in autopsy-confirmed AD versus cognitively healthy elderly) [53, 54] were used (Aβ1–42 <638.50 pg/mL, T-tau >296.50 pg/mL, P-tau181 >56.50 pg/mL, Aβ1–42/Aβ1–40 <0.067, and Aβ1–42/T-tau <2.153). Consistent with the IWG-2 criteria for AD [10], a CSF biomarker profile was considered to be suggestive for AD if the CSF Aβ1–42 value was below the cutoff, in combination with T-tau and/or P-tau181 values above the threshold. CSF biomarker results were not included in the consensus clinical diagnosis made by the panel.
Imaging biomarkers
Data acquisition
Subjects underwent a 35-min brain MRI scan acquired on a 3T MRI scanner with a 32-channel head coil (Siemens Trio/PrismaFit, Erlangen, Germany). The three-dimension (3D) magnetization-prepared rapid gradient-echo (MP-RAGE) (TR/TE = 2200/2.45 ms) was used to obtain 176 axial slices without slice gap and 1.0 mm nominal isotropic resolution (FOV = 192×256 mm). The acquisition time of the axial T1-weighted MP-RAGE sequence was 5.07 min.
PET image acquisition consisted of a 10-min static (30-min post-injection) [18F]FDG PET scan, and a 60-min dynamic or 10-min static (50-min post-injection) [18F]AV45 PET scan. Both PET scans were acquired on a Siemens Biograph mCT 64 slice TOF PET (Siemens, Erlangen, Germany). All PET images were corrected for random and scattered coincidences and attenuated based on a delayed coincidence window and a low dose computed tomography (CT), respectively. Simultaneously with the dynamic [18F]AV45 PET acquisition, continuous arterial blood sampling was performed by a coincidence detector system (Twilite, Swisstrace, Switzerland) to measure radioactivity in blood. In addition, seven manual blood samples were collected at discrete time points to determine the fraction of unchanged [18F]AV45 (i.e., without metabolites) in plasma. More details on the dynamic [18F]AV45 PET protocol and radiometabolite analysis are described elsewhere [37].
Image analyses
The clinical panel (SE, SVM, TVDB) visually rated all MRI scans to assess hippocampal atrophy by consensus, based on the Scheltens scale [55].
[18F]FDG PET images were visually classified (by SC) using a 3-point rating scale (no AD, equivocal, and AD). Scans were classified as visually positive for AD using the following criteria: hypometabolism in the temporal and parietal lobes, posterior cingulate gyrus, and precuneus. Following visual assessment, quantitative analysis was done using MIMneuro, an automated and quantitative analysis software application. The algorithm registers each brain to a standard template, allowing for comparisons to a normal database comprising of 43 cognitively healthy controls with an age between 41 and 80 years. Both sets of brains (controls and subjects) are normalized to the mean activity of the whole brain, pons, and cerebellum before comparison. Tracer uptake between a subject and controls is compared on a voxel-by-voxel basis allowing for calculation of z-scores (z = [meansubject-meancontrols]/SDcontrols).
Inter-frame motion correction of the dynamic [18F]AV45 PET images and PET-MRI co-registration were completed in PMOD v3.6 (PMOD Technologies Ltd., Zurich, Switzerland) [37]. From the dynamic [18F]AV45 PET images, regional VT was extracted using a two-tissue compartment model with metabolite-corrected plasma input function. From the 50–60 min time frame of the static and dynamic [18F]AV45 PET scans, SUVR values were calculated as the volume-weighted average uptake in the frontal, parietal and temporal lobes, with either cerebellar grey matter or whole subcortical white matter as the reference region (SUVRCB and SUVRWM, respectively). All data was corrected for partial volume effects.
For visual investigation, three nuclear medicine physicians (AA, SC, SiS) who were blinded for clinical diagnoses, separately performed a database-assisted analysis in which the [18F]AV45 PET uptake pattern of all subjects was compared to a normal pattern based on z-score maps (PNEURO v3.6, PMOD Technologies Ltd., Zurich, Switzerland). To this end, voxel-based representations of [18F]AV45 SUVR (reference: cerebellar grey) were created from the 50–60 min time window and all images were spatially normalized to the Rorden clinical template [56]. The brain norm was created from a set of SUVR images acquired with amyloid negative normal controls (n = 9) and normalized to the same space. Each z-score map was classified for Aβ according to the pattern of tracer uptake observed in cortical grey matter areas, and were visually rated as either positive (PET+) or negative (PET-). Scans were considered PET+ if, (1) specific cortical uptake was higher or equal to white matter uptake in two or more brain areas; and (2) there was reduction or loss of the grey-white contrast. In case of discordance between raters, consensus was reached on discrepant reads (n = 13). All image biomarkers, visual and quantitative measures, were not included in the consensus clinical diagnosis made by the panel.
Statistical analyses
Distribution of categorical variables within subject groups were analyzed with a Chi-Square test, and percentages were reported. Cohen’s κ coefficient was used to determine the agreement of measures for categorical variables (CSF versus amyloid-PET measures). Demographic comparisons were based on one-way ANOVA tests with post hoc Bonferroni tests, or in case of no normal distribution or low numbers per group (n < 20), Mann Whitney U tests. Area under the curves (AUCs) of receiver operating characteristics (ROC) curves were calculated for continuous variables (VT, SUVRWM, SUVRCB, CSF Aβ1–42)and cutoffs were determined. Linear correlation analyses were performed, and p- and Pearson’s R-values were reported. Logistic regression models were fitted with the results of the PET scan as dependent variable (either VT, SUVRCB, or SUVRWM). The PET scan results were dichotomized according to the calculated cutoffs. Independent variables were either CSF Aβ1–42 or Aβ1–42/Aβ1–40, or these CSF biomarkers in combination with T-tau and/or P-tau181. CSF Aβ1–42 or Aβ1–42/Aβ1–40 were included as dichotomized variable (according to the cutoffs). T-tau and P-tau181 were entered as continuous variables. Logistic regression models calculated the AUC, using the predicted probabilities from the logistic regression models, and Cohen’s κ coefficients.
For all analyses, p-values below 0.05 were considered significant. All statistical analyses were performed using GraphPad Prism 6 and IBM SPSS Statistics 23.
Concordance between Aβ CSF (Aβ1–42, Aβ1–42/Aβ1–40, Aβ1–42/T-tau, (Aβ1–42/Aβ1–40)/T-tau) and [18F]AV45 PET (visual, VT, and SUVR) was defined as the proportion of individuals positive or negative for both biomarkers (i.e., concordant positive CSF+/PET+, or concordant negative CSF-/PET-). Discordance between CSF and [18F]AV45 PET was defined as the proportion of subjects with only one abnormal biomarker (i.e., discordant positive CSF, CSF+/PET-, or discordant negative CSF, CSF-/PET+).
RESULTS
Patient recruitment
The cohort consists of 78 subjects (dementia (n = 17), MCI (n = 48), and cognitively healthy controls (n = 13)), and only baseline results are reported. All subjects underwent the complete neuropsychological test battery, brain imaging scans (including MRI, [18F]FDG PET, and [18F]AV45 PET scans), and in 67 subjects LP was performed. In total, ten subjects refused LP of which most of them were controls (n = 6); the other four subjects were three MCI and one dementia patient. LP failed in one MCI patient. Dynamic [18F]AV45 PET scans (n = 47) were performed in 12 controls, 24 MCI, and 11 AD dementia patients, whereas static [18F]AV45 PET scans (n = 31) were investigated in one control, 24 MCI, and six AD dementia patients. SUVR was calculated in all subjects (n = 78, with CSF available in seven controls, 44 MCI, and 16 AD dementia patients), whereas VT could be calculated in 45/48 subjects (with CSF available in five controls, 22 MCI, and ten AD dementia patients) as three subjects were excluded for VT analysis as their metabolite profile or arterial input function could not be obtained.
Study population (Table 1)
In the studied cohort of 67 subjects that underwent LP, gender and apolipoprotein E (APOE) ε4 status (carriers/non-carriers) were not significantly different between groups (p = 0.839 and p = 0.807, respectively), whereas the control subjects were significantly younger at inclusion compared to both the MCI and AD dementia patients. MMSE scores were significantly different between the three groups, with the lowest scores in AD dementia patients and highest scores in the control subjects. No significant differences were detected between the groups for education.
Demographics and biomarker data of the study population
Data are mean [IQR], numbers (n), and percentage (%). Significantly different: *Controls versus MCI, ∧Controls versus AD dementia, $MCI versus AD dementia. SUVR [18F]AV45 PET are cortical means of frontal, parietal, and temporal lobes, with cerebellar grey matter or whole subcortical white matter as reference regions. Aβ amyloid-β; AD, Alzheimer’s disease; APOE, apolipoprotein E; [18F]AV45, [18F]Florbetapir; CB, cerebellar grey matter; Controls, cognitively healthy controls; ε4, APOE epsilon4 allele; LP, lumbar puncture; MCI, mild cognitive impairment; MMSE, Mini-Mental State Examination; SUVR, standardized uptake value ratio; VT, total volume of distribution; WM, whole subcortical white matter.
CSF and amyloid-PET analyses
Comparing AD dementia patients and control subjects, all three core AD CSF biomarkers (Aβ1–42, T-tau, and P-tau181), and all three ratios (Aβ1–42/Aβ1–40, Aβ1–42/T-tau, and (Aβ1–42/Aβ1–40)/T-tau) were significantly different as indicated in Table 1. The only single CSF biomarker that was significantly different between MCI and AD dementia patients was P-tau181. No significant difference was found for Aβ1–40. The CSF Aβ1–42/T-tau ratio was significantly different between all groups. The CSF (Aβ1–42/Aβ1–40)/T-tau ratio was significantly different in AD dementia compared to MCI and cognitively healthy control subjects.
Forty-four [18F]AV45 PET scans were consensus rated as suggestive for AD (in controls 31%, MCI 63%, and AD dementia 59%). Comparing MCI patients and cognitively healthy controls, visually rated [18F]AV45 PET scans were significantly different, whereas a trend was found between AD dementia patients and controls (data not shown). There was no significant difference between MCI and AD dementia patients. Quantitative, VT and SUVRCB, were significantly different between MCI or AD dementia patients and cognitively healthy controls as indicated in Table 1. No significant differences were detected for SUVRWM, whereas this [18F]AV45 PET measure was significantly different in the total population between MCI or AD dementia patients and cognitively healthy controls (Table 1).
Concordance/discordance between CSF Aβ and amyloid-PET measures
Biochemical analysis of the amyloid markers
The cutoff value for cortical mean [18F]AV45 PET SUVRCB was 1.203 (AUC = 0.778, sensitivity = 100%, and specificity = 66.7%) and cutoff value for cortical mean [18F]AV45 PET SUVRWM was 0.485 (AUC = 0.778, sensitivity = 100%, and specificity = 55.6%), calculated based on the AD dementia and cognitively healthy control subjects. Subjects with SUVR values below the cutoffs were grouped as normal (PET-) and above as abnormal (PET+).
We detected an increased concordance in the visual, SUVR, and VT [18F]AV45 PET values when the CSF Aβ1–42/Aβ1–40 ratio was applied instead of Aβ1–42 alone (Fig. 1), with no difference for concordance with both cortical mean SUVR values. The concordance between CSF Aβ1–42 and amyloid-PET measures was the highest for visually rated PET scans (κ= 0.473), whereas the SUVR measures had the highest concordance when the CSF Aβ1–42/Aβ1–40 ratio was applied (SUVRCB: κ= 0.622 and SUVRWM: κ= 0.641). Logistic regression models, including T-tau or P-tau to CSF Aβ1–42 and Aβ1–42/Aβ1–40 showed higher Cohen’s κ coefficients for VT and both SUVR measures when the CSF Aβ1–42/Aβ1–40 ratio was applied compared to CSF Aβ1–42 alone (Table 2). In case both CSF tau values were included in the logistic regression models the concordance was similar when CSF Aβ1–42 alone was compared to the CSF Aβ1–42/Aβ1–40 ratio. The strength of the correlation between the CSF biomarkers and [18F]AV45 PET scans increased when total brain white matter was used as reference region compared to cerebellar grey matter (Table 3). Concordance and discordance between amyloid markers. CSF Aβ1–42 and [18F]Florbetapir ([18F]AV45) PET (visual, SUVRCB, SUVRWM, and VT) (A) were compared to CSF Aβ1–42/Aβ1–40 and [18F]AV45 PET (same measurements as described for A) (B). Concordance increased for all four [18F]AV45 PET measurements when considering the CSF ratio. Especially, discordant CSF negative subjects became concordant CSF positive. Aβ, amyloid-β; [18F]AV45, [18F]Florbetapir; CB, cerebellar grey matter; CSF, cerebrospinal fluid; SUVR, standardized uptake value ratio; VT, total volume of distribution; WM, whole subcortical white matter. Logistic regression model result by comparing CSF with amyloid-PET measures Logistic regression models compared the amyloid-PET scans (SUVRCB, SUVRWM, and VT) with either CSF Aβ1–42 or Aβ1–42/Aβ1–40, or these CSF biomarkers in combination with T-tau and/or P-tau181. [AUC] and Cohen’s κ coefficients. If T-tau or P-tau were included with CSF Aβ1–42 and Aβ1–42/Aβ1–40 in the model, a higher concordance was detected when the CSF Aβ1–42/Aβ1–40 ratio was applied compared to CSF Aβ1–42 alone (for VT and both SUVR measures). Similar findings were detected in case both CSF tau concentrations were added to Aβ1–42 alone or Aβ1–42/Aβ1–40 in the logistic regression models. AUC, area under the curve; CB, cerebellar grey matter; SUVR, standardized uptake value ratio; VT, total volume of distribution; WM, whole subcortical white matter. Correlations between [18F]AV45 PET scans and CSF biomarkers VT and SUVR [18F]AV45 PET are cortical means of frontal, parietal, and temporal lobes, with cerebellar grey matter or whole subcortical white matter as reference regions. Data are Pearson’s R values and correlations are all significant (p < 0.05). Aβ, amyloid-β; CB, cerebellar grey matter; SUVR, standardized uptake value ratio; VT, total volume of distribution; WM, whole subcortical white matter.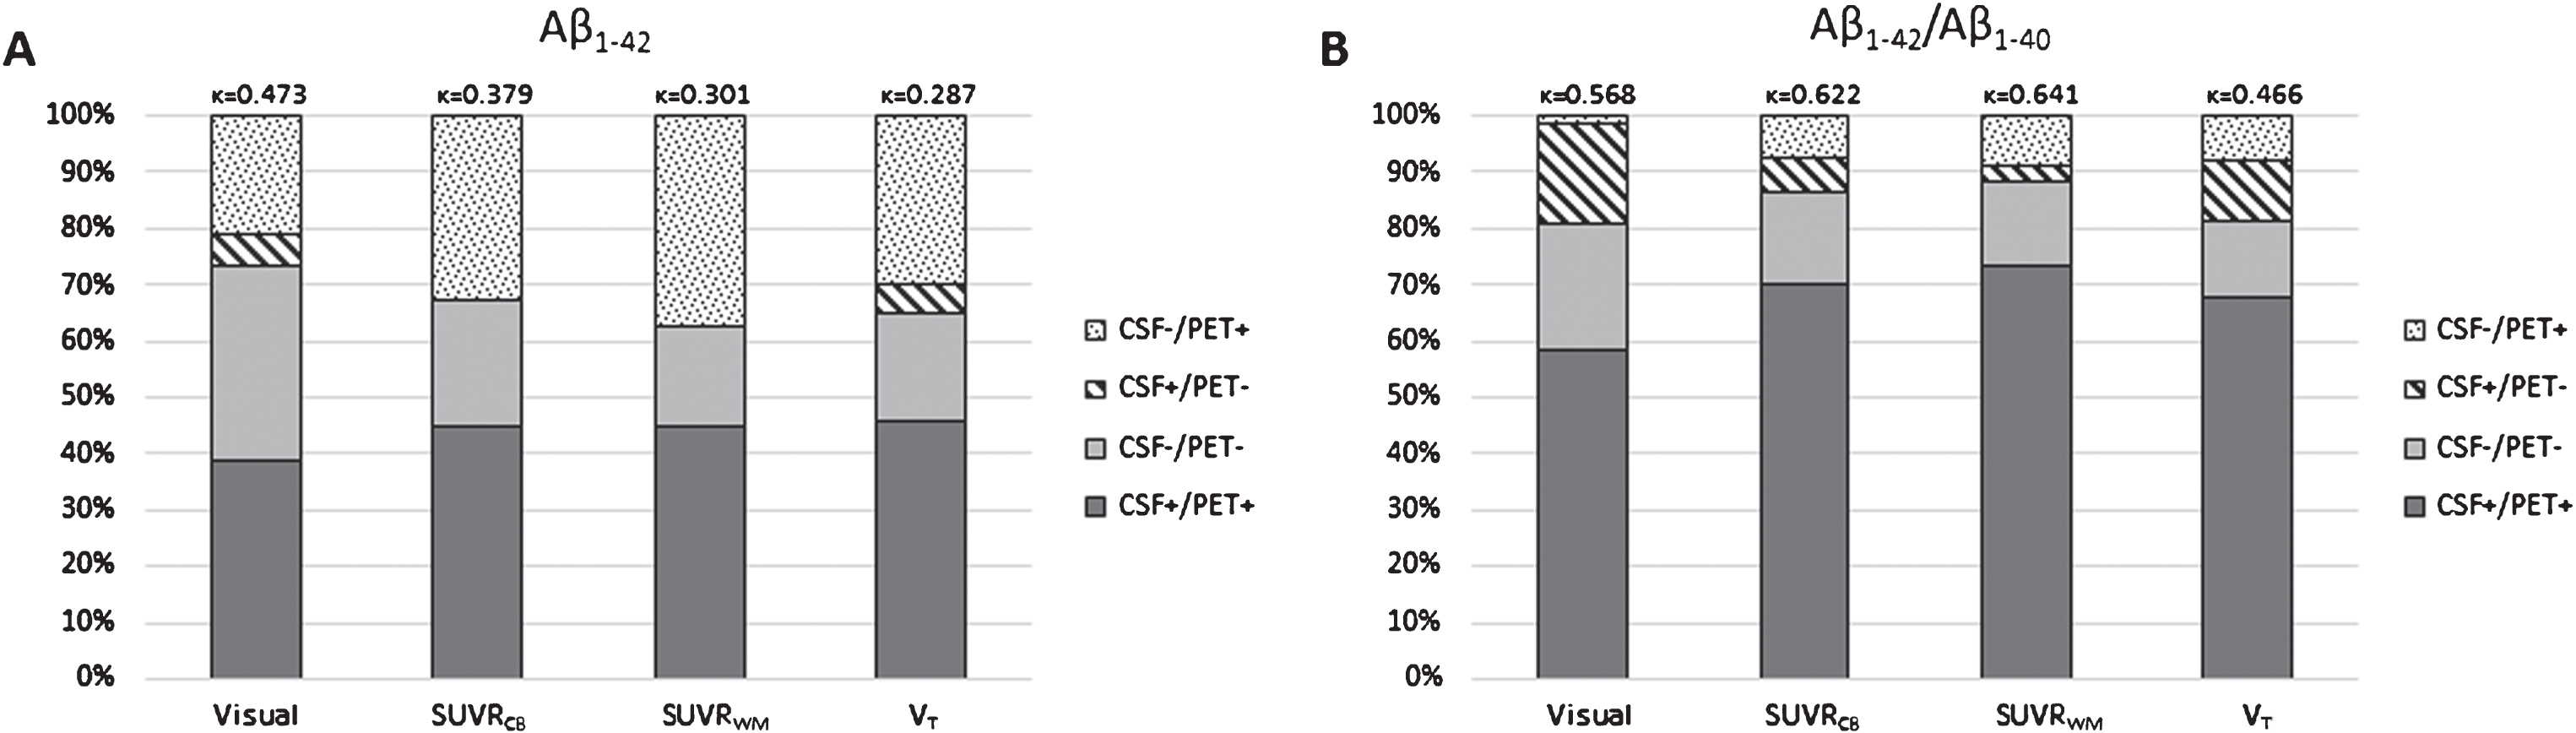
By dichotomizing [18F]AV45 PET into abnormal (PET+) and normal (PET-) values based on the total population, new cutoffs were calculated for Aβ1–42 and Aβ1–42/Aβ1–40 ratio. The new CSF Aβ1–42 cutoff based on cortical mean SUVRCB was 864.5 pg/mL (AUC = 0.967, sensitivity = 88.5%, specificity = 100%) and for SUVRWM was 1055.5 pg/mL (AUC = 0.970, sensitivity = 95.4%, specificity = 91.7%). Concordance between CSF Aβ1–42 and SUVR [18F]AV45 PET increased with these new cutoffs (Fig. 2). Especially, the group of positive concordance (CSF+/PET+) increased with higher Aβ1–42 cutoffs, whereas the number of subjects with discordant negative CSF (CSF-/PET+) decreased. The recalculated CSF Aβ1–42/Aβ1–40 ratio cutoff based on cortical mean SUVRCB was 0.063 pg/mL (AUC = 0.919, sensitivity = 88.5%, specificity = 86.7%) and for SUVRWM it was 0.064 pg/mL (AUC = 0.932, sensitivity = 87.3%, specificity = 91.7%). These cutoffs did not differ much with the currently used cutoff in this study (0.067 pg/mL), and thus, concordances between the CSF ratio cutoff/recalculated cutoff and SUVR values were comparable (0.067 pg/mL versus SUVRCB: κ= 0.622 and versus SUVRWM: κ= 0.641; 0.063 pg/mL versus SUVRCB: κ= 0.639 and versus SUVRWM: κ= 0.660; 0.064 pg/mL versus SUVRCB: κ= 0.672 and versus SUVRWM: κ= 0.694; all data not shown).
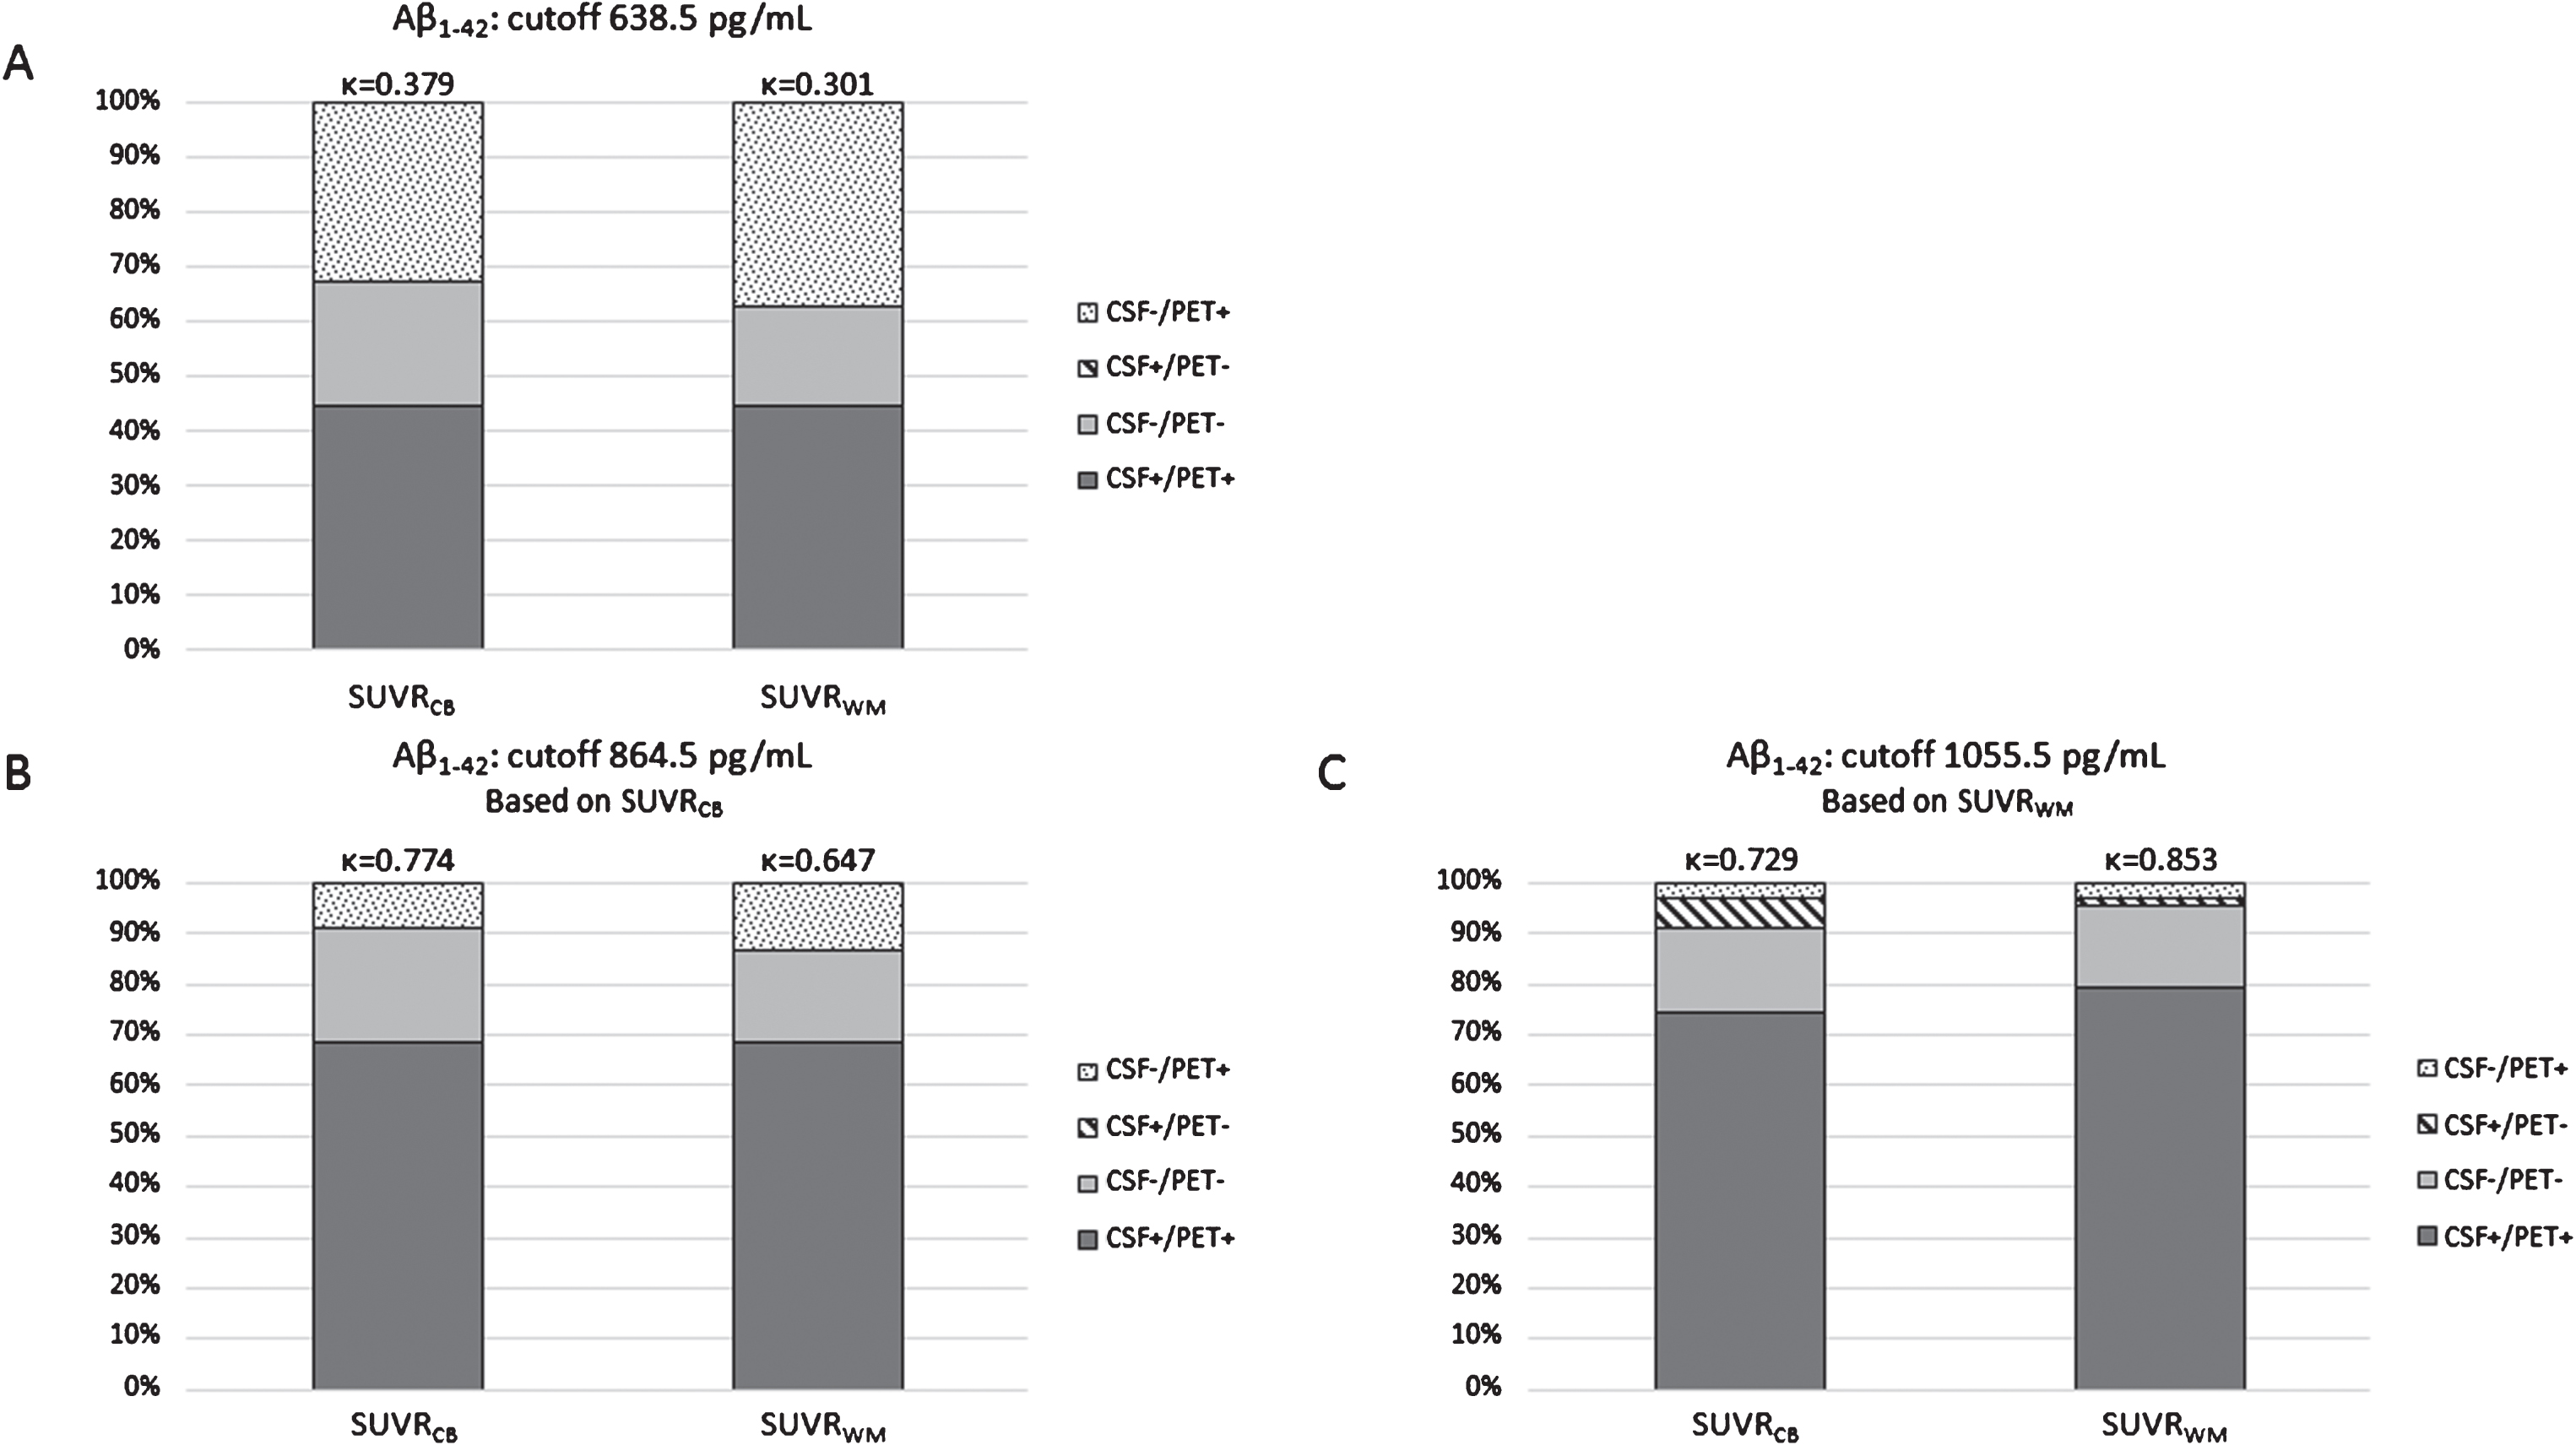
Concordance and discordance between amyloid markers. CSF Aβ1–42 and [18F]AV45 PET (SUVRCB, SUVRWM) were compared for three different Aβ1–42 cutoffs, established in a neuropathological confirmed cohort [53] (A), derived by a ROC-based analysis on this dataset for SUVRCB (B), and SUVRWM (C). Concordance increased by applying new Aβ1–42 cutoffs. The concordance changed from κ= 0.379 and κ= 0.301 (respectively, SUVRCB and SUVRWM) to κ= 0.774 and κ= 0.647 (B), and κ= 0.729 and κ= 0.853 (C). Aβ, amyloid-β; [18F]AV45, [18F]Florbetapir; CB, cerebellar grey matter; CSF, cerebrospinal fluid; ROC, Receiver operating characteristics; SUVR, standardized uptake value ratio; WM, whole subcortical white matter.
Analyses of amyloid markers based on clinical diagnoses
Visually rated [18F]AV45 PET scans. In the control group, CSF Aβ1–42 and visually rated [18F]AV45 PET were in full concordance in all control subjects, except for one subject with a positive [18F]AV45 PET scan and normal CSF Aβ1–42 levels. However, the CSF Aβ1–42 concentration was close to the cutoff of 638.50 pg/mL (726 pg/mL) and both tau markers were abnormal (T-tau: 505 pg/mL and P-tau181: 91.5 pg/mL). Applying the Aβ1–42/Aβ1–40 ratio, the CSF amyloid marker changed to abnormal for this subject, and thus in concordance with [18F]AV45 PET (CSF+/PET+).
In the MCI and dementia groups, 18 patients had concordant negative amyloid markers (CSF-/PET-), 17 had at least one positive amyloid marker (CSF-/PET+ or CSF+/PET-), and 25 were positive for both amyloid markers (CSF+/PET+) as shown in Table 4. With regard to discordant MCI and dementia patients (n = 17), 13 patients were amyloid positive on [18F]AV45 PET but had normal CSF Aβ1–42 values (CSF-/PET+). In total, ten patients had Aβ1–42 concentrations that were only slightly (within +15%) above the cutoff of 638.50 pg/mL, whereas their T-tau values were suggestive for AD in all cases and P-tau181 was abnormal in 9/10 patients (Table 5). When the CSF Aβ1–42/Aβ1–40 ratio was applied seven out of ten subjects became concordant.
Different Aβ CSF markers investigated according to amyloid-PET measurements
Data are numbers of subjects. Three [18F]AV45 measurements (visual, SUVRCB, and SUVRWM) are compared to Aβ CSF markers. Cognitively healthy controls, MCI, and AD dementia were divided based on discordant (white) or concordant (grey) amyloid markers. Aβ, amyloid-β; AD, Alzheimer’s disease; [18F]AV45, [18F]Florbetapir; CB, cerebellar grey matter; CSF, cerebrospinal fluid; MCI, mild cognitive impairment; SUVR, standardized uptake value ratio; VT, total volume of distribution; WM, whole subcortical white matter.
Patients with normal CSF Aβ1–42 and increased tau values
Seven out of ten patients with CSF Aβ1–42 values above 638.50 pg/mL (within 15%) and increased tau values were in concordance with [18F]AV45 PET after the CSF Aβ1–42/Aβ1–40 ratio was applied. Aβ, amyloid-β; [18F]AV45, [18F]Florbetapir.
In the total population, 23 individuals had a negative concordance (CSF-/PET-) of which 15 suspected non-AD pathology (SNAP) subjects were identified and consisted of three controls, eight MCI, and four AD dementia patients. Eleven subjects had abnormal CSF values for both T-tau and P-tau181, two subjects had only abnormal T-tau and two had abnormal P-tau181 values. After applying the CSF Aβ1–42/Aβ1–40 ratio, 7/15 SNAP individuals became positive discordant (CSF+/PET-).
SUVR and V T [18F]AV45 PET scan measures. By applying CSF ratios the concordance between Aβ CSF and amyloid-PET increased compared to Aβ1–42 alone (Figs. 3 and 4, Table 4). In AD dementia patients, the highest concordance was detected in CSF Aβ1–42/Aβ1–40 and Aβ1–42/T-tau for SUVR, with no difference for concordance with the two SUVR measurements. For MCI patients, all three ratios were in higher concordance than Aβ1–42 alone; however, Aβ1–42/T-tau achieved the highest concordance with SUVR in which SUVRCB outperformed SUVRWM. The (Aβ1–42/Aβ1–40)/T-tau ratio resulted in more discordant positive CSF controls (CSF+/PET-). In all groups, the highest concordance for VT was found by applying both the CSF Aβ1–42/Aβ1–40 and Aβ1–42/T-tau ratios (Table 4).
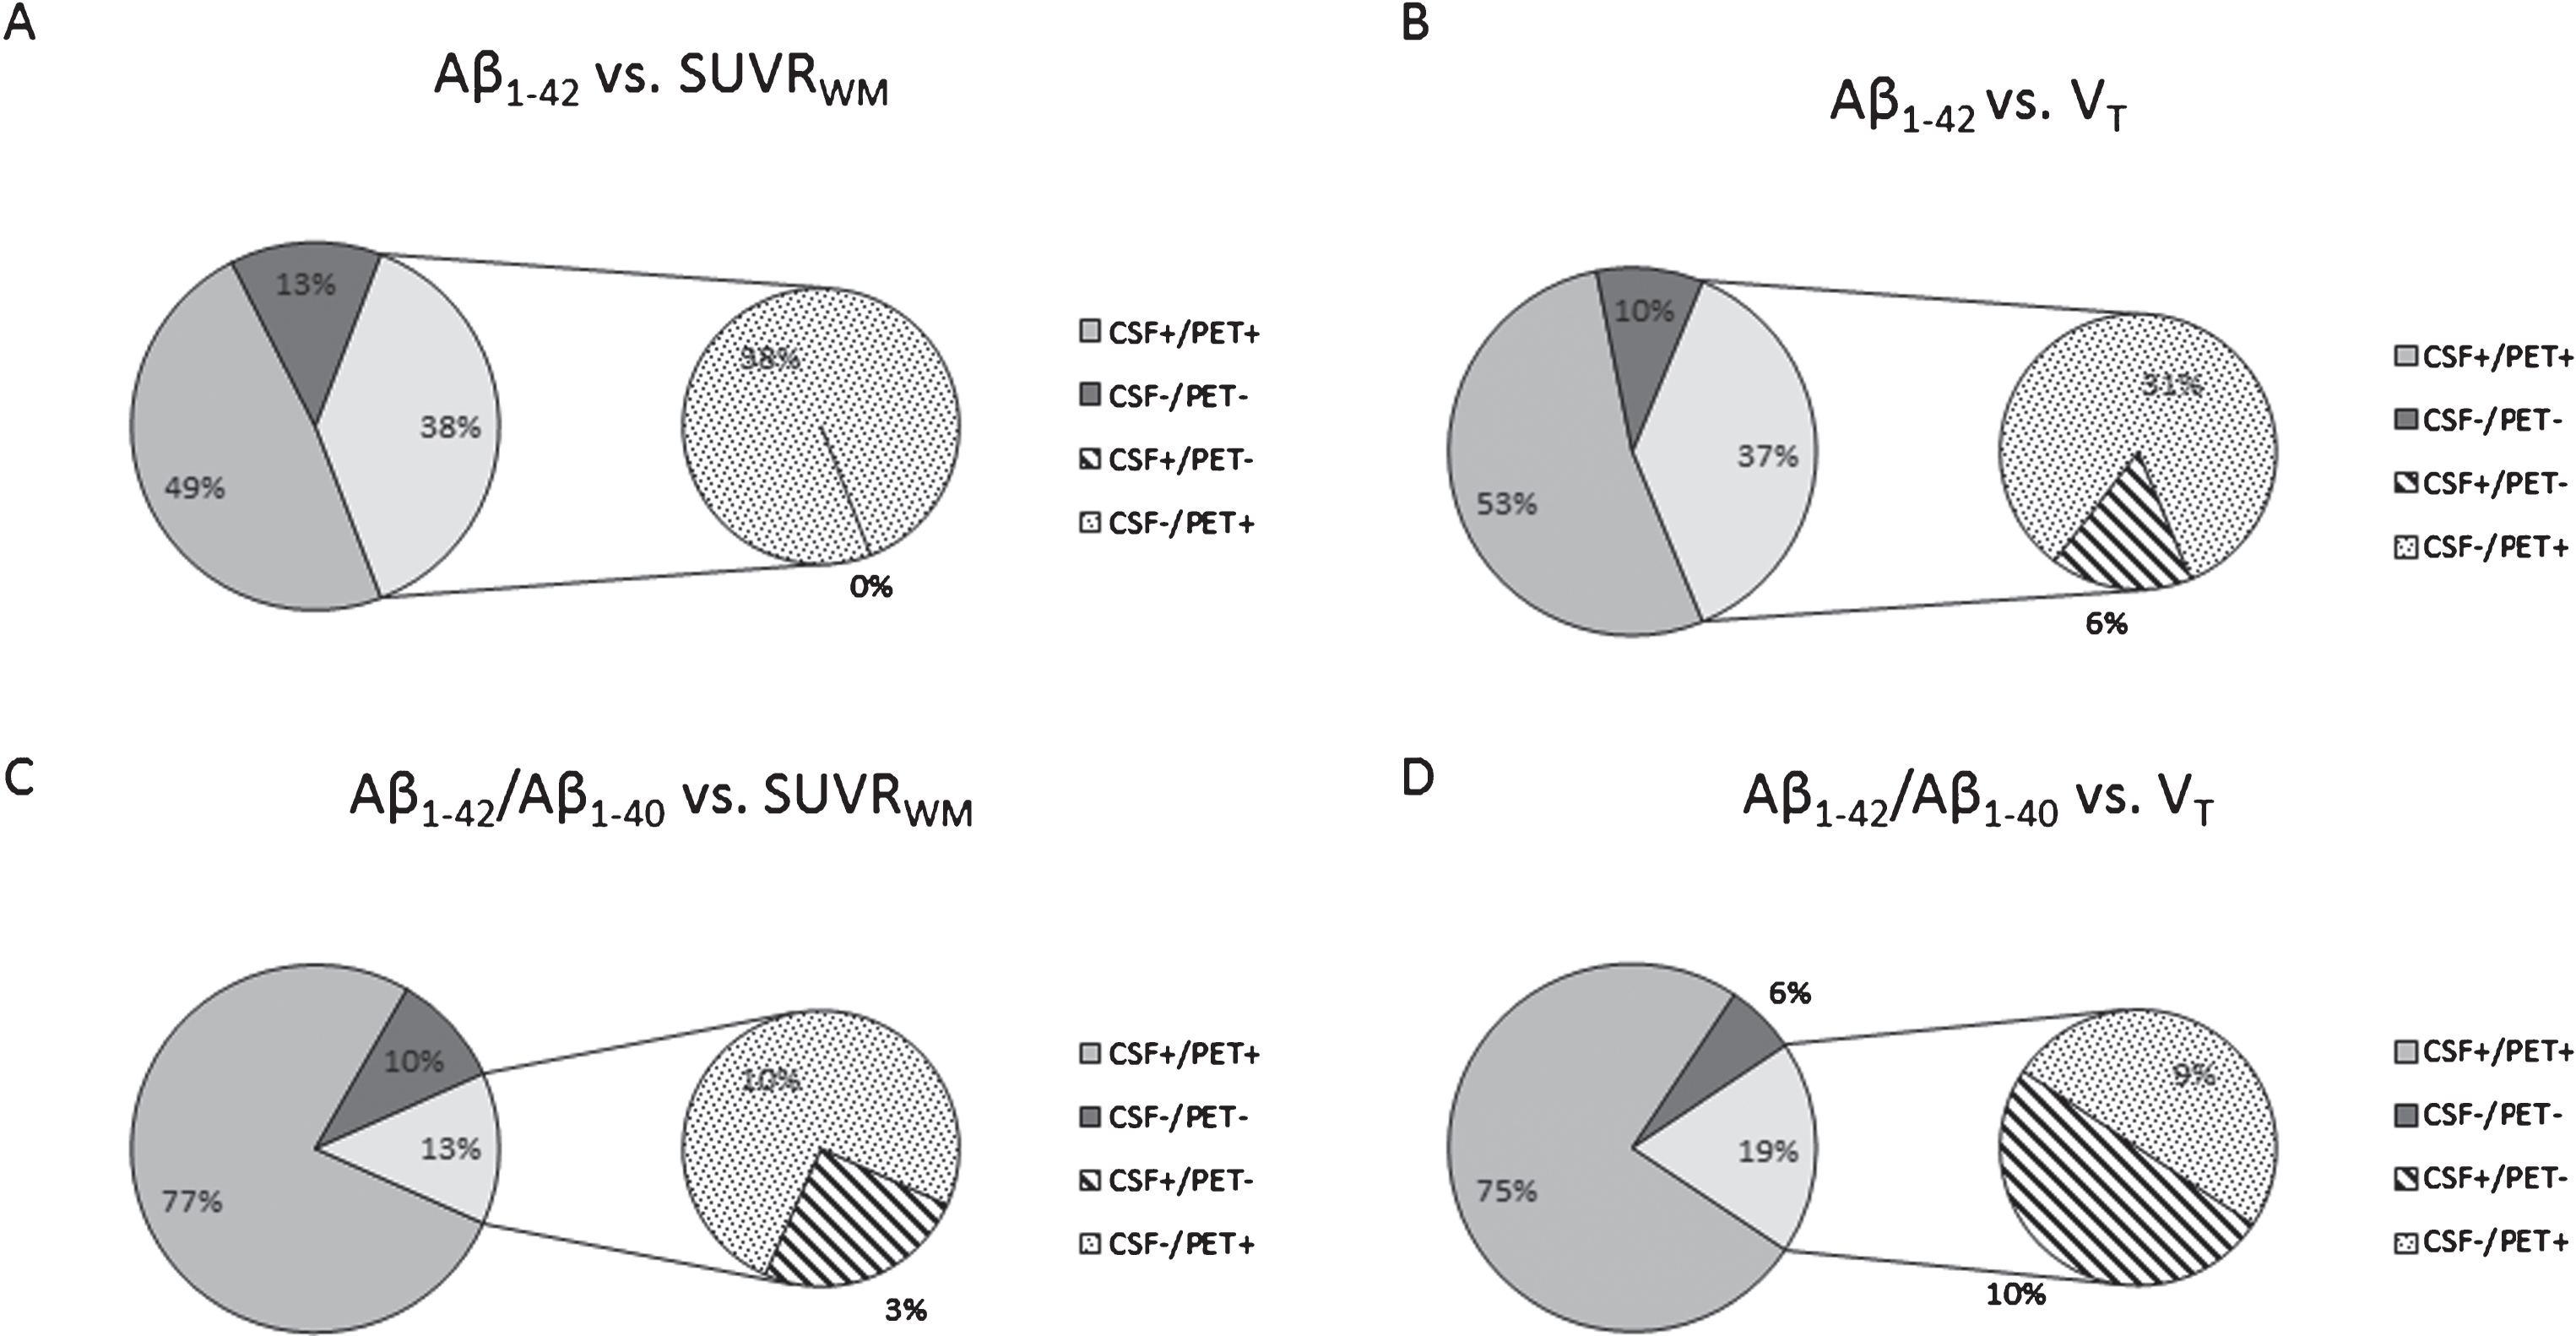
CSF Aβ versus SUVRWM (A and C) or VT (B and D) in MCI and AD dementia patients. After applying the CSF Aβ1–42/Aβ1–40 ratio a change from discordant negative CSF (CSF-/PET+) to concordant positive (CSF+/PET+) was detected. Only VT and SUVRWM are shown in this figure as VT is still the gold standard and SUVRWM is stronger correlated to CSF concentrations compared to SURVCB, in which no significant difference was detected between both SUVR measures. In total, 13% patients had only one abnormal amyloid marker when CSF was compared to SUVRWM, of which 10% had a positive amyloid-PET scan (CSF-/PET+), whereas only 3% of the patients had an abnormal CSF Aβ1–42/Aβ1–40 value (CSF+/PET-). For CSF compared to VT 19% had discordant amyloid markers, of which 9% had a positive amyloid-PET scan (CSF-/PET+), whereas 10% of the patients had an abnormal CSF Aβ1–42/Aβ1–40 value (CSF+/PET-). The other patients were in full concordance for their amyloid markers. This change from discordant negative CSF (CSF-/PET+) to concordant positive (CSF+/PET+) when the CSF Aβ1–42/Aβ1–40 was applied was also detected for the other [18F]AV45 PET measures (visual and SUVRCB). AD, Alzheimer’s disease; [18F]AV45, [18F]Florbetapir; CB, cerebellar grey matter; CSF, cerebrospinal fluid; MCI, mild cognitive impairment; SUVR, standardized uptake value ratio; VT, total volume of distribution; WM, whole subcortical white matter.
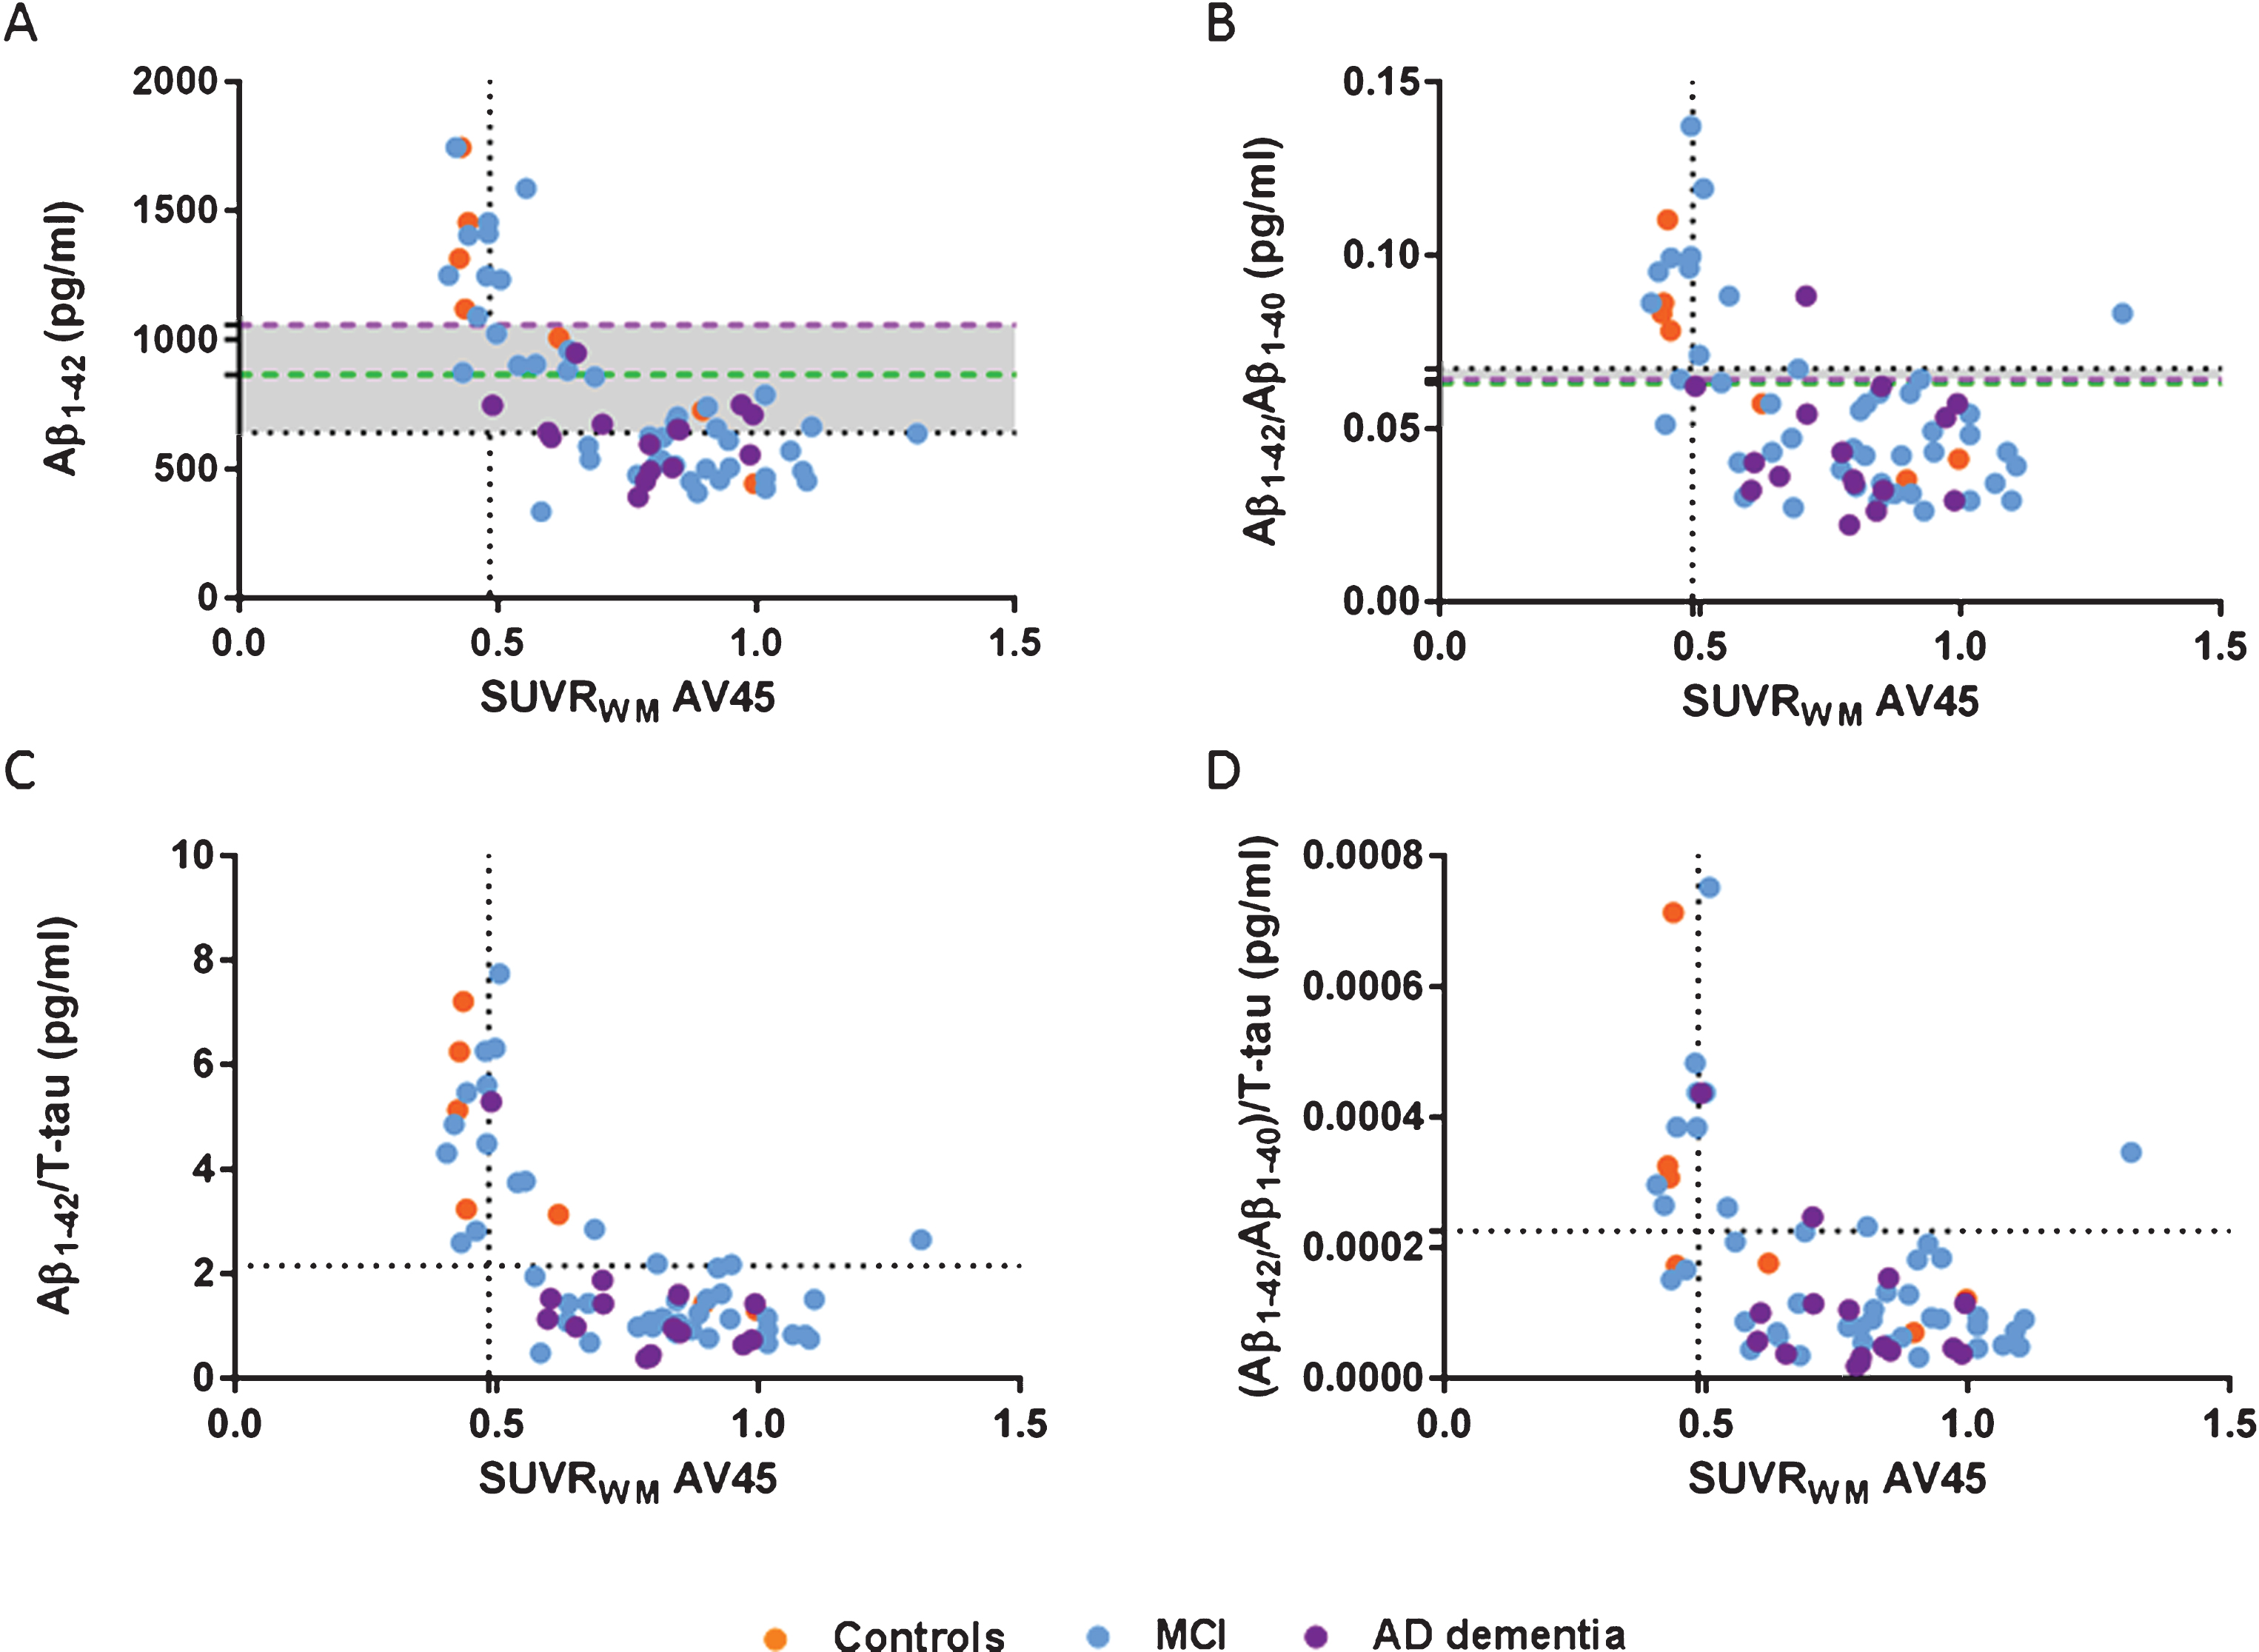
Scatter plots of CSF Aβ1–42 (A), Aβ1–42/Aβ1–40 (B), Aβ1–42/T-tau (C), and (Aβ1–42/Aβ1–40)/T-tau (D) ratios and amyloid SUVRWM. Cutoff Aβ1–42 638.5 pg/mL, Aβ1–42/Aβ1–40 0.067 pg/mL, Aβ1–42/T-tau 2.15 pg/mL, (Aβ1–42/Aβ1–40)/T-tau 0.00023 pg/mL (horizontal black dotted lines), and SUVRWM cutoff 0.485 (vertical black dotted lines, A-D). New cutoffs Aβ1–42 864.5 pg/ml based on SUVRCB (green dotted line, A) and Aβ1–42 1055.55 pg/mL based on SUVRWM (purple dotted line, A), new cutoffs Aβ1–42/Aβ1–40 based on SUVRCB 0.063 pg/mL (green dotted line, B) and Aβ1–42/Aβ1–40 based on SUVRWM 0.064 pg/mL (purple dotted line, B). Increased concordance with amyloid-PET SUVR if CSF ratios were applied compared to the Aβ1–42 alone. Same concordance was found when new CSF Aβ1–42 cutoffs were applied (A) compared to the ratios (B-D). New Aβ1–42/Aβ1–40 cutoffs were comparable to the autopsy-based cutoffs (B). Aβ, amyloid-β; AD, Alzheimer’s disease; Controls, cognitively healthy controls; CSF, cerebrospinal fluid; MCI, mild cognitive impairment; SUVR, standardized uptake value ratio; WM, whole subcortical white matter.
The ratios ensured a change from discordant negative CSF (CSF-/PET+) to concordant positive (CSF+/PET+) in AD dementia and MCI patients (Fig. 3).
As shown in Fig. 4, all CSF Aβ concentrations were compared to SUVRWM as this [18F]AV45 PET quantitative measure correlated stronger to CSF values than SUVRCB and VT. Aβ1–42/Aβ1–40 and Aβ1–42/T-tau ratios had an increased concordance compared to CSF Aβ1–42 alone. By applying (Aβ1–42/Aβ1–40)/T-tau the concordance increased as well compared to Aβ1–42 alone, however this ratio is less concordant with PET compared to the two other ratios. In addition, comparable concordance was found when the CSF ratios (B-D) and the new CSF Aβ1–42 cutoffs (A) were applied. As the CSF Aβ1–42/Aβ1–40 ratio was applied Cohen’s κ coefficient was 0.641 (B, horizontal black dotted line) and the new CSF Aβ1–42 cutoffs showed a Cohen’s κ coefficient of 0.647 (A, green dotted line) and 0.853 (A, purple dotted line). Nevertheless, the new SUVR-based Aβ1–42/Aβ1–40 cutoffs were comparable to the autopsy-based Aβ1–42/Aβ1–40 cutoffs and did not increase the concordance further (B).
DISCUSSION
We found an increased concordance between amyloid markers, CSF Aβ, and [18F]AV45 PET, when the Aβ1–42/Aβ1–40 ratio was applied compared to Aβ1–42 alone, which was in line with recent published studies [25 , 31]. In literature, if CSF Aβ1–42 is reported discordant from amyloid-PET, the CSF findings are often positive rather than CSF negative [16 , 31]. Our study, however, demonstrated the opposite, namely a smaller proportion of CSF+/PET- and more individuals with CSF-/PET+ when using CSF Aβ1–42. Assuming a correct clinical diagnosis of the AD patients, a higher proportion of CSF Aβ1–42 positive individuals was expected in our study since CSF Aβ1–42 changes to abnormal at an earlier stage in AD than the amyloid load can be visualized using PET [32]. In literature, similar discrepancies with a higher portion of CSF-/PET+ have been described for CSF Aβ1–42 alone [17 , 24]. However, none of these studies have questioned the CSF cutoffs used in their studies.
The CSF Aβ1–42 cutoff used in the current cohort was established in an autopsy-confirmed AD dementia population (n = 73) as compared to cognitively healthy controls (n = 100) [52], which reflects two extremes of clinically diagnosed groups. A cutoff only based on pathological individuals at the end of the disease spectrum (AD dementia) detects the most severe biochemical changes and does not take clinical shifts within the disease process into account. We therefore dichotomized all subjects in our entire cohort, including not only AD but also MCI and healthy control cases, into abnormal and normal [18F]AV45 PET values and calculated new Aβ1–42 cutoffs based on the two different reference regions (SUVRCB and SUVRWM) used in the SUVR measurements. This exercise was performed only to show the differences in a CSF Aβ1–42 cutoff calculated in clinically diagnosed cognitively healthy controls, MCI, and AD dementia patients as compared to an autopsy-confirmed AD dementia population versus cognitively healthy controls. Using the amyloid-PET instead of neuropathology as the gold standard, we detected an increased cutoff for the Aβ1–42 values, which confirms a previous study [24]. CSF Aβ1–42 cutoffs are often selected to maximize the discriminability between controls and AD dementia patients, and such a method may result in a more conservative and lower CSF Aβ1–42 cutoff. Moreover, the use of amyloid-PET positivity as a standard of truth overcomes this problem. As a consequence, the method used to calculate the CSF cutoffs should depend on the context in which the biomarkers should be used (e.g., identifying presymptomatic subjects for clinical trials versus confirming AD dementia). In this study, the increase of the CSF Aβ1–42 cutoff led to an increased concordance between Aβ CSF and amyloid-PET with a decreased number of CSF-/PET+ and an increased number of positive concordance (CSF+/PET+) as expected. Moreover, the classification changed to an increase of positive concordance instead of discordant negative CSF. This increase in concordance was also achieved by applying Aβ1–42/Aβ1–40 and Aβ1–42/T-tau ratios. Nevertheless, CSF tau markers change later in the pathophysiological process [57] and will likely be outperformed by the Aβ1–42/Aβ1–40 ratio when it comes to early clinical detection of AD. The CSF Aβ1–42/Aβ1–40 ratio also corrects for possible effects of disease specific inter-individual variability in Aβ metabolism (production and/or clearance) [34 –36]. Indeed, patients with CSF Aβ1–42 values slightly above the cutoff (within +15% range of the cut-off of 638.50 pg/mL) were in concordance with [18F]AV45 PET when the CSF Aβ1–42/Aβ1–40 ratio was applied. Another explanation for the higher concordance when using the Aβ1–42/Aβ1–40 ratio is variability due to pre-analytical and analytical factors affecting Aβ measured values [58, 59]. A shift in the Aβ1–42 cutoff will have a larger effect than if the Aβ1–42/Aβ1–40 ratio is applied because the ratio minimizes the effect on the classification in amyloid positive versus negative.
Analyzing the quantitative [18F]AV45 measures, the strongest association was found between CSF Aβ and [18F]AV45 PET SUVRWM compared to SUVRCB. In a subpopulation of this cohort, the gold standard VT correlated better with SUVRWM than with SUVRCB as described by Ottoy et al. [37]. These findings suggest whole subcortical white matter to be a better reference region for SUVR, although to date the most widely used references for quantitation of amyloid-PET are the entire cerebellum and cerebellar grey matter [14]. The cerebellum is commonly chosen since low levels of insoluble fibrillar Aβ have been demonstrated in sporadic AD, which was also confirmed by post-mortem histopathology [15]. In contrast, recent studies showed that subcortical white matter as a reference region resulted in increased power to detect longitudinal cortical SUVR changes and Aβ-modifying treatment effects [60 –63]. In addition, cerebellar grey ROIs are highly vulnerable to noise due to their low signal level, and proximity to the edge of the scanner FOV where noise and truncation can occur.
Although this study benefits from a well-characterized cohort that was diagnosed according to the strict and standardized application of the most recent diagnostic criteria, a potential limitation of this study is the younger age of the cognitively healthy controls, which were not age-matched to the patients. However, the proportion of preclinical AD individuals will be smaller in younger cognitively healthy controls than when we would have used an age-matched control group. Comparing the clinical diagnoses made by the referring physician and the consensus-based diagnoses we detected discrepancies in three subjects. These three subjects were clinically diagnosed as MCI, whereas the panel concluded that they should have been diagnosed as AD dementia due to the fact that these patients were not completely independent with regard to activities of daily living, including handling money decisions. Another limitation of the study is the low number of cognitively healthy controls. Nevertheless, same findings would have been found in case the cognitively healthy controls were excluded from the biochemical analyses. The CSF samples have not been analyzed simultaneously, and thus inter-assay variability might be an issue, which is a potential limitation of this study.
In summary, in a clinical setting of MCI and dementia due to AD, a higher concordance between amyloid-PET imaging and CSF Aβ can be achieved if the ratio Aβ1–42/Aβ1–40 ratio is applied. This finding is of utmost importance for the biomarker-based diagnosis of AD as well as for the selection of subjects for clinical trials with potential disease-modifying therapies.
Footnotes
ACKNOWLEDGMENTS
This research was in part supported by the University Research Fund of the University of Antwerp; the Research Foundation - Flanders (FWO); Flanders Innovation & Entrepreneurship (VLAIO); the Flemish Impulse Financing of Networks for Dementia Research (VIND). This work has received support from the EU/EFPIA Innovative Medicines Initiative Joint Undertaking (EMIF grant n° 115372).