
Abstract
Background:
Cerebrospinal fluid (CSF) and magnetic resonance imaging (MRI) biomarkers of neurodegenerative diseases are relatively sensitive and specific in highly curated research cohorts, but proper validation for clinical use is mostly missing.
Objective:
We studied these biomarkers in a novel memory clinic cohort with a variety of different neurodegenerative diseases.
Methods:
This study consisted of 191 patients with subjective or objective cognitive impairment who underwent neurological, CSF biomarker (Aβ42, p-tau, and tau) and T1-weighted MRI examinations at Kuopio University Hospital. We assessed CSF and imaging biomarkers, including structural MRI focused on volumetric and cortical thickness analyses, across groups stratified based on different clinical diagnoses, including Alzheimer’s disease (AD), frontotemporal dementia, dementia with Lewy bodies, Parkinson’s disease, vascular dementia, and mild cognitive impairment (MCI), and subjects with no evidence of neurodegenerative disease underlying the cognitive symptoms. Imaging biomarkers were also studied by profiling subjects according to the novel amyloid, tau, and, neurodegeneration (AT(N)) classification.
Results:
Numerous imaging variables differed by clinical diagnosis, including hippocampal, amygdalar and inferior lateral ventricular volumes and entorhinal, lingual, inferior parietal and isthmus cingulate cortical thicknesses, at a false discovery rate (FDR)-corrected threshold for significance (analysis of covariance; p < 0.005). In volumetric comparisons by AT(N) profile, hippocampal volume significantly differed (p < 0.001) between patients with normal AD biomarkers and patients with amyloid pathology.
Conclusion:
Our analysis suggests that CSF and MRI biomarkers function well also in clinical practice across multiple clinical diagnostic groups in addition to AD, MCI, and cognitively normal groups.
Keywords
INTRODUCTION
Alzheimer’s disease (AD) is defined as a continuous pathophysiological process in both cognitive and biomarker domains, including cerebrospinal fluid (CSF) and imaging biomarkers [1, 2], which begins decades before clinical manifestations or symptom onset [3, 4]. Syndromal categorical cognitive staging comprises three clinical categories: cognitively normal, mild cognitive impairment (MCI), and dementia [1, 6]. Subjects in the early stages of neurodegenerative disease before the development of irreversible pathological injury might benefit the most when possible disease-modifying interventions are available, which emphasizes the importance of early diagnosis of AD [7, 8].
Using a combination of different essential CSF AD biomarkers, CSF Aβ42, tau, and p-tau [9–12] were used to distinguish those with AD from cognitively normal individuals and to predict the conversion from MCI to AD [13–16]. In Finland, CSF AD biomarkers have been available for clinical testing since 2004 and have been part of the national guidelines for the diagnosis and treatment of memory disorders since 2010 [17].
Brain atrophy is correlated with disease severity and the Braak stages of neurofibrillary tangle deposition and can be detected in magnetic resonance imaging (MRI) even in preclinical stages of AD [2, 18]. Atrophy also predicts the conversion from MCI to AD [19–21], which could possibly be utilized in treatment decision guidelines in the future [22, 23]. The key to distinguishing different neurodegenerative diseases lies in the identification of disease-related patterns of atrophy that occur before the process becomes widespread [9, 24]. In AD, there are both nonspecific and specific structural MRI findings, of which the most essential is medial temporal lobe atrophy [9, 24–31].
Structural changes can be assessed both qualitatively by visual rating scales [33, 34] and quantitatively by using partly or fully automated objective volumetric computational methods from single measures to whole brain segmentation [21, 36]. However, data on the practical feasibility of automated algorithm-based segmentations are limited, and the methods are not widely used outside of research cohorts [37].
Laboratory and imaging biomarkers are highly correlated with the neuropathological lesions of AD and appear to be appropriate for research populations with a narrow spectrum of diagnostic groups [2, 38–40]. There are a few research cohort databases available; among these databases, the Alzheimer’s Disease Neuroimaging Initiative (ADNI) is the most cited and studied [41]. However, highly selected research cohorts might not be representative samples of real-world populations [1, 37]. To implement the use of biomarkers in routine clinical practice, validation studies need to be extended to representative unselected heterogeneous samples, including patients presenting very early in the course of the disease [1, 9, 42].
At present, some results have been published from clinical cohorts, but these results have certain limitations, such as providing only visual assessments of medial temporal lobe atrophy from multiple imaging modalities, e.g., CT and MRI, with CSF biomarkers [43–46]. Recently, Dolci et al. published a study that included CSF and qualitative MRI measurements but in a limited number of diagnostic groups that did not use the meaningful nomenclature of the new lexicon introduced in 2010 or the novel NIA-AA framework [1, 47]. Consequently, there are limited data on CSF and quantitative imaging biomarkers from diverse study samples, such as population-based cohorts [1].
During recent decades, the paradigm of AD has evolved from a clinical syndrome [48] to a clinicopathological entity [9] to a biological construct [1]. In 2018, the NIA-AA research framework [1] was introduced in which the diagnosis is based on a biomarker profile instead of clinical consequences, which also has some conceptual and practical implications that should be widely debated [49]. The biomarkers are grouped into amyloid-β deposition, pathologic tau, and neurodegeneration, which enables the grouping of different imaging and biofluid biomarkers by the pathologic processes they measure [1].
In summary, the concept of AD is moving from a clinical syndrome to a completely biological construct, suggesting that the diagnosis is based entirely on biological manifestations of the pathological process. Biomarkers have been extensively studied but mostly in highly selected research cohorts; thus, the evidence of functionality in clinical use needs clinical cohort studies to extend understanding in all three aspects including Aβ plaques, tauopathy, and neurodegeneration [AT(N)]. In our study, the characteristics of these biomarkers, including CSF and imaging biomarkers, were examined in a novel clinical cohort, thus providing evidence of applicability in clinical practice.
MATERIALS AND METHODS
Subjects
This study was conducted as a retrospective register study between 2004 and 2011, with data collected from the neurology polyclinic of Kuopio University Hospital (KUH) and Biomarkers for Neurodegenerative Disorders laboratory of University of Eastern Finland (UEF). The patient selection comprised two steps (see Fig. 1 for the flowchart of patient selection).
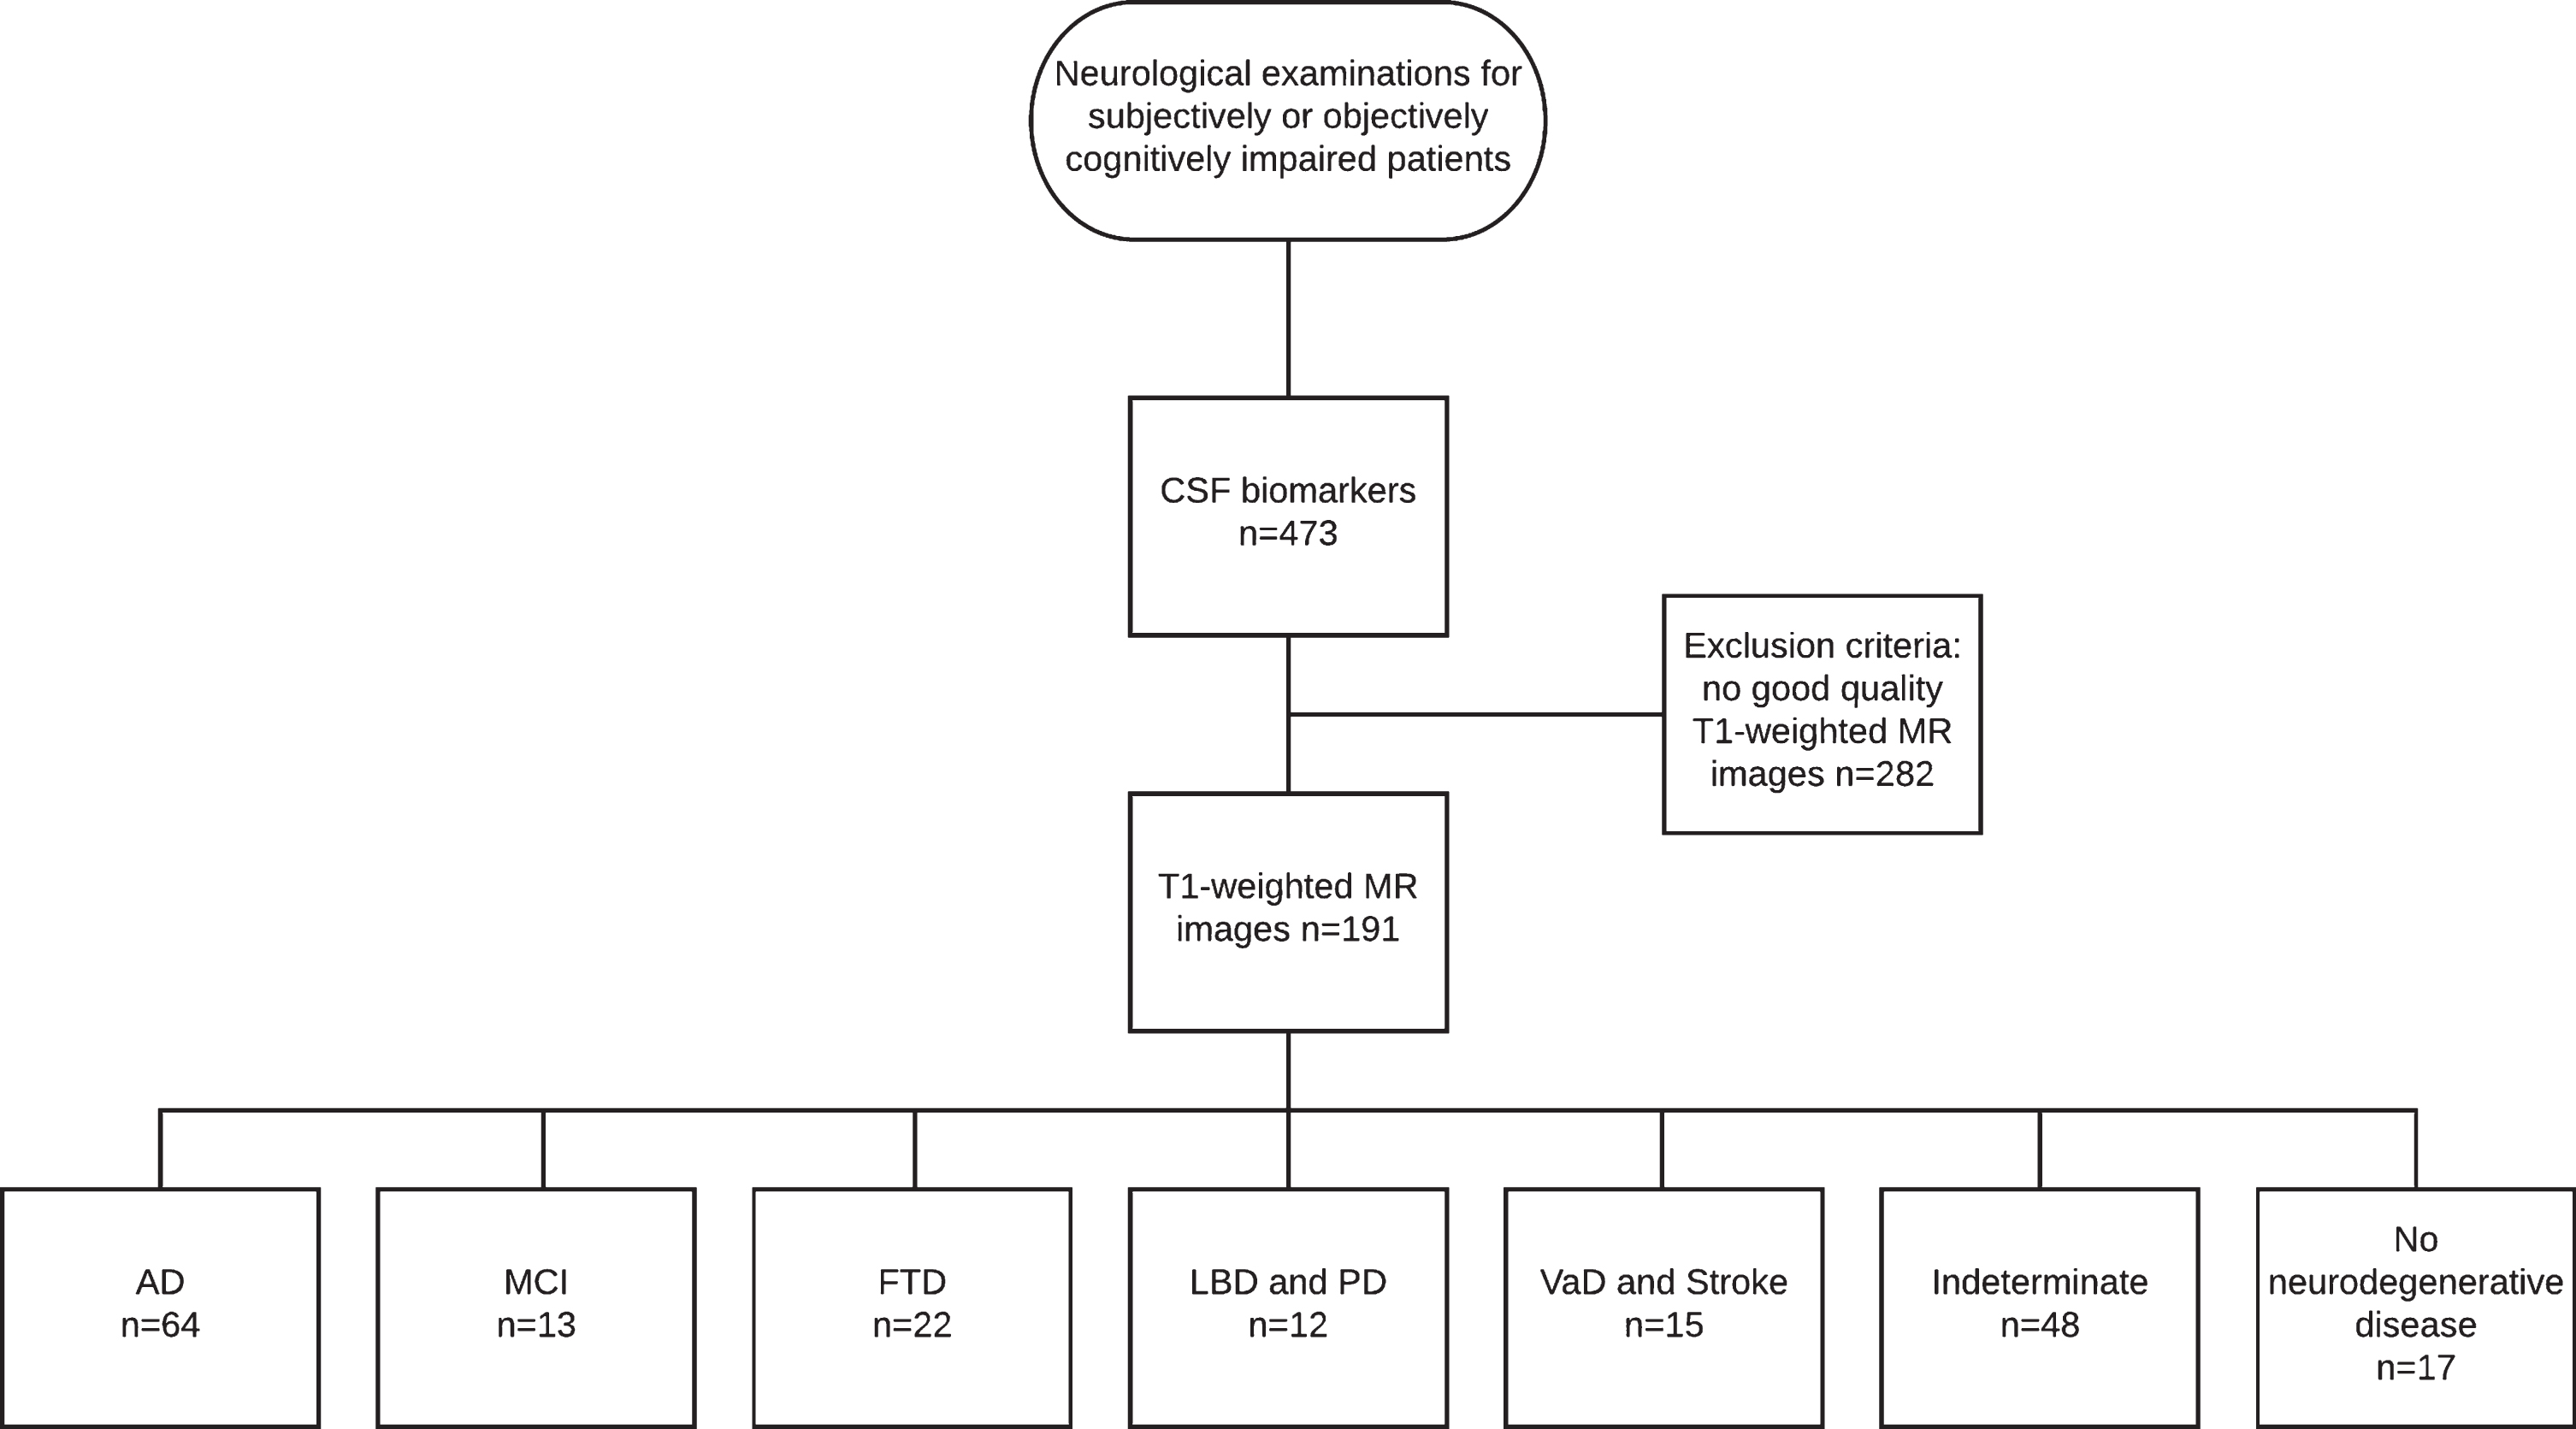
Flowchart of patient selection.
In the first step, patients referred from primary or special health care between 2004 and 2010 due to subjective or objective cognitive decline and examined in accordance with the KUH protocol for neurodegenerative diseases were selected.
The data on demographic factors, comorbidities, general risk factors, family risk for AD as well as the history of symptoms and results of clinical investigations were obtained from the patient files. The cognitive test used in the follow-up of the subjects was the Mini-Mental State Examination (MMSE) [50].
All patients whose treating clinician had decided to examine CSF biomarkers, including Aβ42, p-tau, and tau, as part of the clinical work-up were included in the study. CSF biomarkers were analyzed mostly for differential diagnosis, since at that time, there were no national guidelines for CSF biomarkers. The first step resulted in 453 patients.
The second step included all patients with T1-weighted MRI available. The radiologist statements were vetted to exclude patients with significant intracranial alterations or processes such as major strokes or intracranial tumors. After these two steps, the final study group consisted of 191 subjects (95 men) with a mean age of 65.7 years (range 42–84).
The subjects were divided into seven clinical diagnostic groups by clinical diagnosis, which were set at the neurology polyclinic by a neurologist based on current guidelines. The diagnoses were not blinded to the biomarker results, and the clinician had the CSF biomarker data and radiologist statements on the MR images to support the decision making. For AD, the original [48] and revised NINCDS-ADRDA criteria [9] were used, and based on published recommendations [1], clinically ascertained AD was referred to as Alzheimer’s clinical syndrome. Furthermore, frontotemporal lobe dementia [51], dementia with Lewy bodies (DLB) [52], dementia due to Parkinson’s disease (PD) [53], and vascular dementia (VaD) [54] contemporary criteria were used as diagnostic criteria. Follow-up data, whenever available, were used to validate the original diagnosis.
Of the clinical diagnostic groups, the AD group consisted of 55 subjects with Alzheimer’s clinical syndrome and 9 subjects with atypical variants of AD, including nonamnestic focal cortical syndromes such as posterior cortical atrophy [55], which have been neuropathologically confirmed as AD [2]. The MCI group included 13 patients with mild cognitive impairment; the frontotemporal degeneration (FTD) group included 22 patients, the DLB and PD group included 5 patients with DLB and 7 patients with PD; the VaD and stroke group included 6 patients with VaD and 9 with ischemic stroke such as small vessel disease; the indeterminate group included 48 patients without neurodegenerative disease and referred to a heterogeneous population of metabolic, psychiatric or alcohol-related conditions; and the no neurodegenerative disease group included 17 patients with no evidence of neurodegenerative disease underlying the cognitive symptoms. Since the inclusion criteria were based on subjective or objective cognitive impairment, this last group was not considered cognitively normal, although no findings indicative of neurodegenerative disease appeared in the examinations.
CSF biomarkers
The CSF samples were analyzed with a commercial ELISA-method (https://www.fujirebio-europe.com/our-single-parameter-elisa-innotestr-range) in a single laboratory at the UEF, Kuopio. There were no specific cutoff points introduced in the novel NIA-AA research framework [1]. Thus, following concentration cutoff points were considered pathological: CSF Aβ42, under 521 pg/ml [56]; CSF p-tau above, 70 pg/ml; and CSF tau, above 400 pg/ml [57].
The subjects of this clinical sample were also divided into eight different groups according to the [1] novel, specifically intended for research, AT(N) research framework on the basis of pathological findings in the CSF profile. The biomarker of Aβ plaques (labeled “A”) was low CSF Aβ42. The biomarker of fibrillary tau (labeled “T”) was elevated CSF phosphorylated tau (p-tau). The biomarker of neurodegeneration or neuronal injury [labeled “(N)”] was CSF total tau (t-tau) [1]. Although discordances between imaging and CSF biomarkers may occur [58–63], because of the long-term process of AD, the ongoing active pathologic state, indicated by CSF measures and the accumulation of neuropathologic load indicated by imaging measures will be concordant over the long term [1].
A-T-(N)- refers to normal AD biomarkers. A + T-(N)- refers to Alzheimer’s pathologic change, and A + T+(N)- and A + T+(N)+ refer to AD on the Alzheimer’s continuum. A + T-(N)+ refers to Alzheimer’s and concomitant suspected non-Alzheimer’s pathologic changes. A-T+(N)-, A-T-(N)+, and A-T+(N)+ refer to non-AD pathologic changes. Because of the marginal sample size of certain groups, these subgroups were combined for the multivariate analysis, resulting in three groups: 1) normal AD biomarkers, 2) amyloid-positive biomarkers, and 3) amyloid-negative biomarkers [1].
MRI data acquisition
All of the subjects in this study underwent high-resolution MRI. The indication for imaging was not primarily for this study but for diagnostics. The images were acquired by using 1.5 T MRI scanners by several manufacturers, such as Philips and Siemens (Magnetom Avanto and Vision models) with protocols optimized for each type of scanner in the Department of Clinical Radiology, KUH. Multiple scanners were used since there were several scanners available at the hospital, and the scanners were sometimes updated and/or replaced.
At each site, a circularly polarized head coil was used for radiofrequency (RF) transmission and reception. A high-resolution 3D T1-weighted magnetization-prepared rapid acquisition with gradient echo (MPRAGE) volume was used as the imaging protocol. Imaging parameters were optimized for each scanner. Full brain and skull coverage was required for analysis of the images, and detailed quality control was carried out on all MR images [64].
Image analysis
Cross-sectional MR images were segmented using the structural tool of the FreeSurfer software package [65] with a standardized protocol [66, 68–75].
The FreeSurfer pipeline tool calculated the regional cortical thickness from 34 different areas and the regional cortical volume from 24 areas in each hemisphere. Some of the volumes, such as white matter hypointensities, optic chiasm, right and left vessels, and choroid plexus, were excluded as nonsignificant parameters in terms of clinical importance. All volumes were normalized by each subject’s intracranial volume [83], and the statistical analyses were conducted with the mean value of both left and right regional volumes and thicknesses [84, 85]. This process resulted in a total of 67 imaging variables (Table 4).
Statistical analyses
Statistical analyses were conducted using both R-studio (v. 1.1.383) and IBM SPSS (v. 24.0). The significant differences in the frequencies of categorical variables (sex and diagnostic and AT(N) profile groups) were tested with Pearson’s chi-square test. One-way analysis of variance (ANOVA) was used to test the significance of differences in CSF Aβ42, p-tau, and tau concentrations as well as MMSE scores between groups based on 1) clinical diagnosis and 2) AT(N) profile.
Univariate analysis of covariance (ANCOVA) adjusted for age and sex of the patient was used to test differences in imaging variables, including volumetric and cortical thickness, between clinical diagnosis and AT(N) profile groups. Before fitting the models, variables deviating from a normal distribution were normalized using a natural logarithmic transformation. The normality of a distribution was tested with a method where the skewnesses of the native and logarithm transformed variables were contrasted, and normalization was performed when the logarithmic transformation noticeably improved the frequency distribution of a given variable compared to the distribution of the native data. All imaging and CSF biomarker data were centered on the mean and scaled to standard deviation. Due to multiple cross-sectional analyses, the rate of significant findings was adjusted using the false discovery rate (FDR) correction [86]. The thresholds for statistical significance of imaging variables for the diagnostic and AT(N) profile groups were corrected from p < 0.05 to p < 0.005 and p < 0.0009, respectively.
As a result, we obtained several regions of interest (ROIs): 1) hippocampus, 2) amygdala, 3) inferior lateral ventricle, 4) entorhinal cortex, 5) lingual cortex, 6) inferior parietal cortex, and 7) isthmus cingulate cortex. A mean difference in the volume or thickness of each ROI across groups stratified by both clinical diagnosis and AT(N) profile was separately tested using Fisher’s least significant difference (LSD) post hoc test as part of the ANCOVA model.
Statement of ethics
Approval for the research was received from the Research Ethics Board of the KUH, and the study was conducted in accordance with the principles of the Declaration of Helsinki.
RESULTS
Clinical data
The demographic and clinical data for the diagnostic groups are presented in Table 1. There was no significant difference in terms of sex by clinical diagnosis. The AD and FTD patients were significantly older than the patients with no neurodegenerative disease (p < 0.001). There were significant differences in the MMSE scores among the diagnostic groups (p = 0.018). The demographic data from the AT(N) profile are presented in Table 2. Based on the AT(N) profiles, there were no significant differences in age, sex, or MMSE scores among the groups (p = 0.072; χ2 = 7.929; p = 0.339; p = 0.529; respectively).
Descriptive statistics of demographic data by diagnostic groups
The value for age, MMSE and CSF biomarkers are given as the means±standard deviation (SD). The unit of measure for CSF markers is pg/ml. Statistical significances between diagnostic groups were tested using One-Way ANOVA* and Pearson Chi-Square test**. MMSE, Mini-Mental State Examination; Aβ42, amyloid-β; AD, Alzheimer’s disease or Alzheimer’s disease atypical variant; MCI, mild cognitive impairment; FTD, frontotemporal dementia; LBD and PD, Lewy’s body dementia and Parkinson’s disease combined; VaD and stroke, vascular dementia and stroke combined; Indeterminate, Indeterminate condition; No diagnosis, no neurodegenerative disease.
Descriptive statistics of demographic data by AT(N) profile groups
The value for age, MMSE and hippocampal volume are given as the means±standard deviation (SD). The unit of measure for hippocampal volume is cm3. Statistical significances were tested using One-Way ANOVA* and the Pearson Chi-Square test**. Subjects were divided into different groups in terms of novel AT(N) classification by the existence of amyloid pathology as A, tauopathy as T, and neurodegeneration as (N). MMSE, Mini-Mental State Examination; A, biomarker of Aβ plaques (labeled “A”) is low CSF Aβ42; T, biomarker of fibrillary tau (labeled “T”) is elevated CSF phosphorylated tau (P-tau); [N], biomarker of neurodegeneration or neuronal injury [labeled (“N”)] is CSF T-tau.
All CSF biomarker levels significantly differed among the clinical diagnostic groups. The CSF Aβ42 levels were significantly different between the AD group and every other clinical diagnostic groups, with the exception of the DLB and PD combined group and the VaD and stroke combined group (p < 0.001). There were also significant differences in CSF Aβ42 levels between the no neurodegenerative disease group and every other clinical diagnostic group except for the MCI group (p < 0.001). The CSF Aβ42 concentrations were lowest in the AD group (440±156 pg/ml) and highest in the no neurodegenerative disease group (783±227 pg/ml). The CSF p-tau and t-tau levels significantly differed between the AD group and every other diagnostic group except for the DLB and PD combined group (p < 0.001 and p < 0.001, respectively). The CSF p-tau and t-tau concentrations were highest in the AD group (80±31 and 522±255 pg/ml, respectively) and lowest in the no neurodegenerative disease group (57±20 and 215±96 pg/ml, respectively).
The AT(N) profiles were significantly associated with clinical diagnostic groups (χ2 = 71.22, p = 0.003). Of 54 AD subjects, 22 had amyloid pathology, tauopathy, and neurodegeneration (A + T+(N)+), 11 had amyloid pathology without tauopathy or neurodegeneration (A + T-(N)-), and 6 had completely normal CSF AD biomarkers. In the MCI group, none had completely abnormal CSF AD biomarkers (A + T+(N)+), 2 patients had amyloid pathology without tauopathy and neurodegeneration (A + T-(N)-), and 8 patients had normal AD biomarkers (A-T-(N)-). Of those in the no neurodegenerative disease group, none had completely abnormal AD biomarkers (A + T+(N)+), and 10 subjects had normal AD biomarkers (A-T-(N)-) (Table 3).
AT(N) profile by diagnostic group
There was a statistically significant difference between all groups (χ2 = 71.22, p = 0.003). AD, Alzheimer’s disease or Alzheimer’s disease atypical variant; MCI, mild cognitive impairment; FTD, frontotemporal dementia; LBD and PD, Lewy’s body dementia and Parkinson’s disease combined; VaD and stroke, vascular dementia and stroke combined; Indeterminate, indeterminate condition; No diagnosis, no neurodegenerative disease; A, biomarker of Aβ plaques (labeled “A”) is low CSF Aβ42; T, biomarker of fibrillary tau (labeled “T”) is elevated CSF phosphorylated tau (P-tau); [N], biomarker of neurodegeneration or neuronal injury [labeled (“N”)] is CSF T-tau.
List of volumetric and cortical thickness variables
In multivariate analysis by diagnostic group, we found differences in several ROIs, including the hippocampal, amygdalar, and inferior lateral ventricular volumes in addition to the entorhinal, lingual, inferior parietal and isthmus cingulate cortical thicknesses (Figs. 2A and 3A). There were significant differences in hippocampal and amygdalar volumes between the AD group and every other diagnostic group (p < 0.001 and p < 0.001, respectively) (Fig. 2B). The average volume of the hippocampus was 1.91 cm3 in the AD patients and 2.49 cm3 in the patients with no neurodegenerative disease. The amygdalar volume was 0.70 cm3 in the AD group and 0.87 cm3 in the no neurodegenerative disease group. Furthermore, there were significant differences in entorhinal cortex thickness between the AD group and the indeterminate and no neurodegenerative disease groups (p < 0.001) (Fig. 3B); in particular, the entorhinal cortex was 2.78 mm in the AD patients and 3.29 mm in the patients with no neurodegenerative disease.
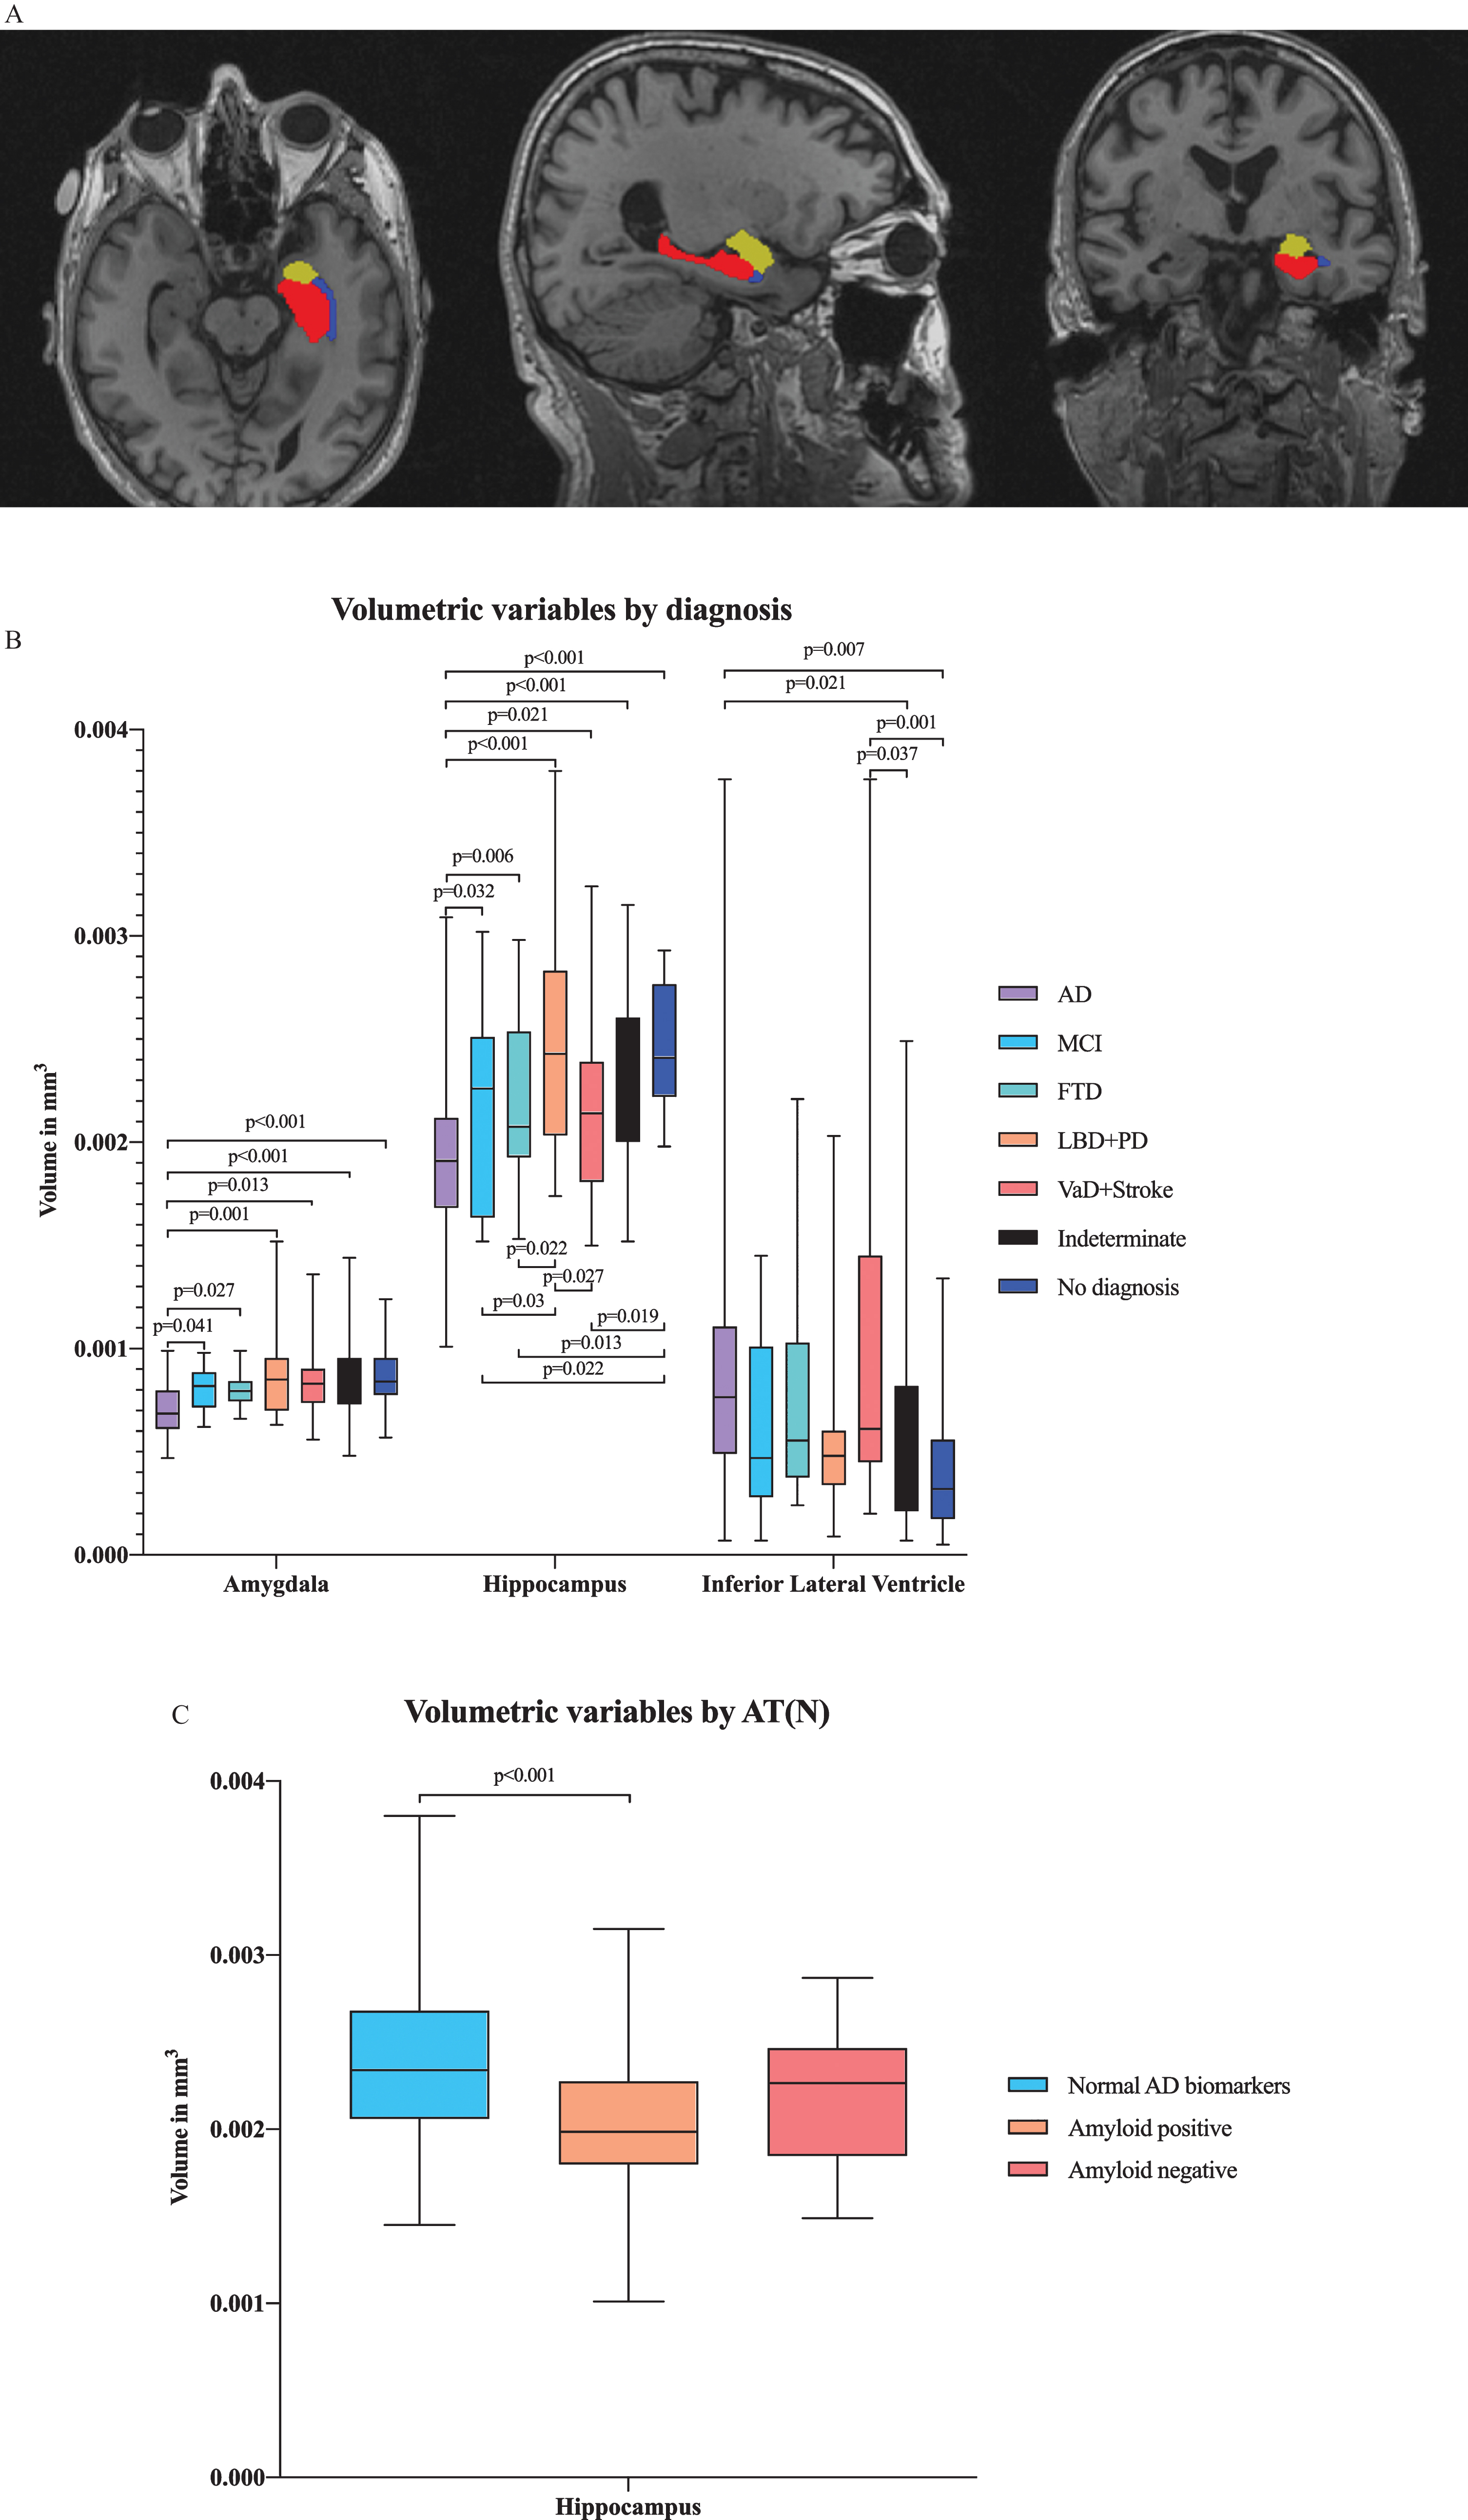
A) Illustration of volumetric regions of interest (ROIs) from separate ANCOVA models by both AT(N) profile and diagnostic group in the same figure in axial, sagittal and coronal plane. ANCOVA models by AT(N) profile resulted in volumetric ROI, including the volume of hippocampus, and by clinical diagnosis, resulted in ROIs, including the volumes of hippocampus, amygdala and inferior lateral ventricle. Red refers to the hippocampus, yellow to the amygdala and blue to the inferior lateral ventricle. B) Volumetric variables by different diagnostic groups. Only the p-values from significant comparisons are shown. C) Volumetric variables by AT(N) profile. Only the p-values from significant comparisons are shown.
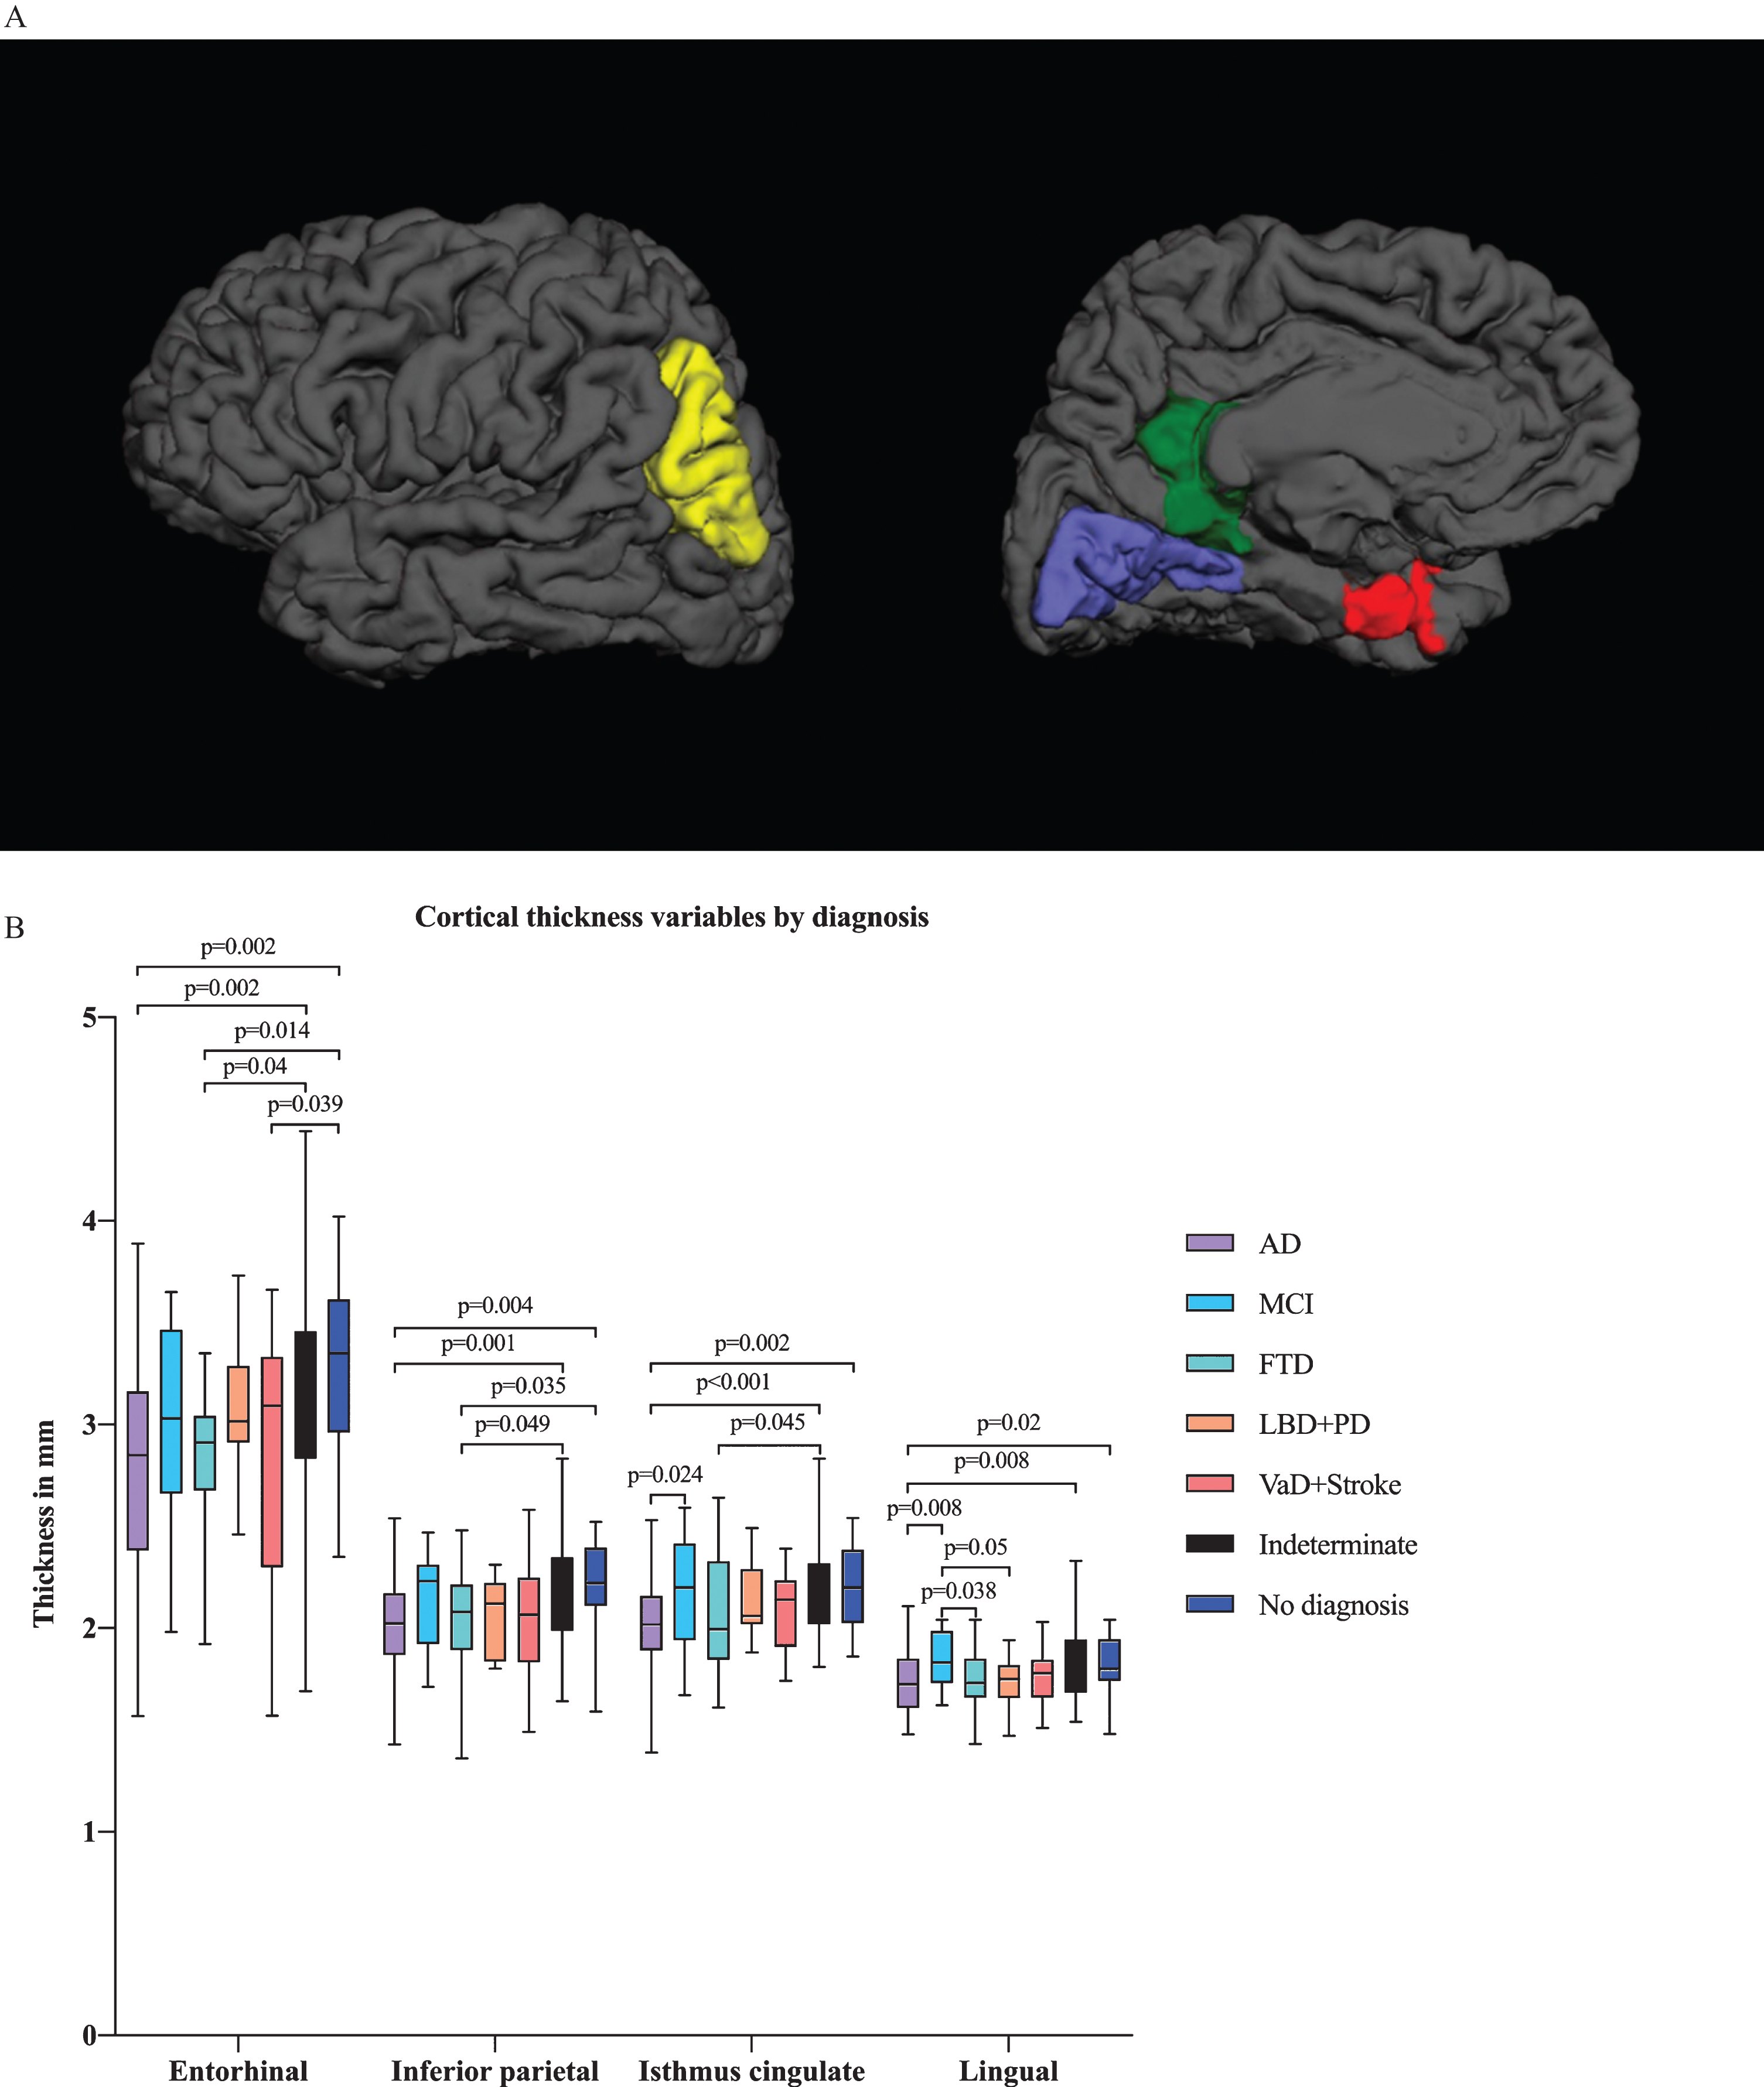
A) Illustration of cortical thickness regions of interest (ROIs) from the ANCOVA model by diagnostic group from lateral and medial views. The ANCOVA model by clinical diagnosis resulted in ROIs including entorhinal, lingual, inferior parietal and isthmus cingulate cortical thicknesses. Red refers to the entorhinal cortex, blue to the lingual cortex, green to the isthmus cingulate cortex and yellow to the inferior parietal cortex. B) Cortical thickness variables by diagnostic group. Only the p-values from significant comparisons are shown.
Comparing changes in brain region volumes and cortical thicknesses between different AT(N) profiles revealed that hippocampal volumes significantly differed between the normal AD biomarker and amyloid-positive biomarker groups (p < 0.001) (Fig. 2 C). The hippocampal volume was 2.37 cm3 in the patients with normal AD biomarkers and 2.05 cm3 in the patients with amyloid pathology.
DISCUSSION
The aim of this retrospective register-based study was to assess how CSF and MRI biomarkers performed in a memory clinic cohort with subjects with various neurodegenerative diseases and subjects with cognitive symptoms without evidence of neurodegenerative pathology pooled together. These biomarkers have been increasingly studied in research studies, but the validation of their clinical usefulness has been incomplete [37]. In 2018, Jack et al. presented a novel AT(N) research framework [1] and suggested that AD is defined by the expression of pathologic processes. The inclusion of AD biomarkers in studies of diverse populations that use this research framework was encouraged [1]; thus, further real-world clinical studies with both CSF and quantitative MRI biomarkers are needed. Our study offers a completely new heterogeneous dataset that included both CSF biomarkers and quantitative analyses of MR images.
The CSF biomarkers appeared to distinguish the different clinical diagnostic groups, mainly as expected, when we used the novel AT(N) model. As suggested, we used t-tau to define neurodegeneration instead of brain atrophy since these measures are concordant in the long term [1]. However, there were a few patients in every diagnostic group that did not seem to fit the biomarker type. This might be explained by overlap in the different neuropathologies. In previous studies, some of the healthy controls or cognitively normal controls have exhibited amyloid pathology as preclinical AD pathologic changes [87]. However, these findings were primarily consistent with the definition of AD as a continuous process in both cognitive and biomarker domains [1].
In the multivariate analysis by clinical diagnosis, numerous volumetric and cortical thickness variables were significantly different. Atrophy of the medial temporal lobe, including the hippocampus, amygdala, and entorhinal cortex, is a well-known imaging biomarker for AD [9, 24–31]. Additionally, the cingulate gyrus and temporoparietal regions are affected by the pathologic process of AD [88, 89]. Thus, the volumetric and cortical thickness variables by clinical diagnosis were generally in line with previous results from research cohorts providing evidence of the feasibility of using these biomarkers in clinical practice. Somewhat surprisingly, there were no additional significant ROIs. This finding might be explained by the relatively small group sizes and multiple neurodegenerative disease groups, which have general atrophy in common, particularly regarding disease progression. Importantly, pathognomonic signs, such as hippocampal atrophy, distinguished the groups well. However, in the multivariate analysis by the AT(N) profiles, only hippocampal volume significantly differed. Apparently, according to these data, AT(N) profile groups do not have many clear, differentially affected brain regions that would reflect the pathologic processes detected in CSF biomarkers.
Although the novel AT(N) classification provides a means for biological characterization, has a common lexicon and has been greatly endorsed, certain limitations and discrepancies should be discussed [49]. The validation of biomarkers is imperfect, and they might not be sufficiently sensitive or specific for the clinical syndrome [49]. In research cohorts, the classification accuracy of MRI biomarkers varies, but appears to improve when using multiple MRI biomarkers combined or quantitative methods instead of visual MRI ratings [21, 90–92]. CSF biomarkers appear to have better sensitivity than specificity proposing greater utility to exclude AD etiology than include [93, 94]. Not all of the patients with cognitive impairment have abnormal biomarker profiles and vice versa [95]. Moreover, dementing processes are not invariably distinct, and there is overlap between disease categories. This classification system has also been criticized for the lack of practical guidance on standardizing the measurement processes or interpreting conflicting biomarker results and for combining neurodegenerative pathologies other than AD into a single group [49]. However, this study provides further data in support of the AT(N) model.
Another consideration regarding this study is the use of different MRI scanners in MRI data acquisition. Several scanners with optimized imaging parameters were used since multiple scanners were available at the hospital, and the scanners were occasionally updated and/or replaced. These differences might have had some impact on the imaging results, especially for the cortical thickness measures rather than surface areas and volume measures [96]. However, in previous studies, the use of multiple different MRI scanners, pulse sequences, or spatial resolutions did not appear to have a significant effect on the measured cortical thickness [97] or a clear effect on the results with other structural MRI measures [98]. In addition, the scanners in clinical use usually vary depending on the center, meaning that a setting with multiple scanners represents real-world circumstances better than a strictly planned imaging protocol. Furthermore, the results were logical and consistent with the results from previous literature, meaning that the imaging methodology was most likely quite robust and tolerated minor variance in the imaging data without having a significant impact on the results. In future studies, correction for the scanner manufacturer would minimize variance that was not due to the variables of interest [99].
The diagnostic process needs to be considered because of the risk for circular reasoning since the biomarker data were available for the clinician. The clinical diagnosis was set by the predominant [9] guidelines based on clinical manifestations and biomarkers as supportive features. However, the CSF biomarkers were not required for the clinical diagnosis, which was founded on the overall picture combining the clinical and neuropsychological assessments as well as qualitative atrophy on MRI. This explains why there were patients with clinically diagnosed AD with normal CSF biomarkers, which suggests that the possibility of circular reasoning was less probable. Furthermore, the clinical diagnosis established by the neurologist was not definitive and might have been incorrect. Additionally, the cutoff points for CSF concentrations do not unambiguously separate the pathological findings from normal findings, and there are no specific cutoff points included in the novel NIA-AA research framework [1].
Our cohort provided a diverse sample, but certain special characteristics need to be taken into account. The mean age of the cohort was 65 years, which is relatively low in comparison with general community dementia sample epidemiology. Additionally, rarer dementia types were clearly overexpressed. This might be explained by the highly selected nature of the cohort.
The primary cohort was chosen from patients referred to a tertiary memory clinic who had undergone CSF biomarker analysis along with neurological and cognitive examinations due to a subjective or objective cognitive impairment. At that time, CSF biomarker analysis was a novel method that was included in Finnish guidelines in 2010. Thus, the need for additional CSF biomarker analysis was based on neurologists’ discretion, and CSF biomarkers were probably usually analyzed from younger patients in the early phase of neurodegenerative disease or as a differential diagnostic method in unclear cases.
From the 453 patients with CSF biomarkers, 191 patients who had also undergone MRI examinations with T1 sequences were selected. Consequently, the final cohort had passed two exclusion criteria. Thus, this cohort cannot be considered to represent a typical population-based sample or a primary health care cohort. However, this selection process offered a high-quality and comprehensive cohort of patients with various neurological conditions who had both CSF biomarkers and MRI results of a high standard available. Additionally, considering the costs, invasiveness and rigidity of these extensive examinations, it would probably not be meaningful or even possible from an ethical view to collect a pure population-based cohort in a similar fashion.
Although the results in this study are in line with previous literature and provide important validation data regarding the use of biomarker profiling in memory clinic research, further research is warranted with analysis of individual level performance as well as with larger clinical cohorts, including cognitively normal subjects and potentially other imaging biomarkers, such as amyloid and tau PET.
Conclusions
Our study suggests that both CSF and MRI volumetric and cortical thickness biomarkers perform well in clinical practice with multiple neurodegenerative diagnostic groups outside of well-curated research cohorts. The findings provide evidence that validate these biomarkers for clinical use.