
Abstract
BACKGROUND:
Muscle fatigue is nearly unavoidable during resistance exercise, yet evaluating it in such circumstances can be challenging.
OBJECTIVE:
This study aimed to evaluate the validity of using the rating of perceived exertion (RPE) as a measure of muscle fatigue during non-explosive bench press (BP) exercise.
METHODS:
Fifteen male collegiate athletes participated in three BP tasks set at 65% of their one-repetition maximum. The RPE, spectral fatigue index (SFI), and velocity loss were measured across different experimental conditions.
RESULTS:
Significant effects were observed across different experimental conditions for the overall RPE, average velocity loss, and average SFI (all
CONCLUSIONS:
The corresponding changes observed in the RPE, velocity loss, and SFI suggest that both the RPE and velocity loss can be used as indicators of muscle fatigue during non-explosive BP exercise. However, due to the strong correlation between the RPE and SFI, RPE is more effective for reflecting muscle fatigue in non-explosive resistance exercise settings. Regarding ease of use, the RPE is more suitable than velocity loss for assessing muscle fatigue in training scenarios.
Keywords
Background
Resistance exercise is effective in increasing muscle strength and power [1]. Muscle fatigue is believed to be an almost inevitable outcome during resistance exercises, which can negatively impact athletic performance, including peak power and velocity, due to a decrease in the force and/or power-generating capacity of the muscles involved [2]. In addition, muscle fatigue is associated with acute injury risks and may even lead to chronic soreness [3, 4]. Accordingly, it is very important for practitioners, such as physical therapists and strength coaches, to have a clear understanding of the muscle fatigue levels of the individuals with whom they work. Muscle fatigue is linked to numerous physiological responses and can be detected through various physiological measures, such as changes in muscle force output and blood lactate levels [2, 5]. For instance, previous studies have demonstrated that changes in blood lactate levels can serve as reliable and important indirect indicators of muscle fatigue during resistance exercises [2, 6]. However, many of these measures require invasive techniques, such as fingertip puncture, which can cause discomfort to participants. Non-invasive measures of muscle fatigue, such as those using special devices, such as isokinetic dynamometers (e.g., the Biodex dynamometer), are often required for this purpose. Therefore, many conventional measures of muscle fatigue may not be suitable for use in resistance exercise settings.
Surface electromyography (sEMG) is a widely used non-invasive technique for assessing neuromuscular function in various fields, including neuroscience, sports science, and clinical settings [7, 8]. Electromyographic signals obtained during muscle contractions can be used to detect responses in neuromuscular function induced by muscle fatigue [7, 9]. Over the past half century, numerous studies have utilized sEMG to measure muscle fatigue, and it has been demonstrated that sEMG provides reliable information on the underlying mechanisms of muscle fatigue [10]. During muscle fatigue, the power spectrum of sEMG signals tends to compress toward lower frequencies, which is thought to reflect changes in the muscle fiber conduction velocity, recruitment, and synchronization of motor units [11]. Specifically, the compression of the power spectrum causes a decrease in the frequency of the sEMG signal [7, 12]. Thus, decreases in the frequencies of the power spectrum are conventionally thought to be caused by the occurrence of muscle fatigue, and the mean and median frequencies are usually used as muscle fatigue estimators [13]. However, there are several limitations and barriers to assessing muscle fatigue using sEMG during resistance exercises, such as issues related to equipment and data reliability [7, 13]. For instance, sEMG-based muscle fatigue assessment during dynamic contractions requires considerable technical expertise and caution, and even mathematical simulations, which are almost impossible to perform in resistance exercise scenarios [7, 12, 13]. Therefore, a more accessible muscle fatigue assessment is needed in this context.
Recently, with the increased popularity of velocity-based training, velocity loss has been proposed as a reliable indicator of muscle fatigue in resistance exercises [2, 14]. Because of the widespread use of velocity measures, velocity-based muscle fatigue assessments are becoming easier to implement during resistance exercise [15, 16]. Moreover, studies have shown that velocity loss is significantly correlated with metabolic and mechanical measures of muscle fatigue during explosive resistance exercises, such as the explosive bench press (BP) [2, 14]. However, these studies only examined the relationship between velocity loss and muscle fatigue when participants were required to perform exercises at the maximal intended velocity. For muscular hypertrophy-aimed training programs, the lifting cadence is usually determined because the time-under-tension, which refers to the time the muscle spends under mechanical tension, is considered crucial for muscle protein synthesis [17]. Furthermore, for inexperienced athletes and athletes with injuries, performing exercises in an explosive manner may be inappropriate due to these individuals’ lack of strength, joint stability, and adequate lifting techniques [1]. Thus, the validity of using velocity loss as a muscle fatigue indicator remains unknown when resistance exercises are not performed at maximal intended velocity. Accordingly, the validity of using velocity loss as a muscle fatigue indicator in non-explosive settings needs further verification.
The rating of perceived exertion (RPE) scale is a subjective perception-based assessment method that combines numbers, verbal, and pictorial descriptors [18, 19, 20]. The RPE has been shown to be associated with various physiological responses, including neuromuscular fatigue levels and heart rate, during aerobic exercise [19, 21]. Over the past three decades, the use of the RPE has become more popular in resistance exercise situations. For example, it has been reported to capture important information about resistance exercises, such as the percentage of one-repetition maximum (1RM), blood lactate levels, and muscle activation levels [22, 23, 24]. Accordingly, practitioners – such as coaches and personal trainers – have started to use the RPE to quantify the intensity of resistance exercises. Despite the differences between several RPE scales (e.g., the OMNI scale and the Borg CR-10 scale), all are considered to be effective and easy-to-use tools for professionals to monitor resistance exercises. Based on the relationships between the RPE and many physiological measures, the RPE scale may also reflect muscle fatigue responses to resistance exercise. However, the relationship between the RPE and muscle fatigue has only been examined for certain exercises [12, 25, 26, 27, 28]. Therefore, further research is needed to determine this relationship in non-explosive resistance exercises.
By utilizing the new sEMG processing technique, it may be possible to establish the relationship between the RPE and muscle fatigue during dynamic contractions. This could allow professionals to monitor muscle fatigue more simply and in a timely manner. Accordingly, the aims of the present study are as follows: 1) to inspect the validity of using the RPE to assess muscle fatigue through new sEMG-based techniques and 2) to examine the validity of the RPE and velocity loss as muscle fatigue measures during non-explosive BP exercise. We hypothesized that 1) with increasing muscle fatigue, the RPE and velocity loss would change correspondingly and 2) significant relationships between the RPE and muscle fatigue and between velocity loss and muscle fatigue would be observed. However, as previous studies have shown that the RPE is a more precise muscle fatigue indicator than velocity loss in non-explosive exercises [27, 28], we hypothesized that 3) the RPE would also be more accurate than velocity loss as a muscle fatigue indicator when BP was not performed explosively.
Methods
Participants
The sample size was determined using a statistical power analysis employing an ANOVA model that included fixed effects, main effects, and interaction analyses (G*Power 3.1, Bonn University, Germany). The statistical input parameters were based on an effect size of 0.4 and an alpha level of 0.05, with a power of 0.95 [25, 27]. To meet the minimum required of 14 participants for this study, we recruited 15 collegiate ice hockey athletes who had no neuromuscular or skeletal muscle injuries and were not taking any medical treatment. The participants were active collegiate athletes who regularly engaged in daily training activities and participated in national- and regional-level collegiate ice hockey competitions (ranking within the top eight levels of national competition during the year of the present study). All participants were experienced with resistance exercise. The descriptive data of all participants were as follows (mean
Experimental design
This study utilized a counterbalanced, crossover design to examine the validity of Borg’s CR-10 scale and velocity loss as measures of muscle fatigue during non-explosive BP exercise. The choice of BP as the experimental exercise was based on its widespread use in resistance exercise programs. The protocol consisted of two separate test sessions that were at least 72 hours apart. During the initial test session, the participants were carefully instructed on the use of Borg’s CR-10 scale, and their descriptive information was obtained. An anchoring trial was then performed to establish the upper and lower limits of perceived exertion for the experimental session, which is one of the standard procedures for RPE calibration [14, 23, 29]. This trial was conducted with a single set of non-explosive BPs until physical failure [14]. The maximum number of successful repetitions was recorded to calculate the required number of repetitions for the subsequent experimental trials. During the experimental session, the participants completed three experimental conditions, consisting of 30% (low, L), 60% (medium, M), and 90% (high, H) volume, in a counterbalanced order. The volume of the experimental condition was calculated by multiplying the percentage of 1RM by the required number of repetitions. The number of repetitions needed for each condition was calculated based on the number of repetitions the participants successfully completed in the anchoring trial. The conditions were implemented in a counterbalanced order, and the RPE scores, sEMG signals, and velocity were recorded for all conditions and used for further analysis.
Initial session
The initial session began with detailed instructions on the purpose of the study, the experimental protocols, the measurement items, and the potential risks and benefits. Next, the descriptive characteristics of the participants were measured using a bioelectrical impedance device (InBody720 body composition analyzer, Biospace Co. Ltd, South Korea). Subsequently, the BP 1RM was measured according to the guidelines of the National Strength and Conditioning Association [1]. The BPs were performed using a standard Olympic barbell (Uesaka T.E Co., Ltd., Japan). The 1RM measurement included warm-up sets, followed by a progressive increase in weight until the participants successfully performed a BP with their maximal weight for one repetition.
After the initial measurements, each participant was individually instructed on the translated version of the original Borg’s CR-10 scale. The scale ranged from 0 (nothing at all) to 10 (extremely strong) and included verbal anchors for intermediate values to aid in the perception of exertion [18, 30]. The perception of exertion was defined as subjective feelings, such as effort, discomfort, and fatigue in the upper body, during the BP exercise. After that, the participants were instructed on lifting cadence and subsequently performed the specified practice with a barbell. The lifting cadence of each repetition was defined as a 2-s lowering phase (eccentric) followed by a 1-s raising phase (concentric). A 2-s pause was set between repetitions. This lifting cadence was determined according to previous work and recommendations for non-explosive settings [27, 31]. The lifting cadence was controlled using a metronome (one beep per second). After the lifting practice, an anchoring trial was conducted for all participants to establish the range of subjective exertion during the experimental trials. The participants were instructed to perform a single set of BP exercises until they were unable to complete another repetition. The relative intensity for the anchoring trial was set at 65% of the participants’ 1RM [20, 27], which amounted to 56.3
Experimental session
Before the implementation of experimental conditions, a series of warm-up lifts were performed with all participants. The warm-up lifts consisted of three sets of six repetitions of BP at 50% of 1RM [27, 32]. During the BP exercise, the safety bar was again positioned one level above the chest to prevent any impact on the sEMG signal and to eliminate barbell bouncing The participants were instructed to lower the barbell until it slightly touched the safety bar. After the warm-up lifts, they performed a practice round of RPE reporting with only the barbell. The Borg scale was placed vertically in front of the participants and was easily visible. The lifting cadence was set as 2-s for the eccentric phase and 1-s for the concentric phase, with a 2-s pause between repetitions. A metronome was used to control cadence, with one beep per second. The participants were asked to report their subjective exertion for the latest repetition using numbers from the scale during the pause between repetitions.
The experimental conditions were implemented in a counterbalanced order after the warm-up lifts and practice. The required number of repetitions for each condition was calculated based on the number of repetitions the participants successfully completed in the anchoring trial. It has been indicated that the RPE is affected by anticipatory responses to a certain exercise task [33]. To minimize the central governor effect, the participants were not informed of the required number of repetitions before the experimental trials. The participants were not informed of these numbers until the second-last repetition and were required to cease immediately after finishing the last repetition. During the experimental conditions, the participants were asked to report their subjective exertion for each repetition by selecting a number from the scale during the 2 s pause between repetitions. As the number of repetitions increased, it may have become difficult for the participants to maintain the determined cadence; consequently, they were instructed to do their best to follow the beeps of the metronome. After each experimental condition, an overall RPE score was obtained from the participants, representing their overall subjective exertion score for that condition. The participants received detailed instructions, which were consistent with those provided during the initial session before the experimental trials. A 5-min rest interval was allowed between the experimental conditions.
Surface electromyography
The sEMG signals measured from the pectoralis major (dominant side), lateral head of the triceps brachii (dominant side), and anterior deltoid (dominant side) muscles were recorded using bipolar surface electrodes (ADMEDEC Co., Ltd., Japan). Two Ag/AgCl surface electrodes were placed on each muscle, and the distance between the electrodes was set at 1 cm. Prior to electrode placement, the skin was shaved, rubbed with abrasive paper, and cleaned with alcohol swabs to reduce impedance and ensure reliable signal recording [34]. A line indicating the anatomical landmarks was used as a reference frame, and the electrodes were placed on the line according to previous recommendations for electrode placement [35]. The sEMG signals were first amplified using an active differential preamplifier configuration and then transmitted to a wireless device (MARQ MQ-8, Kissei-Com Tech, Japan). The sampling frequency was 1,000 Hz. The sEMG signals were then processed by an analog-to-digital converter and transferred to a dedicated computer. A special camera (FMVU-03MTC-CS, FLIR Systems, Inc., Canada) was connected to the computer to record a motion video synchronized with the sEMG signals during the lifting tasks. The raw sEMG signals were subsequently separated into single repetitions and exported for muscle fatigue analysis.
A fourth-order Butterworth bandpass filter (20–450 Hz) was designed to filter out background noise from the sEMG signals [27, 36]. The filtered signal was used to quantify muscle fatigue under the experimental conditions. The spectral characteristics of the sEMG signals are strongly influenced by dynamic muscle contractions, as mentioned in the Introduction section. To avoid these influences, a validated spectral fatigue index (SFI) was chosen to quantify the muscle fatigue levels in the present study [13]. The SFI has been reported to be more sensitive compared with traditional sEMG-based fatigue parameters (such as the mean and median frequencies) in assessing muscle fatigue during dynamic contractions [9]. A fast Fourier transformation was applied to calculate the power spectrum. The spectral moments were used to extract the characteristics of the power spectral density function and were calculated using Eq. (1):
where
The SFI was calculated for each repetition, and the relative changes in the SFI values for the different repetitions were calculated with respect to the first repetition of each experimental condition. The results obtained from the three muscles were averaged to obtain a single parameter, which was used in subsequent statistical analyses. The sEMG data processing was carried out using MATLAB R2020a (Mathworks, Natick, MA, USA).
To assess the validity of velocity loss as a muscle fatigue indicator in different resistance exercise programs, lifting cadence was controlled in the present study. The velocity during BP was measured using a linear position transducer (Fitro Dyne, FITRONIC s.r.o., Bratislava, Slovakia). The transducer was set directly under the barbell and connected to it with a cable. The sampling frequency was 100 Hz, and displacement changes over time were recorded using a computer. In previous studies that focused on the relationship between velocity loss and muscle fatigue assessment, participants were mostly required to perform resistance exercises explosively and/or until physical failure [2, 14]. However, in lifting programs with a non-explosive design and/or far from physical failure (e.g., at 30% of the maximum volume until failure), lifters may be able to control the weight. In these situations, muscle fatigue may occur, while velocity loss fails to increase. To assess the validity of velocity loss as a muscle fatigue indicator in non-explosive and non-failure settings, the lifting tempo and volume were modified and controlled in this study. Accordingly, the mean velocity of the concentric phase was calculated and used to determine velocity loss. The intra-set velocity loss was calculated using the velocity of each repetition against the fastest repetition of each condition, and it was calculated repetition-by-repetition [2].
Statistical analyses
Overall rating of perceived exertion (RPE), average spectral fatigue index (SFI), and average velocity loss in low- (L), medium- (M), and high- (H) volume bench press tasks (averaged from 15 participants). The 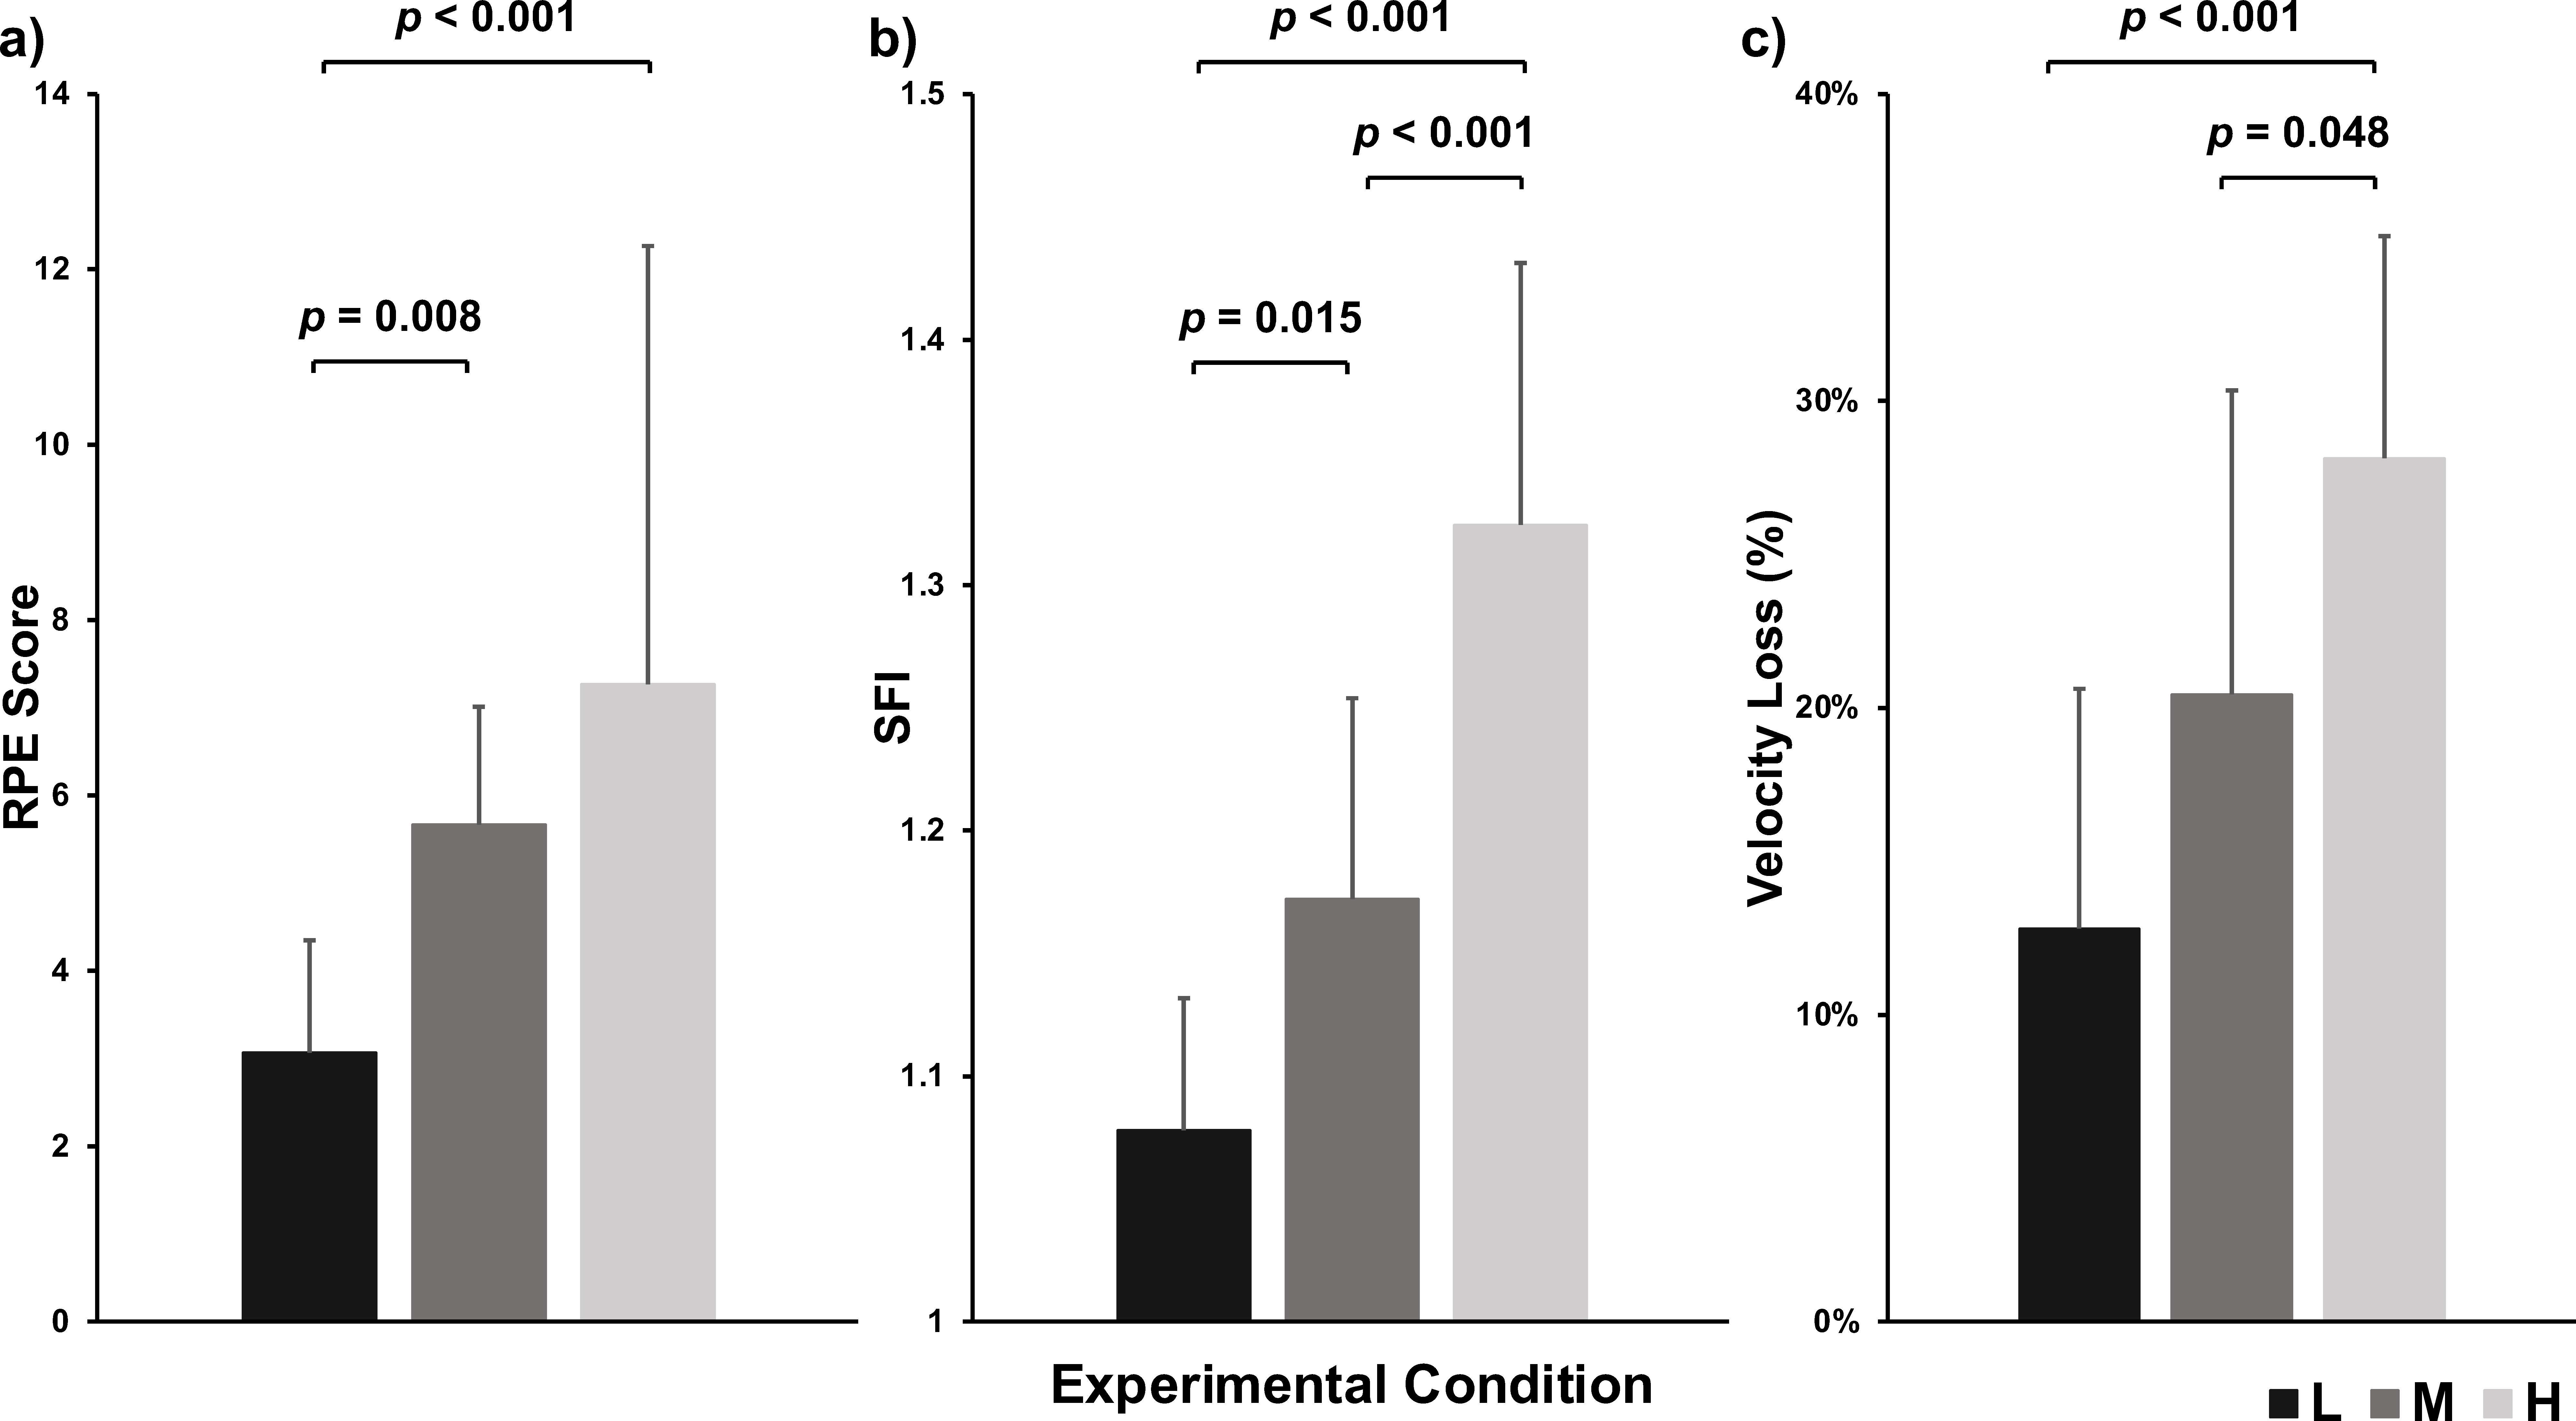
The Shapiro-Wilk test was used to examine the normality of the overall RPE, average velocity loss, and average SFI. Each variable within each condition was examined individually. The average SFI and average velocity loss were fully normally distributed. However, it was observed that the overall RPE of the M condition was not normally distributed. Therefore, a one-way ANOVA was applied to the average SFI and average velocity loss. Next, a post hoc test with Bonferroni correction was applied for multiple comparisons Friedman’s ANOVA was employed to test for differences in the overall RPE among the various conditions. Further, a post hoc test with Bonferroni correction was applied for multiple comparisons. To investigate the RPE, SFI, and velocity loss during the lifting process, the data of selected repetitions of each condition (L, M, and H conditions) were also analyzed. As the required number of repetitions was different for each experimental condition and each participant (L: 2.9
The intra-set RPE, velocity loss, and SFI were used in the correlation analysis [27, 37]. As half of the data was gathered in the 0–60% volume area, only the non-overlapping portions of the three conditions were used for correlation analysis. Specifically, the data included the 0–30% volume range for the L condition, the 30–60% volume range for the M condition, and the 60–90% volume range for the H condition [37]. Next, the two correlation coefficients were compared using Fisher’s r-to-z transformation and paired two-tailed tests. The statistical analysis was performed using SPSS 28.0 (SPSS Inc., USA). The statistical significance level was considered acceptable at
Rating of perceived exertion (RPE), spectral fatigue index (SFI), and velocity loss during low- (L, circle with solid lines), medium- (M, square with dashed lines), and high- (H, triangle with dotted lines) volume bench press tasks (averaged from 15 participants). 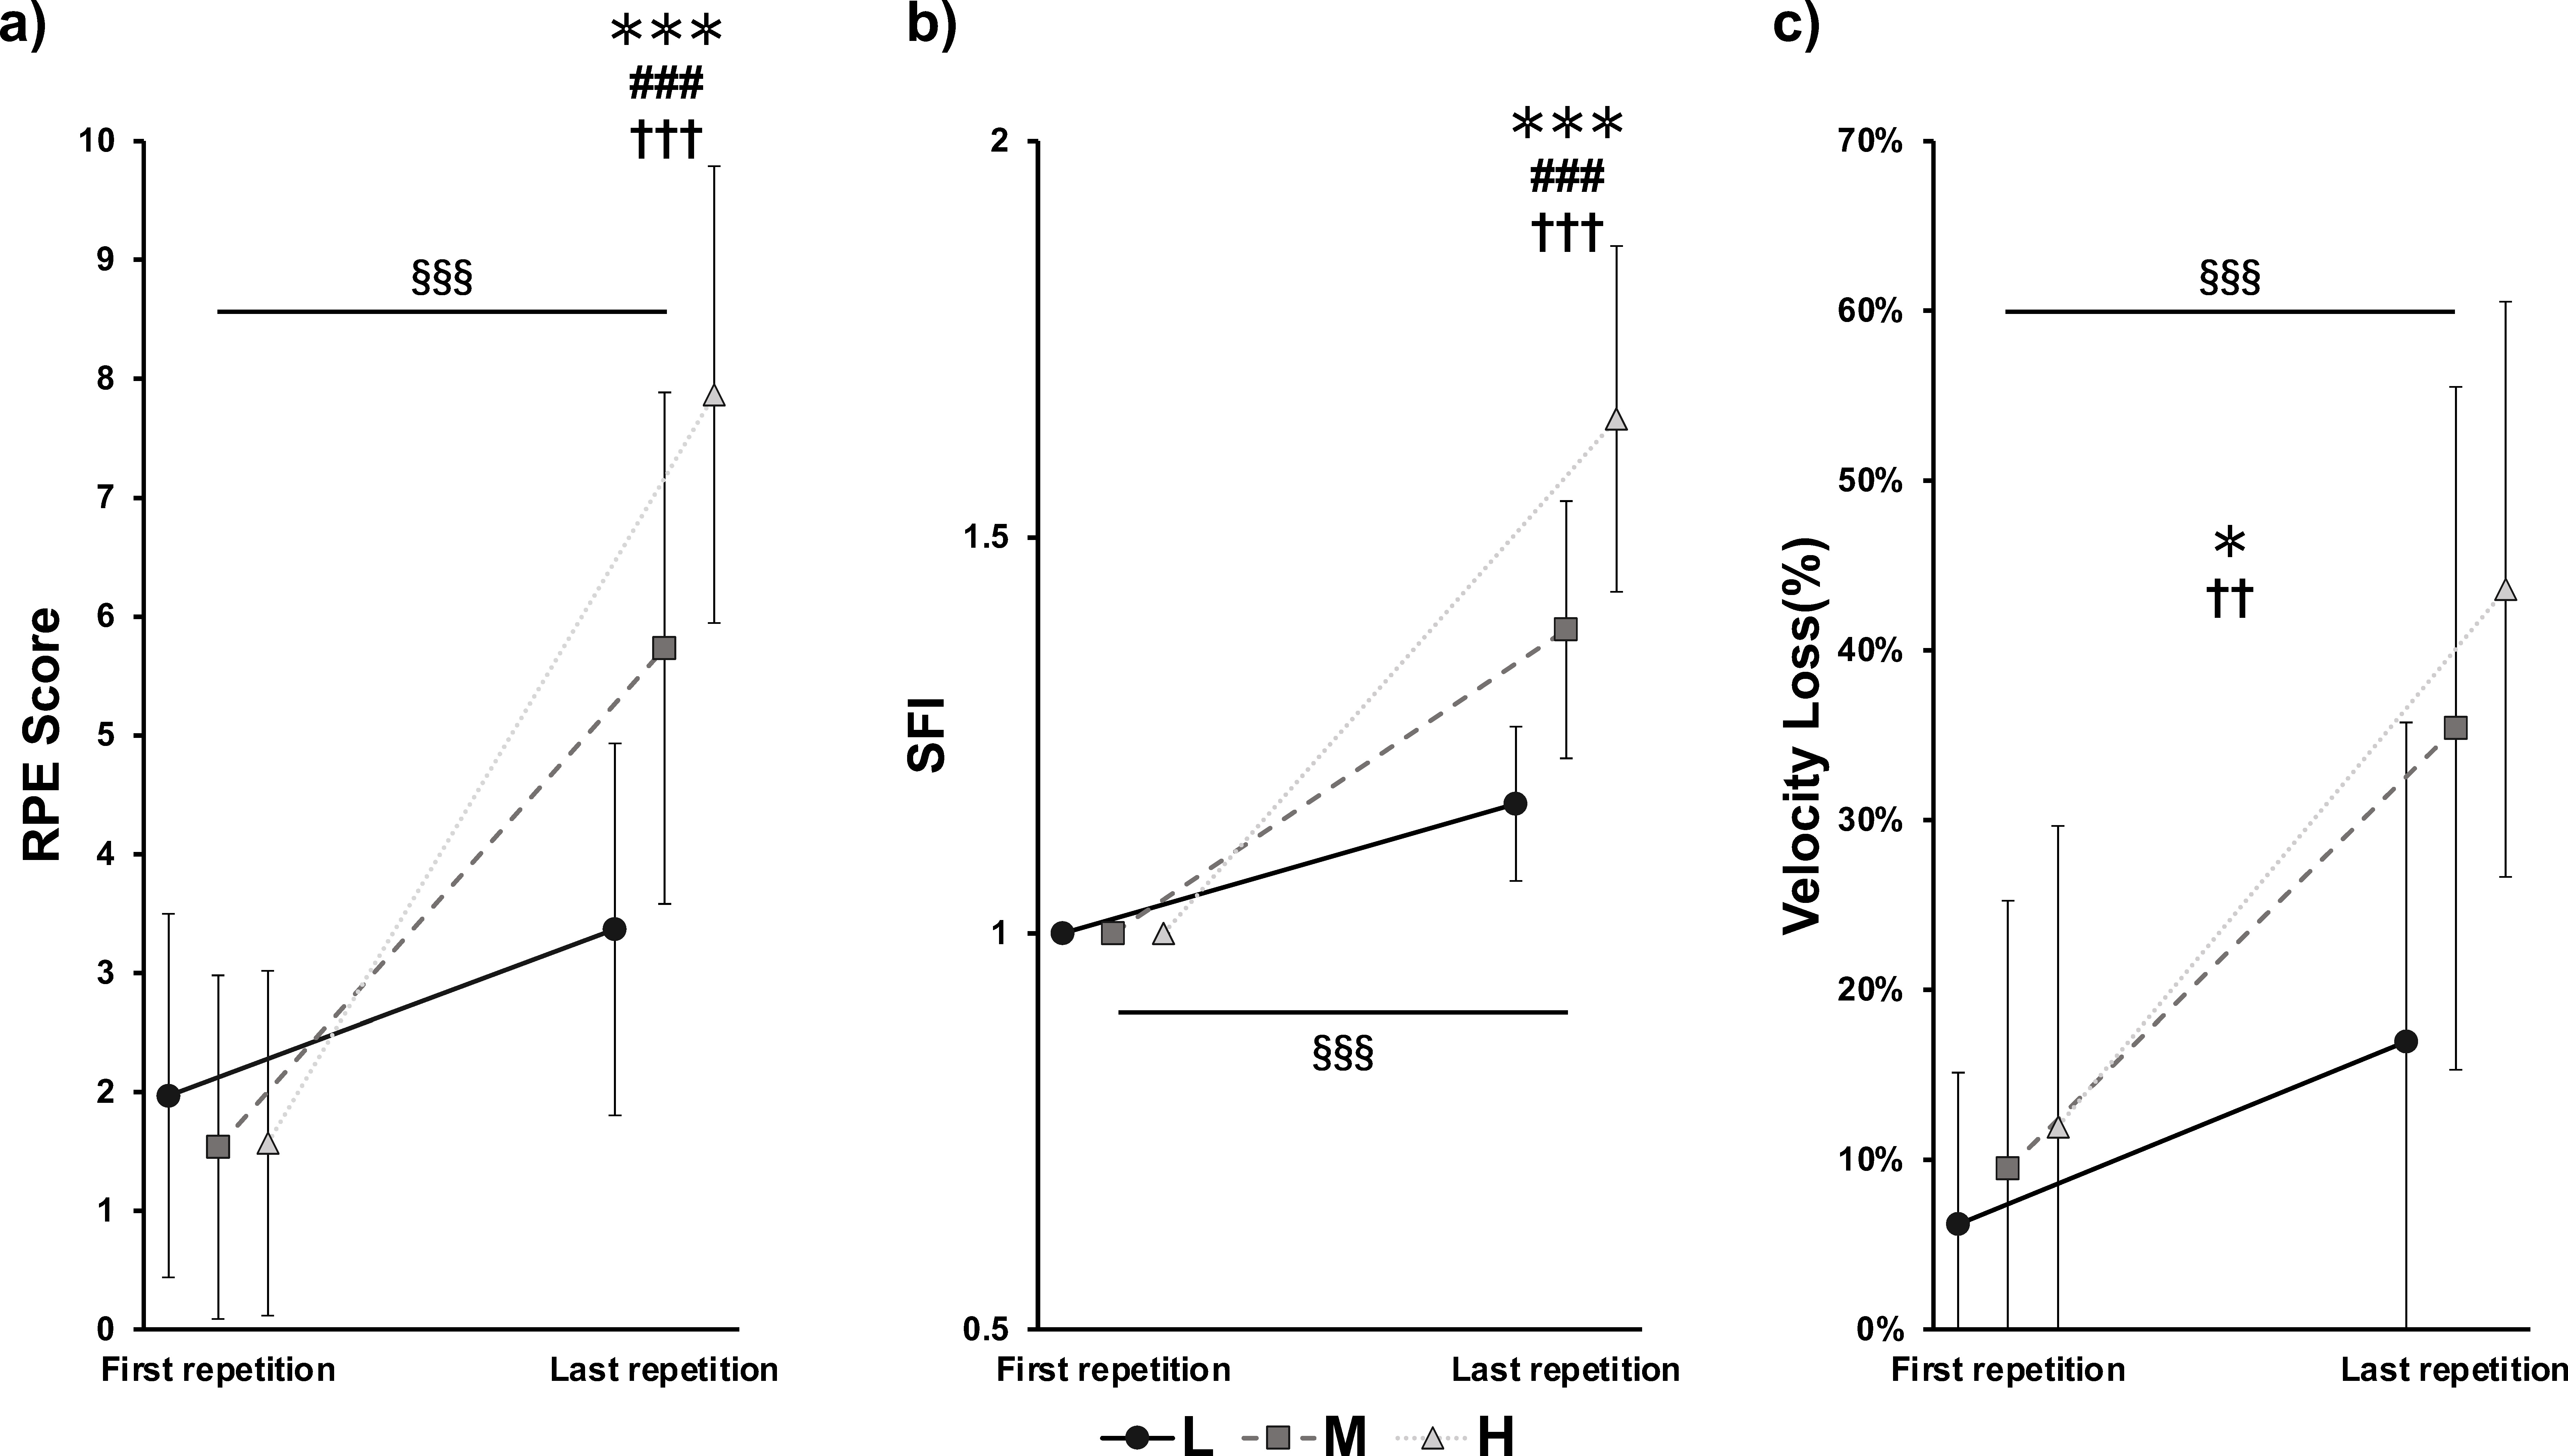
Spearman’s rho between the spectral fatigue index (SFI), rating of perceived exertion (RPE) scores, and velocity loss during bench press exercises (a total of 119 repetitions from 15 participants were gathered in the correlation analysis). 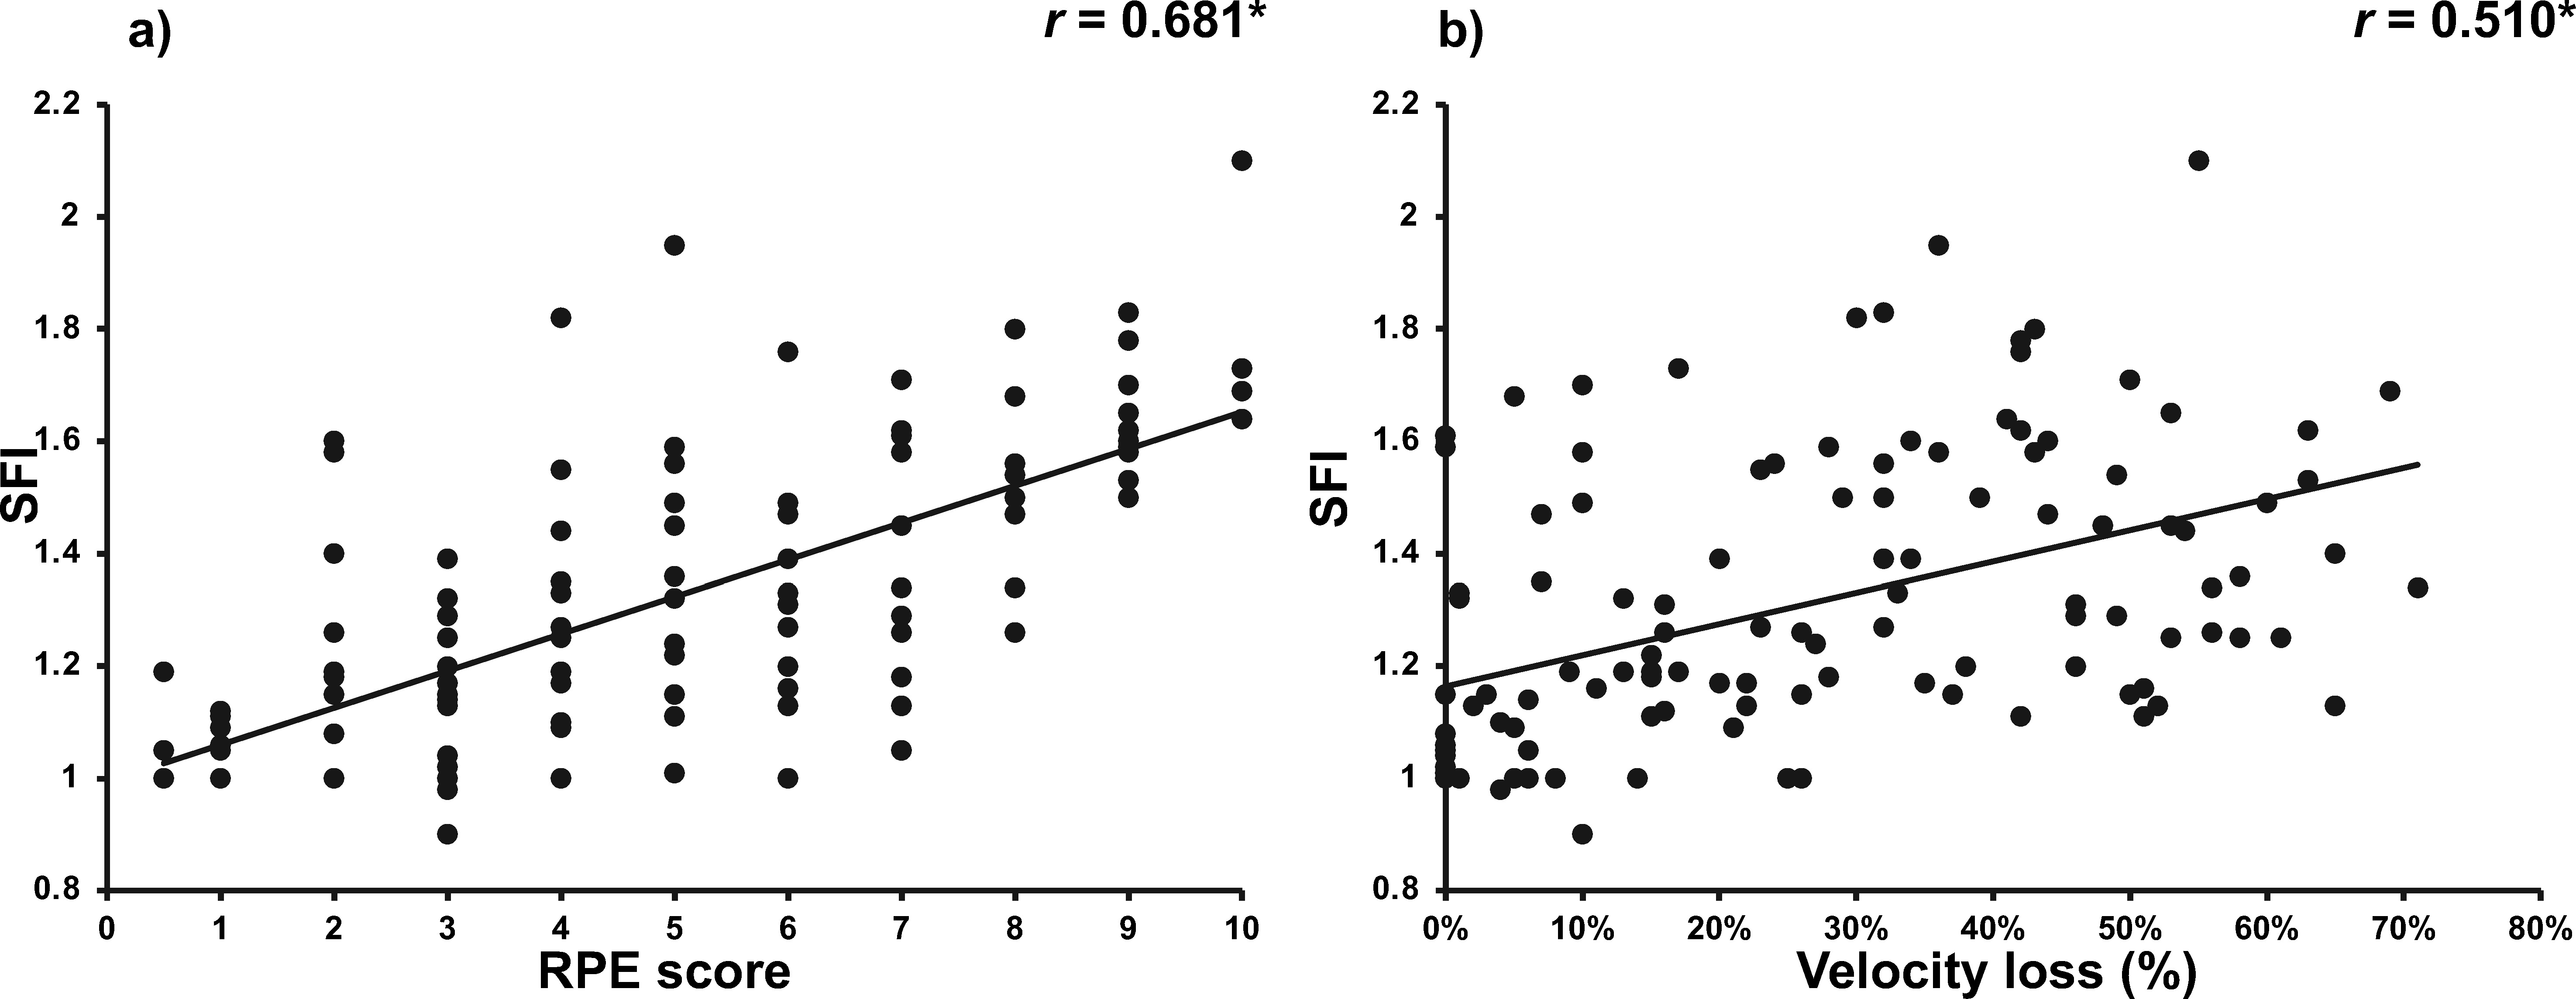
Significant differences in the overall RPE (
In contrast to the average SFI, average velocity loss, and overall RPE, intra-set data were analyzed using a two-way ANOVA. As the required number of repetitions was different for each condition and participant, the first and last repetitions were extracted and used for the two-way ANOVA. A significant overall main effect of the number of repetitions on the RPE (
The results of the Spearman correlation analysis, in which a total of 119 BP repetitions were used, are shown in Fig. 3. The relationships between the SFI and RPE (
The purpose of the present study was to examine the validity of using the RPE to assess muscle fatigue and to examine the use of velocity loss as a muscle fatigue indicator when BP exercise was no longer performed in an explosive manner. The most important findings of the present study are: 1) the RPE and velocity loss changed significantly with increasing muscle fatigue, showing that muscle fatigue induces an increase in subjective perceived exertion and a decrease in velocity during non-explosive BP exercise, and 2) significant RPE-SFI and velocity loss-SFI correlations were observed, indicating that both the RPE and velocity loss could be used as muscle fatigue indicators during non-explosive BP exercise However, 3) the RPE was found to be a higher-precision muscle fatigue indicator than velocity loss.
Perceived exertion could correlate with various central and peripheral responses, such as an increase in motor unit recruitment and firing frequency during dynamic resistance exercises [23, 38, 39, 40]. For example, Lagally et al. reported that the RPE, blood lactate, and muscle activation levels increased correspondingly with the relative intensity of resistance exercise, demonstrating that the RPE could be used as an indirect indicator of both central and peripheral responses [23]. To eliminate the influence of relative intensity differences, a constant relative intensity was adopted for all experimental conditions. Therefore, the significant differences observed in the RPE may be related to differences in the number of repetitions performed, which may have resulted in differences in the consecutive lifting phase. Previous studies have indicated that performing more repetitions can affect intramuscular perturbation and the RPE [32, 41]. In agreement with these findings, as the number of repetitions increased in the experimental conditions, there was a greater disruption in homeostasis (e.g., in the hydrogen ion concentration). These physiological responses can affect afferent feedback from nerve fibers in the skeletal muscle, resulting in a significant increase in subjective perceived exertion [42, 43]. Moreover, severe disruptions in intramuscular homeostasis can affect muscle fiber conductivity, as indicated by the compression of the power spectrum [12, 44]. In the present study, significant changes in the SFI entailed shifts in the power spectrum, which was likely related to muscle fatigue-induced by-product concentration [45]. Consequently, the RPE and SFI increased correspondingly, indicating that subjective perceived exertion reflects muscle fatigue levels during BP exercise.
During resistance exercises, it is very important for coaches and personal trainers to be aware of the muscle fatigue levels of their clients, as mentioned in the Introduction section. Velocity loss has been reported to be a reliable indirect muscle fatigue indicator for explosive resistance exercise [2]. However, lifting explosively is inappropriate for muscular hypertrophy, rehabilitation, and beginner exercise programs. Thus, we assessed the validity of using velocity loss as a muscle fatigue indicator under a cadence-controlled lifting setting. In the present study, a significant difference between the first and last repetitions was observed. This result indicates that velocity loss increases significantly with the progression of the non-explosive BP exercise, even if the prescribed volume is far from physical failure (e.g., 30% of the volume before reaching failure). Accordingly, velocity loss is still valid as a muscle fatigue indicator during non-explosive BP exercise. However, when comparing the results with the RPE, it seems that the velocity loss was less sensitive than the RPE under the present experimental settings. Similar significant differences were observed in the RPE and SFI between all experimental conditions at the last repetition (all
In the present study, we examined the RPE–SFI and velocity loss–SFI relationships using data from each repetition. Notably, both analyses revealed a significant correlation. These results demonstrate that similar to velocity loss, the RPE can also be used as a muscle fatigue indicator with an increase in the number of repetitions. According to previous recommendations, velocity loss increases with both the number of repetitions and sets [2]. As for the RPE, most resistance exercise studies recommend assessing the RPE after a determined number of sets and/or sessions, which represents an overall subjective measure of fatigue [20, 46]. The results of the present study provide a new method for real-time muscle fatigue monitoring. For example, clients can report the RPE after a predetermined number of repetitions, such as the first, mid-point, and last repetition of a certain set, or even repetition-by-repetition. By obtaining the intra-set RPE, trainers and coaches can easily monitor and assess the level of muscle fatigue during resistance exercise, thereby minimizing the risk of injury and preventing a decrease in athletic performance induced by acute muscle fatigue [2, 47]. This new real-time muscle fatigue monitoring method can be particularly useful when velocity assessment is unavailable. These results are consistent with previous recommendations for RPE-based muscle fatigue assessment and have expanded the range of applicability from single-joint to multi-joint upper-body exercises [27]. However, it should be noted that in the present study, a 2-s pause was set between repetitions to obtain the intra-set RPE. The pause phase is similar to continuous isometric contraction, which may have affected the muscle fatigue responses in the present study [25]. For practical applications, practitioners should consider the influence of the pause phase on muscle fatigue assessment. Consequently, our results suggest that both the RPE and velocity loss could be used as muscle fatigue measures in non-explosive BP exercise.
The present study has several limitations. First, we set a 2-s pause between repetitions to obtain the intra-set RPE. It is almost impossible to avoid the influence of the pause phase on muscle fatigue responses, as discussed previously. Second, we assessed the validity of only the Borg CR-10 scale, as it is one of the most commonly used scales in research and exercise settings. However, using different types of RPE scales (e.g., the OMNI-RES scale) might yield different results. Third, the sample size was relatively small, which may have limited the significance of the statistical analysis. Finally, although we instructed the participants to consider and report only the subjective exertion induced by the BP trials based on the anchoring trial to exclude influences that were not associated with the experimental procedure, it might still have been challenging for them to separate other factors, such as breathlessness [29]. Accordingly, future studies should focus on lowering the influence of pauses on the intra-set data, assessing the differences between RPE scales, and employing a larger sample size.
Conclusion
The present study demonstrated that the RPE and SFI changed similarly, indicating an association between subjective exertion and muscle fatigue. Thus, we concluded that the RPE could be employed as an easy-to-use and valid muscle fatigue indicator for non-explosive resistance exercise scenarios, such as rehabilitation and beginner training. Coaches and physical therapists can use the RPE as a real-time muscle fatigue indicator. We also assessed the validity of using velocity loss as a muscle fatigue indicator during non-explosive upper-body resistance exercise. The velocity loss and SFI changed correspondingly, indicating that velocity loss is still effective as a muscle fatigue indicator when exercise is not performed explosively. Additionally, a significantly stronger correlation was observed between the RPE and SFI compared to velocity loss and the SFI. Therefore, both the RPE and velocity loss are effective for muscle fatigue assessment during non-explosive BP exercise. However, considering the differences in precision, convenience, and cost of the two methods, we can conclude that the RPE is a more practical option for muscle fatigue quantification during non-explosive upper-body resistance exercise programs.
Author contributions
CONCEPTION: Hanye Zhao and Junichi Okada.
PERFORMANCE OF WORK: Hanye Zhao and Dasom Seo.
INTERPRETATION OR ANALYSIS OF DATA: Hanye Zhao, Dasom Seo, and Junichi Okada.
PREPARATION OF THE MANUSCRIPT: Hanye Zhao, Dasom Seo, and Junichi Okada.
REVISION FOR IMPORTANT INTELLECTUAL CONTENT: Hanye Zhao and Junichi Okada.
SUPERVISION: Junichi Okada.
Ethical considerations
The experimental protocol was established, according to the ethical guidelines of the Helsinki Declaration and was approved by the Waseda University Human Ethics Committee (No. 2020-369). Informed consent was obtained from all individual participants included in the study.
Funding
No funds, grants, or other financial support was received.
Footnotes
Acknowledgments
The authors would like to thank all the participants in this study.
Conflict of interest
The authors declare that they have no conflicts of interest and competing interests, and there has been no financial support for this study that could have influenced the outcome.