
Abstract
BACKGROUND:
The hand-grip strength test has been widely adopted to evaluate upper limb strength. Other field based tests as push-ups and pull-ups are commonly used for the same purpose. It is however unclear if these may be used interchangeably for upper body strength evaluation.
OBJECTIVE:
The purpose of this investigation was to evaluate strength endurance of the upper body and understand which test could be the most appropriate for upper body evaluation.
METHODS:
Thirty-eight healthy young male participants were tested with three tests comprised of: 1) push-ups (PS), 2) pull-ups (PL) and 3) parallel dips (PD) performed to exhaustion. Grip strength (GS), total number of repetitions, time-to-complete the test, repetition cadence and rate of perceived exertion (RPE) were also retrieved for investigation.
RESULTS:
Repetitions, time-to-complete the test and repetition cadence significantly differed across the three tests (
CONCLUSIONS:
GS is not suitable to evaluate strength endurance. PS, PL and PD are all suitable to evaluate strength endurance. However, PD may be preferred to evaluate the upper body, if velocity also needs to be taken into account.
Introduction
It is well established that strength is one of the most important health related aspects in humans [1, 2]. Indeed extensive literature has been carried out over the years in order to understand maximal strength and define neuromuscular function [3, 4]. Nonetheless, an equally important parameter of neuromuscular function is strength endurance, which has received less attention in the literature [5].
Strength endurance is defined as the ability of muscles to repeatedly exert muscular force for an extended period [6]. This aspect of strength was also identified by a review from de la Motte et al. [7] as an independent risk factor for musculoskeletal injury. The authors evaluated the association between strength endurance and musculoskeletal injuries, indicating that men with lower strength endurance had an overall increased risk of injury. Strength endurance therefore represents a measure of functional capacity which is specific for each muscle group [5]. This concept also implies the necessity for different tests to be adopted to evaluate different muscle groups.
A reliable technique to evaluate strength endurance consists in assessing maximal strength through a dynamometer or a 1RM test and based on a percentage of this value (i.e. 5 or 10%), to evaluate time to failure of a sustained isometric contraction [8, 9, 10]. This technique however requires the use of a dynamometer or specific equipment in a laboratory setting environment. Other common assessment methods employ field based tests, as push-ups, squats and sit-ups [11] which are those most frequently adopted, for upper body, lower body and core muscle evaluation, respectively. These strength endurance tests are performed either against time, by evaluating the maximum number of repetitions executed within 60 seconds [12, 13], or by determining the maximum number of repetitions regardless of time, until exhaustion [14, 15].
In the context of upper body strength endurance testing, two common tests are the push-up and pull-up tests, for pushing and pulling strength, respectively [11, 16, 17, 18, 19]. Another common exercise proposed to improve upper body strength, which can be also employed as a mean of evaluation, is the parallel bar dip [20, 21]. However, only Collins et al. [22] and Paoli et al. [23] have considered the use of a parallel bar dip test, performed to exhaustion, to evaluate upper body strength endurance. Interestingly, notwithstanding different populations were analysed by the two studies, very similar results were obtained regarding the test results.
Therefore, the aim of this investigation will be to assess strength endurance of the upper body in healthy young males and to identify which test could be the most suitable for an overall general upper body strength evaluation.
Materials and methods
Subjects
The sample was composed of 38 young male healthy participants (age 23.9
The principles of the Italian data protection (196/ 2003) were guaranteed. The study was undertaken in accordance with the guidelines of the Helsinki Declaration (Hong Kong revision, September 1989) and the European Union recommendations for Good Clinical Practice (document 111/3976/88, July 1990).
Procedure
Data collection was carried out by two investigators in the setting of a fitness center. The first step consisted of measuring anthropometric parameters of each participant. Subsequently, each participant was asked to perform the handgrip strength test (GS) three times with the right and left hand. A two minute rest was provided between each GS trial. At the end of the GS assessment, further 5-minutes rest were given before the subsequent tests were administered.
Three tests were administered in a random order. These were push-ups (PU), pull-ups (PL) and parallel bar dips tests (PD), all performed to exhaustion. Each test was performed on a separate day and all tests were performed on non-consecutive days in order to allow a full recovery of the participants. Each test was performed once, starting at the “go” of an investigator and ending when either the participant was not able to perform any more repetitions or when the repetitions were non performed as described in the following section, for more than two consecutive repetitions.
The other investigator at the “go” started recording the time required to complete the task with a stopwatch, to the nearest hundredth of a second, which was stopped at the end of the test. No restrains on the execution speed were made in order to allow subject’s preferred cadence. Once the participant ended the required task, the rate of perceived exertion was assessed. This procedure was repeated for each test. At the end of data collection, repetition cadence was calculated for each test and participant.
Measures
Handgrip strength test
Hand-grip strength was measured through a digital dynamometer (KERN MAP 80K1, KERN&Sohn GmbH, Barlinger, Germany). Each participant performed three trials with both hands with a two-minute rest between each trial. The participants were instructed to hold the dynamometer in each hand, with the arm fully extended and were instructed to hold the dynamometer without touching the body. The display of the dynamometer was aligned to the face of the examiner. The participants were standing during the entire test with the arm straight down at the side, the elbow in full extension and the forearm and the wrist in neutral position. The highest of the three trials was recorded for statistical analysis.
Push-up test
The push-up test was performed on a flat, stable surface, with the hands placed slightly wider than shoulder-width apart. The fingers were pointing forward and the body parallel to the ground. For the repetition to be recorded, the correct depth needed to be met. This was reached when each elbow formed an angle of at least 90
Pull-up test
The pull-up test was performed with each participant grasping an overhead bar with a pronated grip. For each pull-up the participants had to start from a motionless hanging position from a 2.15 m high bar with the upper limbs fully extended. The participants had to pull up their body until at least their chin passed above the bar. The participants weren’t allowed to swing or use their legs in order to provide help during the execution of the test. The test ended when the participants were no longer able to perform additional repetitions or if they used their legs for help during the execution of the test.
Parallel bar dip test
The parallel bar dip test was performed with each participant on a set of parallel bars, 55 cm wide and 140 cm high. The participants started the test while with the arms fully extended, grabbing with each hand a parallel bar. For the repetition to be recorded, the correct depth needed to be met, and this was reached when each elbow formed an angle of at least 90
Borg rate of perceived exertion scale
Standardized written instructions were provided prior to each test in order to understand the BORG RPE scale. At the end of each test the participants had to rate the exertion of the test, using the BORG RPE scale ranging between 6 and 20 [24]. The results were recorded in an excel sheet.
Statistical analysis
Means and standard deviations were calculated from the current data. BMI was calculated from height and weight, and repetition cadence was calculated by dividing the number of total repetitions by the time required to complete the test. Data was then tested for normality using the Shapiro-Wilks test. All data ware normally distributed except for the data regarding the RPE. Differences between test results were calculated using a two-way ANOVA for parametric assessment and the Friedman test for non-parametric assessment. Pearson correlation coefficients and Spearman’s rank correlation coefficients were also performed when appropriate. Linear regression models were subsequently created in order to verify which test had the greatest shared variance with the other tests. Significance was set at
Results
Descriptive characteristics of the sample are presented in Table 1.
Descriptive characteristics of the sample and main measures
Descriptive characteristics of the sample and main measures
R
Results of the performance of the three tests. PS 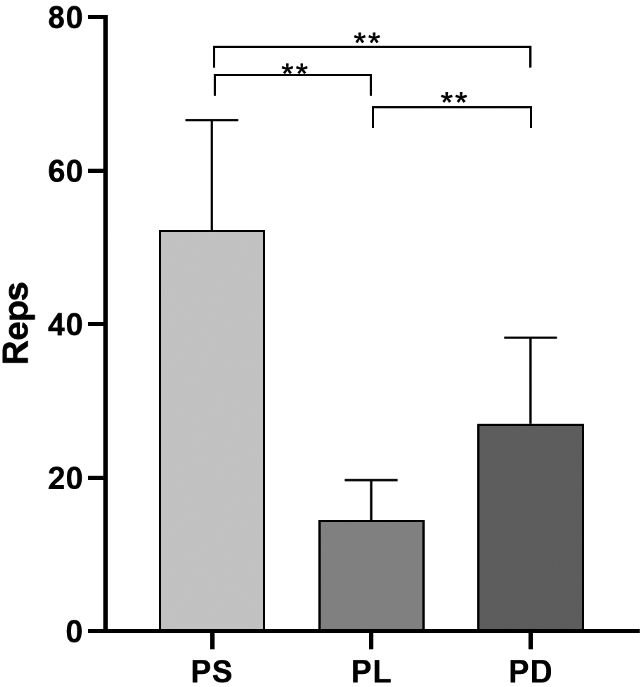
Time required to complete the tests. PS 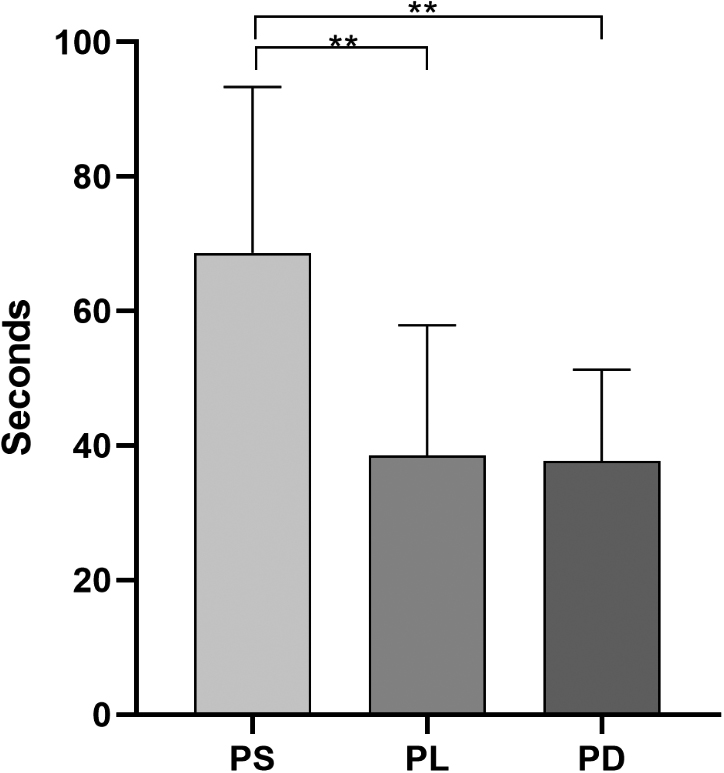
Cadence, calculated by dividing the performance outcomes by time to complete the tests. PS 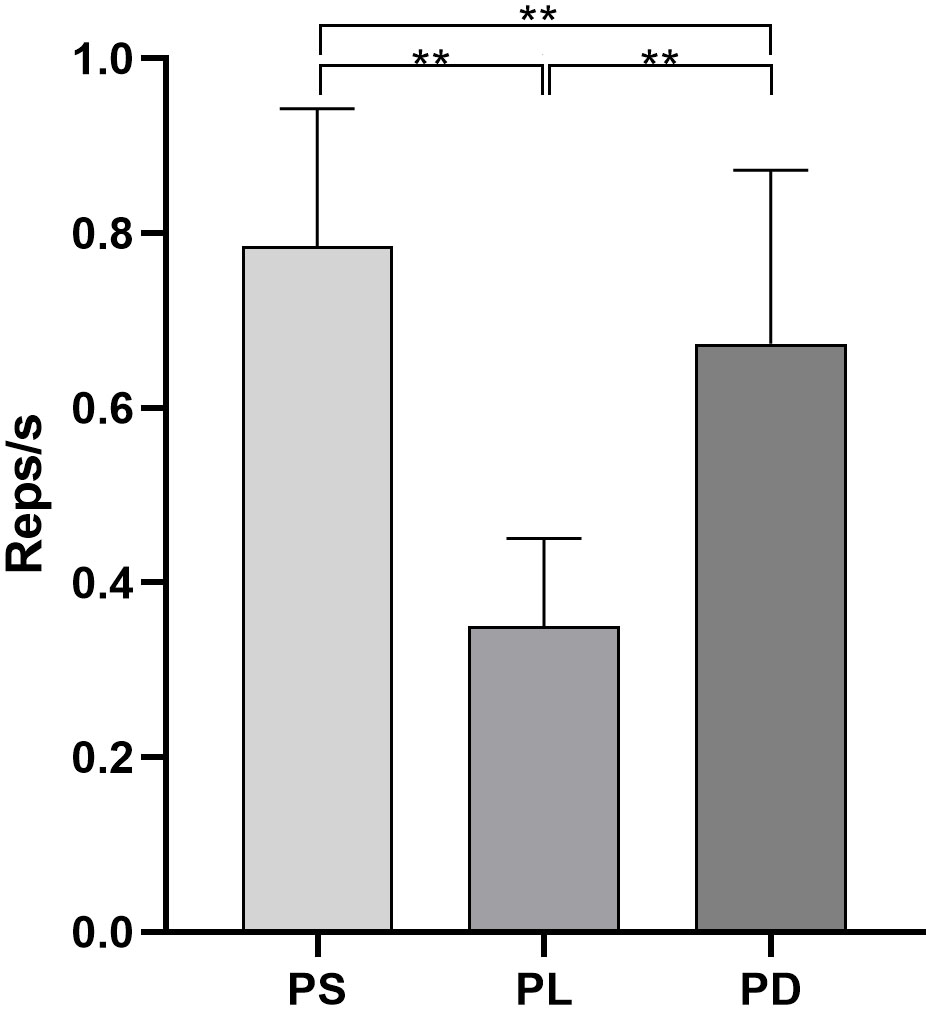
Rate of perceived exertion of each test. PS 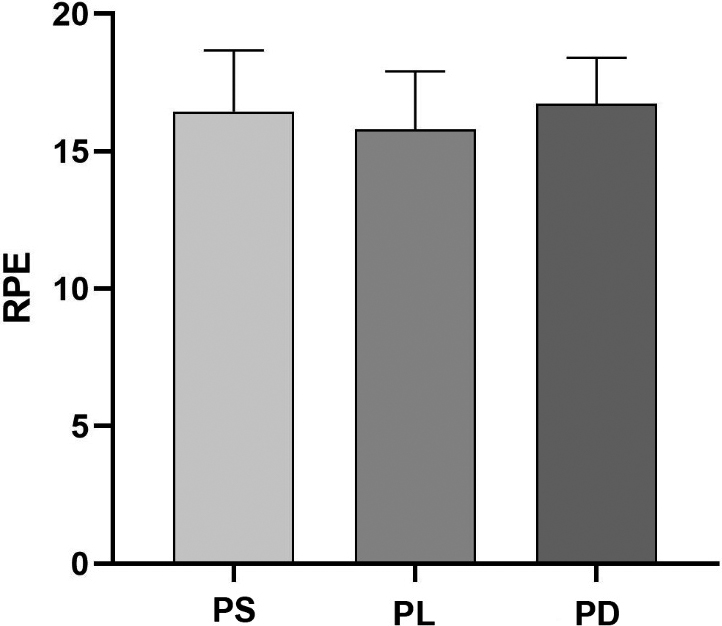
The number of repetitions performed was 52.29
None of the analysed tests significantly correlated to the GS for either hand, nor to BMI. However, BMI was significantly correlated to the RPE of each test (PS
Correlation coefficients of the analysed variables
R
Repetition cadence was not correlated to the performance measures of the PS and PL tests while a coefficient of
Each test significantly correlated to each other (Table 2). A regression model was created in order to verify which test had the greatest shared variance. The PD had a significant
This study aimed to understand which exercise may be the most suitable in order to evaluate strength endurance of the upper body and the results of this study confirm that all three exercises may be adopted.
All exercises well correlate to each other and have a significant amount of shared variance.
Despite the challenge to precisely identify one exercise, it is interesting to note that the PD not only possess the highest partial correlations, but also the greatest shared variance with the other evaluated tests. Different elements need to be taken into account to understand these results. First, it is important to note that the PD is an exercise involving the upper body, used to increase pushing strength, in which the main muscle groups engaged are the pectoralis major, the anterior deltoid and the triceps [25]. These muscle groups are those mainly engaged during the execution of the push-ups [26] and in part also during the pull-ups [27]. Furthermore, all exercises share common muscle groups which act as stabilizers during movement (i.e. rectus abdominis, erector spinae and serratus anterior) [28, 29]. Second, the PD is executed on a frontal plane which is the same working plane used during the pull-ups, notwithstanding this latter is generally adopted for pulling strength [30]. Therefore, it was expected that a relation between the exercises was present.
In a previous study [14] we aimed to identify predicative variables for upper body strength endurance. The results indicated that velocity of a single repetition was the key variable identified in order to estimate the total number of performed repetitions during a pull-up test. In the present investigation we did not assess velocity of single repetitions, however we estimated repetition cadence in order to identify further variables possibly related to velocity which don’t need specific equipment to be calculated. The PD was the only exercise which manifested a positive and significant correlation to repetition cadence, highlighting a relation with velocity. Such strict relation between execution speed and performance output, was also evaluated by different authors. Zalleg et al. [31] identified through a principal component analysis that explosive push-ups were good estimators of upper body power while Sreckovic et al. [32] found evidence of a linear force-velocity relation regarding mechanical properties of arm muscles. All factors indicating that during muscular evaluation, velocity is an important component that should be further considered.
Another test included in our investigation was the GS, a gold standard in strength evaluation of the upper limbs, which is associated to several health related outcomes [33]. A study by Wind et al. [34] indicates grip strength may be used as a predictor of general muscle strength in different populations. However, in their investigation the authors only considered isometric strength without taking into account strength endurance. The results of the GS in the present investigation did not correlate to any of the other performed tests. Notwithstanding the aforementioned associations, our results indicate GS is not suitable for strength endurance evaluation of the upper body.
Another aspect which has emerged in this study, which was also highlighted in our previous investigation, is that no association is present between strength endurance and anthropometric parameters. These results are in line with other investigations [14, 35, 36]. While our BMI data did not influence the results of the tests and no significant difference was noted across the tests for RPE, a positive relation is present between BMI and RPE. These results highlight that people with a greater BMI who are required to move against a greater resistance, since the required task implies performing body weight exercises, will as a consequence have greater RPE. Such aspect has been also noted in the study of Dawes et al. [37] in which BMI was identified to influence perceptual and physiological demands of the participants and in the study of Sehl et al. [38] which noted higher RPE values in obese compared to non-obese cyclist after exercise.
It must be noted that almost no investigation previously published has adopted the parallel dips as a test for upper body strength endurance evaluation. However, the results of the present investigation demonstrate a good association with other common exercises. The PD could be adopted for a general estimate of upper body strength evaluation and therefore lead to a significant reduction of time in physical assessment. Knowledge regarding the relation between repetition cadence and performance results could be useful for a more consistent and accurate evaluation [39].
Despite the aspects discussed, this study is not without limitations. Our sample size (
Conclusions
The results of the present study indicate that grip strength is not suitable to evaluate strength endurance of the upper body, while all the exercises included may be adopted to evaluate upper body strength endurance in healthy young male. However, the parallel bar dips seem to be an interesting alternative to commonly adopted tests. This test was also the only included one to possess a relation with repetition cadence.
These results can be useful to sport professionals and coaches in order to simplify the assessment of strength endurance of the upper body.
Author contributions
CONCEPTION: Ewan Thomas.
PERFORMANCE OF WORK: Vincenzo Gennaro.
INTERPRETATION OR ANALYSIS OF DATA: Marianna Bellafiore.
PREPARATION OF THE MANUSCRIPT: Ewan Thomas and Giuseppe Battaglia.
REVISION FOR IMPORTANT INTELLECTUAL CONTENT: Antonio Palma and Angelo Iovane.
SUPERVISION: Antonino Bianco.
Ethical considerations
Each has provided informed written consent. The principles of the Italian data protection (196/2003) were guaranteed. The study was undertaken in accordance with the guidelines of the Helsinki Declaration (Hong Kong revision, September 1989) and the European Union recommendations for Good Clinical Practice (document 111/3976/88, July 1990). The study was approved by the departmental review board (C.C.S. minutes n
Funding
The authors did not receive any specific grant for this research from any funding agency in the public, commercial, or not-for-profit sectors.
Footnotes
Acknowledgments
The authors have no acknowledgments.
Conflict of interest
The authors declare that they have no conflict of interest relevant to the content of this study.