The purpose of this study was to evaluate changes to key aerobic performance determinants, namely maximal oxygen uptake (VO), lactate threshold (LT) and gross efficiency (GE) over the cycling season.
METHODS:
Twelve well-trained road cyclists completed three incremental tests during a season in order to determine VO, LT and GE. The laboratory tests were performed using the following sequence: after the transition period (TRAN), during the preparatory period (PREP) and during the competition period (COMP).
RESULTS:
VO did not change significantly over the season. Workload at lactate threshold (WL) increased by 11% between the TRAN and COMP periods ( 0.001), which was accompanied by an increase in oxygen uptake at lactate threshold (VO; 0.01). The percentage of VO at the LT changed from 80.1% to 85.6% ( 0.05). GE increased from 21.9 1.1% in TRAN to 22.8 0.8% in COMP ( 0.01). No significant correlations were found between VO and GE and between changes in GE and those in VO in any training period.
CONCLUSIONS:
In well-trained athletes, the training process contributes mostly to improvements in submaximal indicators, while it does not change VO. GE is an indicator that is expected to improve over the season, but further research is needed to explain the mechanisms responsible for the individual fluctuations of the GE value in athletes.
Due to differences in racing times and different exercise intensities, cycling is associated with a number of physiological demands that the athlete’s body is exposed to during competition. Adaptations to race demands and achieving a high level of sports performance occur following long-term training, which should be oriented towards improving the physiological indicators which have a decisive impact on cycling performance. Previous literature revealed maximal oxygen uptake (VO), lactate threshold (LT) and efficiency (the oxygen cost at a given power output) are the key factors which interact to determine the aerobic exercise performance [1, 2, 3].
In professional cyclists, VO exceeds 70 ml kgmin [4, 5, 6] and is greater by 50–100% than those observed in non-trained people [2]. VO sets the upper limit for oxidative energy production and is an important characteristic of exercise prowess. However, given that intensity of the race effort for road cycling is less than 100% of VO [5], lactate threshold workload (WL) is considered a better indicator of cycling performance than VO alone [7, 8, 9, 10]. WL determines the highest power output that can be maintained for a prolonged time without a rapid increase in fatigue [11, 12]. According to Coyle’s model [11], WL is a function of “Lactate Threshold VO (VO)” and the power that can be generated for this level of oxygen consumption, represented by Gross Efficiency (GE).
The genetic potential of endurance performance determinants can be enhanced by exercise training [3]. It is considered that, while the value of VO stabilizes over a sport career, lactate threshold and efficiency can be improved even in world-class athletes [3, 7]. The stimulus for adaptive changes that improve performance is the physiological stress induced by training [13, 14]. The level of this stress is regulated by training intensity and volume. Training periodization allows for controlling training loads in a planned manner in order to induce the expected adaptive changes [15, 16]. During macrocycle, the performance level fluctuates and should peak during the competition period. The range of changes of respective factors affecting endurance performance over the season is diverse [17, 18, 19, 20]. Most of the previous reports indicated VO does not change significantly over the season in well-trained athletes [17, 19, 21] or it increased only in the early phase of training programs [1, 22]. In turn anaerobic threshold moves towards higher exercise loads over the season [18, 23, 24, 25]. Although, the link between efficiency and endurance performance was previously reported [26, 27, 28, 29], several studies indicate efficiency was not influenced by training status [30, 31, 32, 33]. Seasonal changes in efficiency in cyclists are still not entirely clear. Barbeau et al. [17] showed that gross mechanical efficiency at constant workload increased during the season, but only at higher (250 W) rather than lower (150 W) power outputs. In a study conducted by Hopker et al. [22], GE increased from 19.6% to 20.6% as a response to endurance training during the pre-competition phase of the season and maintained at this level during the main competitive phase. Contrary to these results, Impellizzeri and Marcora [34] failed to find any changes in GE over the season in competitive mountain bikers, even in relation to the pre-season rest period.
Given that efficiency is considered one of the key factors in improving performance and previous results are inconsistent, the purpose of our study was to evaluate whether GE changes over the course of the season (between December and June) in well-trained road cyclists. A secondary aim of the study was to examine the kinetics of seasonal changes of other aerobic fitness indices determined during the incremental test (especially VO, VO and WL). We hypothesized that GE, LT, percentage of VO at lactate threshold workload (%VO at LT), but not VO, change over the season in well-trained cyclists, reaching a peak level during a competition period. Furthermore, we aimed to test the hypothesis that there is an inverse relationship between GE and VO.
Methods
Subjects
Twelve male well-trained road cyclists, with the following physical characteristics at the first test (age 24 5.6 years; VO 69.2 4.4 mlkgmin; body height (BH) 179.2 5.4 cm; body mass (BM) 70.0 5.7 kg; fat content (FAT%) 9.4 1.7%) took part in this investigation. All cyclists had at least six years of national and international competition experience and were familiar with our laboratory testing procedures. All athletes had current medical examinations. The participants provided their written, voluntary, informed consent before participation. The research project was conducted according to the Helsinki Declaration and was approved by the Bioethics Committee for Scientific Research at the Jerzy Kukuczka Academy of Physical Education in Katowice, Poland.
Mean values ( SD) of training loads during the experiment
All subjects performed three laboratory tests using the following sequence: in December – after the transition period (TRAN), in February – during the preparatory period (PREP) and in June – during the competition period (COMP). All participants were instructed to avoid strenuous exercise and caffeine intake for 24 h prior to each test. Cole et al. [35] suggested that in order to ensure the validity of GE results, diets of participants should be controlled and monitored before the measurements. For this reason, isocaloric diets (40 kcal/kg of body weight, 50% carbohydrates, 20% proteins, 30% fats) were applied in a three day recovery microcycle prior to each test.
Throughout the macrocycle, participants maintained their normal diets and training patterns. Training was not planned or altered by the authors. For all cyclists, the training macrocycle was based on the concept of linear periodization. Training load was recorded using power meters (Vector, Garmin). It was calculated after each training session and archived using WKO+ 4.0 software (Training Peaks, USA). The training loads used during the experiment are presented in Table 1.
Testing
All participants visited the laboratory three times during the study. Testing procedures were identical for each laboratory visit. Before breakfast, body mass and body composition were evaluated with the electrical impedance technique (Inbody 220, Biospace Co., Japan). Next, two hours after a light breakfast (5 kcal/ 1 kg of body weight, 50% carbohydrates, 20% proteins, 30% fats), the incremental test was performed to determine subject’s aerobic capacity with an Excalibur Sport ergometer (Lode BV, Netherlands). The incremental test started at a workload of 40 W, which was increased by 40 W every three minutes until volitional exhaustion. During the test, all cyclists were instructed to remain in a sitting position and maintain a cadence of 80 rpm ( 5 rpm). Each cyclist’s bike setup (saddle height, reach, handle bar height) was recorded and reproduced for all tests.
During the incremental test, heart rate (HR), oxygen uptake (VO), expired carbon dioxide (CO) and minute ventilation (VE) were measured continuously with a rapid gas analyser (MetaLyzer 3B-R2, Cortex, Germany) in the breath-by-breath mode. Prior to each test, the gas analyser was calibrated according to the manufacturer’s recommendations. The criteria of reaching VO included a plateau in the level of VO (VO 150 mL/min) or a gradual decrease in peak VO during the maximal workload.
The maximal workload was indicated as last completed stage of progressive test. If a participant terminated the test before completing a given workload, the maximum workload was calculated from the formula WL WL (t/T WL) [36], where WL previous workload, t exercise duration with the workload until premature failure, T duration of each workload, and WL amount of workload by which exercise intensity increased during the test.
Fingertip capillary blood samples for the assessment of lactate (LA) concentration (Biosen C line Clinic, EKF-diagnostic GmbH, Germany) were drawn at rest and at the end of each step of the test, as well as during the 3, 6, 9, and 12 minute of recovery. The lactate threshold was determined by the D-max method [37].
Determination of efficiency
GE was calculated as a ratio of work accomplished per minute (watts converted to kcal/min) to energy expended per minute (kcal/min). Energy expenditure was calculated from VO and RER using the tables of Lusk [38].
Throughout the season, GE was calculated at the same absolute workload (GE). During all laboratory visits, mean VO and respiratory exchange ratio (RER) values were calculated for each 3-minute stage. During the first test, GE was calculated from average of VO and RER values at one workload below lactate threshold. During the next tests, GE was identified at the same absolute workload as during the first test. This workload was in the range from 200 W to 280 W for all cyclists. GE was only calculated when the mean RER was 1.0.
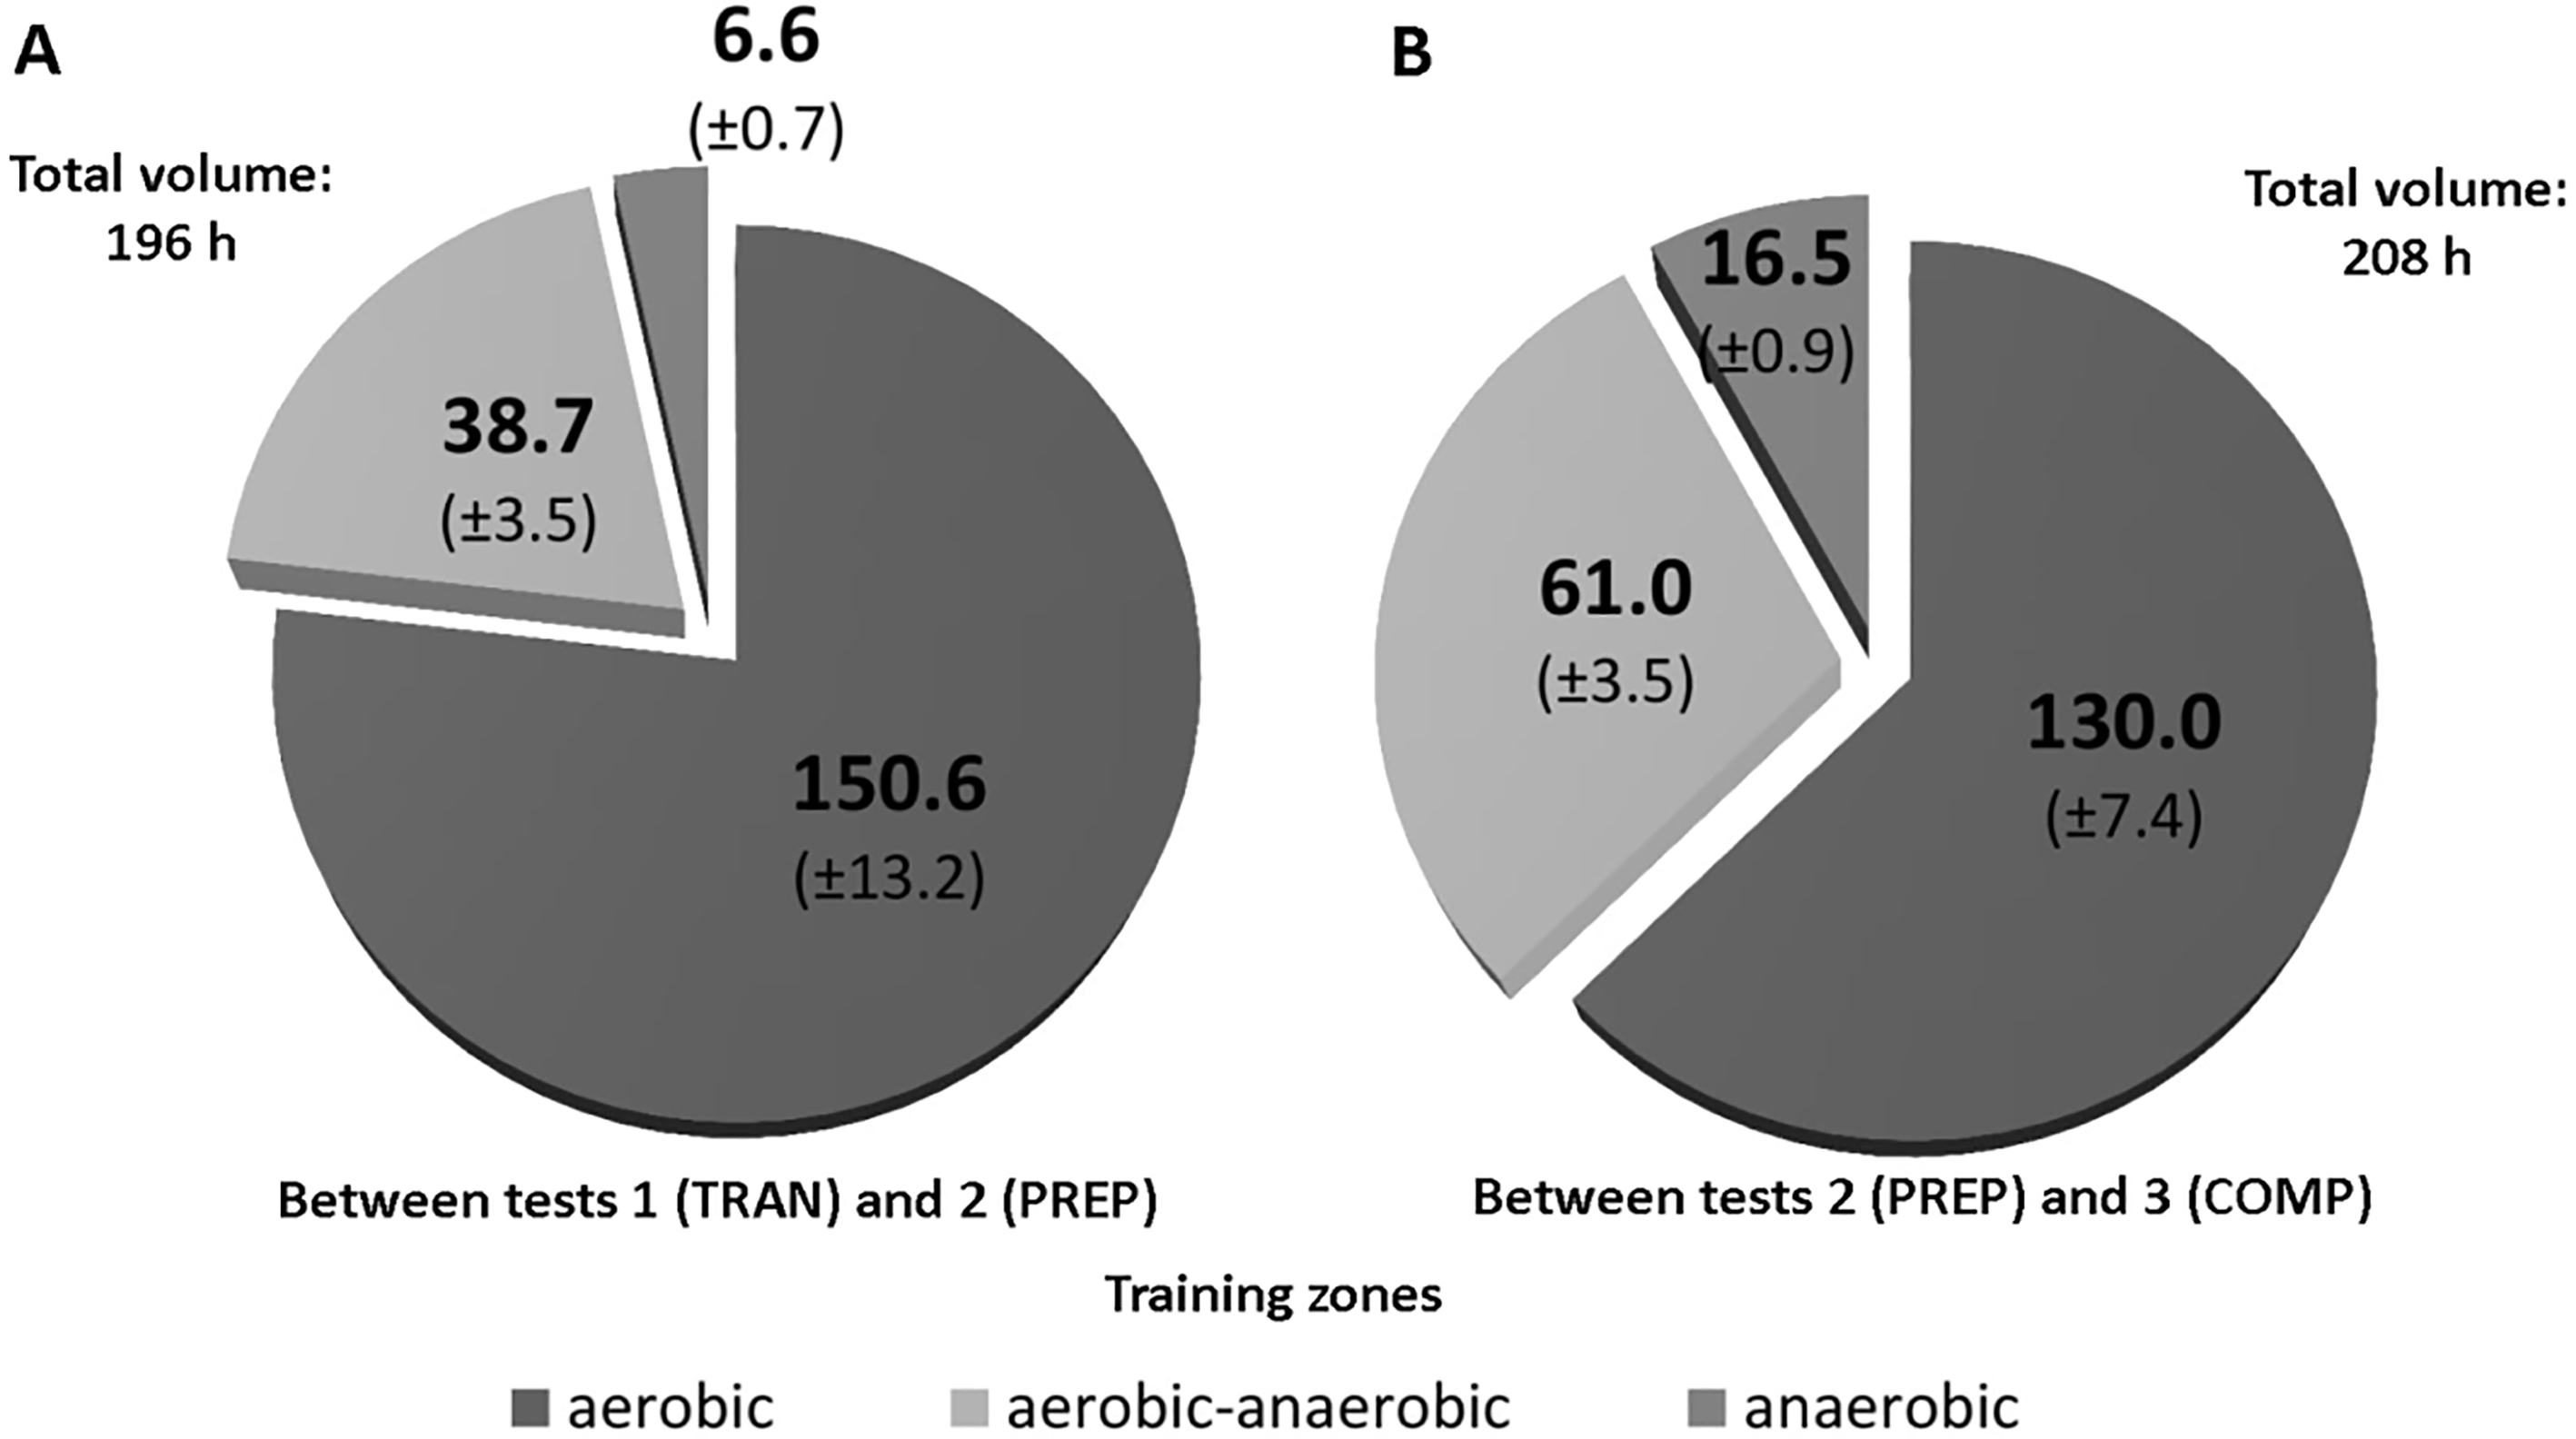
Training volume and intensity presented in hours (h) during the experiment. Note: TRAN – transition period, PREP – preparatory period, COMP – competition period; A – first phase of the experiment, between test 1 (TRAN) and test 2 (PREP); B – second phase of the experiment, between test 2 (PREP) and test 3 (COMP).
Statistical analyses
The results of the study were analyzed with the use StatSoft Statistica 12.0 software. The results were presented as arithmetic means (x) and standard deviations (SD). The statistical significance was set at 0.05. Prior to all statistical analyses, normality of the distribution of variables was checked using a Shapiro-Wilk test. The one-way ANOVA with repeated measures was used to determine the significance of differences between three consecutive measurements. When significant differences were found, the post hoc Tukey’s test was used. Differences between training volume and intensity in subsequent phases of the season were tested for statistical significance with the Student’s -tests. The relationships between training intensity or volume and changes in physiological variables and the relationships between VO and GE were analyzed using Pearson’s correlation coefficient. Additionally, we re-analyzed one-way ANOVA as a one-way ANCOVA. We used training volume (h) as a covariate to the training-induced changes in subjects. Because the period between test 1 (TRAN) and test 2 (PREP) was 3-months and the period between test 2 (PREP) and test 3 (COMP) was also 3-months, we used total training volume for each period.
Results
Training volume and intensity
In the first phase of the experiment (3-month period), between test 1 (TRAN) and test 2 (PREP), total training volume was 196 17.3 h. In the second phase (3-month period), between test 2 (PREP) and test 3 (COMP), total training volume was 208 11.8 h. No significant differences were found in training hours between the first and second phases. Training intensity changed significantly over the season. Training time spent in the aerobic zone decreased significantly ( 0.001), whereas training hours in aerobic-anaerobic and anaerobic zones increased significantly ( 0.001) in the second phase compared to the first (Fig. 1). No significant correlations were found between training intensity or volume and changes in physiological variables.
Cardiovascular variables, gross efficiency and lactate concentration
One-way ANOVA showed time effect for the absolute ( 6.76, 0.005) and relative ( 6.34, 0.007) values of VO. The analysis also revealed significant differences in percentage of VO at lactate threshold workload (%VO at LT; 5.49, 0.012), in maximal ventilation (VE; 10.14, 0.001) and in GE ( 7.43, 0.003). VO, HR and delta values of lactate concentration (LA) did not change significantly during the season.
Selected variables registered during the incremental test in subsequent phases of the season. Data are means ( SD)
TRAN
PREP
COMP
VO (l/min)
4.84
0.41
4.96
0.50
4.97
0.40
VO (ml/kg/min)
69.2
4.4
70.6
5.1
70.7
3.2
VO (l/min)
3.88
0.42
4.01
0.39
4.25
0.40
VO (ml/kg/min)
55.3
3.6
57.2
4.6
60.5
3.7
%VO at LT (%)
80.1
5.4
81.0
3.4
85.6
4.1
GE (%)
21.9
1.1
22.4
0.7
22.8
0.8
VE (l/min)
166.3
18.2
178.3
15.6
180.4
17.8
HR (bpm)
192
9
192
10
189
6
LA (mmol/l)
9.47
2.48
10.17
2.03
9.38
2.36
Legend: TRAN – transition period, PREP – preparatory period, COMP – competition period; VO – maximal oxygen uptake, VO – oxygen uptake at lactate threshold workload, %VO at LT – percent of maximal oxygen uptake at lactate threshold workload, GE – gross efficiency at constant absolute workload, VE – maximal ventilation, HR – maximal heart rate, LA – increase in blood lactate concentration during incremental test; 0.05; 0.01; 0.001 vs. TRAN; 0.05 vs. PREP.
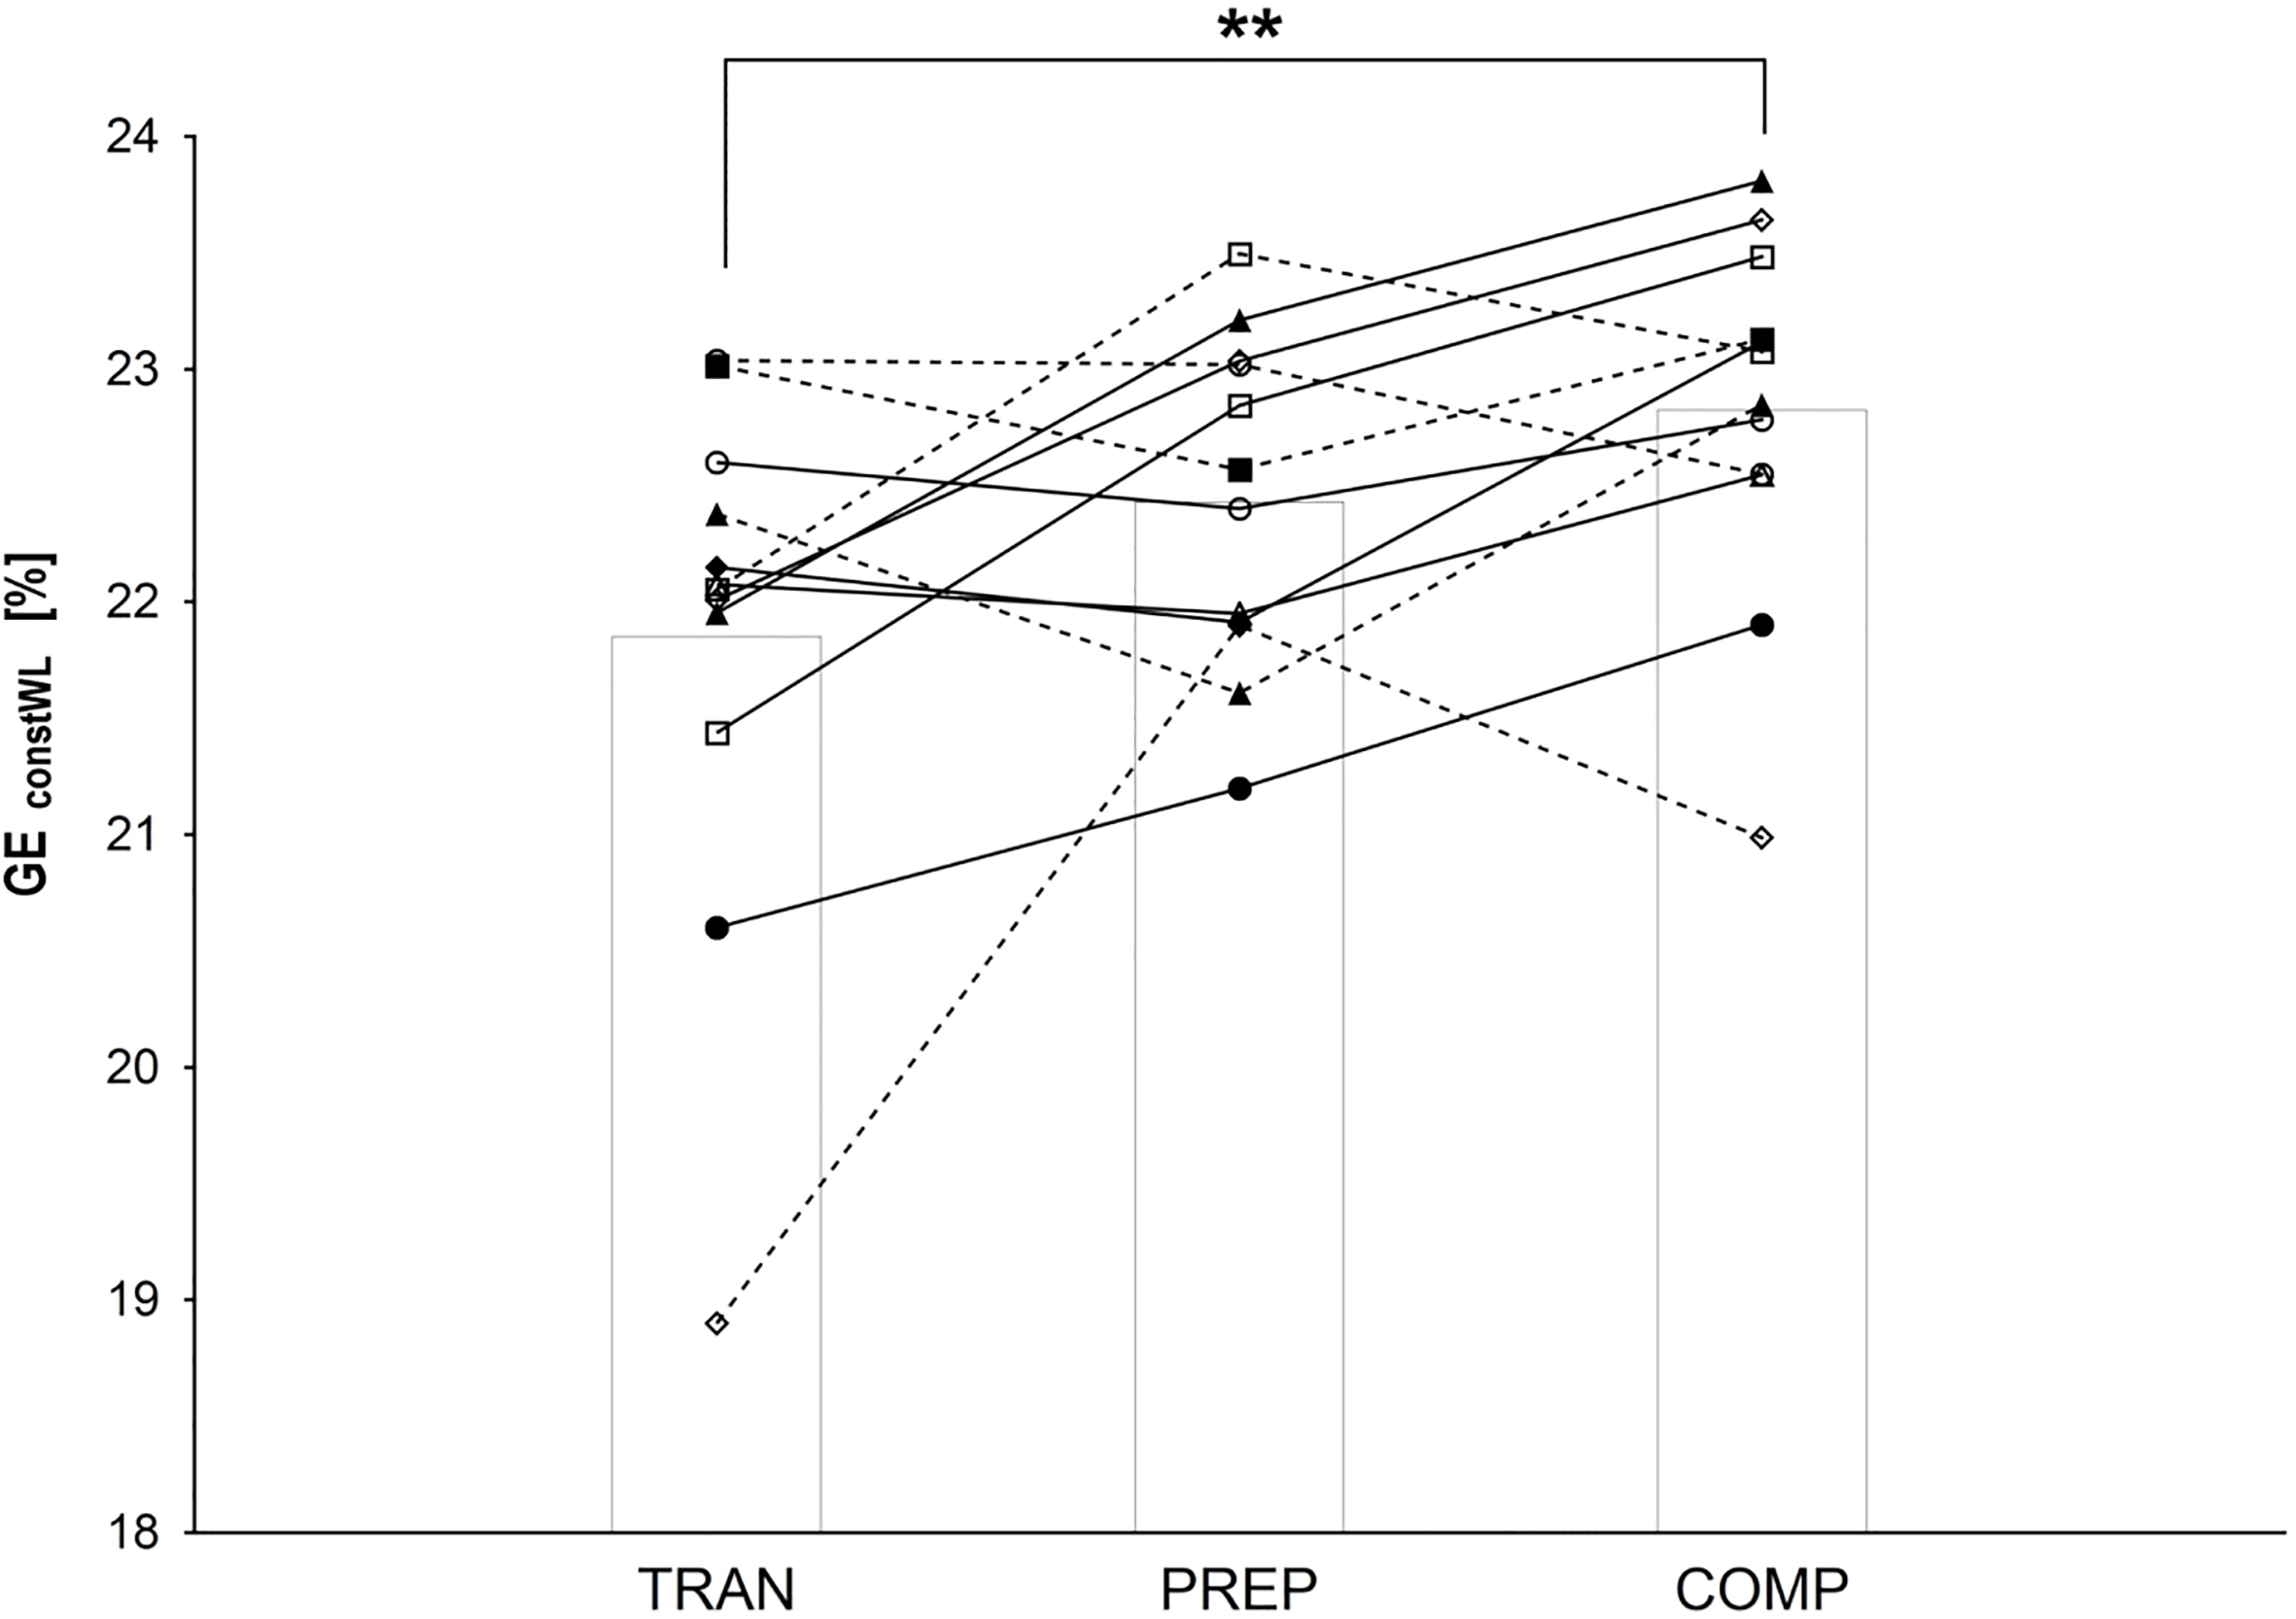
Individual changes of gross efficiency over the season ( 12). Note: TRAN – transition period, PREP – preparatory period, COMP – competition period; GE – gross efficiency at constant absolute workload; 0.01 significant differences between mean values (COMP vs. TRAN).
Compared to TRAN, VO increased significantly ( 0.01) in the COMP period (by 9.5% and 9.4% for absolute and relative values, respectively). Furthermore, %VO at LT was significantly higher ( 0.05) in COMP compared to values noted in TRAN (by 6.9%) and in PREP (by 5.7%). The statistical analysis also revealed significantly higher VE in PREP and in COMP compared to TRAN ( 0.05) (Table 2). GE increased from 21.9 1.1% in TRAN to 22.4 0.7% in PREP and to 22.8 0.8% in COMP. The changes between TRAN and COMP were statistically significant ( 0.01; Fig. 2).
No significant correlations were found between absolute and relative VO and GE in any training period ( 0.25, 0.432 TRAN; 0.24, 0.447 PREP; 0.27, 0.933 COMP for absolute values and 0.48, 0.117 TRAN; 0.37, 0.243 PREP; 0.55, 0.063 COMP for relative values). No significant correlations were also revealed between changes of absolute VO (0.44, 0.155; 0.14, 0.667) or relative VO (0.38, 0.221; 0.36, 0.253) and changes in GE (values for changes between TRAN/PREP and PREP/COMP, respectively).
Maximal and lactate threshold workload
Results showed time effect for the absolute ( 6.33, 0.007) and relative ( 5.12, 0.015) WL. Significant differences were also found in the absolute ( 11.94, 0.0003) and relative ( 11.19, 0.0004) WL. Maximal and lactate threshold workload gradually increased over the course of a season, and, in the COMP period both WL and WL were significantly higher compared to TRAN (Table 3). Body mass (BM) and fat free mass (FFM) did not differ significantly between the training phases, but the analysis revealed significant differences in fat content (%FAT) ( 5.96, 0.009). %FAT decreased in PREP ( 0.05) and remained at this level in COMP period (Table 4).
Maximal and lactate threshold workload over the season. Data are means ( SD)
We re-analyzed one-way ANOVA as a one-way ANCOVA. We used training volume (h) as a covariate to the training-induced changes in subjects. After taking into account the training volume in PREP and COMP periods, ANCOVA produced the same results as ANOVA. The analysis revealed time effect for %VO at LT ( 7.95, 0.010). %VO at LT was significantly higher ( 0.05) in COMP compared to PREP. Other physiological variables did not differ significantly between PREP and COMP periods.
Discussion
The results obtained in this study indicated that although VO did not increase in well-trained cyclists over the course of the season, other endurance performance indicators significantly improved, reaching the highest level in the competition period. During the season, WL increased by 11%, which was accompanied by an increase in VO. The appearance of the LT changed significantly from intensity of 80.1% to 85.6% of VO. GE increased from 21.9% in TRAN to 22.8% in the COMP period. Absolute and relative WL also improved, despite no significant changes in VO.
The lack of significant changes in VO during the season observed in our study is consistent with the general view that although VO is a strong predictor of endurance performance, its trainability over an athlete’s career is limited [3]. In accordance with our results, previous research shows no significant effect of training process on VO in well-trained athletes [17, 19, 21, 39, 40]. An attribute more susceptible to the effect of training is WL [3]. WL determines the highest power output that can be maintained for a prolonged time without a rapid increase in fatigue [11, 12]. As expected, results of this study showed that during the macrocycle, absolute and relative WL increased significantly in the COMP period and were over 11% higher than in the TRAN period (Table 3). Similarly, in a study conducted by Lucía et al. [18] WL improved by 18.8% in professional cyclists between rest and competition periods. An increase in threshold power during the season in elite cyclists was also previously reported by Chicharro et al. [24] and Hoogeveen [41]. The improvement of WL in the competition phase is important because this ability is considered to be the main indicator associated with the competition results in road cycling [12, 42]. WL determined by the D-max method is the best estimator ( 0.84) of 1-h race pace [8] and it is correlated ( 0.77) with the average power output during the 90-min time trial [43]. Furthermore, our earlier study [44] demonstrated LT determined by the D-max method corresponds to the maximal lactate steady state (MLSS).
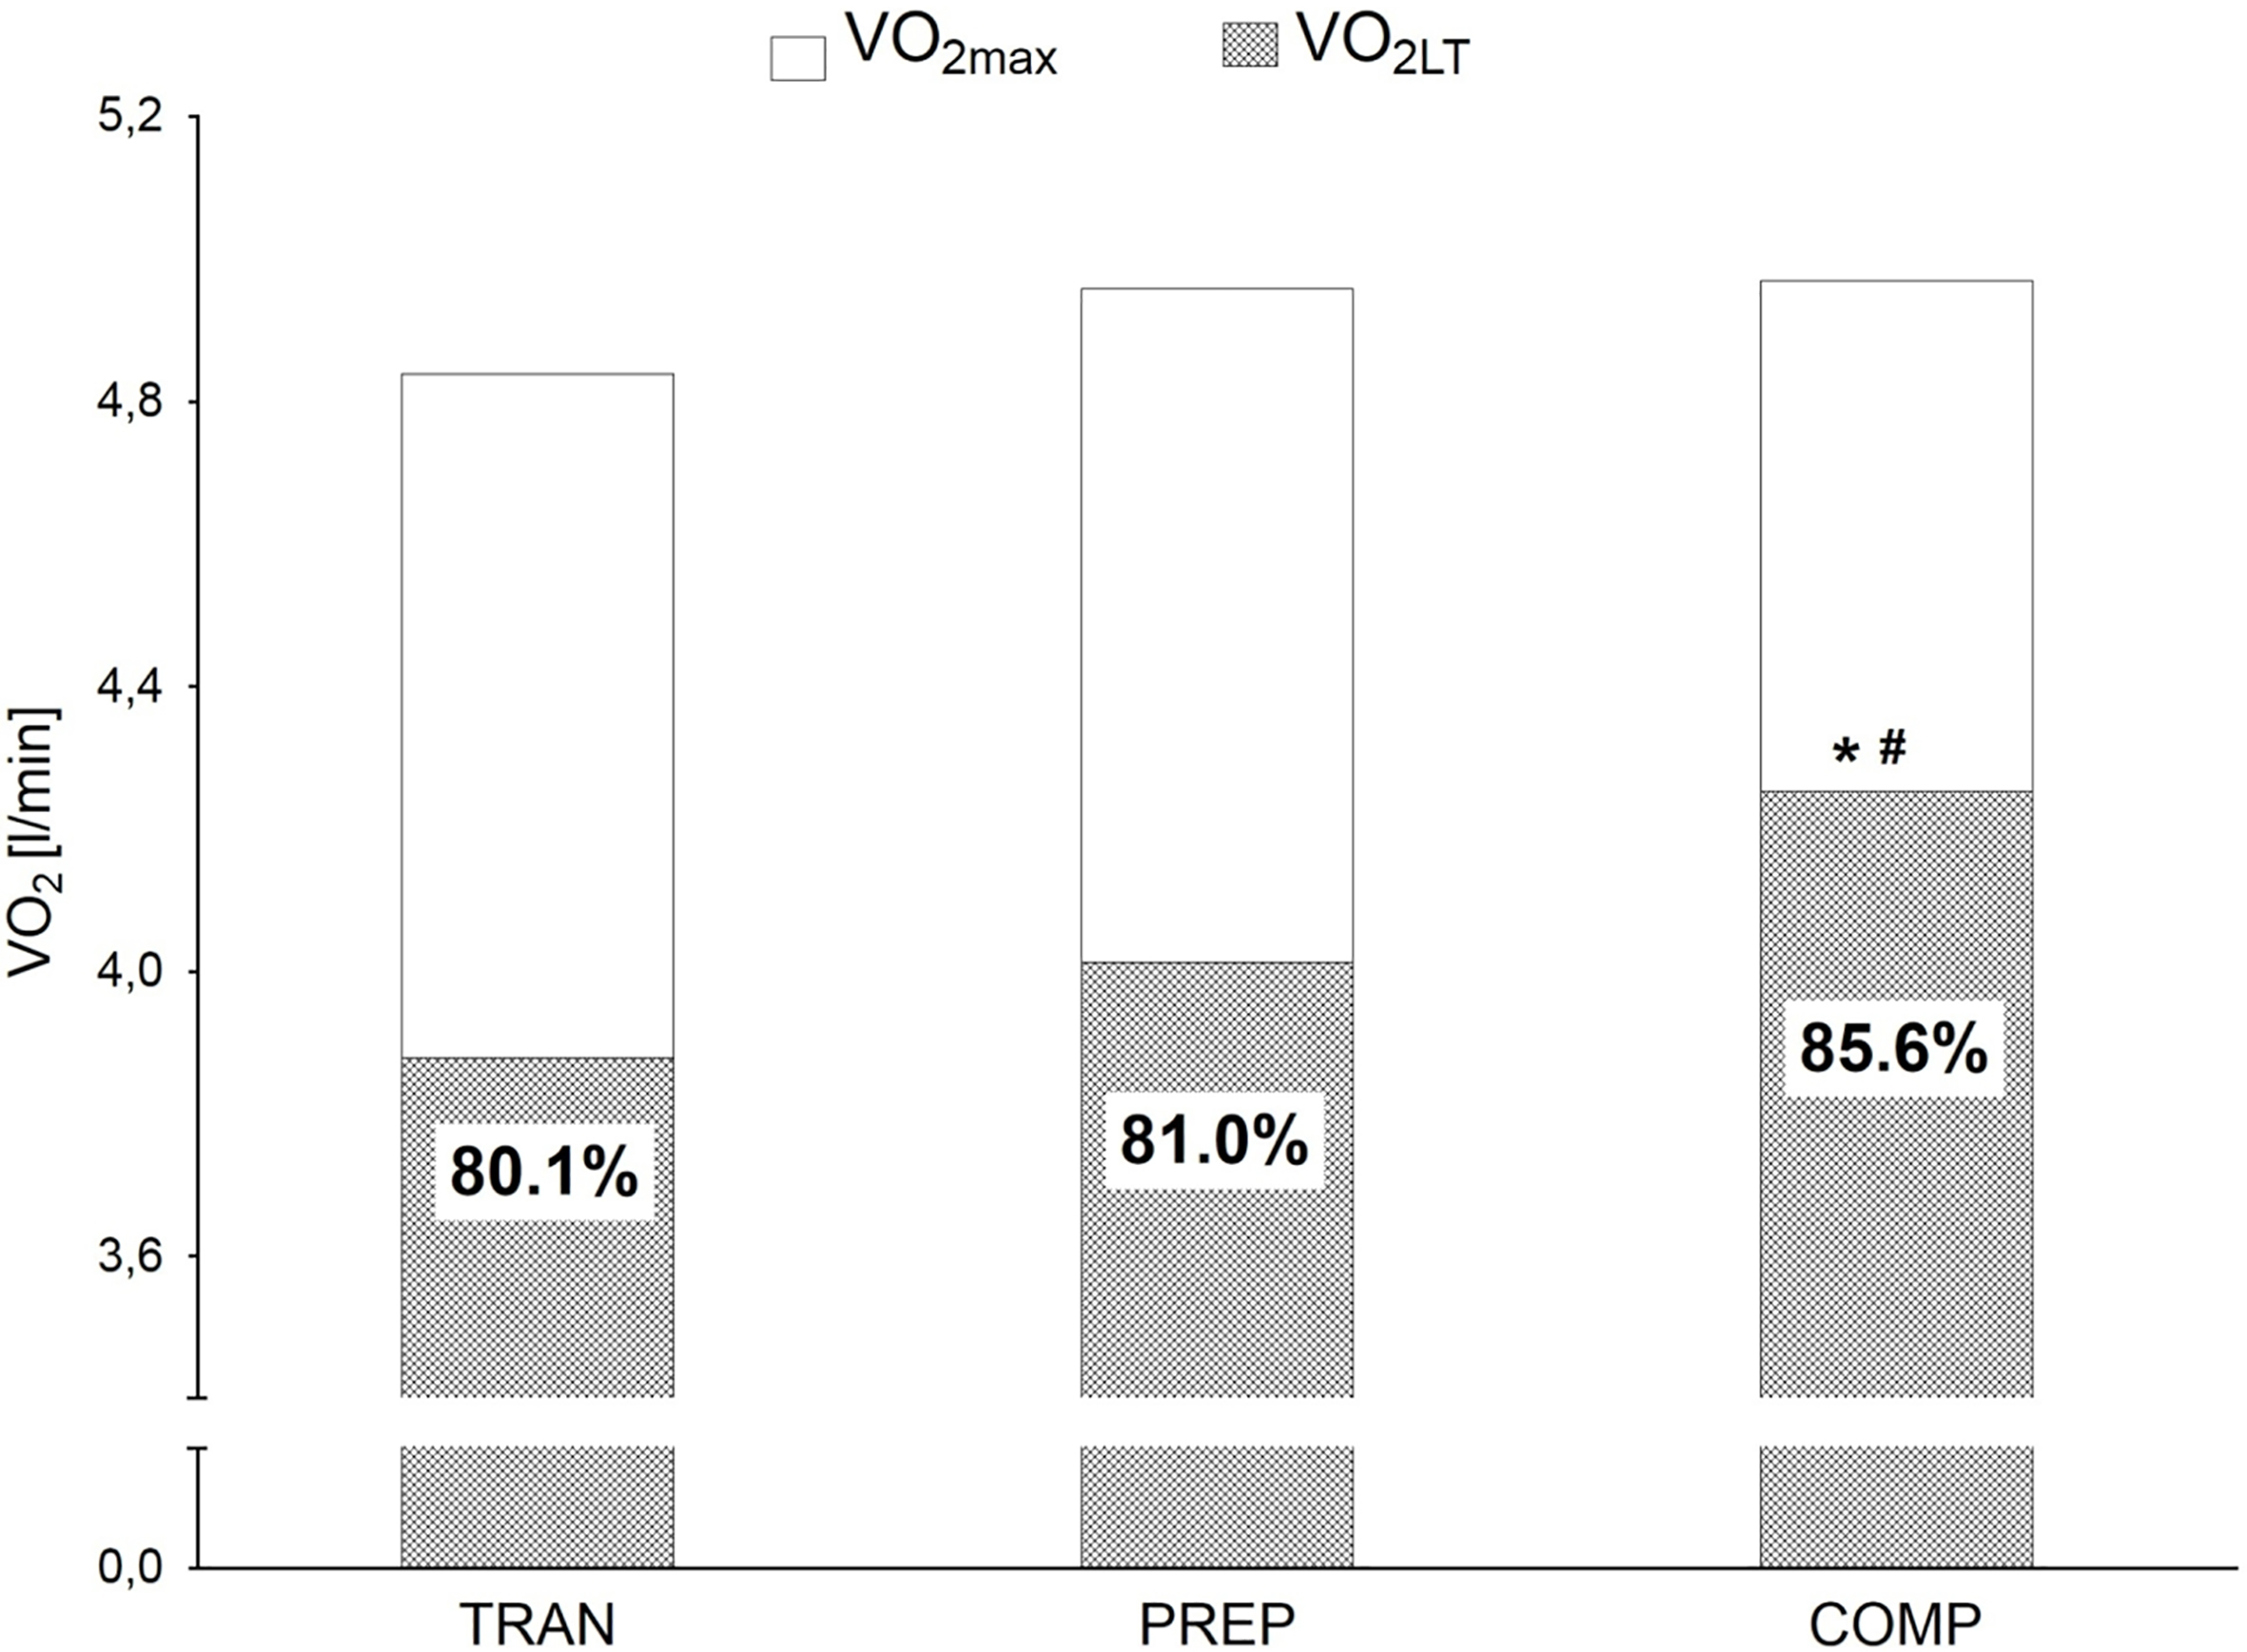
Changes in maximal oxygen uptake, oxygen uptake at lactate threshold and percentage of maximal oxygen uptake at lactate threshold workload over the season. Note: TRAN – transition period, PREP – preparatory period, COMP – competition period; VO – maximal oxygen uptake, VO – oxygen uptake at lactate threshold workload; 0.05 vs. TRAN; 0.05 vs. PREP – significant differences in %VO at LT.
The ability to maintain high power over prolonged time is associated with the ability to use and maintain a high percentage of VO at this time. In endurance trained athletes, LT occurs at intensity ranging from 75 to 90% VO [2, 3], which was also confirmed by our research, where %VO at LT in the COMP period was 85.6%. The improvement in %VO at LT is an important training goal as this feature may determine successful competitive performance in athletes with a similar VO level. A study conducted by Coyle et al. [45] showed that mean time to fatigue during exercise at 88% VO was more than twofold longer (60.8 vs. 29.1 min) in cyclists with similar VO but with the highest %VO at LT. Our results clearly indicated that it is possible to significantly increase %VO at LT during the season even in well-trained athletes with stabilized VO (Fig. 3). It should be noted that %VO at LT was the only indicator that increased significantly between the PREP and COMP periods. This may suggest that training intensity, which clearly increases with training (Fig. 1), may be important to the improvement of this feature. However, in our study, no significant correlations were found between training intensity or volume and changes in %VO at LT and other physiological variables.
Similarly to WL, WL can also represent a predictor of cycling performance, especially for time trials [46, 47, 48]. However, the strength of the relationship between WL and endurance performance depends on race duration [43]. In agreement with the previous findings of Hoogeveen [41] and Hopker et al. [22], the relative and absolute W in present study changed significantly by over 4%. The increases in WL over the season, despite no significant changes in VO, are likely to have resulted from the improvements in energy cost of exercise. This may be partially confirmed by the lack of changes in LA during the incremental test, despite higher absolute WL in subsequent training periods.
An important aspect of this study was to evaluate whether GE changes occur over the course of the season. In our study, GE increased from 21.9% to 22.8% between December and June. Our results are consistent with recent research conducted by Hopker et al. [22], which demonstrated improvements in GE by 1% in cyclists over the course of the competitive season. Likewise, Sassi et al. [20] indicated similar increases in GE (from 21.3% to 22.4%) between rest and competition periods, however no statistical significance was found for these changes, probably due to a small sample size. Although, based on the above observations, it can be concluded that an increase in GE is possible over the season even in well-trained athletes, however it is worth noting that the direction and dynamics of individual changes of GE were differentiated (Fig. 2). In our study, individual changes of GE between the TRAN and COMP periods ranged from 0.5 to 2.1%. Furthermore, we observed individual seasonal fluctuations in GE, as previously reported also by Sassi et al. [20]. The causes of fluctuations in GE levels over the season remain unknown. Individual GE fluctuations during the season may result from individual responses to period-specific training stimuli. Changes in GE may be due to increased oxygen uptake and/or the decline of RER during submaximal exercise as a consequence of insufficient recovery resulting from greater training and racing loads [49]. Furthermore, the GE value depends on RER. Hopker et al. [50] observed a decrease in RER by 0.05 reduces the calculated energy expenditure by 1.3% and increases GE by 0.4%. One of the factors affecting RER is diet [51, 52]. Athletes’ diets may change with different training cycles [53, 54]. In endurance athletes during competitive periods, higher carbohydrate intakes are thought to support recovery and performance [53]. This may cause changes in RER and affect the GE value.
The increase in cycling efficiency is associated with improved conversion of chemical energy from ATP hydrolysis into mechanical energy for muscle contraction [2]. Training may influence this process by modification of fibers type, alterations in muscle recruitment that lead to changes in uncoupling proteins (UCP3) [26, 33, 55, 56]. However, chronic adaptations in skeletal muscles are the cumulative effect of repeated bouts of exercise with prolonged training [57]. Therefore, over several years, the rise of efficiency may be more pronounced. The results obtained by Santalla et al. [56] showed an increase in delta efficiency (from 23.61% to 26.97%) in world-class professional cyclists during a five-season period. Likewise, a case study of Tour de France Champion carried out by Coyle [58] revealed improvements in GE from 21.2% to 23.1% in over the 7-yr period, but the results of this research were widely debated [59, 60]. An effective method to improve the efficiency in a short period of time may be offered by altitude training, which can increase aerobic performance not only by improving blood oxygen-carrying capacity [61], but also by non-hematological adaptive mechanisms [62]. Previous studies showed several weeks of altitude training reduces submaximal O consumption by 3–10% that lead to improved exercise efficiency [63, 64, 65, 66]. Gore et al. [67] indicated that GE increased from 18.9% to 19.7% in endurance athletes after 23 nights of using the live high-train low method. For this reason, altitude/hypoxic training may be helpful, especially in well-trained athletes in whom the range of adaptive changes under normal training regime is limited.
Some studies indicated efficiency is negatively correlated with VO [6, 40, 56]. Hopker et al. [40], based on an inverse relationship between changes in GE and changes in VO over a training season, proposed the increase of GE compensated for the stabilization or decline in maximal aerobic capacity. In our study, in accordance with the results presented by Moseley et al. [32] and Sassi et al. [20], we did not find significant correlations between GE and VO, or between changes in GE and changes in VO in any training period.
Conclusions
The results obtained in our study demonstrated that key factors of endurance performance change in well-trained athletes over the course of the season, reaching a peak level during a competition period. The training process contributes to improvement of mainly submaximal indicators, while not changing VO. The percentage of VO at LT increases and WL moves towards higher loads. GE is an indicator that is expected to improve over the season, but further research is needed to explain the mechanisms responsible for the individual fluctuations of GE value in athletes. There were no significant relationships between GE and VO.
Footnotes
Conflict of interest
The authors declare no conflict of interest.
References
1.
BassettDR, JrHowleyET. Limiting factors for maximum oxygen uptake and determinants of endurance performance. Med Sci Sports Exerc. 2000; 32: 70-84.
2.
JoynerMJCoyleEF. Endurance exercise performance: the physiology of champions. J Physiol. 2008; 586: 35-44. doi: 10.1113/jphysiol.2007.143834.
3.
LundbyCRobachP. Performance enhancement: what are the physiological limits? Physiology (Bethesda). 2015; 30(4): 282-92. doi: 10.1152/physiol.00052.2014.
4.
PadillaSMujikaICuestaGGoirienaJJ. Level ground and uphill cycling ability in professional road cycling. Med Sci Sports Exerc. 1999; 31: 878-885.
5.
Fernandez-GarciaBTerradosNPerez-LandaluceJRodriguez-AlonsoM. Intensity of exercise during road race pro-cycling competition. Med Sci Sports Exerc. 2000; 32(5): 1002-1006.
6.
LucíaAHoyosJPerezMSantallaAChicharroJL. Inverse relationship between VO2max and economy/efficiency in world-class cyclists. Med Sci Sports Exerc. 2002; 34(12): 2079-2084. doi: 10.1249/01.MSS.0000039306.92778.DF.
7.
CoyleEF. Integration of the physiological factors determining endurance performance ability. Exerc Sport Sci Rev. 1995; 23: 25-63.
8.
BishopDJenkinsDGMackinnonLT. The relationship between plasma lactate parameters, Wpeak and 1-h cycling performance in women. Med Sci Sports Exerc. 1998; 30(8): 1270-1275.
9.
AtkinsonGDavisonRJeukendrupAPassfieldL. Science and cycling: current knowledge and future directions for research. J Sports Sci. 2003; 21: 767-787. doi: 10.1080/0264041031000102097.
10.
GregoryJJohnsDPWallsJT. Relative vs. absolute physiological measures as predictors of mountain bike cross-country race performance. J Strength Cond Res. 2007; 21: 17-22. doi: 10.1519/R-17635.1.
11.
CoyleEF. Physiological determinants of endurance exercise performance. J Sci Med Sport. 1999; 2(3): 181-189. doi: 10.1016/S1440-2440(99)80172-8.
12.
FariaEWParkerDLFariaIE. The science of cycling physiology and training – Part 1. Sports Med. 2005; 35(4): 285-312. doi: 10.2165/00007256-200535040-00002.
13.
ViruA. The mechanism of training effects: a hypothesis. J Sports Med. 1984; 5: 219-227. doi: 10.1055/s-2008-1025909.
14.
MidgleyAWMcNaughtonLRJonesAM. Training to enhance the physiological determinants of long-distance running performance. Can valid recommendations be given to runners and coaches based on current scientific knowledge? Sports Med. 2007; 37(10): 857-880. doi: 10.2165/00007256-200737100-00003.
15.
BompaTO. Periodization: theory and methodology of training. 4th ed. Champaign (IL): Human Kinetics; 1999.
16.
IssurinVB. New horizons for the methodology and physiology of training periodization. Sports Med. 2010; 40(3): 189-206. doi: 10.2165/11319770-000000000-00000.
17.
BarbeauPSerresseOBoulayMR. Using maximal and submaximal aerobic variables to monitor elite cyclists during a season. Med Sci Sports Exerc. 1993; 25: 1062-9.
18.
LucíaAHoyosJPerezMChicharroJL. Heart rate and performance parameters in elite cyclists: a longitudinal study. Med Sci Sports Exerc. 2000a; 32(10): 1777-1782.
19.
GalyOManettaJCosteOMaimounLChamariKHueO. Maximal oxygen uptake and power of lower limbs during a competitive season in triathletes. Scan J Med Sci Sports. 2003; 13: 185-193. doi: 10.1034/j.1600-0838.2003.10170.x.
20.
SassiAImpellizzeriFMMorelliAMenaspàPRampininiE. Seasonal changes in aerobic fitness indices in elite cyclists. Appl Physiol Nutr Metab. 2008; 33(4): 735-42. doi: 10.1139/H08-046.
21.
LucíaAHoyosJPardoJChicharroJL. Metabolic and neuromuscular adaptations to endurance training in professional cyclists: a longitudinal study. Jap J Physiol. 2000b; 50: 381-388. doi: 10.2170/jjphysiol.50.381.
22.
HopkerJColemanDPassfieldL. Changes in cycling efficiency during a competitive season. Med Sci Sports Exerc. 2009a; 41(4): 912-919. doi: 10.1249/MSS.0b013e31818f2a.
23.
FosterCFitzgeraldDSpatzP. Stability of the blood lactate-heart rate relationship in competitive athletes. Med Sci Sports Exerc. 1999; 31(4): 578-582.
24.
ChicharroJLHoyosJLucíaA. Effects of endurance training on the isocapnic buffering and hypocapnic hyperventilation phases in professional cyclists. Br J Sports Med. 2000; 34: 450-455. doi: 10.1136/bjsm.34.6.450.
25.
Garcia-PallaresJGarcia-FernandezMSanchez-MedinaLIzquierdoM. Performance changes in world-class kayakers following two different training periodization models. Eur J Appl Physiol. 2010; 110: 99-107. doi: 10.1007/s00421-010-1484-9.
26.
HorowitzJFSidossisLSCoyleEF. High efficiency of type 1 muscle fibres improves performance. Int J Sports Med. 1994; 15: 152-157. doi: 10.1055/s-2007-1021038.
27.
PassfieldLDoustJH. Changes in cycling efficiency and performance after endurance exercise. Med Sci Sports Exerc. 2000; 32(11): 1935-41.
28.
HopkerJGColemanDAWilesJD. Differences in efficiency between trained and recreational cyclists. Appl Physiol Nutr Metab. 2007; 32(6): 1036-42. doi: 10.1139/H07-070.
29.
HopkerJGColemanDAGregsonHCJobsonSAVon der HaarTWilesJ, et al. The influence of training status, age, and muscle fiber type on cycling efficiency and endurance performance. J Appl Physiol. 2013; 115: 723-729. doi: 10.1152/japplphysiol.00361.2013.
30.
NickleberryBLBrooksGA. No effect of cycling experience on leg cycle ergometer efficiency. Med Sci Sports Exerc. 1996; 28: 1396-1401.
31.
MarshAPMartinPEFoleyKO. Effect of cadence, cycling experience, and aerobic power on delta efficiency during cycling. Med Sci Sports Exerc. 2000; 32: 1630-1634.
32.
MoseleyLAchtenJMartinJCJeukendrupAE. No differences in cycling efficiency between world-class and recreational cyclists. Int J Sports Med. 2004; 25: 374-379. doi: 10.1055/s-2004-815848.
33.
MogensenMBaggerMPedersenPKFernstromNSahlinK. Cycling efficiency in humans is related to low UCP3 content and to type I fibres but not to mitochondrial efficiency. J Physiol. 2006; 571: 669-81. doi: 10.1113/jphysiol.2005.101691.
34.
ImpellizzeriFMMarcoraSM. The physiology of mountain biking. Sports Med. 2007; 37(1): 59-71. doi: 10.2165/00007256-200737010-00005.
35.
ColeMColemanDHopkerJWilesJ. Improved gross efficiency during long duration submaximal cycling following a short-term high carbohydrate diet. Int J Sports Med. 2014; 35(3): 265-269. doi: 10.1055/s-0033-1348254.
36.
KuipersHVerstappenFTJKeizerHAGuertenPvan KranenburgG. Variability of aerobic performance in the laboratory and its physiological correlates. Int J Sports Med. 1985; 6: 197-201. doi: 10.1055/s-2008-1025839.
37.
ChengBKuipersHSnyderACKeizerHAJeukendrupAHesselinkM. A new approach for the determination of ventilator and lactate thresholds. Int J Sports Med. 1992; 13: 518-522. doi: 10.1055/s-2007-1021309.
38.
LuskG. Animal calorimetry twenty-fourth paper. Analysis of the oxidation of mixtures of carbohydrate and fat. J Biol Chem. 1924; 59: 41-42.
39.
EvertsenFMedbøJIBonenA. Effect of training intensity on muscle lactate transporters and lactate threshold of cross-country skiers. Acta Physiol Scand. 2001; 173: 195-205. doi: 10.1046/j.1365-201X.2001.00871.x.
40.
HopkerJColemanDJobsonSAPassfieldL. Inverse relationship between VO2max and Gross Efficiency. Int J Sports Med. 2012; 33: 789-794. doi: 10.1055/s-0032-1304640.
41.
HoogeveenAR. The effect of endurance training on the ventilator response to exercise in elite cyclists. Eur J Appl Physiol. 2000; 82: 45-51. doi: 10.1007/s004210050650.
42.
LucíaAPardoJDurántezAHoyosJChicharroJL. Physiological differences between professional and elite road cyclists. Int J Sports Med. 1998; 19(5): 342-8. doi: 10.1055/s-2007-971928.
43.
BentleyDJMcnaughtonLRThompsonDVleckVEBatterhamAM. Peak power output, the lactate threshold, and time trial performance in cyclists. Med Sci Sports Exerc. 2001; 33(12): 2077-2081.
44.
CzubaMZaja̧cACholewaJPoprzȩckiSWaśkiewiczZ. Lactate threshold (D-max method) and maximal lactate steady-state in cyclists. J Hum Kinet. 2009; 21: 49-56. doi: 10.2478/v10078-09-0006-5.
45.
CoyleEFCogganARHopperMKWaltersTJ. Determinants of endurance in well-trained cyclists. J Appl Physiol. 1988; 64(6): 2622-2630. doi: 10.1152/jappl.1988.64.6.2622.
46.
HawleyJANoakesTD. Peak power output predicts maximal oxygen uptake and performance time in trained cyclists. Eur J Appl Physiol. 1992; 65: 79-83. doi: 10.1007/BF01466278.
47.
BentleyDJWilsonGJDavieAJZhouS. Correlations between peak power output, muscular strength and cycle time trial performance in triathletes. J Sports Med Phys Fitness. 1998; 38: 201-207.
48.
BalmerJDavisonRCBirdSR. Peak power predicts performance power during an outdoor 16.1-km cycling time trial. Med Sci Sports Exerc. 2000; 32: 1485-1490.
49.
UrhausenAGabrielHHWWeilerBKindermannW. Ergometric and psychological findings during overtraining: a long-term follow-up study in endurance athletes. Int J Sports Med. 1998; 19: 114-120. doi: 10.1055/s-2007-971892.
50.
HopkerJPassfieldLColemanDJobsonSEdwardsLCarterH. The effects of training on gross efficiency in cycling: a review. Int J Sports Med. 2009b; 30(12): 845-50. doi: 10.1055/s-0029-1237712.
51.
JanssonE. On the significance of the respiratory exchange ratio after different diets during exercise in man. Acta Physiol Scand. 1982; 114: 103-110. doi: 10.1111/j.1748-1716.1982..
52.
Zaja̧cAPoprzȩckiSMaszczykACzubaMMichalczykMZydekG. The effects of a ketogenic diet on exercise metabolism and physical performance in off-road cyclists. Nutrients. 2014; 6: 2493-2508. doi: 10.3390/nu6072493.
HeikuraIAStellingwerffTBurkeLM. Self-reported periodization of nutrition in elite female and male runners and race walkers. Front Physiol. 2018; 9: 1732. doi: 10.3389/fphys.2018.01732.
55.
SchrauwenPHesselinkM. Uncoupling protein 3 and physical activity: the role of uncoupling protein 3 in energy metabolism revisited. Proc Nutr Soc. 2003; 62: 635-643. doi: 10.1079/PNS2003277.
56.
SantallaANarnjoJTerradosN. Muscle efficiency improves over time in world-class cyclists. Med Sci Sports Exerc. 2009; 41: 1096-1101. doi: 10.1249/MSS.0b013e318191c802.
57.
HawleyJA. Adaptations of skeletal muscle to prolonged, intense endurance training. Clin Exp Pharmacol Physiol. 2002; 29: 218-222. doi: 10.1046/j.1440-1681.2002.03623.x.
58.
CoyleEF. Improved muscular efficiency displayed as Tour de France champion matures. J Appl Physiol. 2005; 98: 2191-2196. doi: 10.1152/japplphysiol.00216.2005.
SchumacherYOVogtSRoeckerKSchmidA. Scientific considerations for physiological evaluations of elite athletes. J Appl Physiol. 2005; 99: 1630-1632. doi: 10.1152/japplphysiol.00563.2005.
61.
PłoszczycaKLangfortJCzubaM. The effects of altitude training on erythropoietic response and hematological variables in adult athletes: a narrative review. Front Physiol. 2018; 9: 375. doi: 10.3389/fphys.2018.00375.
62.
CzubaMWaśkiewiczZZajacAPoprzeckiSCholewaJRoczniokR. The effects of intermittent hypoxic training on aerobic capacity and endurance performance in cyclists. J Sport Sci Med. 2011; 10: 175-183.
63.
KatayamaKMatsuoHIshidaKMoriSMiyamuraM. Intermittent hypoxia improves endurance performance and submaximal exercise efficiency. High Alt Med Biol. 2003; 4: 291-304. doi: 10.1089/152702903769192250.
64.
SaundersPUTelfordRDPyneDBCunninghamRBGoreCJHahnAG, et al. Improved running economy in elite runners after 20 days of simulated moderate-altitude exposure. J Appl Physiol. 2004; 96(3): 931-937. doi: 10.1152/japplphysiol.00725.2003.
65.
NeyaMEnokiTKumaiYSugohTKawaharaT. The effects of nightly normobaric hypoxia and high intensity training under intermittent normobaric hypoxia on running economy and hemoglobin mass. J Appl Physiol. 2007; 103: 828-834. doi: 10.1152/japplphysiol.00265.2007.
66.
CzubaMMaszczykAGerasimukDRoczniokRCzuba-FidosOZaja̧cA, et al. The effects of hypobaric hypoxia on erythropoiesis, maximal oxygen uptake and energy cost of exercise under normoxia in elite biathletes. J Sports Sci Med. 2014; 1: 912-920.
67.
GoreCJHahnAGAugheyRJMartinDTAshendenMJClarkSA, et al. Live high:train low increases muscle buffer capacity and submaximal cycling efficiency. Acta Physiol Scand. 2001; 173: 275-286. doi: 10.1046/j.1365-201X.2001.00906.x.