
Abstract
BACKGROUND:
Adolescence is characterized by a rapid and erratic growth period. Many factors completely change in growth period up to 20 years of age, with a very slight alteration during the later years of life. Bioelectric impedance analyzers (BIA) are used in estimating the total and segmental body composition compartments.
OBJECTIVE:
To determine the validity of different BIAs for young male athletes.
METHODS:
Sixty-one young male athletes (basketball, football, handball, swimming, and skiing) participated in the study. The validity of Tanita 401A (TANITA), Jawon Segmental Body Composition Analysers model AVIS 333 Plus (AVIS), and Biodynamics Model 310e (BIODYNAMICS) was tested by Bland & Altman analysis and heteroscedasticity, providing the gold standard criterion method, hydrostatic weighing (HW) for body density (D
RESULTS:
BIA models used for predicting body composition, except for %BF of TANITA, are valid and in accord with HW for young male athletes. TANITA had significantly lower %BF (5.75
CONCLUSION:
Prediction of body composition compartments of young male athletes using BIA models is valid except for %BF by TANITA. LBM values of HW and BIA models can be used interchangeably. However, these BIA softwares do not have specific options concerning athletic status for the growing age and sex group to clarify population specificity in adolescent male athletes. Therefore, using the same BIA model is recommendable in following up training regimen and nutritional status, in order to avoid underestimating or overestimating the body composition compartments.
Keywords
Introduction
Adolescence is characterized by a rapid and erratic growth period, since bone mineral content, bone mineral density, LBM and %BF compartments of growing adolescence completely change in growth period up to 20 years of age, with a very slight alteration during the later years of life [1]. Therefore, precision in the assessing body composition compartments of adolescent athletes becomes even more important for health and sport performance parameters during their growing period. Hence, knowing the distribution of LBM and %BF is vital for athletes’ overall health and quality of life at such a critical period [2]. It was reported previously that body composition compartments were affected by sex, age, ethnicity, nutritional behaviours, type of sport, and training level [3, 4, 5, 6, 7]. It was also demonstrated in literature that the accuracy of percentage of body composition compartments was affected by the formulas derived from different criteria methods and 2
One of the commonly used laboratory criteria methods, Dual-energy X-ray Absorptiometry (DXA), is relatively convenient to use and less affected by water fluctuation and provides faster measurement. On the other hand, HW, another criteria method also referred to as the Gold Standard, has two major disadvantages: It has a two-compartment limitation and is impractical in large epidemiological studies. Still another criteria method widely used, the Isotope dilution (deuterium
BIA and anthropometric methods have been widely used in estimating the total and segmental body composition compartments [14, 15, 16], especially due to their lower cost and facility of application. There are different types of BIA using (un)known regression equations regarding hand-to-foot (lying supine or standing), hand-to-hand, and foot-to-foot assessments. In the current literature, there are quite a number of validation studies focusing on different populations and a few other validation studies analyzing adolescents and/or children population of different genders [17], but there are no validation studies for young male athletes.
There are a limited number of prediction formulas developed specifically for different sexes, adult age groups, children, and sports, using D
BIA is easier to use, less expensive, less time consuming, and portable for field studies; therefore, different types and brands of BIA have been used for different population and patient groups over other methods. Furthermore, BIA does not require trained staff, and it gives body composition compartment parameters of the athletes to coaches and sport scientists and of patients to medical therapists in clinics. Different BIA manufacturers’ regression formulas using resistance, reactance, age, sex, and anthropometric parameters were used to measure LBM and %BF [24, 25]. It was demonstrated in some studies that impedance and reactance were affected during measurements by unknown sources of errors such as hydration status, skin temperature, menstruation status, and exercise related body water changes [26, 27, 28]. Other studies found that BIA measurements were affected by the total body water fluctuation throughout the day [29], electrode characteristics and positions [30], skin temperature [31], exercise status [32], nutritional status [33], starving hours after meal [34], menstruation cycle [35, 36], and postural effects [37]. It was also reported that some studies demonstrated BIA models were reliable, within the range of 0.96 to 0.99, while some others showed that they were not reliable [38]. Due to the lack of population specific formulas with options for specific population groups such as adolescence and athletes of different sports, users of BIA often have to opt for alternative modes of measurements [15, 16] which might not apply properly to the population specificity of certain subject groups. Therefore, the aim of the present study was to compare BIA models with the gold standard method, HW in young male athletes.
Methods
Subjects
Sixty-one young male athletes (football players, basketball players, skiing, swimmers, and handball players) aged 15–17 (
Procedures
The subjects were informed about the rules and procedures of the measurement protocol and signed an informed consent statement. Subjects were asked not to use diuretics from 7 days before the study, not to participate in intensive physical activity from 48 hours before, and not use alcohol or caffeine 24 hours before measurements. The study was approved by the University of Hacettepe Ethics Committee (Decision Number: LUT 04/33-8) and complied with the Ethical Guidelines of Helsinki Declaration. All measurements were performed between 09:00–12:30, at room temperature of 22–25
Anthropometric measurements
Body weight (BW) of young male athletes was measured using a scale with
Bioelectrical impedance analysis (BIA) measurements
%BF and LBM data were recorded from the outputs of three analyzers produced by different manufacturers: Tanita TBF 401A, Japan, Avis 333 Plus, and Biodynamics Model 310e, Washington USA.
Tanita TBF 401A (TANITA) model is a tetra-polar foot-to-foot BIA with measurement frequency of 50 kHz and a current of 500 Biodynamics Model 310e (BIODYNAMICS) model is a single frequency, hand-to-foot BIA of a tetrapolar design (four electrodes: hand, wrist, ankle, and metacarpals). Measurement frequency is 50 kHz, and the current-800 AVIS 333 PLUS (AVIS) measurement uses impedance values via tetra-polar electrode method with 8 touch adhesive clip electrodes. Frequency measurement ranges are 5, 50, 250 kHz with a current of about 500
Water Tank (147
The scale chair had a frame made of aluminum alloy, suspended on the hook of the weight gauge sensor (GX Model, NBC, Italy).
Scuba weights (3 pieces worn as a belt, weighing 2 kg each) were used in order to ensure that the subject was fully submerged in water.
Thermometer was used to measure water temperature with 0.1
Before HW, athlete groups were informed about the necessary rules and procedures one week in advance in order to get accurate results. Subjects followed a normal diet, water intake, and exercise one day before the test. They were not allowed to eat or drink anything 4 hours, comsume alcohol 48 hours, do any physical activity 12 hours, or use diuretics 7 days prior to the test. The subjects were asked to empty their intestines and bladder 30 minutes before the test. Temperature of water was set to 35
Closed Circuit Oxygen Dilution method was used to measure RV directly [39]. Following HW measurement, mixed gas was analysed by using Sable Systems RA-1 O
Preparation of the sample bag; The five-liter sample bag was filled with 3 liters of oxygen before being flushed thoroughly and washed 3 times with oxygen gas. The bag was attached to the bottom of a hose with a T-shaped valve.
Residual volume (RV) measurement was performed simultaneously with HW. The athletes were subjected to maximal expiration and inspiration trials in water in order for HW and RV measurements to be performed simultaneously when they were fully familiar. During the simultaneous RV and HW measurement, results were recorded at the end of the maximal expiration, when the scale was stabilized. At the exact time that the measurement was recorded, the T-shaped valve connecting the sampling bag and the snorkel of the subject was used to switch the source of air. Primarily, the valve connected to the atmosphere was closed, and as soon as the valve was closed, the other valve connected to the sample bag was opened. After the opening-closing maneuver was executed, the subject performed three subsequent forced respirations (breath every 2 seconds) from the sample bag, accompanied by simultaneous verbal motivation to force maximal inspiration and expiration. At the end of the last forced expiration (third expiration), the sample bag valve was closed, and then, immediately, the atmosphere valve was opened, allowing the subject to breathe atmospheric air. This measurement was executed ten times for each subject and the average of similar 3 trials was used as the weighing result [13]. Atmospheric pressure, water temperature, and water density were measured and recorded during HW. Finally, the sample gas mixture taken from the sample bag was analyzed by Closed Circuit Oxygen Dilution method [39] in order to find the percentage of O
, and %BF calculations
RV was calculated by using oxygen dilution method (VO
Statistical analysis of data
Repeated Measures of ANOVA was used to determine the differences between LBM and %BF of HW and BIA models. When a significant difference was observed, Bonferroni multiple comparison test was used for paired comparisons. Pearson Product Moment Correlation coefficients calculated from different methods were determined for %BF and LBM. Bland & Altman analysis was applied to determine the agreement between HW and BIA models. The agreements between methods were represented by the bias, estimated by the mean difference, and the SD of the differences. Therefore, the 95% limits of the agreement were calculated as the mean difference
Results
Characteristics of subjects
Sixty-one young male athletes, 15.9
Paired comparisons with HW and BIA models
Table 1 shows the repeated measures of ANOVA results of mean and SD values for %BF and LBM obtained from HW and BIA models. It should be pointed out that %BF of TANITA was lower than that of HW (5.05%), and dependent on this result LBM prediction (3.3 kg) was higher than LBM of HW. The other two multifrequency methods of BIODYNAMICS and AVIS results showed that both of the obtained %BF results were significantly higher (%BF mean of the BIODYNAMICS and AVIS subtracted by that of HW equals to 2.04% and 3.3%, respectively) than %BF of HW, and their LBM results were significantly lower than LBM of HW (LBM mean of the BIODYNAMICS and AVIS subtracted by that of HW equals to 1.27 kg and 2.58 kg, respectively) (Table 1).
Repeated measures of ANOVA for %BF and LBM results of HW and BIA models
Repeated measures of ANOVA for %BF and LBM results of HW and BIA models
*
In addition to the results mentioned above, there were significant differences between the methods used to determine %BF (
There were moderate significant positive correlations between HW and BIA models, TANITA, BIODYNAMICS, and AVIS (
Bland and Altman scatter plots for directly measured %BF and LBM by HW method and estimated %BF and LBM from the three BIA models. Solid line represents the mean difference (bias) between measured and estimated %BF and LBM. Slope of trend lines were shown with dashed line. Upper and lower broken lines represent the 95% limits of agreement (mean difference 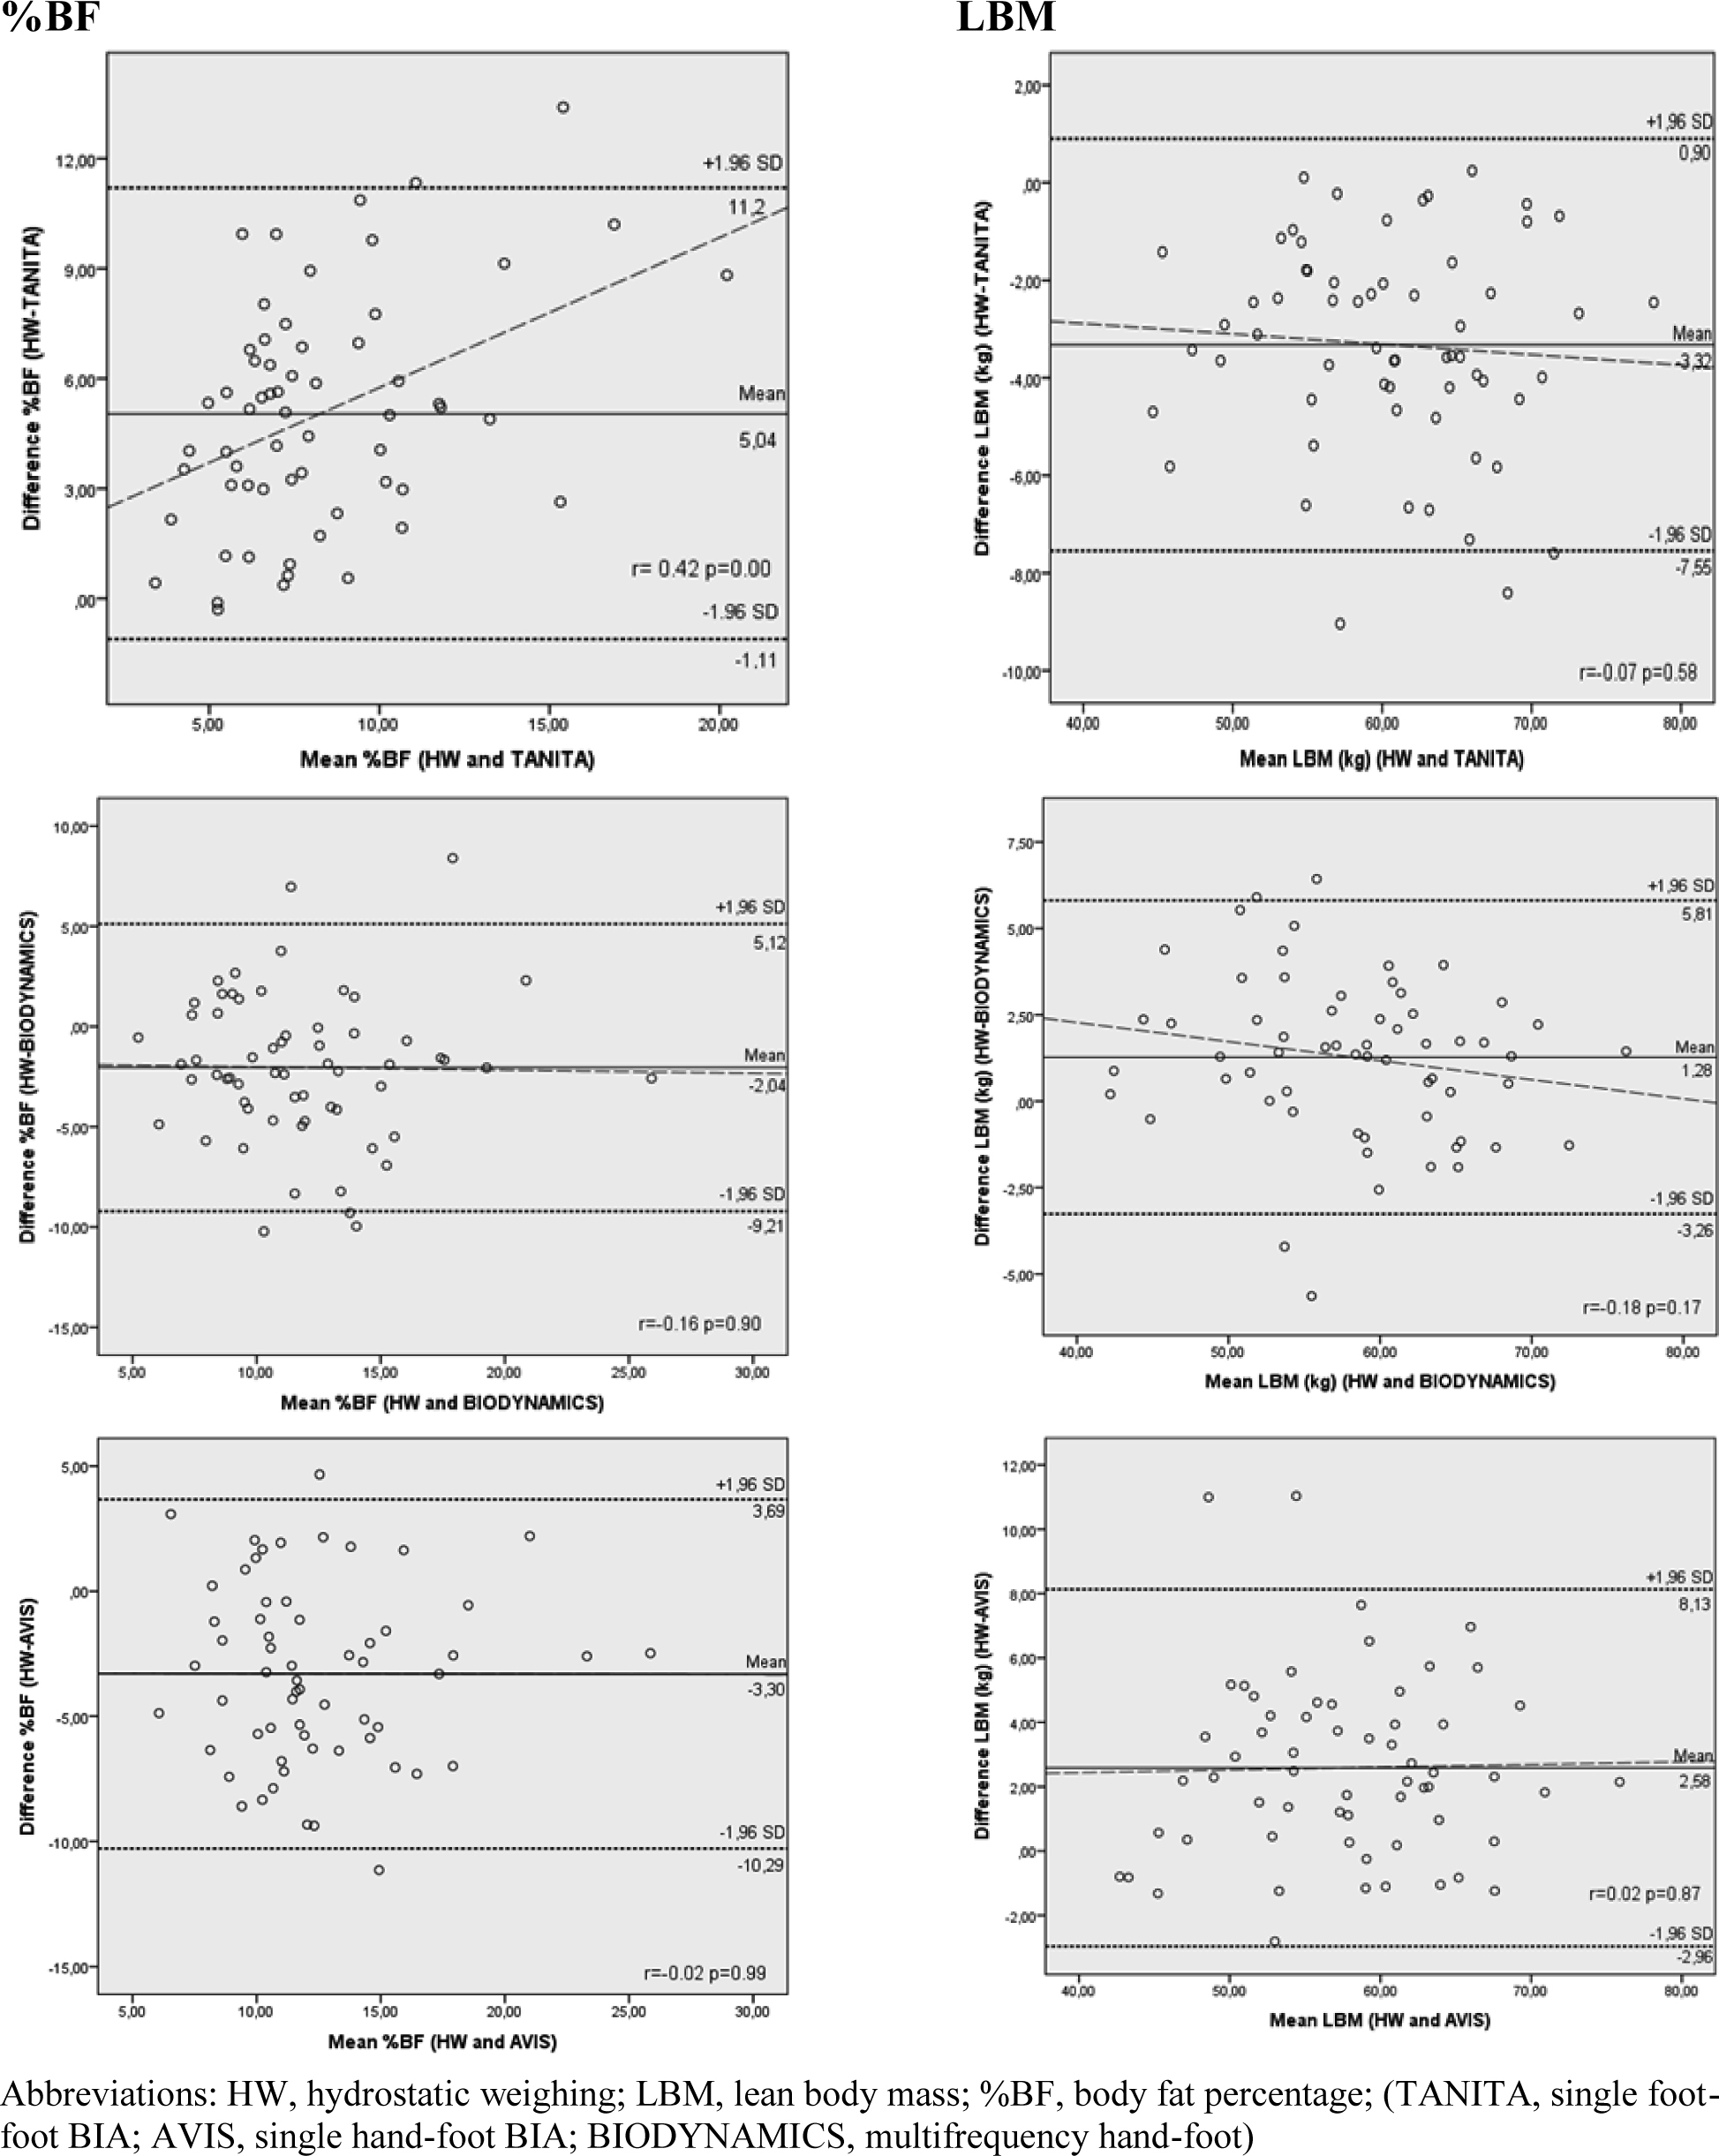
To assess the validity of HW and BIA models, The Bland and Altman plots for %BF and LBM using HW and estimated values of BIA models were depicted in Fig. 1. Despite the consistency in upper and lower limits, %BF values from HW were not consistent with %BF of TANITA model (Fig. 1). Although %BF scatterplots for BIA models seemed to be systematically distributed, the scatterplot where HW was corresponding to TANITA method clustered in a certain area for the %BF. LBM was distributed systematically for all the other BIA models including TANITA. Of all the findings, there was only one positive significant correlation between the differences in HW and the predicted method of TANITA magnitude of %BF (i.e. heteroscedasticity) (
Discussion
This study demonstrated that, compared to HW, BIODYNAMICS and AVIS significantly overestimates %BF and underestimates LBM, in contrast to TANITA. In addition, the obtained results from TANITA were significantly different compared to HW. %BF of AVIS and BIODYNAMICS estimations were more similar to HW values than was TANITA. Both of the BIA methods (AVIS and BIODYNAMICS) used hand-to-foot measurement style with different frequency, and the estimated LBM results were signicantly different from HW.
The reason for the lower results of %BF for TANITA compared to the other hand-to-foot BIA models could be the difference in techniques: AVIS and BIODYNAMICS are hand-to-foot and tetrapolar type, whereas TANITA uses foot-to-foot measurement style. In order to determine the total body impedance, electrical current follows the path with the least resistance i.e.compartments of LBM such as extracellular fluid and muscle [23]. Therefore, foot-to-foot and hand-to-foot measurement styles might produce different results for the total body impedance due to the alterations in the flow of electrical current through the body resulting from inconsistent fat distribution between the lower and upper extremities of young male athletes. Some studies reported that swimmers had higher fat mass in lower extremities [41], while another study, on the contrary, showed that long-distance runners had very low-fat mass in the abdominal region and legs associated with the training intensity and androgenic activity [42]. Specifically, TANITA, as it is a foot-to-foot BIA model, might mislead the user because fat distribution in lower extremities of young male athletes, compared to other regions, might be attenuated by training and/or gained LBM, predicted by total body water and mineral content in young male athletes. In fact, TANITA, with its foot-to-foot measurement style, predicts the total body fat from the impedance of lower segments. Therefore, if evaluated in general, lower %BF and relatively higher LBM could be an expected result in athletes. This is also a proof that the somatotype of athletes could also account for the differences in segmental fat distribution and muscularity. These results suggest that scientists and coaches should use hand-to-foot BIA model as a measurement style to determine body composition compartments.
Pearson product moment correlation coefficients between HW, BIA models of TANITA, AVIS and BIODYNAMICS for %BF and LBM results
Pearson product moment correlation coefficients between HW, BIA models of TANITA, AVIS and BIODYNAMICS for %BF and LBM results
In this study, segmental BIA models, BIODYNAMICS and AVIS, were both visually judged to be systematically distributed in the Bland & Altman plots within the limits of agreement (Fig. 1), which meant that the two BIA models of measurement agreed with HW. On the other hand, when compared to HW, it was observed that both of the segmental BIA models significantly overestimated %BF and underestimated LBM (Table 1). In addition, there were significant positive correlations (
The results of the present study showed that there were significant correlations between TANITA, BIODYNAMICS and AVIS: The correlation between LBM measurements obtained from TANITA and BIODYNAMICS was
The analysis of Bland & Altman and heteroscedasticity results of all BIA models of %BF and LBM, except for TANITA’s %BF values, showed that there was no variance or concordance amongst methods and HW (Fig. 1). Although the analysis of Bland & Altman depicted a systematical distribution of scatterplots of the %BF among HW and the other two BIA analysers, AVIS and BIODYNAMICS, within the limits of agreement, they were observed to have stacked on the left due to the athletic population specificity of the subjects included in the present study, a crucial point for young male athletes, sport scientists, nutritionists, and coaches who use BIA models to consider especially when evaluating the measurement results of body composition. However, in a study comparing %BF values obtained from HW and BIA by the Bland & Altman analysis in sedentary children population of mixed sexes (18.8
Deuterium-dilution has been used in order to measure total body water and water content of LBM during the growing period [4, 44]. However, inter- and intra-cellular contents, including cellular water ratio, change during the biological growing period of adolescence. It was reported in a study that there was a decrease in water content as a fraction of LBM with age. While the density of LBM gm/cc increases, water/LBM ratio slightly decreases. Moreover, while mineral and LBM% increases BW, LBM increases during growth period including adolescence [20].
It was reported in a study that the fluctuation in water content during growth or illnesses seemed to make skinfold measurement imperfect due to the changes in fat mass and/or LBM. It was also demonstrated in the same study that ultrasound, skinfold calipers, and computed tomography (as a reference method) showed significant correlation between the methods. Relative agreement measurements of the skinfold and computed tomography had better results than the results between ultrasound and computed tomography measurements [45]. Another study found that the difference between the predicted and measured D
The validity of the study has side advantageous inferences. For all BIA models, Bland & Altman plots analysis showed that the values distributed in a certain area for BF% can be interpreted as the population specificity in adolescent male athletes. However, this information needs to be considered when using BIA on young male athletes in order to determine the best result for sports scientists or manufacturers. Although the comparative analysis of %BF and LBM obtained from HW confirmed the validity of AVIS and BIODYNAMICS, the result of subtracting each mean %BF of AVIS and of BIODYNAMICS from mean %BF of HW was 2.04 and 3.30, respectively; and it was 1.27 to 3.32 kg, respectively, for mean LBM. Hence, sport scientists and coaches should take the information above into consideration and use this knowledge to monitor training regimen for individual usage.
The three different BIA methods analyzed in this study, except for the %BF of foot-to-foot in TANITA, are useful and valid to for the assesmennt of body composition in young male athletes. On the other hand, it is evident from this study that precision while predicting LBM from total body impedance can be enhanced by adding more parameters to the formulas of each BIA model to specify the populations precisely, such as age, sex, height, athletic status, sport branch, specific age groups, and so on. Therefore, adding more intercepts to equations could help in avoiding an overestimation and underestimation of LBM and/or %BF in male adolescent athletes and compensate for the variations between different specific populations. It should also be noted that HW is still the gold standard since it does not use stable water calibration and is not directly affected by the variations in hydration status, training status, or different age groups, making the method superior to all other criteria methods.
Thus, adding the impedance, reactance, and anthropometric parameters to the regression equation formulas could enhance their prediction power, thereby helping sports scientists, coaches, athletes, and nutritionists to detect even the slightest remarkable changes in %BF and LBM, which, in turn, can help them in advising athletes about losing or gaining weight during periodization of training.
Footnotes
Conflict of interest
The authors declare no conflict of interest.