
Abstract
BACKGROUND AND OBJECTIVE:
Stark inter-gender differences in vertical jump performance exist. Performance-based correlates to the vertical jump are not well understood in women.
METHODS:
Women (
RESULTS:
Performance-based variables predicted moderate (
CONCLUSIONS:
Peak force, typically the strongest correlate to vertical jump performance in men, was not as strong a predictor of the variance in women. Instead women rely on a variety of kinetic and temporal variables to maximize their vertical jump height and power values.
Keywords
Introduction
Maximum vertical jump heights and power outputs occur when persons perform the task against their own body weight without added resistance [26]. Inter-gender differences in vertical jump performance include lower absolute jump height and power values attained by women [2, 24, 25]. Men, on average, have a vertical jump 20.3 cm higher as compared to maximum heights attained by women, with slightly greater inter-gender differences among college basketball players [25]. This performance outcome has been attributed to less absolute lower body strength and anatomical perturbations, such as valgus knee angles, more commonly seen in women [16]. As a result, women may attain lower vertical jump heights for fear of injury upon landing [17]. Since the vertical jump is crucial to athletic endeavors in which rapid vertical displacement of one’s own body is paramount, it is important to identify correlates to its performance [19, 26].
Prior research examined correlations between endogenous testosterone and vertical jump heights done by men (
Vertical rate of force development (RFD,
Few studies have examined performance-based correlates when vertical jump height and power served as criterion measures [4]. To acquire an array of performance-based correlates, force plates are requ-ired [4, 11]. Force plates provide kinetic and temporal indices that were deemed valid and reliable [7, 33]. Furthermore, intra- and inter-session data from force plates are reproducible to values provided by a Vertec, a popular way to measure vertical jump heights [8, 23, 33]. Force plate data were examined as correlates to vertical jumps done by men, and showed performance-based variables accounted for moderate, but significant, amounts of vertical jump height and power variance [4]. Peak force (PF) was the best predictor of jump performance [4]. Since kinetic- and temporal-based data from women could help identify inter-gender differences in jump performance, and anthropometry’s impact on female vertical jump performance is mixed [2], this topic warrants inquiry. Our study’s purpose examines different performance-based variables (kinetic, temporal, force/time integrative, relative to body mass), derived from a force plate, as correlates to countermovement vertical jump height and jump power values obtained from women. We hypothesize the aforementioned types of variables will correlate with significant amounts of peak jump height and power variance data provided by women.
Method
Subjects
Before data collection, a university-based institutional review board approved our study protocol, and then subjects provided informed written consent. Moderately- to well-trained college-age women (
Procedures
Our study’s force plate provides kinetic and temporal data that were previously deemed valid and reliable [7, 8, 33]. The force plate is shaped like an isosceles triangle; the length and depth to each of its sides equaled 98.5 and 11 cm respectively. To enhance surface contact stiffness and limit vibration, a 1.9 cm thick sheet of plywood covered the external surface of the platform. Polyurethane glue was applied to the plywood so that it adhered to the platform’s framework. Within the framework were two metal c-channel beams 6.4 cm apart that ran parallel to each other along each side of the platform. At each of the platform’s corners, between the beams, was a 114 kg capacity load cell (NTEP Grade III; Loadstar, Fremont CA, USA) that recorded force changes as jumps were performed. Force changes were converted to voltage signals and received by a 4-channel, 24-bit full bridge analog input module with internal excitation (model NI9237; National Instruments, Austin TX, USA). A CompactDAQ USB chassis (cDAQ-9172; National Instruments, Austin TX, USA) housed the bridge input module. Software (Labview 8.6; Austin TX, USA) collected data at 5000 Hz. Load cell calibration was routinely verified by an object of a known mass throughout data collection. Waveforms were captured within a 0–5 volt range per load cell and displayed on-line for visual recognition. Waveforms were divided into four phases. Countermovements (eccentric phase) are when considerable lower body series elastic element activity is created, while the takeoff (concentric phase) provides several performance-based variables that may correlate vertical jump height and power values [3, 15, 19, 22]. A representative force-time curve from a countermovement vertical jump appears in Fig. 1.
On-line data collection of a representative force-time curve from a countermovement vertical jump from the current study’s instrumented portable force platform.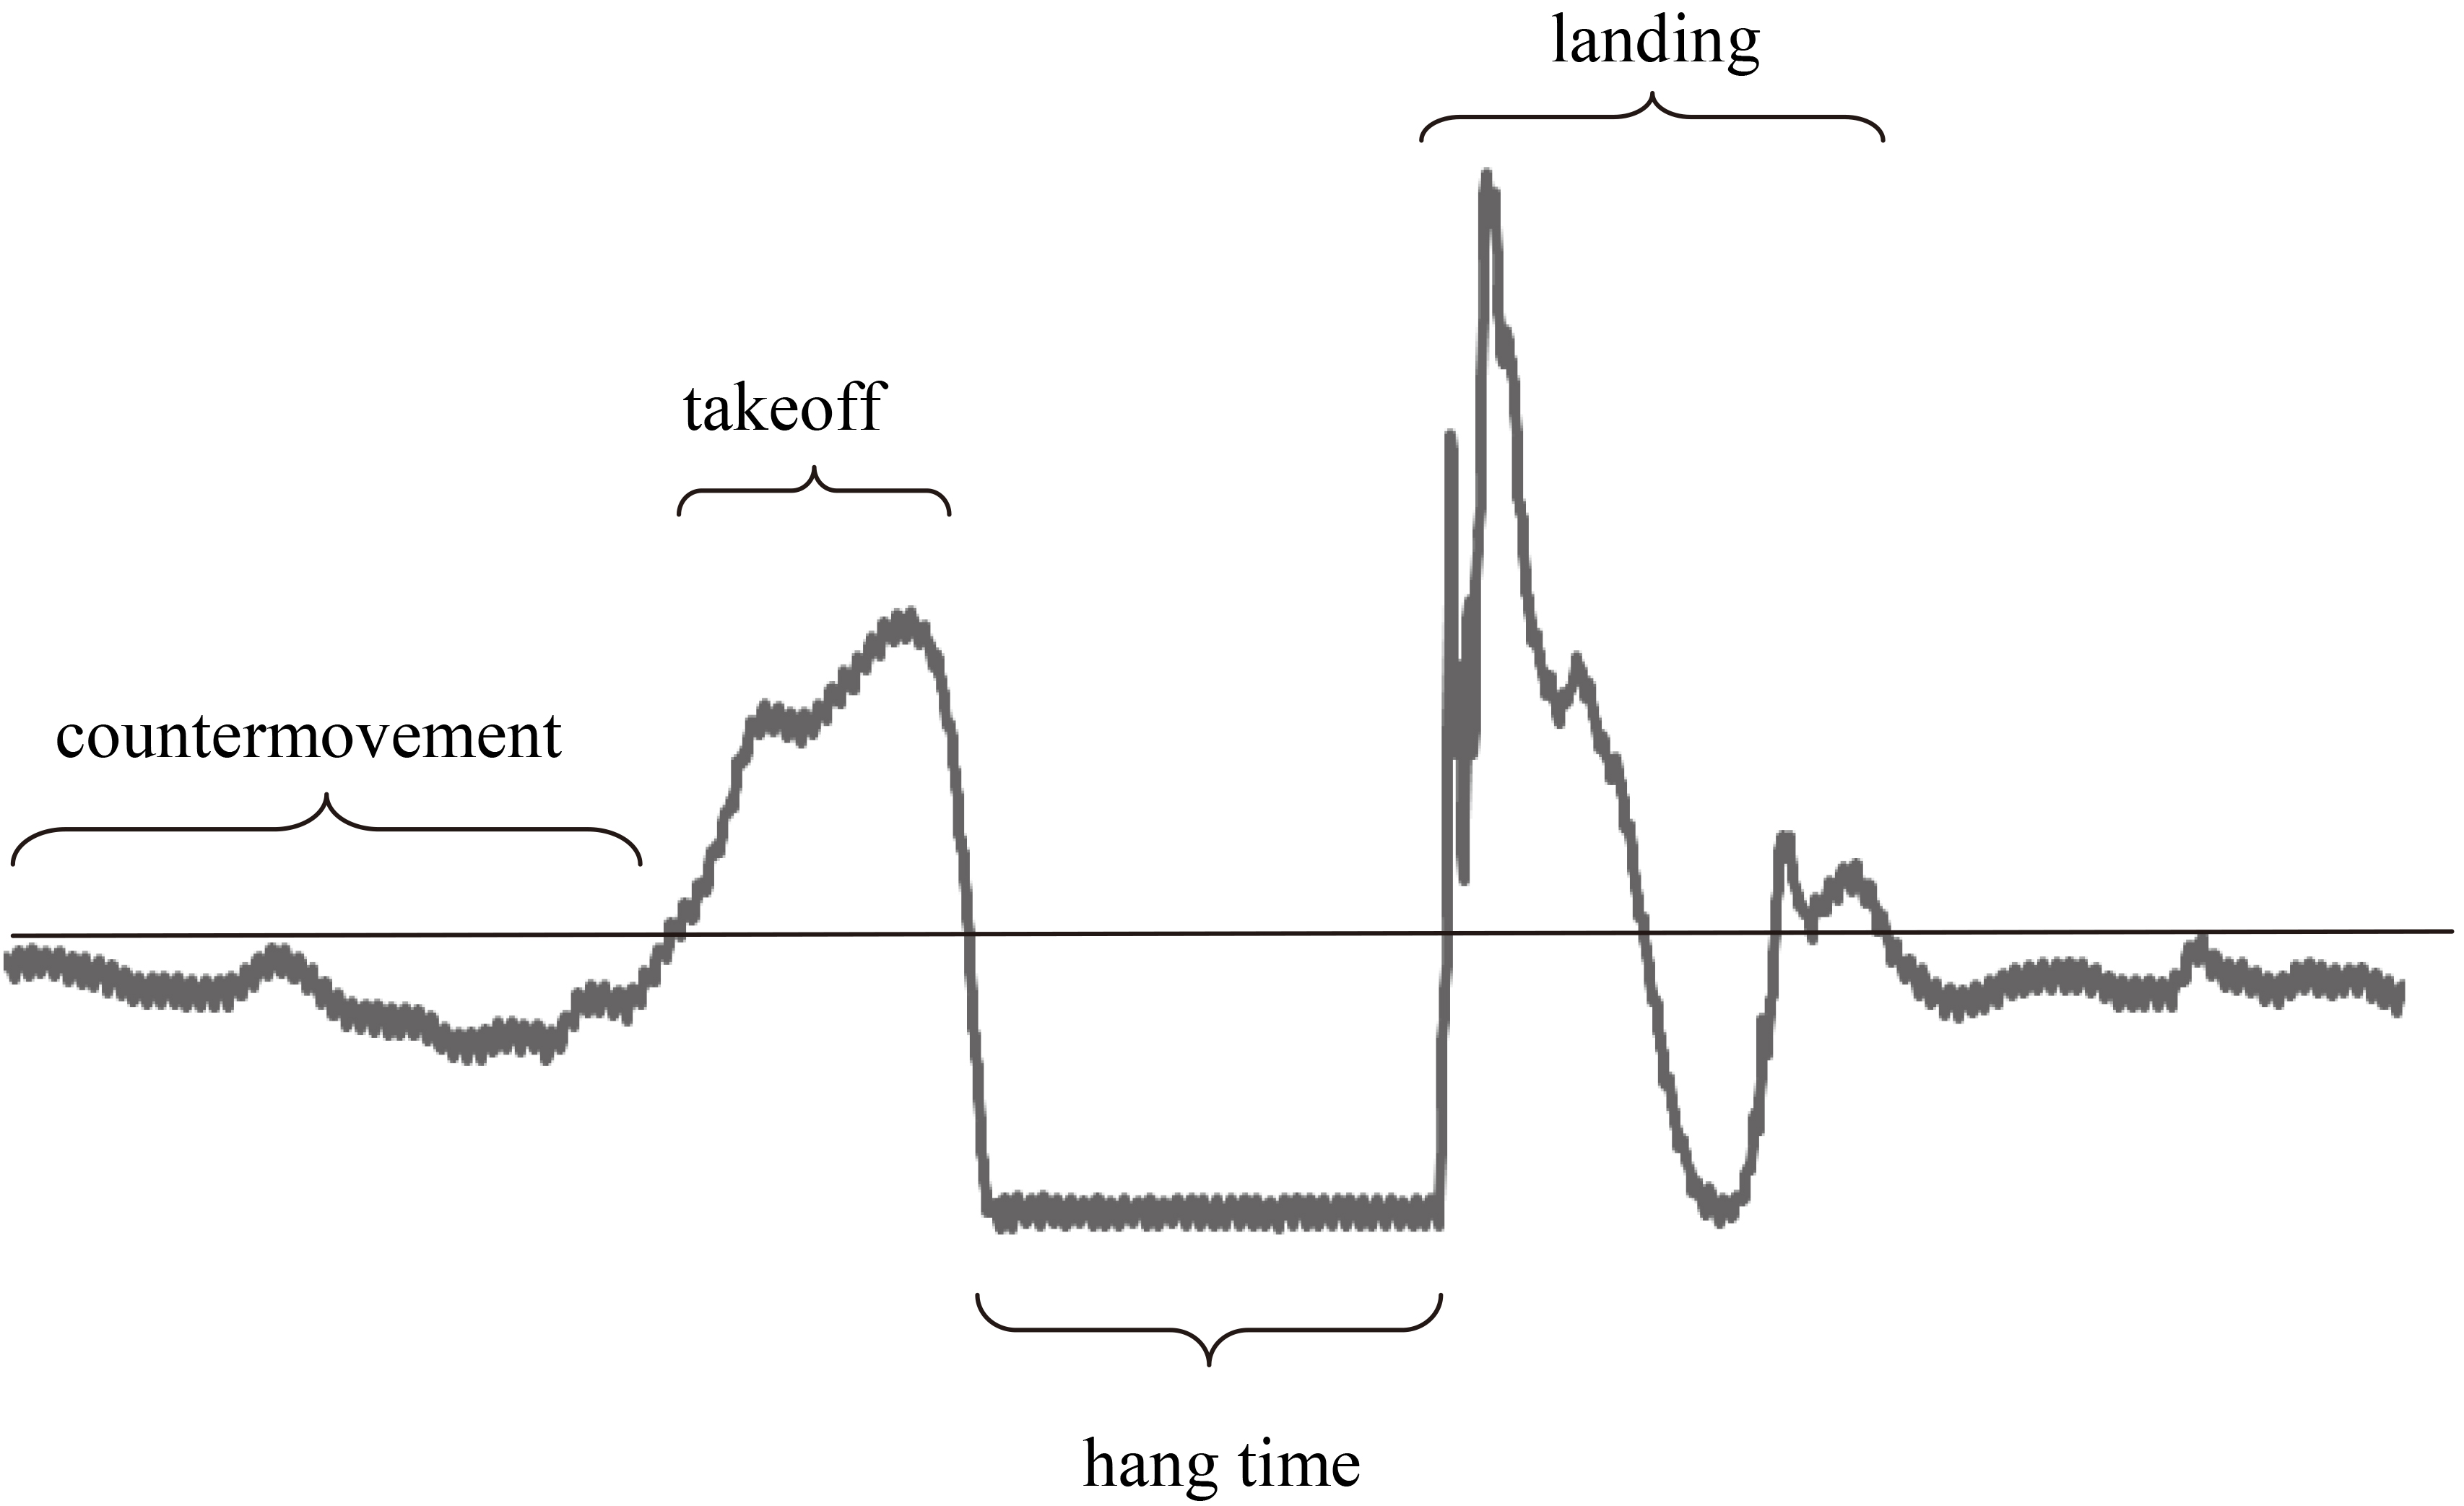
Subject’s first visits to our laboratory entailed collection of their anthropometric data, as well as familiarization and operation of our force plate. Their height and body mass were measured with a stadiometer and scale (Detecto Model 437; Webb City, MO, USA) as they stood upright. They next did a five minute warm-up on a stationary cycle ergometer (Ergotest; Stockholm, Sweden) at a rate of 75–90 watts. At the end of their first visits, they practiced countermovement vertical jumps on the force plate at a submaximal level of effort. The force plate was placed adjacent to a Vertec (Sports Imports; Columbus, OH, USA). As jumps occurred, data were collected from each device. Our criterion measures (peak height, power output) were derived from the Vertec; while the force plate provided variables that acted as correlates to our criterion measures’ variance. Jumps were done in the manner customary to subjects, with the caveat that countermovement knee flexion caused subjects thighs to descend below parallel to the force plate’s surface before ascenion. This was affirmed by visual inspection, as was done in a recent study [10]. As subjects ascended from the force plate they raised their dominant arm overhead and touched the highest Vertec slapstick they could reach. They were instructed to contact the force plate with both feet simultaneously as they landed. First visits allowed the capture of real time waveforms, as our software had only a three-second window to obtain data from each jump. Subjects usually did 3–5 vertical jumps; if technicians felt more practice was required additional jumps were performed.
Second and third visits used identical data collection procedures. They began with a warm-up identical to that of the first visit. Subjects then stood on the force plate and performed maximal-effort countermovement vertical jumps. Preceded by rapid ankle, knee, hip and vertebral flexion combined with concurrent glenohumeral hyperextension that characterizes the countermovement phase of jumps, subjects immediately applied contact forces to maximize vertical displacement and jump height values that characterizes the concentric portion of the movement. As they reached the jump’s apex, subjects made contact with the highest Vertec slapstick possible with their right hand. At the second and third visits they made 3–5 such jumps, each separated by 15–45 seconds of rest. Jumps not done in the described manner were excluded from analysis. For both the second and third visits, the highest jump per subject was used for statistical analysis.
Some of our study’s performance-based variables. AUC is calculated from the hatched portion of the waveform.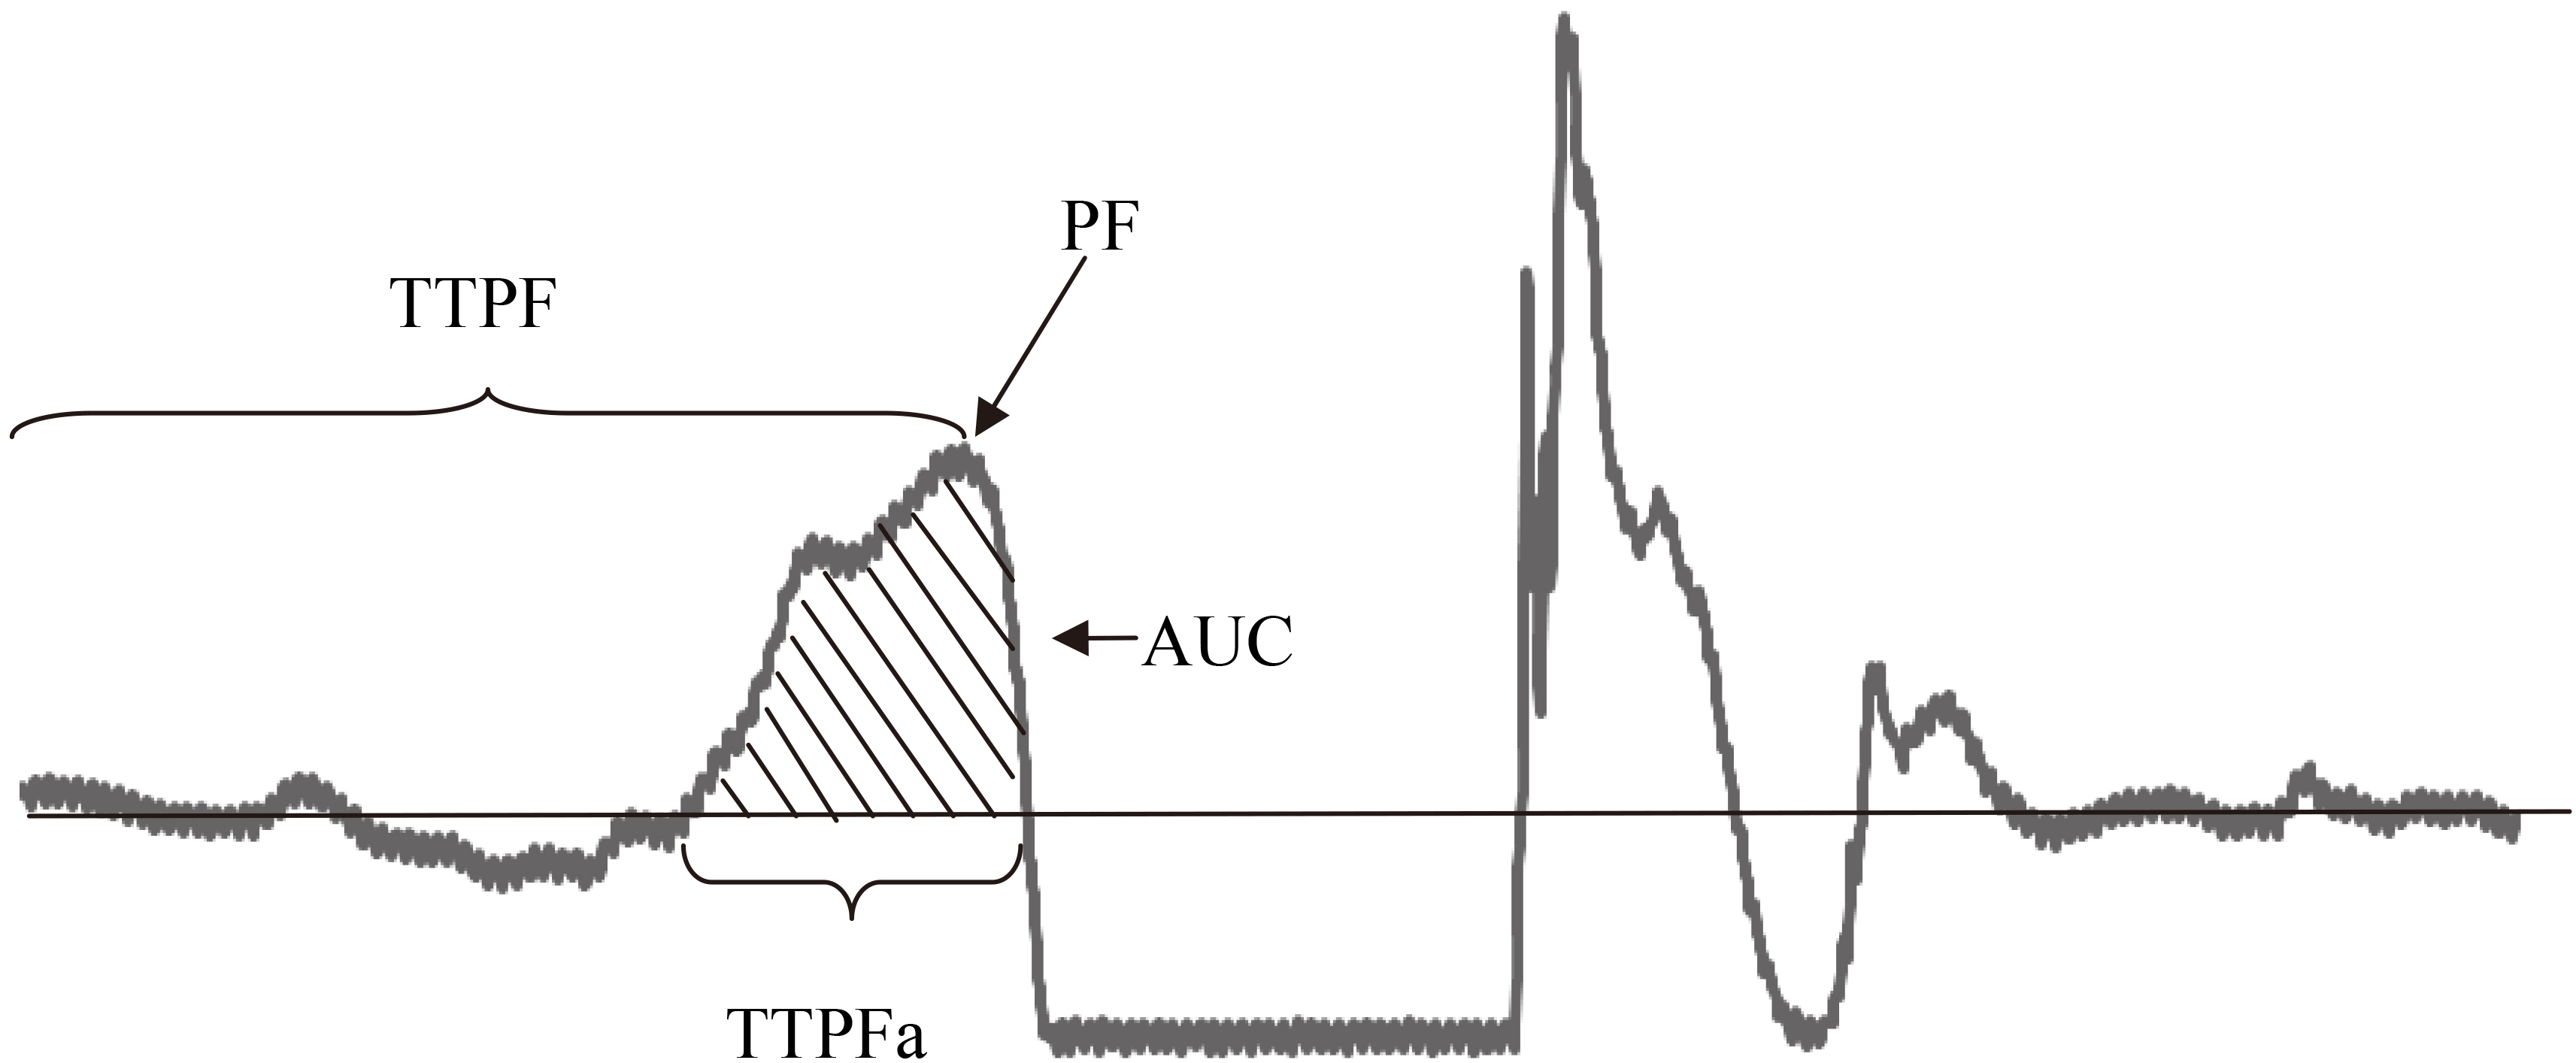
Per subject, jumps that produced peak vertical height values from visits two and three were compared for their reproducibility with coefficients of variation (CV). As seen in Fig. 2, the following performance-based predictor variables, each obtained from the data provided by the force plate, were identified from the vertical jump takeoff: peak force (PF), area under the curve (AUC), time to peak force (TTPF), and time to peak force measured from the ascent (TTPFa). While TTPF is a temporal variable that includes both the concentric and eccentric phases, the other Fig. 2 predictor variables were derived solely from the concentric phase. The calculated AUC value (hatched region; Fig. 2) is an estimate of the force-time integral from the recorded force during the takeoff phase. It represents the impulse created during takeoff. The relationship between impulse and velocity change is given by:
We used multivariate regression to identify the best correlates to peak height and power values. Our eight performance-based variables (PF, PF/BM, AUC, AUC/BM, TTPF, TTPF/BM, TTPFa, TTPFa/BM) were examined for their ability to predict the variance for our two criterion measures. Thus our predictor variables include kinetic-, temporal-, and force-time integrative-based indices of jump prowess expressed in absolute and relative terms. An alpha level of 0.05 denoted statistical significance for each multivariate analysis. With an effect size and power levels of 0.15 and 0.8 respectively, our sample exceeds the 108 subjects needed to perform multivariate regression analyses with eight predictor variables at a 0.05 alpha level [31].
Results
No subjects were injured through their project participation. Subjects verbally affirmed to the investigators that they achieved their maximum jump height at laboratory visits two and three. CV results (range 2–7%) for our eight predictor and two criterion variables were as follows: PF 6.6%, PF/BM 3.9%, AUC 6.1%, AUC/BM 5.4%, TTPF 6.8%, TTPF/BM 6.1%, TTPFa 5.1%, TTPFa/BM 3.1%, Jump height 2.0%, Jump power 2.7%. Each demonstrated high levels of reproducibility as well as less variability than that which is typical to biological systems [32]. Thus for each predictor and criterion variable, values from second and third visits were averaged per subject and then used for our multivariate regression analyses. For each predictor and criterion variable, Table 1 provides mean
Subject’s descriptive data for our eight predictor variables and two criterion measures
Subject’s descriptive data for our eight predictor variables and two criterion measures
PF
The multivariate regression results, with jump height as the criterion measure, appear in Table 2. The eight independent variables predicted a moderate (
Univariate correlations,
Univariate correlations,
Our hypothesis was affirmed. The current perform-ance-based variables generally explained more female vertical jump variance than prior studies that used predictive indices like anthropometry or testosterone [2, 6, 12, 14, 24, 30]. Performance-based variables were examined as correlates to vertical jump prowess in men [4]. Like the current study’s women, performance-based variables predicted significant yet moderate amounts of countermovement vertical jump height variance in men [4]. PF had the highest univariate correlation with vertical jump height [4]. However unlike male results, our female data shows a variety of predictor variables correlated with a large and significant amount of vertical jump power variance [4]. It is therefore important to explain how our predictor variables correlated to such high amounts of vertical jump power variance. Longitudinal training to enhance force output in men will also increase their vertical jump heights [9]. Such training also impacts the shape of power- and displacement-time curves produced by vertical jumps [9]. However, a larger sample comprised of nearly equal numbers of men and women saw the “greater force-higher jump height” relationship was less clear, which implies vertical jumps done by women are less the product of PF values and instead an interplay among an array of kinetic and temporal variables that maximize performance [11].
Like the current study, subjects (46 men, 51 women) performed countermovement vertical jumps on an instrumented force plate [11]. Per jump 18 kinetic- and temporal-based performance variables were collected [11]. Unlike the current study in which power serves as a criterion measure, they first identified it as a performance variable and subsequently a strong correlate to vertical jump performance [11]. Yet when power was excluded as an independent variable, their best three-predictor model only explained 66.2% of the vertical jump height variance [11]. The authors concluded while a high PF helped achieve maximum jump height, it certainly was not the only important variable. Since some subjects had low jump heights in spite of their high PF values, it was also concluded the pattern and timing of force application were more important than PF results [11]. In particular, the ability to exert high forces at joint angles as they near full extension and rotate at high velocities were considered advantageous [11].
Unfortunately the aforementioned study did not examine disparities, or identify different correlates to jump performance, by gender [11]. But based on their results [11], as compared to studies with only men [4, 9] or the current investigation with only female subjects, women appear to rely on temporal variables to a greater extent to maximize their vertical jump performance. From their large mixed-gender sample, Dowling and Vamos noted two temporal variables (duration of maximum force to takeoff:
In regards to some temporal variables serving as better correlates, our results show TTPF was among the better predictors of jump height variance, while TTPF/BM had a strong (
Our results revealed AUC/BM and PF/BM were among the stronger correlates to vertical jump height, while TTPF/BM had a strong inverse relationship to vertical jump power values. In contrast, data collected from men showed predictor variables expressed relative to BM were weak correlates to jump performance [4]. As it pertains to some of our performance variables expressed relative to BM serving as strong predictors of the variance seen in our criterion measures, precedent does exist for this occurrence [11]. In addition, jump studies that assessed the impact of various interventions showed variables normalized to BM often produce significant changes sooner, or to a greater extent, than those expressed as absolute measures because data variability is reduced [9, 28]. With jump data obtained from men and women with a force plate, a significant correlation was noted between maximum height and power outputs relative to subjects’ BM [11]. A chronic training intervention done by men for its impact on vertical jump height noted variables that had the greatest improvements over time were force and power values normalized to BM [9]. A study of countermovement depth and volitional effort on jump height in ten men saw large inter-treatment power and torque disparities when expressed relative to BM, yet these differences were not significant likely due to the sample size examined [28].
Finally it is of interest to note why the current study performance variables predicted far more vertical jump power, as compared to jump height, variance. Differences in amount of variance explained by the current study criterion measures is unusual given the high correlations (
Given our methods and sample size, we believe our study provides a general representation of factors that contribute to vertical jump performance in women. However particularly in regards to their physical characteristics and training histories, limitations to our study include a rather heterogeneous sample of female subjects. Since women participate in a broad variety of sports in modern-day athletics, future research in this area may wish to use a similar study design with a more homogenous group of female athletes, such as those that participate or specialize in a singular sport or activity. With such an approach, future study results may identify factors that best predict vertical jump performance and perhaps, in turn, offer insights on the athletic performance of their subjects.
Footnotes
Acknowledgments
We wish to thank our subjects for their participation.
Conflict of interest
The authors of this paper have no conflicts of interest to report.