Estimation of vastus intermedius electromyography: Comparison of three methods and their impact on the knee isometric extension moment predicted by an EMG-Driven model
Free accessResearch articleFirst published online November, 2018
Estimation of vastus intermedius electromyography: Comparison of three methods and their impact on the knee isometric extension moment predicted by an EMG-Driven model
Estimations of deep muscles electromyography (EMG) with surface electrodes can be usually performed only indirectly.
OBJECTIVE:
To investigate the impact of using different approaches for estimating vastus intermedius EMG on the moment sharing patterns among quadriceps femoris components (QF), obtained with an EMG-Driven model, as well as on the joint total moment estimation accuracy, by comparing the calculated knee moment with isometric dynamometer measurements.
METHODS:
Extensor knee moment and surface isometric EMGs from the four QF components were collected synchronously with knee moment from an isokinetic dynamometer, with the knee flexed at 80 and moment level at 40% of the maximum. Neuromuscular excitations for each QF were derived from the EMGs. Three different estimates of vastus intermedius excitation were tested: (1) surface electrodes on the exposed portion of vastus intermedius; (2) average between vastus lateralis and vastus medialis; and (3) a regression equation to estimate VI EMG from the other QF components.
RESULTS:
No statistical differences were found among the relative moments, excitation signals, and estimation accuracy by using the three methods.
CONCLUSIONS:
The average between vastus lateralis and vastus medialis is the recommended choice for being the simplest one.
EMG-driven models have been applied to estimate quadriceps muscle forces for studying the moment sharing patterns among its components, during isometric knee extension [1, 2]. Surface electromyography signal (EMG) is recorded, rectified, low-pass filtered and normalized, to be used as the neuromuscular excitation input to an EMG-Driven model. Nevertheless, there are limitations to measure deep muscles EMGs, such as the vastus intermedius (VI) in the quadriceps femoris (QF) group. VI corresponds to approximately 30% of QF volume [3] and can reach up to 50% of the isometric knee extension moment [4]. The average between vastus lateralis (VL) and vastus medialis (VM) EMG-based neuromuscular excitations have been used as VI input ( to EMG-driven models [1, 5, 6, 7].
Watanabe and Akima [8] measured EMGs from the four quadriceps components and isometric moments from 10 to 100% maximum contraction, in 10% steps. Maximum voluntary contraction (MVC) normalized VI EMG activity was lower than VL at a low moment level and larger than rectus femoris (RF) at high. This suggests that VI neural drive may be different from the other QF components and, possibly, the simple average between VL and VM may not result in the best VI estimation. In this case, finding a pattern between VI and other QF components EMGs, such as presented by Watanabe and Akima [8], could deliver better VI EMG estimations than the simple average between VM and VL. Such pattern could be modeled as a regression equation derived from experimental EMG data, where the dependent variable is the VI EMG and the predictors the EMGs from the other QF components.
VI EMG can be measured by intramuscular electrodes [4, 9], which have many practical limitations. Watanabe and Akima [10] validated a surface EMG protocol for VI guided by ultrasonography. The recommended electrodes placement was over a distal portion of the lateral thigh, where VI becomes superficial, and showed negligible crosstalk with VL [11]. However, this approach requires ultrasound imaging, what may be a restriction when such equipment is not available.
In this paper, we estimated VI EMG using three different approaches: a) average between VM and VL; b) based on a regression equation that relates VI EMG from the other QF components derived with data from [8], and c) directly measuring VI EMG with the protocol from [10]. To compare the first two methods with the third, considered as the gold standard, we analyzed the moment sharing patterns among the QF components, and the RMS error between EMG-estimated vs. dynamometer-measured moments. If the average and regression equation approaches yield the same moment sharing patterns and moment reconstruction accuracy, there would be no necessity to use for the present EMG-driven study Watanabe and Akima’s method, which is more complicated and time-consuming than the others.
Method
Subjects
The right legs of twenty young healthy males (age 17.25 0.85 years; weight 71.13 8.69 kg; height 1.79 0.08 m) were evaluated after providing written informed consent. The protocol was approved by the University Hospital Research Ethics Committee.
Experimental procedure
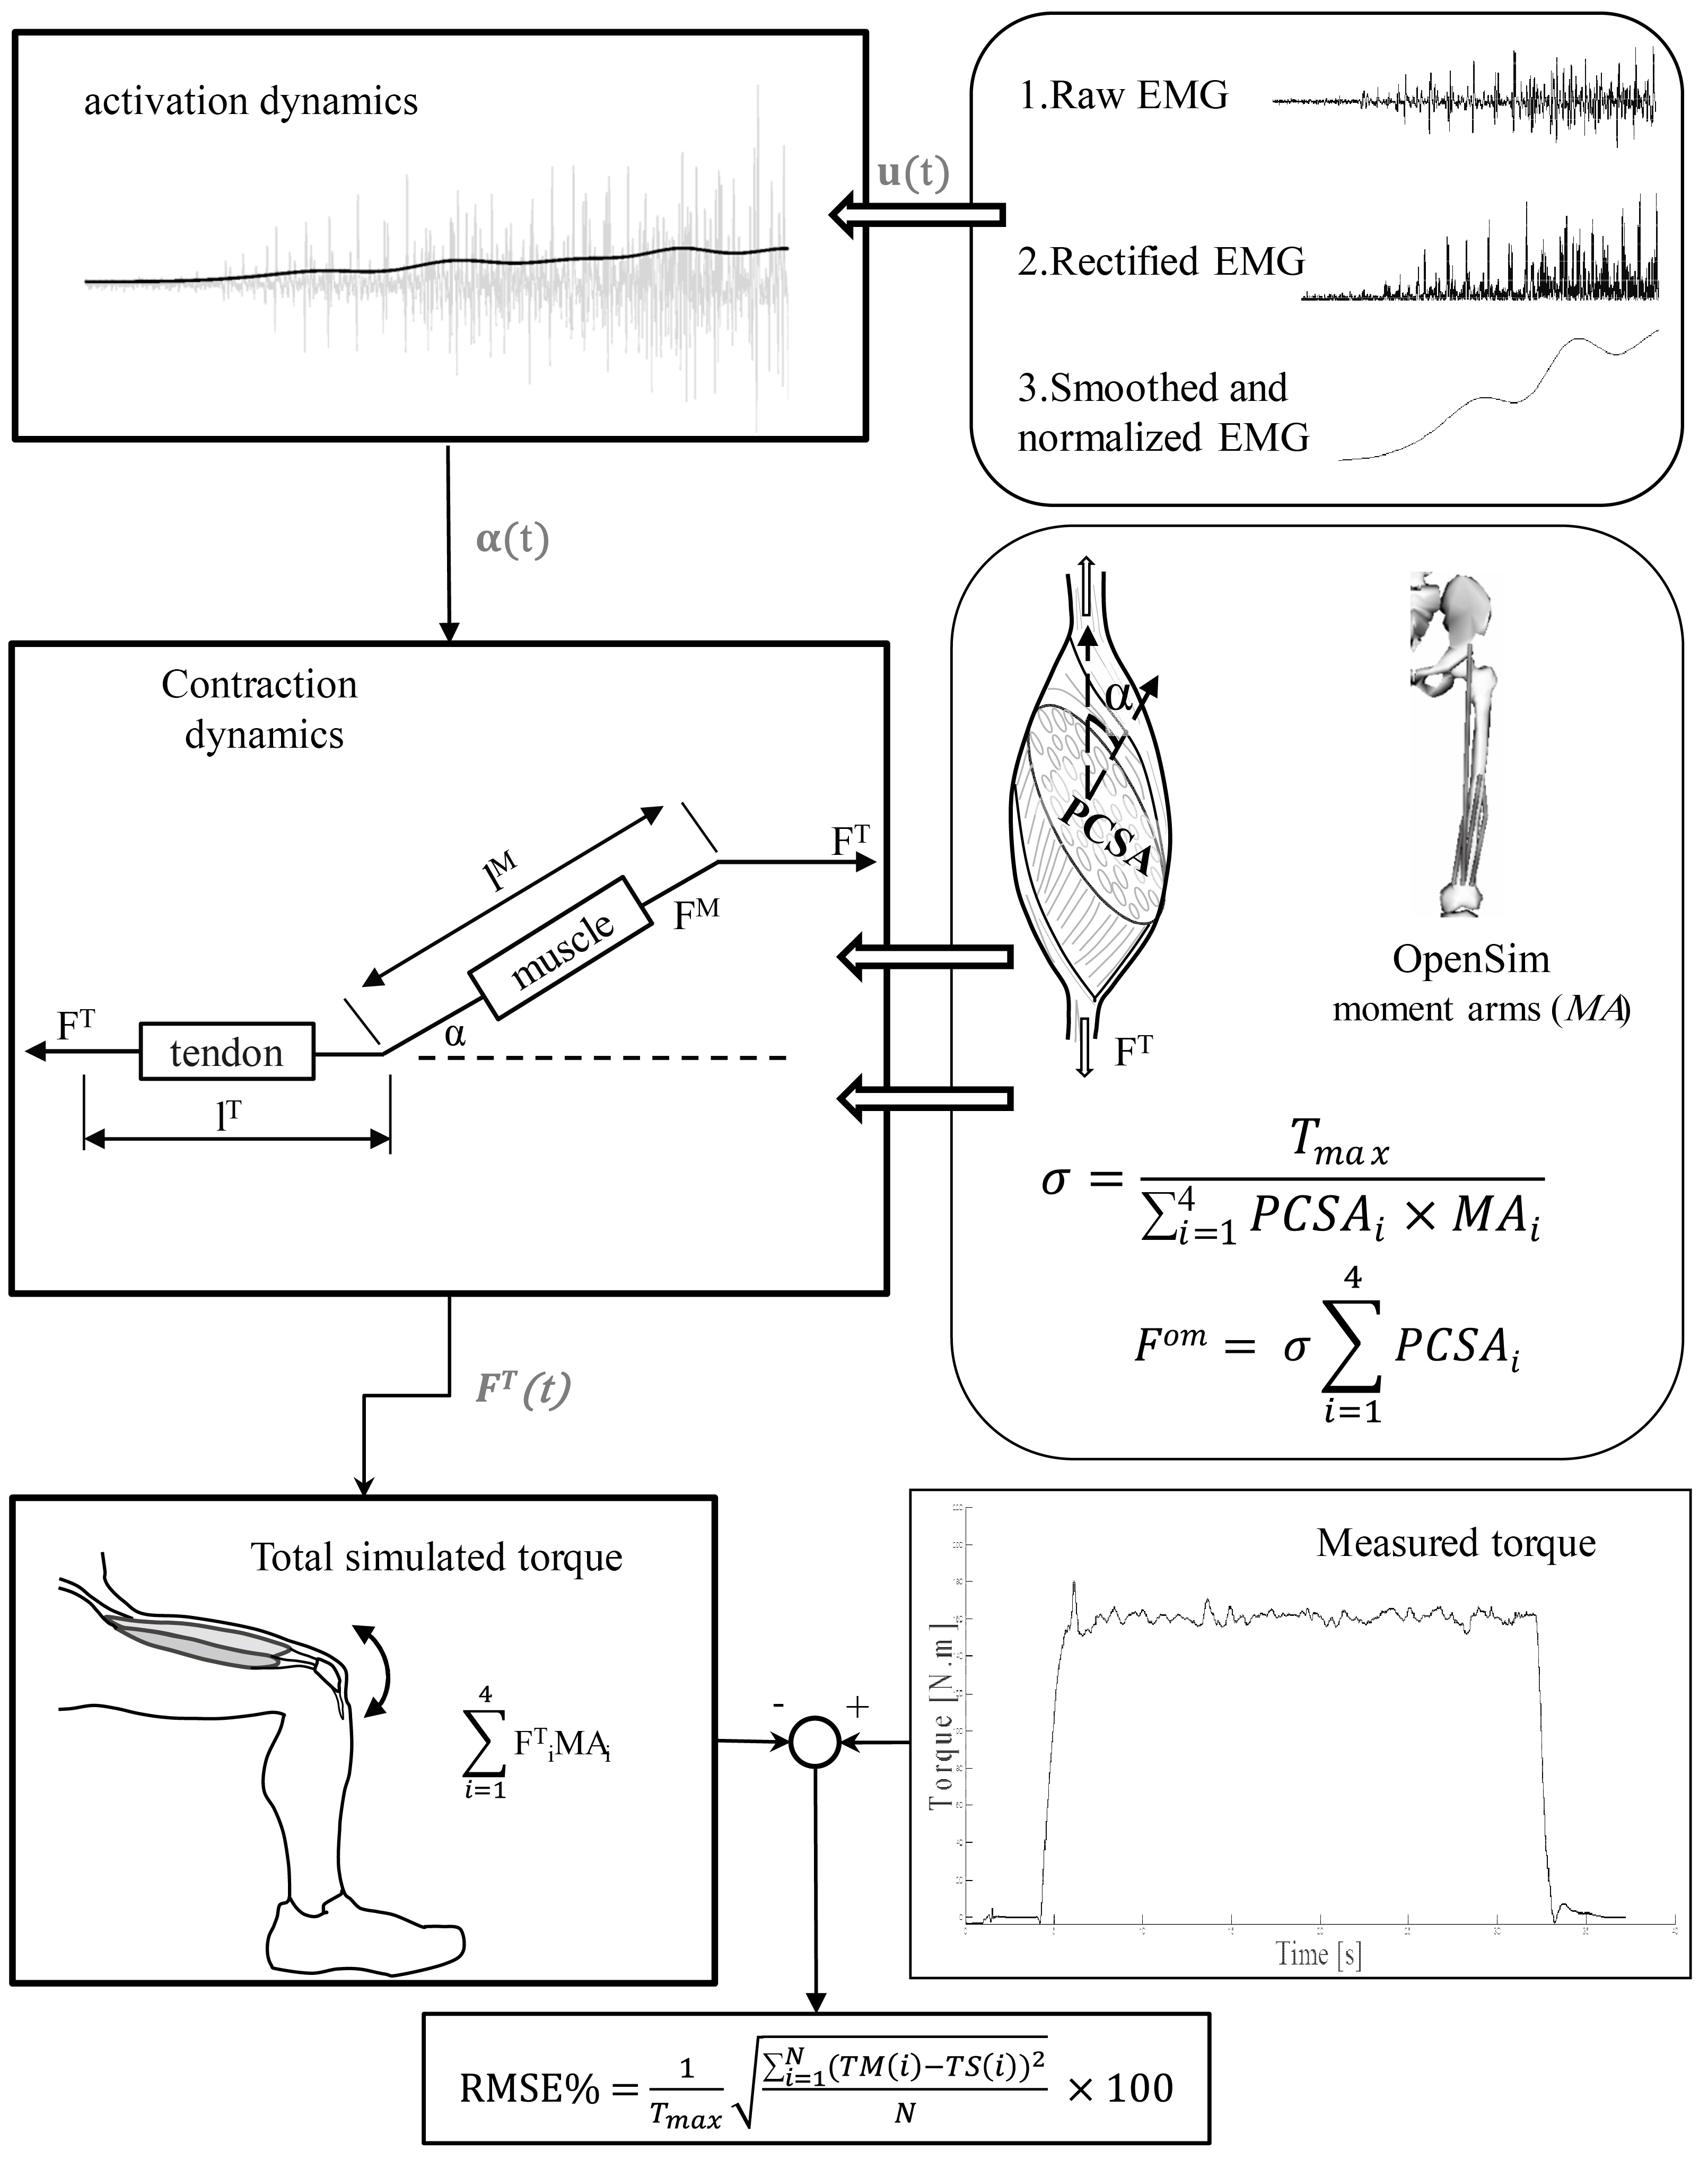
The QF EMG-Driven model was simulated with the MATLAB application EMG-Driven Force Estimator (EMGD-FE) [12]. A Hill-type muscle model was used [13], comprising activation and contraction dynamics. Muscle model input was the rectified, low-pass filtered and maximum voluntary contraction (MVC) normalized EMG. Each calculated muscle force was multiplied by the respective moment arm, and the individual muscle moments summed to find the knee extensor moment, which was compared with dynamometer measurements for model accuracy assessment.
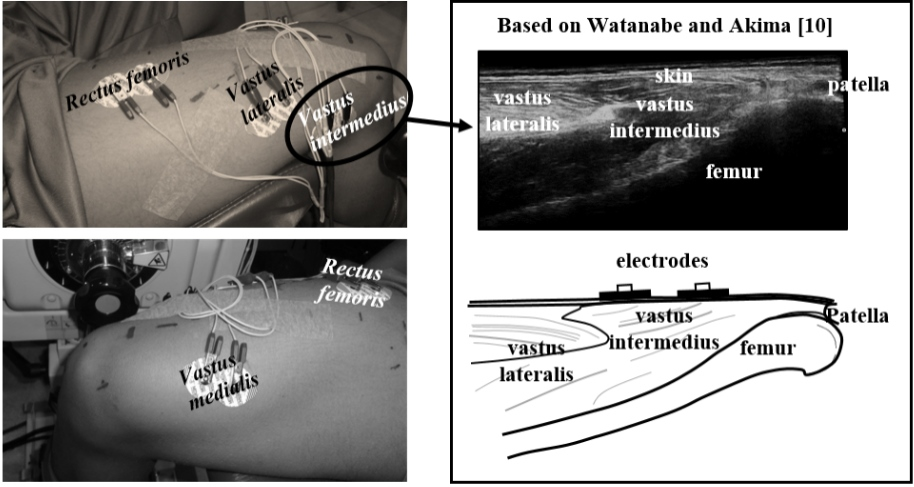
Ag-AgCl pre-gelled disposable electrodes 43 45 mm (Meditrace, São Paulo, Brazil) were positioned on RF, VL, and VM, following SENIAM recommendations (http://www.seniam.org/). For measuring VI surface EMG directly, according to the protocol suggested by [10], the subjects sat with the knee joint at 90. The muscle bellies of VL and VI were identified in the lateral distal thigh site by ultrasonography. The examiner displaced the probe distally, until observing a superficial view of the VI. This site was marked on the skin, and the pair of electrodes was positioned aligned with the fibers direction (Fig. 1).
QF electrodes positioning. VI is placed according to Watanabe and Akima protocol [10], while the other components follow SENIAM recommendations. At the right, the ultrasound image for localizing VI superficial site.
Knee extension MVC was tested for each subject in a dynamometer (Biodex System 4, New York, NY, USA), with the knee flexed at 80. Two repetitions of five seconds were performed, with a one-minute interval. The subjects then sustained a contraction of 40% of his individual MVC moment during 40 seconds, following a visual feedback target on a screen. The 40% MVC intensity was chosen for the submaximal contractions minimizes fluctuations among quadriceps synergists and antagonist co-contractions [19, 20]. The hamstring co-contraction was not evaluated, but it is likely to be minimized at 40% MVC contraction level [20, 21].
The centered 30 s of the total signal was considered for the analysis. EMG signals were synchronously acquired with the moment signal (EMG-USB2, OTBioelettronica, Italy) at 2048 Hz, band-pass filtered (10–500 Hz), 12 A/D converted, and amplified by a 2000 factor. The EMGs were rectified and low-pass filtered (6th order digital Butterworth, 2 Hz) to obtain the envelopes. Finally, the submaximal EMG signals were normalized by the MVC EMG (2–3 sec. epoch of the steady maximal moment signal), to obtain .
For each subject, the EMG-Driven model was run three times, using different estimates, from:
EMG signal from surface electrodes on VI, using the protocol from [10] – Trial 1;
The average between and – Trial 2;
Multiple regression Eq. (1), using , and – Trial 3.
Regression equation derivation
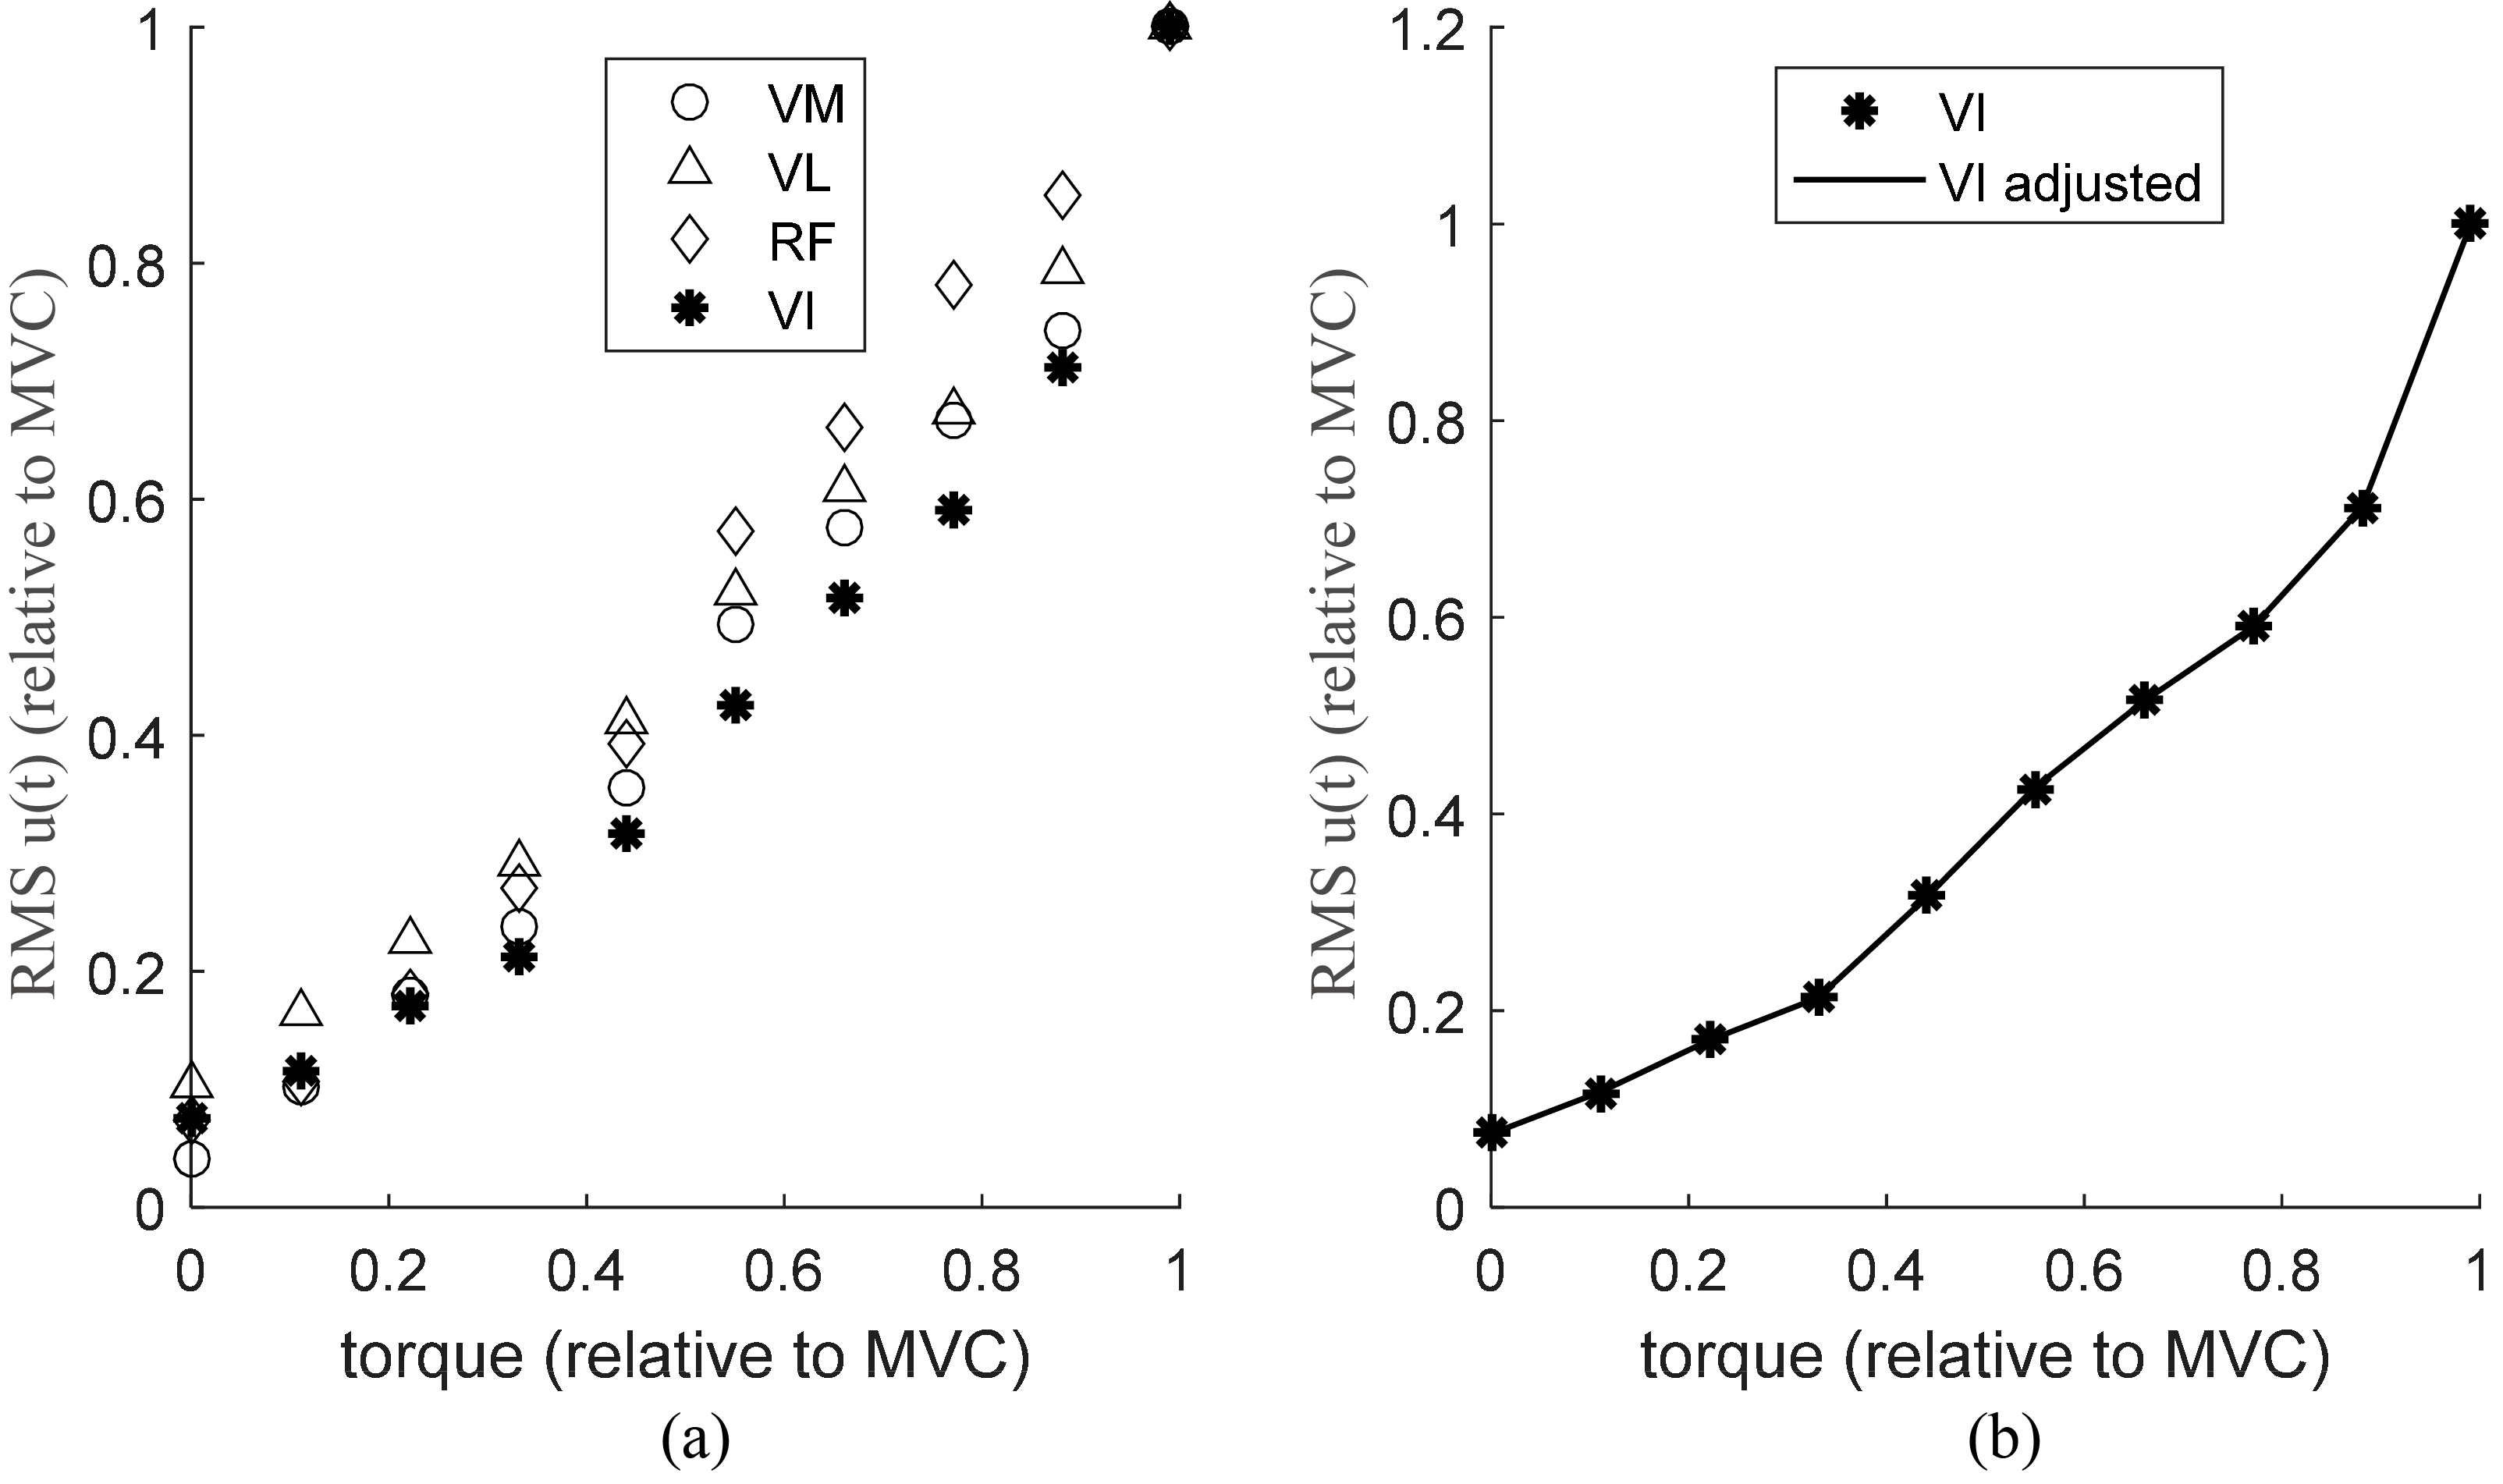
Watanabe and Akima [8] measured the surface QF EMGs as a function of the isometric knee extension moment for the knee at 90 [10]. Figure 2a presents the digitalized original data from [8]. At every 10% of MCV step, from 10 to 100% of MVC, average RMS EMG values of VI, VM, VL, and RF has been reported by the authors (Fig. 2 of ref. [8]), totalizing 10 dependent and 30 independent observations. The free software GetData Graph Digitizer (http://getdata-graph-digitizer.com/index.php) was used to extract the data from the original published material. We adjusted a quadratic equation with a mixed cubic term of as a function of , and (Eq. (1)), for each 10% MVC moment step (Fig. 2b).
(a) Root mean squared excitations of the four quadriceps femoris components, as a function of the contraction level (data extracted from Watanabe and Akima [8]). EMG and moment data are normalized by MVC. (b) Regression curve of adjusted from the data of the three other quadriceps femoris muscles shown in panel (a).
The average standard deviation values for the fitting residue was 0.0011 8.9353E-04, with a normal distribution, coefficient of determination 1.0000 and the Root Mean Square Error RMSE 0.0014, indicating that the proposed regression equation provides an excellent fitting for the average EMG data reported by [8]. Since the original data reported by [8] have been normalized by the MVC, Eq. (1) can be used with input data collected by others, if also normalized.
Parameters estimation
Default muscle parameters were obtained from OpenSim model “Both legs with muscles” [14]. The maximum muscle force (F) was individually estimated by multiplying the physiological cross-sectional area (PCSA) by the individual maximum muscle tension (). The individual PCSAs of the four QF components were calculated based on [1]. An ultrasound B-mode axial-plane device (MyLab25 Gold, ESAOTE, Italy), with a 40-mm, 10–18 MHz linear probe, was used for measuring muscle thickness, pennation angle, and fascicle length. For finding at each test, the maximum expected moment is found from Eq. (2):
where refers to each QF component, is the maximum isometric force, MA the moment arm and the MVC moment measured by the dynamometer. Considering the maximum tension uniform for the four muscles [15]:
The total quadriceps moment was estimated by the sum of the products of the four simulated muscles forces by their respective moment arms, obtained from OpenSim plot tool at 80 of knee flexion (in meters, RF: 0.027; VI and VL: 0.028; VM: 0.029). The moment estimation error was cross-validated by the Root Mean Square Error (%RMSE) between the simulated and dynamometer measured moments [18]. The entire process is summarized in Fig. 3.
Quadriceps volume was estimated from muscle thickness scanned by ultrasound at 50% thigh length, using regression equations proposed by Miyatani et al. [16]. These equations yielded muscle volume estimations with a high positive correlation with magnetic resonance measurements ( 0.810 to 0.839). The total volume was divided into individual muscle volumes, considering the proportions of 34% for VL, 28% for VI, 24% for VM and 14% for RF [17].
EMG-Driven muscle force estimation approach and accuracy assessment from moment time curve. muscle activation; muscle force; tendon force; muscle fiber length; MA moment arm; tendon length; maximum moment; muscle tension.
Statistical analysis
The normality of the distribution among the subjects of the average moment, %RMSE, and average excitation signals, during each effort, was confirmed by Shapiro-Wilk test ( 0.079). For each muscle, One-way repeated measures ANOVA with post hoc Bonferroni test was applied to verify differences among its moment contribution (dependent variables) to the total knee moment. There was a sphericity violation in all cases; thereby the degrees of freedom were corrected ( 0.537).
One-way ANOVA was applied to verify the differences among the three trials moment errors (%RMSE between dynamometer-measured and EMG-driven estimated moments, independent variables), to check whether different VI EMG estimation methods results in a more accurate model to predict joint moments. The results are presented with 95% confidence interval (CI) and effect size (partial ), classified as 0.20 small effect, 0.20–0.80 moderate effect and 0.80 large effect [22]. SPSS software (SPSS IBM, New York, NY, USA) was used with the significance level ( value) of 0.05.
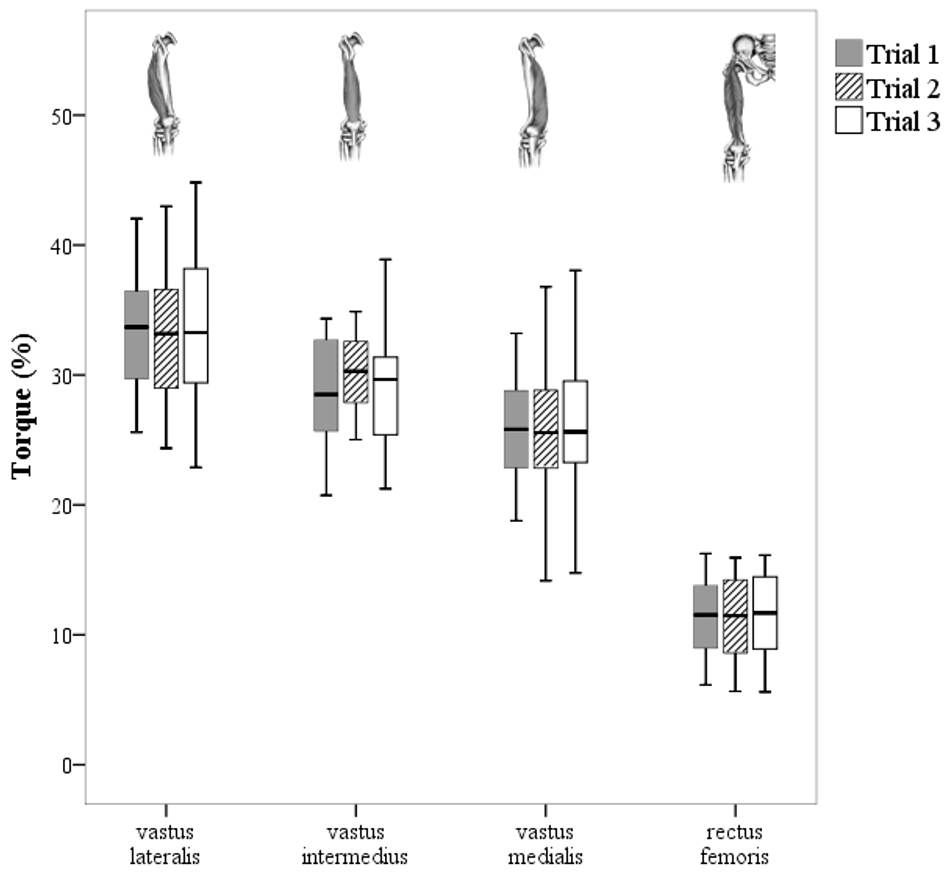
Statistical analysis. Comparisons among three approaches for the relative estimated moment contribution for each muscle
Repeated measures ANOVA
% of moment contribution
-Value
partial
(95% confidence interval)
Vastus lateralis
0.88
0.36
0.93
30.91–35.42
Vastus intermedius
1.03
0.32
0.99
27.87–30.63
Vastus medialis
1.97
0.17
0.96
23.60–28.53
Rectus femoris
0.74
0.40
0.92
10.08–12.89
Mean relative individual knee extension moment contributions to total moment at 40%MVC contraction intensity, for the three VI EMG estimation approaches (trials).
Results
Figure 4 shows the estimated moments for the four muscles, as a percentile of the total knee moment, comparing the three approaches. The moment contributions followed the sequence: RF VM VI VL. There were no statistical differences in the moment contributions using three types of estimation method (Table 1).
The mean of excitations signals were similar (F 1.50; 0.19). The 95% CI ranged from 0.371 to 0.400 and sample effect size was of 0.96. The %RMSE between the estimated and measured moments were: Trial 1 11.58 5.24%, for Trial 2 13.22 5.88%, and for Trial 3 14.71 5.58% with no significant differences (F 1.57; 0.21). Effect size was 0.85 and 95% CI of 11.73 to 14.61%.
Discussion
We tested three alternatives for estimating VI excitation signals () from EMG in a quadriceps femoris isometric EMG-Driven model. The estimated moment contributions from each QF components did not differ among the three methods. Based on the effect sizes, the sample size ( 20) was sufficient to identify the effectiveness of the comparisons (large effect), as the partial was greater than 0.80.
Each of the vastii contributed more than rectus femoris for the total knee extensor moment similarly to previous studies [1, 5, 6]. Barret et al. [5] estimated the quadriceps forces during gait using EMG data. Their findings showed that VL contributed about 35% of the total quadriceps force, followed by VI, VM, and RF ( 26%, 25%, and 14%, respectively). Besier et al. [6] reported small changes in the VL and VM contributions during transitions between gait and running, with contributions of 45% for VL, 29% for VI, 26% for VM and 5% for RF. VI EMG was the average between VL and VM. Oliveira et al. [23] analyzed the quadriceps muscles forces under isometric contraction and showed similar moment contributions (RF VM VI VL) for 20% and 60%MVC. Zhang et al. [4] found the following moment sharing pattern by an EMG-force relationship with intramuscular VI signals: 39.6–51.8% for VI; 20.7–25.12% for RF; 18.0–24.2% for VL; 9.5–12.2% for VM. These results are in contrast to ours, which identify the VL as the greatest moment contributor. Intramuscular electrodes acquire signals with higher amplitudes and smaller volume detection, which can explain this difference.
Moment sharing patterns among muscle components are a combination of two elements: the input signal to each muscle and the biomechanical muscle characteristics. Regarding the input, Watanabe and Akima [8], with surface EMG, showed a pattern of EMG-force relationship at 40% MVC as follows: VI VM RF VL, with a significant difference between VI and VL. In this case, RF showed greater activation than VI and VM, differently from our results, where the excitations of the four QF muscles were statistically equivalent. Even though there is a strong correlation among the vastii activations [21], we found no explanation why all methods, including the VL and VM average, yielded similar VI estimations. A possible reason can be the anatomic innervation, whereas VI receives two branches from both VL and VM muscles [24]. Likewise, it was reported that VI EMG is similar to RF [25], probably regarding the central location of VI, beneath RF. Based on this assumption, Nam et al. [2] used the RF EMG to estimate VI activity with an EMG-Driven model for determining the knee joint moment. One of their algorithms showed good results after an optimizing procedure. As an assessment of the estimation accuracy, our %RMSE values were similar to other EMG-Driven studies (10 to 25% in [1]). We expected that the VI activity acquired superficially, on a more physiological basis (Trial 1, Watanabe and Akira protocol), would likely to result in smaller errors. Nevertheless, it was not confirmed.
Moment sharing patterns are also a function of muscle biomechanics. Considering the excitation as the input of a Hill-type muscle model with individual parameters, different knee moment contributions among the quadriceps components will be obtained even with equal excitations among them. This occurs because maximum muscle force, force-velocity and force-length characteristics are specific for each muscle. Additionally, EMG-driven models input preprocessing and muscle mechanics itself work as a non-linear filter to the EMG signal to force relationship. Maybe, subtle excitations differences among the QF components could become attenuated for such effect, providing, in the end, the same results for all VI EMG estimation methods.
This work has some limitations. The regression Eq. (1), to find VI excitation from the other QF components, is supposed to valid for the whole span of contraction levels, given the small curve fitting residuals that can be observed in Fig. 1b. Nevertheless, Eq. (1) was tested only for 40% of MVC, and it was not able to provide better force estimations than the simple average. The knee angle was fixed at 80, which was the only position for the data reported by [8]. Other joint angles would require some alternative experimental approach since this is the angle where part of the VI becomes superficial.
In conclusion, direct surface VI EMG showed no advantages over both average or regression equation, for VI excitation and force estimations, using an isometric EMG-driven model. Three different methods to find resulted in the same quadriceps femoris moment sharing prediction and moment reproduction accuracy.
Footnotes
Acknowledgments
The authors wish to acknowledge the financial support of the Brazilian Research agencies CAPES, FINEP, FAPERJ, and CNPq.
Conflict of interest
None declared.
References
1.
MenegaldoLLOliveiraLF. An EMG-driven model to evaluate quadriceps strengthening after an isokinetic training. Procedia IUTAM2011; 2: 131-141.
2.
NamYKimSBaekSR. Calculation of knee joint moment in isometric and isokinetic knee motion. International Journal of Precision Engineering and Manufacturing2011; 12(5): 921-924.
3.
AkimaHUshiyamaJKuboJFukuokaHKanehisaHFukunagaT. Effect of unloading on muscle volume with and without resistance training. Acta Astronaut2007; 60: 728-736.
4.
ZhangLQWangGNuberGWPressJMKohJL. In vivo load sharing among the quadriceps components. Journal of Orthopaedic Research2003; 21(3): 565-571.
5.
BarrettRSBesierTFLloydDG. Individual muscle contributions to the swing phase of gait: An EMG-based forward dynamics modelling approach. Simulation Modelling Practice and Theory2007; 15(9): 1146-1155.
6.
BesierTFFredericsonMGoldGEBeaupréGSDelpSL. Knee muscle forces during walking and running in patellofemoral pain patients and pain-free controls. Journal of Biomechanics2009; 42(7): 898-905.
7.
GardinerESManalKBuchananTSSnyder-MacklerL. Minimum detectable change for knee joint contact force estimates using an EMG-driven model. Gait and Posture2013; 38(4): 1051-1053.
8.
WatanabeKAkimaH. Normalized EMG to normalized moment relationship of vastus intermedius muscle during isometric knee extension. European Journal of Applied Physiology2009; 106(5): 665-673.
9.
BasmajianJVHardenTPRegenosEM. Integrated actions of the four heads of quadriceps femoris: An electromyographic study. The Anatomical Record1972; 172(1): 15-19.
10.
WatanabeKAkimaH. Validity of surface electromyography for vastus intermedius muscle assessed by needle electromyography. Journal of Neuroscience Methods2011; 198(2): 332-335.
11.
WatanabeKAkimaH. Cross-talk from adjacent muscle has a negligible effect on surface electromyographic activity of vastus intermedius muscle during isometric contraction. Journal of Electromyography and Kinesiology2009; 19(4): 280-289.
12.
MenegaldoLLOliveiraLFMinatoKK. EMGD-FE: An open source graphical user interface for estimating isometric muscle forces in the lower limb using an EMG-driven model. Biomedical Engineering Online2014; 13(1): 37.
13.
ZajacFE. Muscle and tendon: Properties, models, scaling, and application to biomechanics and motor control. Critical Reviews in Biomedical Engineering1988; 17(4): 359-411.
14.
DelpSLAndersonFCArnoldASLoanPHabibAJohnCTGuendelmanEThelenDG. OpenSim: Open-source software to create and analyze dynamic simulations of movement. IEEE Transactions on Biomedical Engineering2007; 54(11): 1940-1950.
15.
ErskineRMJonesDAMaganarisCNDegensH. In vivo specific tension of the human quadriceps femoris muscle. European Journal of Applied Physiology2009; 106(6): 827-838.
16.
MiyataniMKanehisaHKunoSNishijimaTFukunagaT. Validity of ultrasonograph muscle thickness measurements for estimating muscle volume of knee extensors in humans. European Journal of Applied Physiology2002; 86(3): 203-208.
17.
O’BrienTDReevesNDBaltzopoulosVJonesDAMaganarisCN. Muscle-tendon structure and dimensions in adults and children. Journal of Anatomy2010; 216(5): 631-642.
18.
MenegaldoLLOliveiraLF. Effect of muscle model parameter scaling for isometric plantar flexion moment prediction. Journal of Biomechanics2009; 42(15): 2597-2601.
19.
AkimaHSaitoAWatanabeKKouzakiM. Alternate muscle activity patterns among synergists of the quadriceps femoris including the vastus intermedius during low-level sustained contraction in men. Muscle and Nerve2010; 46(1): 86-95.
20.
IlesJFPardoeJ. Changes in transmission in the pathway of heteronymous spinal recurrent inhibition from soleus to quadriceps motor neurons during movement in man. Brain1999; 122(9): 1757-1764.
21.
AkimaHTakahashiHKunoSYKatsutaS. Coactivation pattern in human quadriceps during isokinetic knee-extension by muscle functional MRI. European Journal of Applied Physiology2012; 91(1): 7-14.
22.
CohenJ. Statistical power analysis. Current Directions in Psychological Science1992; 1(3): 98-101
23.
OliveiraLFMattaTTMenegaldoLL. Estimation of vastus intermedius activity: The impact on moment prediction accuracy in an EMG-driven model of the knee. Congress of the International Society of Biomechanics ISB, Brussel. Proceedings of ISB, 2011.
24.
AlbertTYelnikAColleFBonanILassauJP. Anatomic motor point localization for partial quadriceps block in spasticity. Archives of Physical Medicine and Rehabilitation2000; 81(3): 285-287.
25.
VaughanCLDavisJCConnorJCO. Dynamics of Human Gait. 2nd edition. Illinois, USA: Human Kinetics; 1992. p. 45-62.
26.
WatanabeKKouzakiMMoritaniT. Task-dependent spatial distribution of neural activation pattern in human rectus femoris muscle. Journal of Electromyography and Kinesiology2012; 22(2): 251-258.