
Abstract
BACKGROUND:
Isokinetic dynamometers measure moment and calculate work and power values, which are generally used to interpret muscle performance.
OBJECTIVE:
This study aimed to determine the differences of peak moment (PM), work, and power between FRoM and calculated valid isokinetic sector (VIS) data to define the possibility of the misinterpretation of isokinetic dynamometer data.
METHODS:
Fourteen professional male soccer players who had ACL reconstruction were recruited to the muscle strengthening program which was conducted four days a week for six weeks with increasing training intensity each week. Isokinetic muscle peak moment, work, and power of knee extensors and flexors were measured at angular velocities of 60, 120, 180 and 240
RESULTS:
The results of the standard full-RoM (FRoM) report were compared with the calculated VIS data. Analyses of the FRoM data showed that PM, work, and power values for both extensor and flexor muscle groups improved significantly. However, a comparison of FRoM and VIS data showed significant differences for the work and power values at 120, 180 and 240
CONCLUSION:
The evaluation of FRoM isokinetic data may cause improper interpretations in muscle performance, particularly for contractions with higher angular velocities.
Introduction
Isokinetic dynamometers measure moment and calculate work and power values, which are generally used to interpret muscle performance. These devices are also used for effective muscle strengthening rehabilitation applications. An important feature of isokinetic dynamometer is to train isolated muscle groups at predetermined angular velocities. During training moment-sensed, real time resistance adjustments against the angular movement gives an opportunity to prevent excessive loading of the contracting muscle group. The unique specification of this device makes it possible to train with minimized excessive loading-induced complications. During rehabilitation, the angular velocities and the number of repeated contractions are adjusted to change the training intensity. It is possible to define various training models to improve muscle strength with an isokinetic device [1, 2, 3, 4] e.g. in rehabilitation programs following ACL (Anterior crucial ligament) reconstruction surgery [5, 6, 7].
Contractions performed with isokinetic dynamometers involve three phases of movement; acceleration, constant velocity, and deceleration [5]. The constant velocity portion of the range of motion (RoM) represents the valid (also known as the ‘true’) isokinetic sector (VIS) and by definition, corresponds to the real isokinetic portion of contraction. In other words, the values measured during acceleration and deceleration phases are not isokinetic and they may not be considered for this purpose [5, 8].
An evaluation of the dynamometric data based on FRoM or limited to the VIS may show significant differences [8]. The purpose of this study was to determine the differences of PM, work, and power between FRoM and VIS data throughout a rehabilitation period and to try to define the possibility of misinterpreting isokinetic dynamometer data.
Methods
Subjects
Fourteen professional male soccer players (aged 19–38 with a height of 176.4
Muscle strength measurement
Concentric PM of knee extensors and flexors was measured with a Cybex Norm dynamometer (Computerized Sports Medicine Inc., USA). Patients were seated on the dynamometer’s chair with the backrest angle at 90
Muscle performance testing protocol (angular velocity
number of repetitions). Patients rested for 1 minute between contraction bouts
Muscle performance testing protocol (angular velocity
The first set of the test protocol involving seven contractions of 240
The composition of training program throughout rehabilitation period of six weeks. [(angular velocity
Patients trained for four days a week (1
During the rehabilitation program, angular velocity values progressively decreased in order to increase the intensity of the training. At the beginning, the lowest angular velocity was adjusted to 180
VIS data calculation
FRoM and VIS data of knee extensor and flexor muscle groups for PM, work, and power values were compared by evaluating pre- and post-training test results. The detailed procedure for calculating the VIS data was given elsewhere [8].
Briefly, the acceleration and deceleration phases of contraction were determined by taking the first derivative of velocity with respect to the range of motion. The data points near zero (fluctuations equal to 0
Statistical analysis
Data were presented as mean
Valid isokinetic sector (VIS) ratio for A) extensor and B) flexor muscle groups.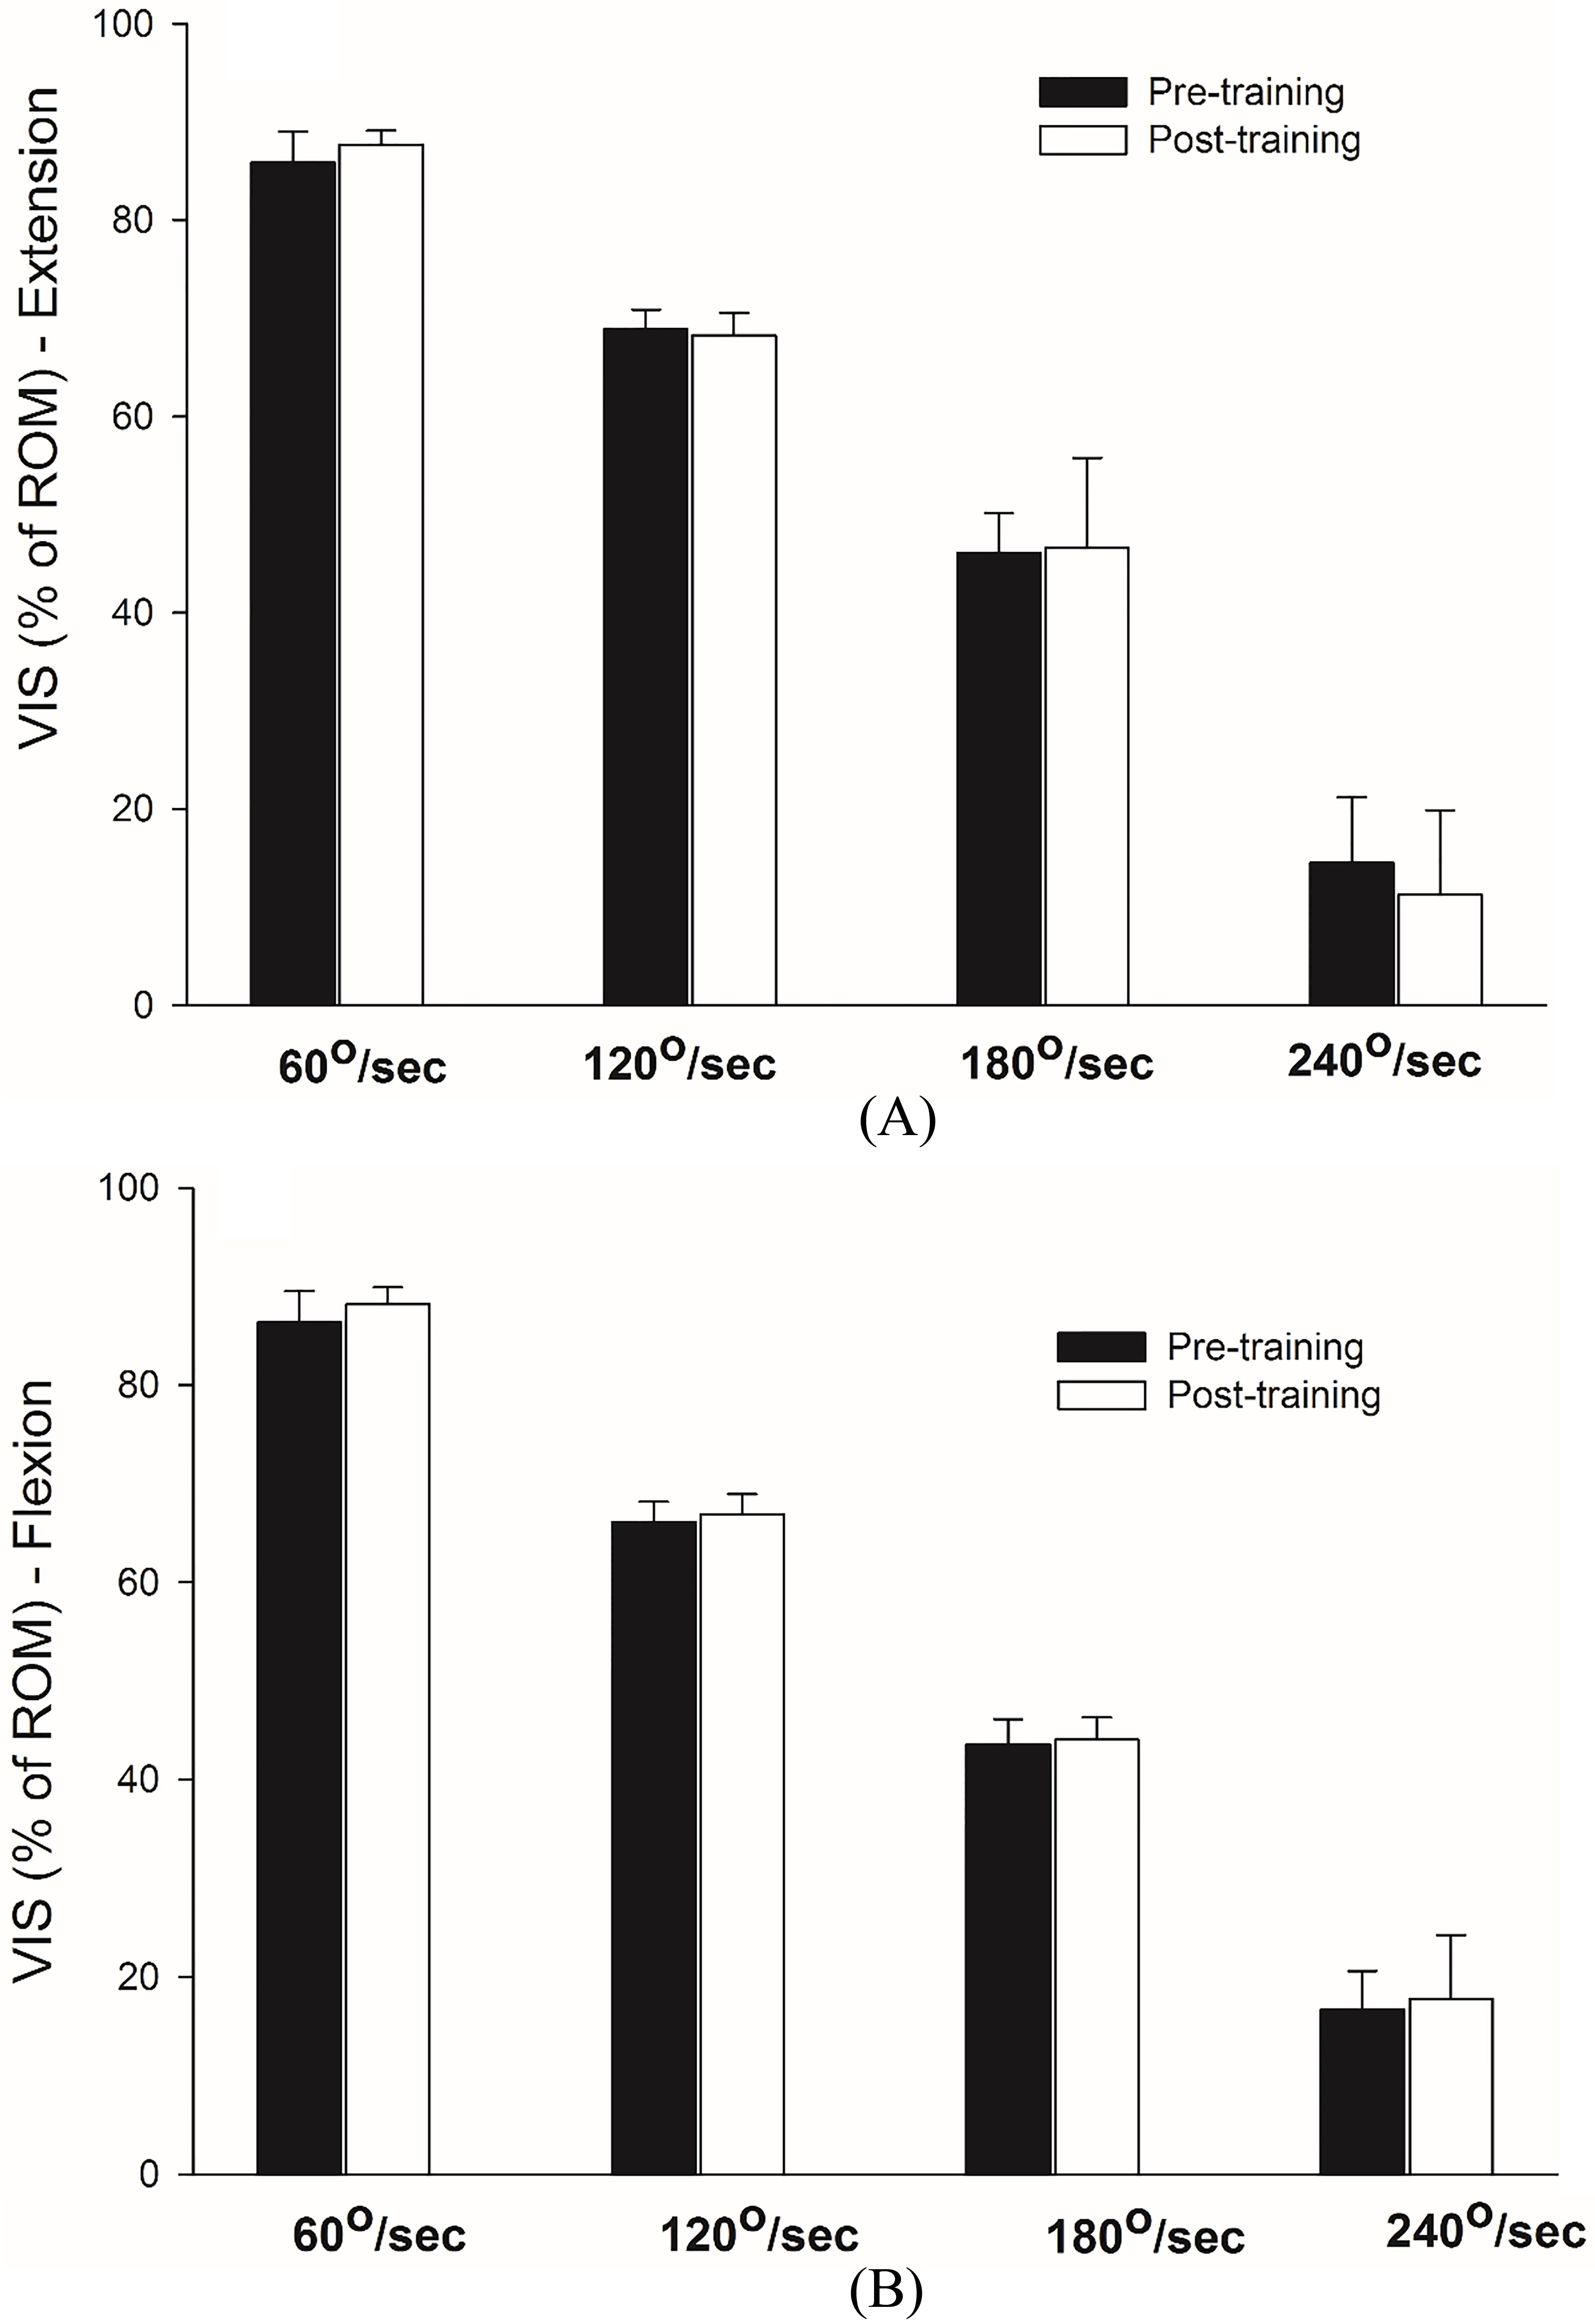
Pre- and post-training FRoM test findings for A) PM, B) Work, C) Power (
Pre- and post-training VIS findings for A) PM, B) Work, C) Power (
Comparison of pre- and post-training FRoM- and VIS-derived PM, work and power data of the extensor muscle groups. The first data group in each angular velocity represent pre-training and the second represents post-training test results. 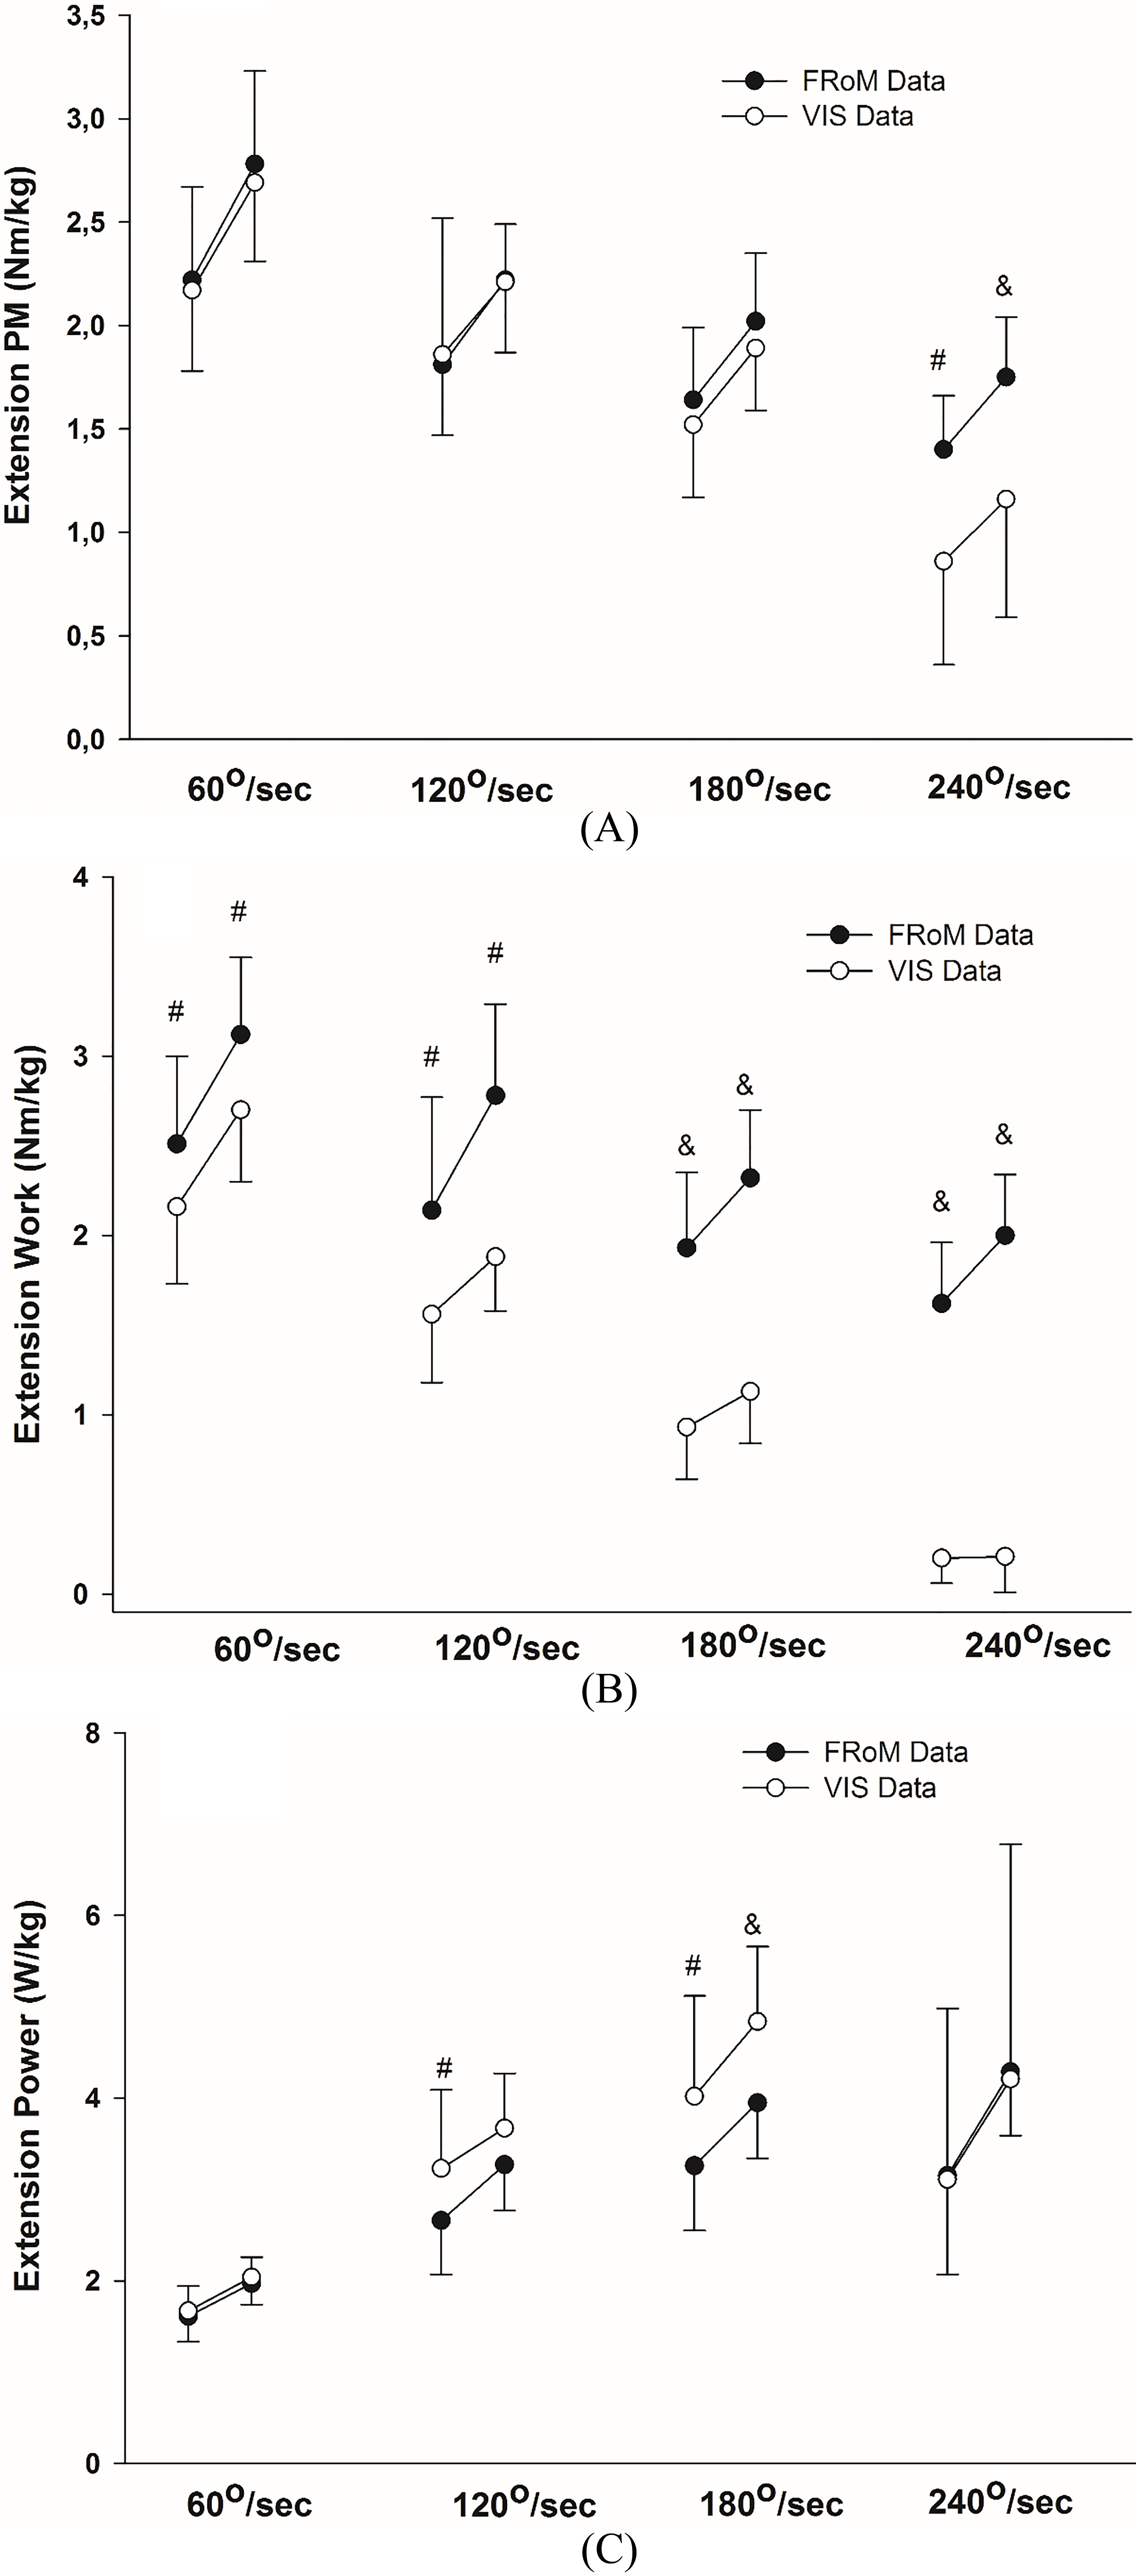
Comparison of pre- and post-training FRToM- and VIS-derived PM, work and power data of the flexor muscle groups. The first data group in each angular velocity represent pre-training and the second represents post-training test results. 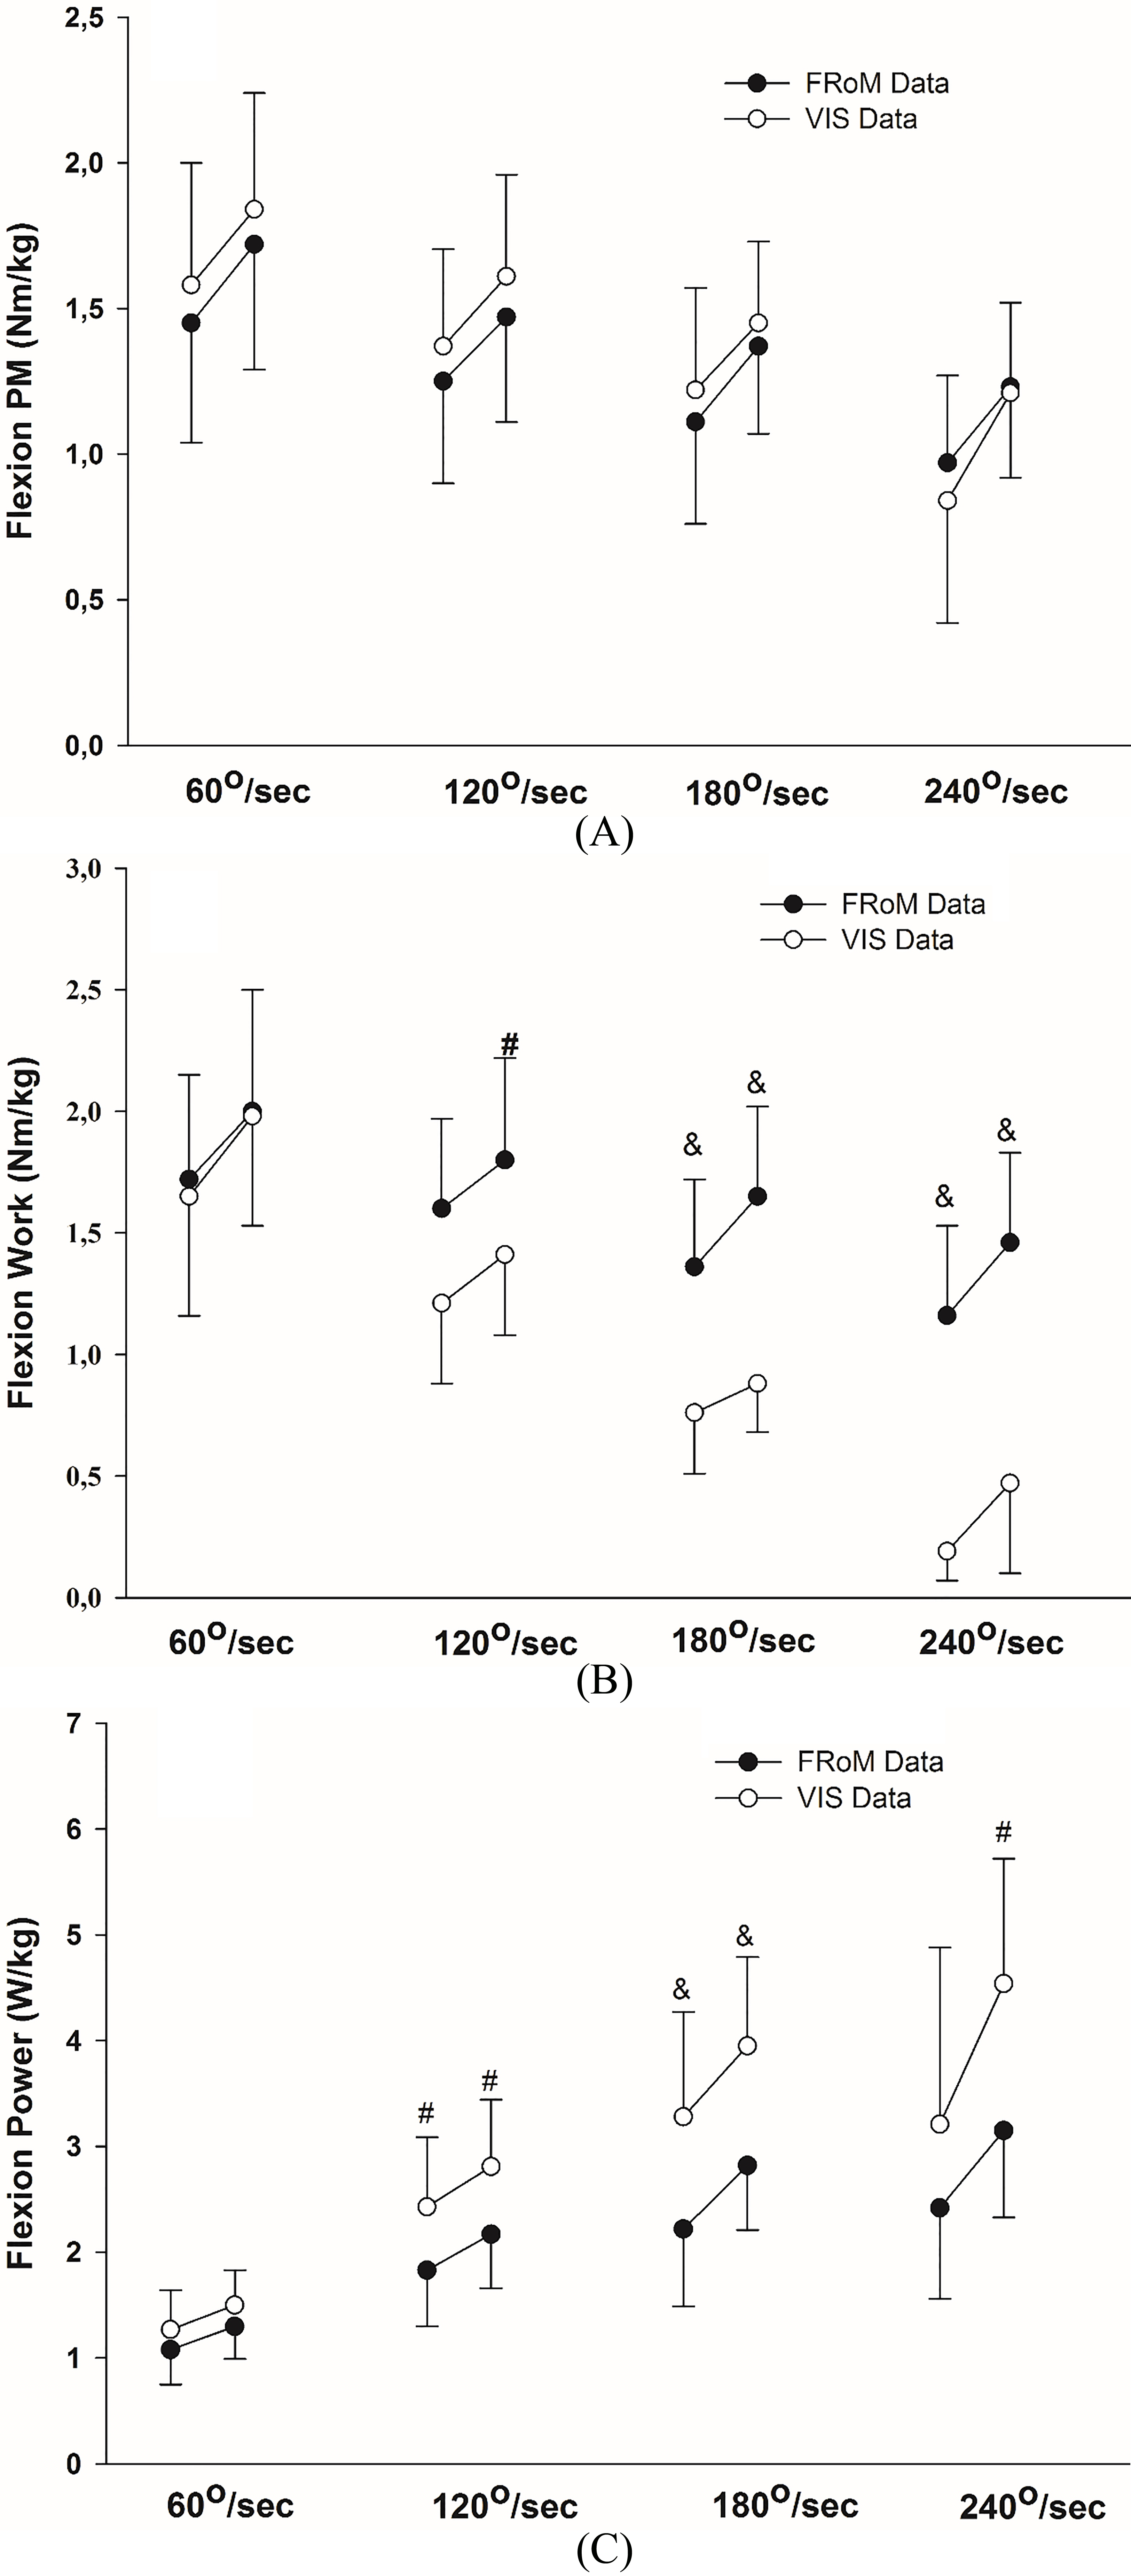
The percentage of VIS range out of the FRoM range of motion, did not change significantly after training at all angular velocities (Fig. 1A and B) and displayed similarity for both muscle groups. The isokinetic portion was approximately 80 The post-training extension and flexion PM improved significantly for both FRoM and VIS at all angular velocity (Tables 3 and 4A). However, no improvement took place in FRoM-based flexor work at 60 and 120 Extensors performance: VIS vs. FRoM. The analysis of pre- and post-training data showed that the difference between FRoM and VIS data was significant at 240 Flexors performance: VIS vs. FRoM. The difference between FRoM and VIS for PM values was not significant at all angular velocities (Fig. 3A). VIS-based work values at pre- and post-training (180 Correlation of percent improvement: FRoM and VIS. The correlation scores for knee extension became low and non-significant at 180
The major finding of this study is that the evaluation of isokinetic dynamometer FRoM data without considering VIS may cause erroneous results and misinterpretation of training progress. Even though similar PM values were obtained from FRoM and VIS data, the determination of significant differences between work and power underlines the importance of VIS for proper data analysis, mainly at high angular velocities.
Correlation of percent improvement between FRoM vs. calculated valid isokinetic sector (VIS) data for knee extension
Correlation of percent improvement between FRoM vs. calculated valid isokinetic sector (VIS) data for knee extension
Correlation of percent improvement between FRoM vs. calculated valid isokinetic sector (VIS) data for knee flexion
The essential purpose of strength training is primarily emphasized as increasing muscle PM, work, and power. During isokinetic rehabilitation programs, various angular velocity contractions are performed to increase muscle strength. The implementation of low angular velocity contractions in training programs aims to improve functional capacity and increase PM [6]. In addition to angular velocity, the number of repetitons and sets per training, resting periods between sets, and training sessions per week are the other main variables participating in creating an effective training program [1, 3, 9, 10, 11]. Angular velocities of 60, 120, and 180
Changes in PM, work and power are commonly used to determine the progress in a rehabilitation program [6, 9]. In the present study, the evaluation of the FRoM data showed a significant improvement in these variables which indicates that the performed muscle strength training protocol was effective. However, as presented in Figs 2 and 3, a statistically significant difference between FRoM and VIS data revealed the possibility of a misinterpretation of muscle strength improvement, especially at high angular velocities.
Angular velocity and VIS percentage must be considered before making critical decisions about the correct timing to terminate the rehabilitation program [13, 14]. In using isokinetic dynamometry to measure knee muscles strength in patients, it was seen that at low angular velocities both the extensor and flexor muscles performed such that the ratio of the VIS to the FRoM remained roughly around 80%. However, with increasing angular velocity, this ratio decreases significantly, reaching below 20% at 240
The decrease in the measured values of work at high velocities may lead to the misinterpretation of the status of the patient leading forming misinformed judgments and rehabilitation plans. Even though the percentage of performance improvements of the two groups of athletes that were treated using the FRoM and processed data are close to one another, this consistency is not sufficient in validating judgments made relying on erroneous data. It is particularly important to emphasize that determining PM, work and power data based on a valid isokinetic sector is essential for decision making regarding the termination of a training program.
Footnotes
Conflict of interest
The authors declare no conflict of interest.