
Abstract
In the process of urbanization, the design and planning of urban landscapes have become increasingly important. Aiming at the shortcomings of traditional urban planning models such as poor visual presentation and low error rate in landscape creation, this article utilized remote sensing technology to collect vegetation and building landscape data and used geographic information systems (GIS) to process and analyze the collected landscape data. With the help of analyzed data, a visualization model of urban three-dimensional (3D) landscape network was constructed using sensors and modeling techniques. Sensors were used to achieve visualization display and management of urban landscape network, enabling better development of urban 3D landscape visualization models. The user satisfaction rate of the sensor based 3D landscape visualization model was over 92.4% and the average error rate of landscape creation after 20 experiments was 3.9835%. Building a 3D urban landscape visualization model based on sensors could effectively improve user satisfaction with the model’s visualization, provide better visualization services to users and help designers better create landscapes, improving the accuracy of landscape creation.
Keywords
Introduction
The continuous acceleration of urbanization and the continuous expansion of urban scale have made the design and planning of urban landscapes very important. In traditional urban landscape planning models, landscape networks have shortcomings in design, planning and management, making it difficult to satisfy the current demands of people for urban landscapes. Compared to 2D (two-dimensional) flat images, 3D scenes are more exciting and immersive. Accordingly, people try to use computers to simulate real scenes. In recent years, with the rapid development of various technologies, creating 3D landscapes has become a reality and has been widely applied in urban landscape design. Therefore, this article uses sensors to study the visualization model of urban 3D landscape network, to create realistic 3D landscapes. These created landscapes are based on landscape data collected by remote sensing technology, such as land, buildings, plants, water bodies, etc. These real landscape data are used to create 3D visualization models, enabling better design of urban landscapes and making up for the shortcomings of traditional urban planning.
With the continuous progress of urban development, urban development is not only concerned with the construction and planning of buildings. Urban landscape is also an important and critical aspect of urban development. Many scholars use different technologies to study 3D landscape visualization models, helping to better design urban landscapes and further improve the urban environment. Kikuchi Naoki believed that the integration of augmented reality and drones enabled the visualization of past and future landscapes from an aerial perspective. A landscape design method was developed based on the digital twin method through visualizing urban digital twins and augmented reality technology [1]. Wang Zhuang proposed a landscape visualization optical construction method based on 3D laser printing and applied the obtained data well according to the 3D model of the architectural landscape, promoting the development of architectural landscape visualization [2]. Based on the research on ecological landscape resources in protected areas, Yang Hongmei utilized 3D landscape visualization technology to study mountain landscapes, landscape vegetation and cultural landscapes, enabling better scientific, intuitive and fast visualization analysis of urban landscape resources [3]. Yang Chen aimed to identify spatial patterns of rural landscapes and explored how to use point cloud technology to record and represent spatial information of rural landscapes. By utilizing point cloud visualization technology, she has constructed a multi-scale spatial information digitization method that could quickly, accurately and comprehensively record and represent spatial features of rural landscapes [4]. Using the wireless sensor network in the internet monitoring system, Zhou Huaiyu designed and installed multiple sensors to collect rainwater data, such as rainfall, interception, soil moisture capacity, permeability, etc. The runoff reduction effect of tree canopies was evaluated and complex soil hydrology was visualized by analyzing the correlation of indicators [5]. However, these scholars’ research on urban landscape is not comprehensive enough and sensor based research on urban 3D landscape models can achieve better results.
The implementation of urban landscape visualization can rely on a 3D urban landscape visualization model, which can clearly see the goals of the world people live in. Urban 3D landscape design is the foundation for achieving urban landscape design and an important means of visualizing urban landscapes. The 3D landscape visualization model utilizes landscape data collected based on remote sensing technology to create a virtual environment that is consistent with the actual terrain and then adds a real 3D model to create a real 3D landscape model. Simultaneously, the urban 3D landscape system can also provide human-computer interaction, allowing observers to view the relationships between different levels in detail, to assist users in identifying and combining data.
Urban 3D landscape
Landscape data collection
Remote sensing technology is a widely used technology [6, 7]. It includes remote sensing platforms, sensors and data receivers, data processing and analysis systems and more. Photogrammetry is a scientific technology that uses photography or remote sensing to obtain geometric and physical information such as the shape, size and position of objects. A city is an artificial object that includes complex visual and functional objects and urban design should involve multiple disciplines. The construction method of 3D landscape model is shown in Table 1.
Construction methods for different 3D landscape models
Construction methods for different 3D landscape models
Landscape data includes three aspects: landscape subject, landscape physical environment and urban cultural environment.
The urban landscape subject is the most important data of urban landscape, including many aspects [8, 9]. Before establishing a 3D landscape visualization model, urban landscape subject data should be collected. The physical environment level is the main aspect that affects the urban landscape ecology, mainly including climate, terrain, hydrology, soil, animals, plants and so on.
According to the characteristics of urban areas and data objects, the construction of 3D urban models usually requires two types of data: 3D space and real images.
The basic information of a building is composed of plane data and height data [10, 11]. The acquisition of flat data is easy and can usually be obtained from a two-dimensional geographic information system (GIS) database. However, the building height data is difficult to obtain. According to the two-dimensional GIS database, using sensor technology to estimate the height of buildings according to the number of high-rise buildings, the building height information obtained by this method is only an estimate and it requires that each building is a flat roof. If more accurate data is needed, remote sensing technology can be used to obtain the height data of buildings. The data obtained contains the geometric information required for 3D digital elevation model modeling [12, 13]. The schematic diagram of the building entity modeling model is shown in Fig. 1.
Schematic diagram of building entity modeling model.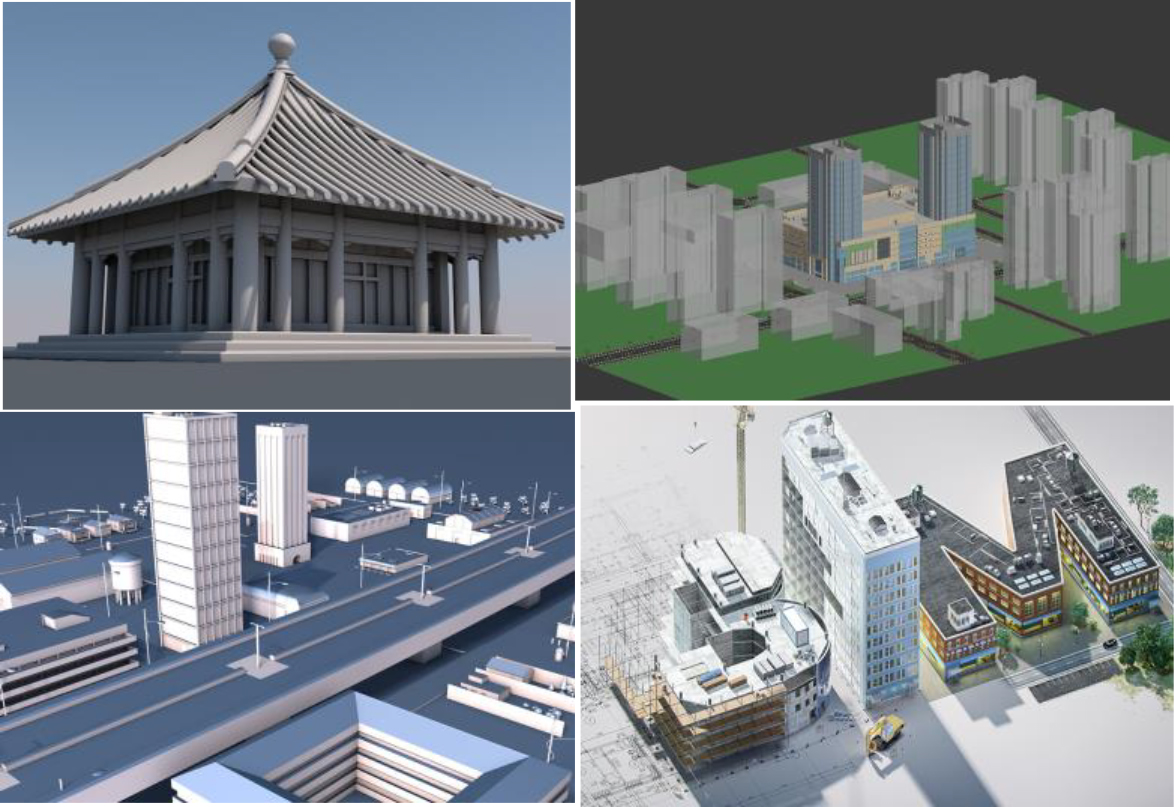
Architectural design problems are often complex, characterized by numerous variables and difficult to quantify logical relationships. The specific expression is as follows:
Among them,
Vegetation is an important element that enhances the realism of the landscape. Plants in the landscape can be divided into two types based on their height: One is plants near the ground, such as grasslands, nurseries, etc. Another type is vegetation with a certain height that requires 3D representation, such as trees. The former can be represented by pasting corresponding texture images of the area, such as texture images of grasslands. The latter is vegetation with a certain height and their simulation cannot be represented by simple planar maps. A 3D model with a certain height must be established. The schematic diagram of the green landscape entity modeling model is shown in Fig. 2.
Schematic diagram of green landscape entity modeling model.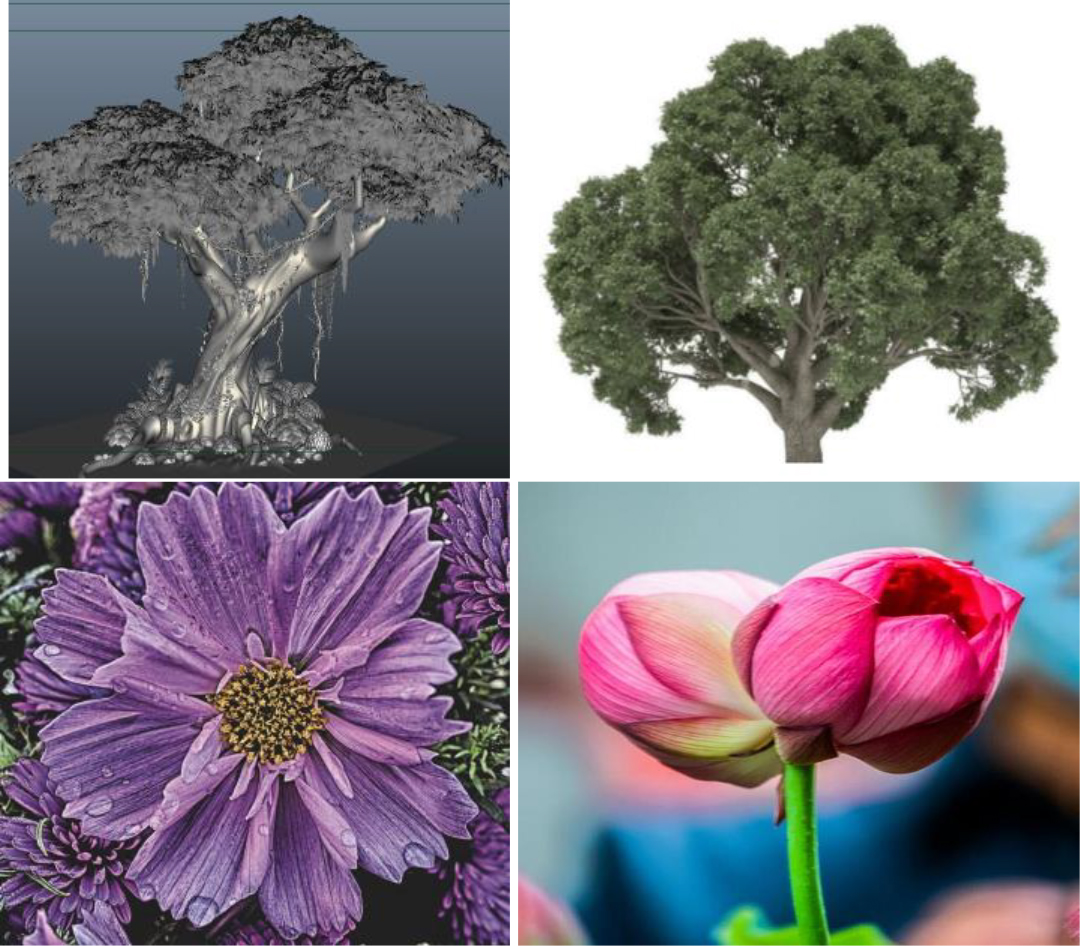
By using texture mapping technology, the texture image of trees is mapped onto a rectangular plane in space to simulate trees, which is a simple method for generating realistic trees [14, 15]. In general, the affine relationship between 2D texture data and 3D object space can be established by affine transformation. The specific expression is as follows:
In the formula,
The precise surface fitting method is to find the triangle where each grid point is located and the triangle string with adjacent common edges and fit it into a surface. The specific expression is as follows:
Among them,
After collecting landscape data through remote sensing technology, the data must be processed. This includes operations such as data classification, standardization and maintenance. Simultaneously, the collected data should be geospatially processed to facilitate subsequent modeling. Building materials are the main element of urban 3D landscape design and their quality can affect the overall effect of 3D visualization. Due to the rarity of complex buildings, most of them require separate writing, resulting in a low usage rate of traceability rules. For buildings of the same type, rules can interact with their own data by simply writing a rule and calling back.
The combination of terrain and surface attributes is the key to achieving the integration of terrain models and surface models. Firstly, without considering terrain constraints, high points of the study area are extracted from the top map and rough points are removed. For point like objects such as streetlights and trees, interpolation is often used to obtain high-quality features of the original surface. For the road centerline, it is very simple to delete redundant nodes and then obtain high attributes from the original data through interpolation. For planar data, local triangulation network reconstruction of the original terrain is achieved by embedding its feature points and boundary feature lines based on previous research. The road model usually removes the middle road first, expands it according to the width of the road, then splits it and finally calls related functions to create texture maps.
The geometric transformation matrix of 3D graphics can be expressed as
Among them, the matrix can be functionally divided into four small matrices.
A 3D landscape network model is created by using modeling techniques. Based on terrain data, a 3D landscape network model is created, incorporating various data into the model to achieve secondary fusion of GIS data and sensor data. In geology, landscape refers to a beautiful place naturally formed in a region with beautiful features. Landscape is a complex of terrain, plants, water bodies, natural phenomena and humans. The specific landscape elements are shown in Table 2.
Introduction to different landscape elements
Introduction to different landscape elements
The urban 3D landscape visualization model is a realistic model based on the actual 3D geographic coordinates of buildings and is a 3D landscape model that combines urban terrain description. In this 3D landscape model, the spatial location of the building is completely consistent with the actual site and the spatial 3D coordinates of any point can be measured. The creation of 3D city models, especially realistic 3D models with textures, can achieve urban condition analysis and planning and design description, eliminate and change the teaching mode based on 2D maps and 3D physical models, which is more in line with people’s visual habits. The process of 3D landscape modeling based on sensors is shown in Fig. 3.
Sensor-based 3D landscape modeling process.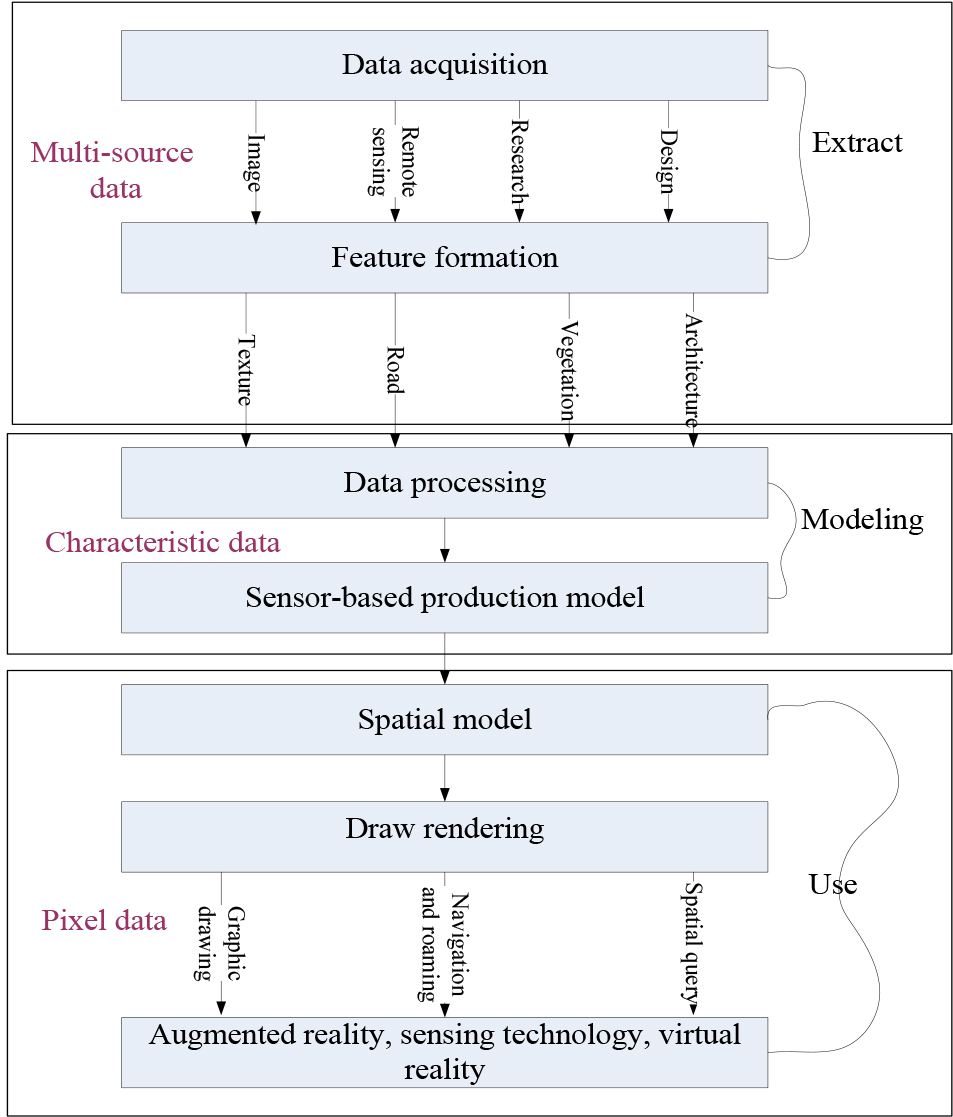
3D landscape is a multifaceted representation of a city. By using decomposition and integration methods, a complete 3D landscape can be obtained. Then, the sharing technologies and means of each part are discussed one by one and the real world landscape data is simulated from a 3D perspective. Compared to binary landscapes, 3D landscapes are not only data models, but also contain a wide range of heterogeneous content, with multiple data presentation methods and different construction methods. The urban 3D landscape model based on sensors, starting from the perspective of treating the 3D landscape as a system, gradually divides the main events into various features through steps such as decomposition and component supply. The schematic diagram of the 3D landscape model architecture based on sensors is shown in Fig. 4.
The data of urban 3D landscape visualization models based on sensors mainly includes spatial data and attribute data. The main data layers in the database are shown in Table 3.
Introduction to model storage data layer
Introduction to model storage data layer
Schematic diagram of a sensor based 3D landscape model architecture.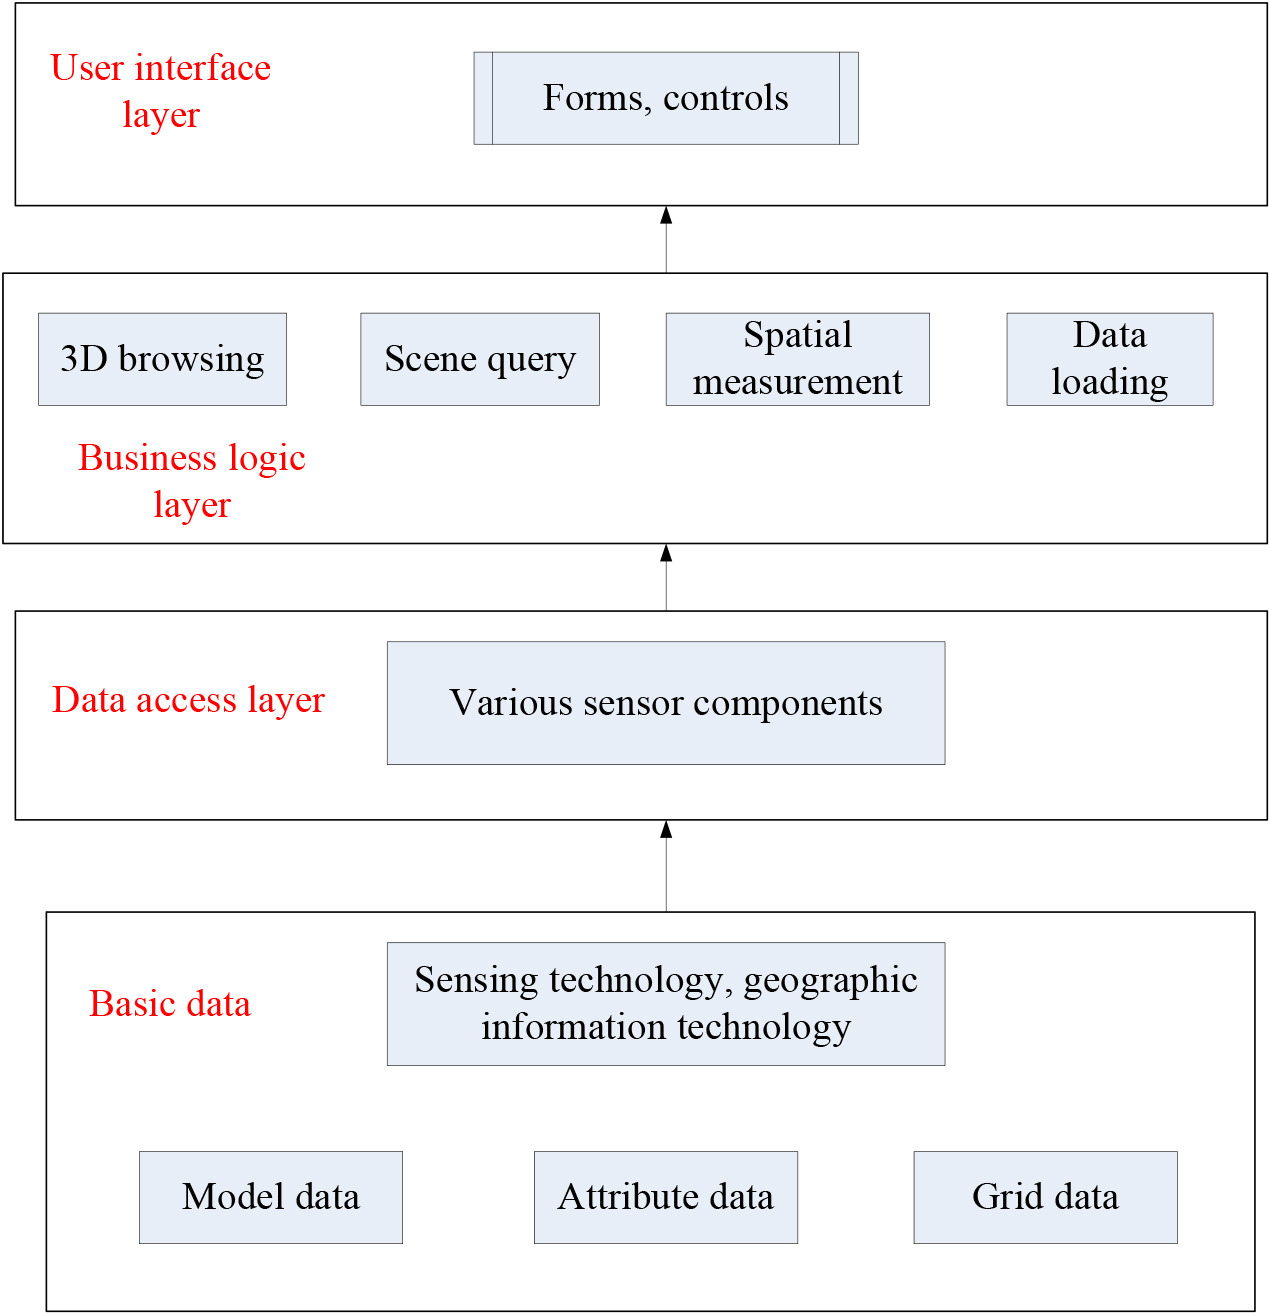
3D browsing mode: 3D browsing usually controls the landscape by changing the observation point of the line of sight and the line of sight of the target point and this module has many functions. These features allow users to view objects in 3D landscapes from afar or from different angles and locations. Query model: When conducting 3D landscape design, the user’s query behavior is bidirectional. It can not only query the content of spatial objects, but also find spatial objects based on information. Space measurement module: The position measurement module is commonly referred to as the measurement distance. The coordinates obtained from the measurement point are the coordinates of the object, obtaining spatial coordinates by clicking on a location on the computer screen and then obtaining the scene coordinates of that point through the inverse process of perspective projection transformation. The process of obtaining spatial coordinates is shown in Fig. 5.
Spatial coordinate acquisition process.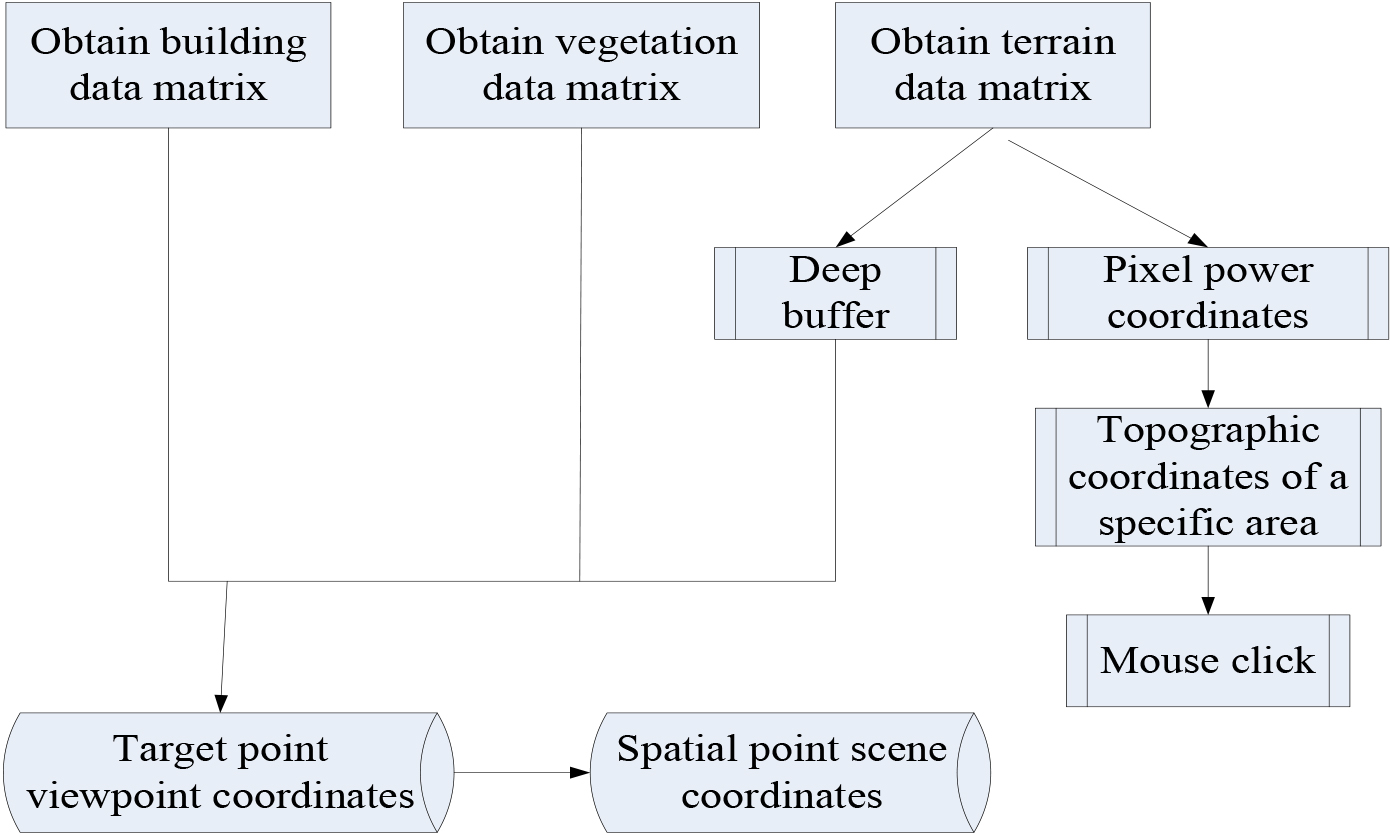
After the 3D landscape network model is created, the model is visualized through data and information visualization technology. Through visualization technology, complex information can be presented in an easily understandable form, which is beneficial for urban landscape planning and urban management. The concept of visualization has very rich meanings and the problem of converting invisible data to visible data can be summarized as a visual problem [16, 17]. However, as a technology, visualization is still in a relatively new field, which is a technology generated in the context of digitization, including image understanding and synthesis, which uses computer processing technology to convert data into graphics or images and display them on the screen, interacting with users.
After completing the modeling of the urban 3D landscape visualization model, it is necessary to arrange the various models in relative positions in the model space and then display the entire 3D landscape model scene in the form of 3D images on the computer screen. Human-computer interaction is used to control the rendering of urban 3D landscapes. 3D landscape visualization is an important component of urban development and the connection between landscape design users and the real world. Its main purpose is to present environments and things that are usually difficult to imagine and approach in a dynamic and intuitive manner. The interface of the sensor based urban 3D landscape visualization model is shown in Fig. 6.
Sensor-based urban 3D landscape visualization model interface.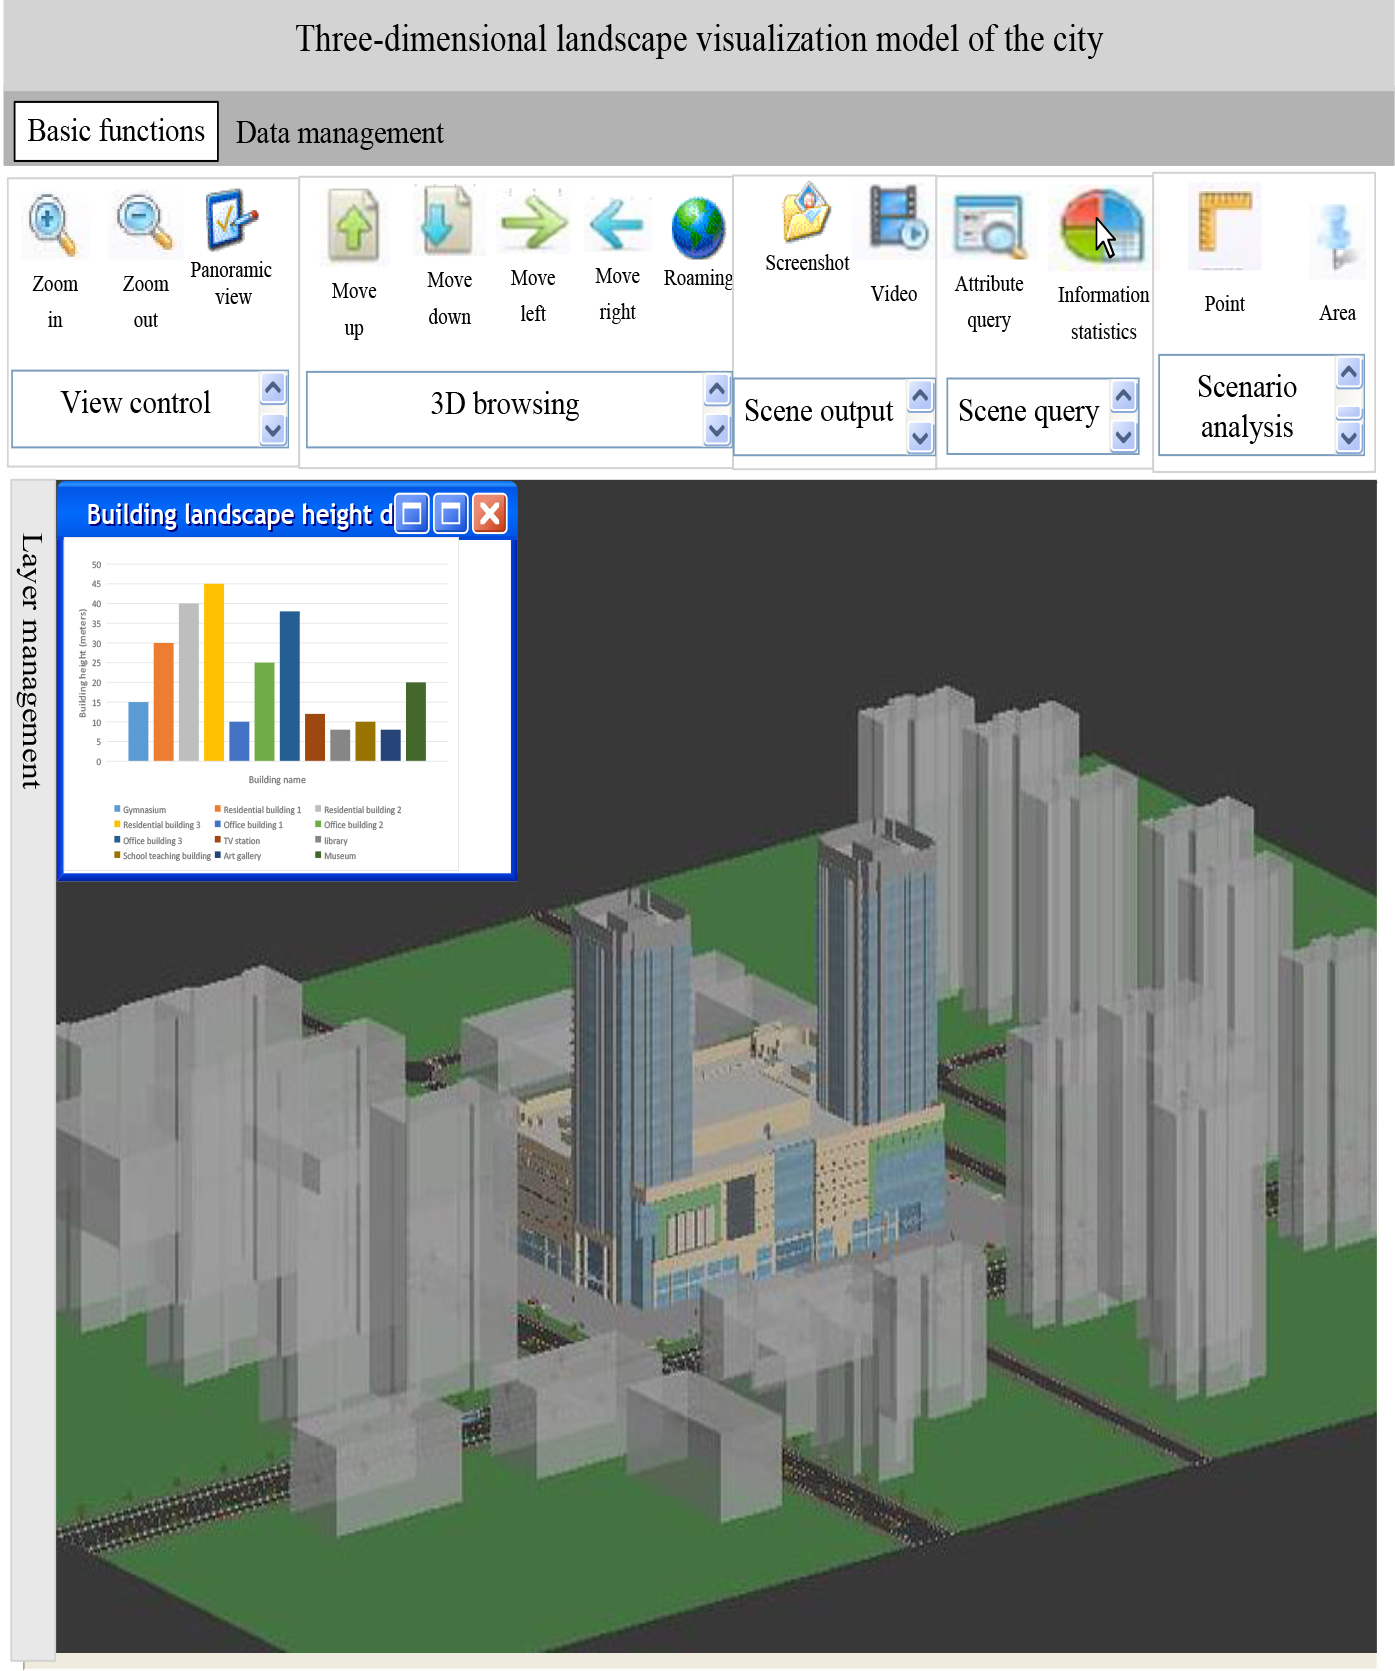
The shading function of the lighting model is:
Among them,
One of the criteria for testing the quality of the constructed urban 3D landscape network visualization model is the degree of model visualization. To compare the visualization effect of the landscape visualization model well, 20 model users were randomly selected to investigate their satisfaction with the visualization of the landscape visualization model, mainly concerning the clarity of the model visualization, the response time, the color saturation of the interface and the overall display effect of the satisfaction survey [18, 19]. Through investigation, it was found that the visualization effect of the sensor based urban 3D landscape network visualization model was better and the user satisfaction rate was higher. This further reflected the superiority of the sensor based visualization model. It was compared with satisfaction rate of visualization of urban 3D landscape visualization models based on geometric modeling (GM), rule driven (RD), visualization technology (VT) and geographic information system (GIS). The specific comparison results are shown in Table 4.
Comparison of user satisfaction with visualization of different urban 3D landscape visualization models
Comparison of user satisfaction with visualization of different urban 3D landscape visualization models
As shown in Table 4, a survey was conducted on the satisfaction rate of 20 randomly selected users with different urban 3D landscape visualization models. It was found that these users’ satisfaction rate with sensor based visualization models was much higher than that of other urban 3D landscape visualization models. The user satisfaction rate for sensor based 3D landscape visualization models was above 92.4%, while the user satisfaction rate for urban 3D landscape visualization models based on GM, RD, VT and GIS was below 88.65%, 89.54%, 92.39% and 92.12%, respectively. Among them, the 12th user had the lowest satisfaction rate with the visualization of sensor based 3D landscape visualization models, only 92.41%. However, their satisfaction rates were still 6.8%, 5%, 2.11% and 3.13% higher than those of urban 3D landscape visualization models based on GM, RD, VT and GIS, respectively [20, 21]. The 15th user had the highest satisfaction rate with the visualization of the GM based urban 3D landscape visualization model, with 88.64%, but it was still 6.41% lower than the sensor based model. The 6th user had the highest satisfaction rate with the visualization of urban 3D landscape visualization model based on RD, with 89.53%, but it was still 3.12% lower than the sensor based model. The 10th user had the highest satisfaction rate with the visualization of the VT based urban 3D landscape visualization model, with 92.38%, but it was still 0.74% lower than the sensor based model. The 9th user had the highest satisfaction rate with the visualization of urban 3D landscape visualization models based on GIS, with 92.11%, but it was still 2.72% lower than the sensor based model. In summary, the satisfaction rate of the GM based 3D landscape visualization model was the worst, while the satisfaction rate of the sensor based 3D landscape visualization model was the best. By using sensing technology, data on urban landscapes could be better collected, helping users better visualize the landscape in 3D and achieving better visualization results [22].
To further study the visualization model of urban 3D landscape, the above 5 urban 3D landscape visualization models constructed based on different methods were studied and the average visualization satisfaction rate of 20 extracted users was studied. The specific research results are shown in Fig. 7.
Average satisfaction rate of users with visualization of different urban 3D landscape visualization models.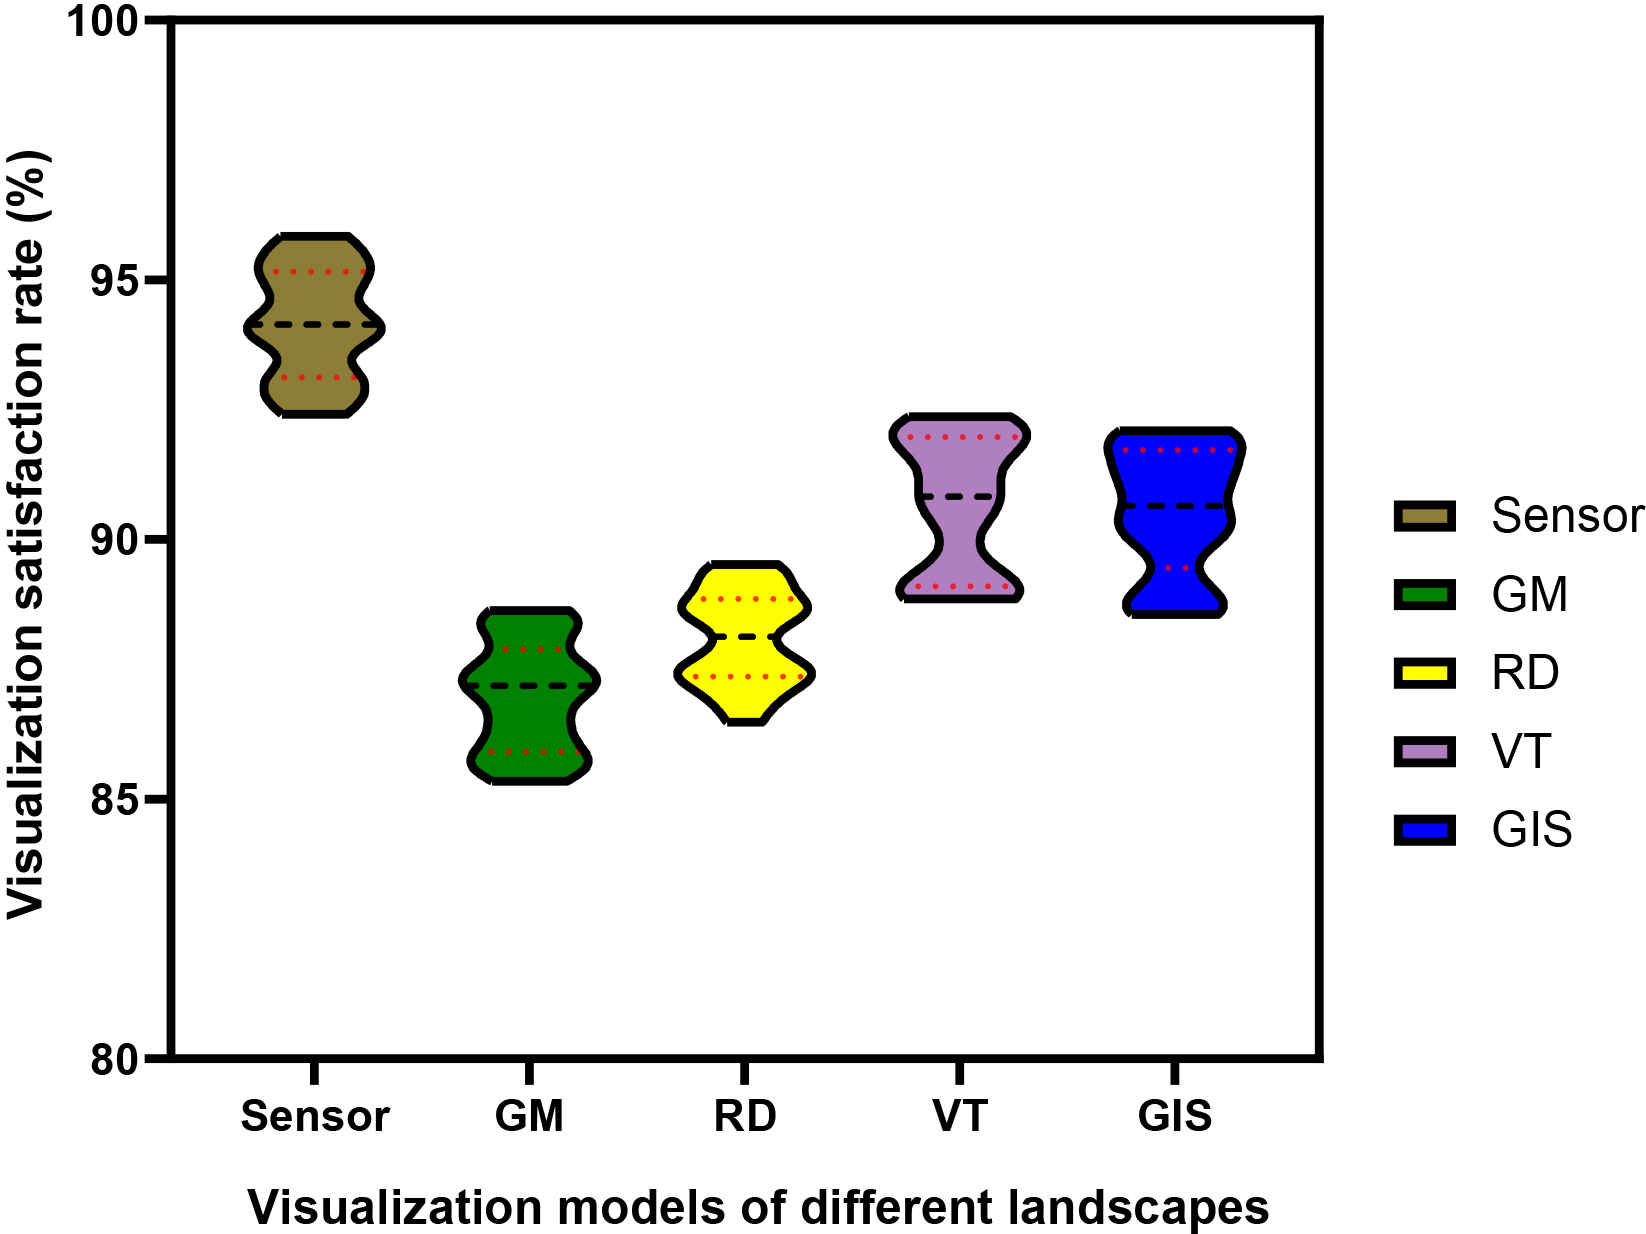
Comparison of error rates of urban 3D landscape visualization models constructed using different methods for landscape creation. A: Error rate of landscape creation in multiple experiments; B: Histograms created for different model landscapes.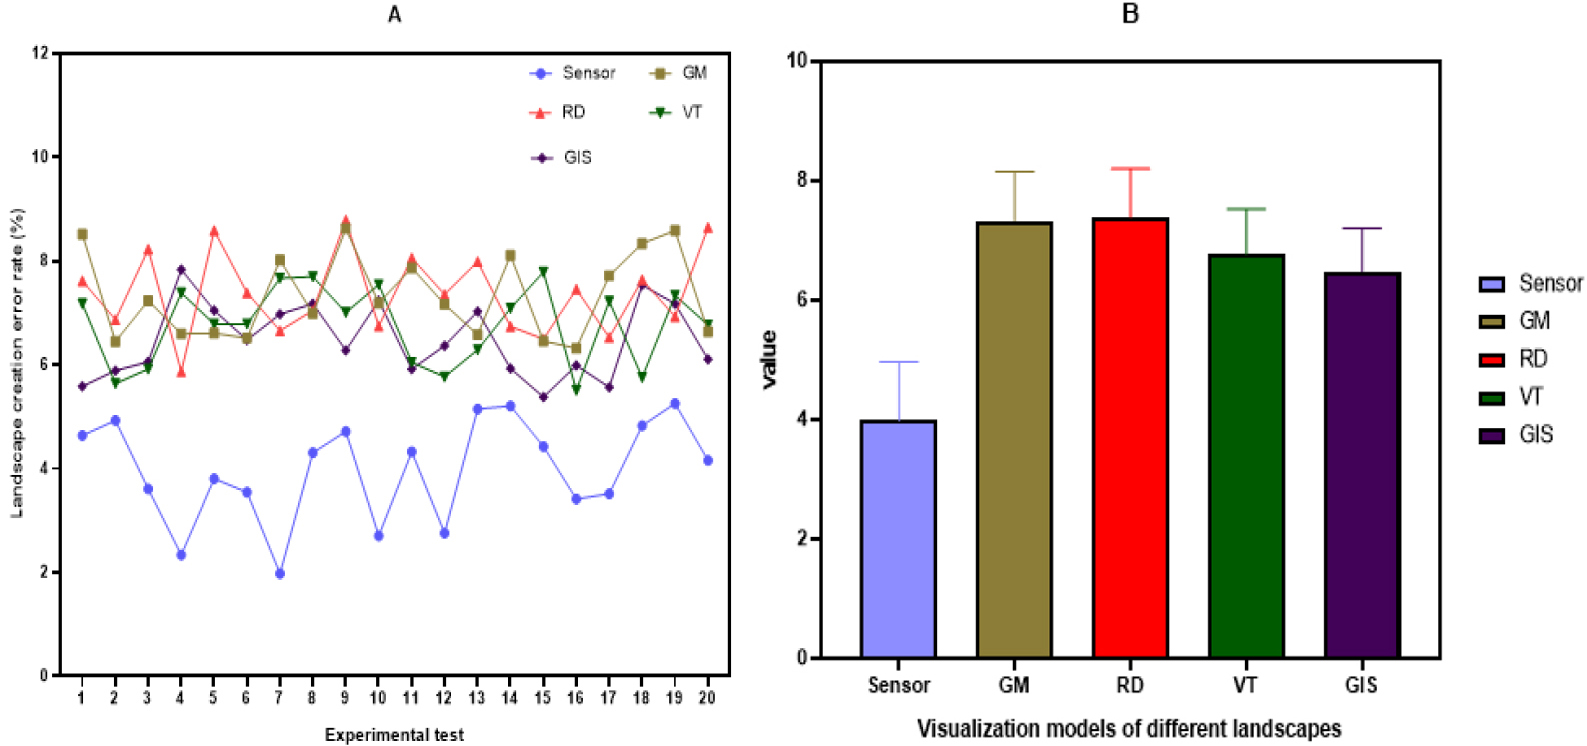
In Fig. 7, the x-axis represents different types of urban 3D landscape visualization models and the y-axis represents satisfaction rates. The elements in the figure are represented by the black line in the middle, which represents the average satisfaction rate of 20 users with the visualization of the landscape model. The highest and lowest points of the elements represent the highest and lowest satisfaction rates of 20 users with the visualization of the urban 3D landscape model, respectively. As shown in Fig. 7, the average satisfaction rate of the 20 extracted users with the visualization of the sensor based urban 3D landscape visualization model was 94.165% and the average satisfaction rate of the 20 extracted users with the visualization of the GM, RD, VT and GIS based urban 3D landscape visualization model was 86.99%, 88.102%, 90.68% and 90.541%, respectively. Their average visualization satisfaction rates were 7.175%, 6.063%, 3.485% and 3.624% lower than those of sensor based urban 3D landscape visualization models, respectively.
The construction of a 3D urban landscape network visualization model can effectively help improve the accuracy of urban landscape creation and reduce the error rate of creation. The model is used to first model the overall urban landscape in 3D, predict the location of each landscape construction in advance and help the urban landscape present the best results. To better study the error rate of the sensor based urban 3D landscape network visualization model for building landscape creation, this model was used for landscape planning and design in City A. To avoid accidental experiments and make the experimental results more scientific, 20 experiments were conducted and the obtained experimental results were compared with the experimental results of the urban 3D landscape visualization model based on GM, RD, VT and GIS. The specific comparison results are shown in Fig. 8.
In Fig. 8A, the x-axis represents the number of experiments conducted and a total of 20 experiments were conducted. The y-axis represents the error rate of landscape creation. In Fig. 8B, the x-axis represents the 3D visualization landscape models of cities constructed using different methods and the y-axis represents the average error rate of multiple experiments. As shown in Fig. 8A, the error rate of urban 3D landscape visualization models based on sensors for landscape creation was much lower than other urban 3D landscape visualization models and the error rate of landscape creation in multiple experiments was below 5.27%. However, the error rates of landscape creation in urban 3D landscape visualization models based on GM, RD, VT and GIS were above 6.31%, 5.86%, 5.5% and 5.37%, respectively. Among them, the sensor based urban 3D landscape visualization model had the highest error rate of 5.26% in the 19th experimental landscape creation, which was 3.33%, 1.67%, 2.08% and 1.92% lower than the landscape creation error rates of the GM, RD, VT and GIS based urban 3D landscape visualization models, respectively. Both GM based and VT based urban 3D landscape visualization models had the lowest error rates in landscape creation in the 16th experiment, with only 6.32% and 5.51%, respectively, which were 2.9% and 2.09% higher than sensor based models. The urban 3D landscape visualization model based on RD had the lowest error rate in landscape creation in the fourth experiment, only 5.87%, but it was still 3.53% higher than the sensor based model. The GIS based urban 3D landscape visualization model had the lowest error rate in landscape creation in the 15th experiment, only 5.38%, but it was still 0.95% higher than the sensor based model. As shown in Fig. 8B, the average error rate of landscape creation in the 20 experiments of the sensor based urban 3D landscape visualization model was 3.9835%. The average error rates of landscape creation in the GM, RD, VT and GIS based urban 3D landscape visualization models were 7.3285%, 7.384%, 6.762% and 6.4805%, respectively. They were 3.345%, 3.4005%, 2.7785% and 2.497% higher than the average error rates of the sensor based urban 3D landscape visualization model, respectively.
Safety test results
Security testing is the testing of system security. It is only used to check whether the system authentication is normal, whether the user’s identity can be authenticated and whether the user’s work permission can be authenticated. The test results are shown in Table 5.
Cities are one of the most densely populated, resource intensive and information intensive regions on the Earth’s surface and are important places where human activities generate connections. Cities have always played an important role in people’s daily lives. 3D landscape modeling has become an important component of urban landscape infrastructure construction. At present, people are very dissatisfied with the design and construction of urban landscapes, which are only one building at a time. This kind of landscape construction speed is very slow and the overall urban landscape presentation effect is very poor. Therefore, a 3D landscape visualization model is needed to use the model to design the overall urban landscape and effectively visualize it. This article studied the visualization model of urban 3D landscape network based on sensors. After practical testing, it has been proven that it has advantages in visualization, planning and management. The 3D urban landscape visualization model created could not only be used for overall planning of urban landscapes, but also allowed users to roam. Through experiments, it can be found that the model studied was valuable and could promote the development and deepening of urban 3D landscape sharing, providing effective support for urban planning and management.
The area of sensor-based visualization of urban 3D landscape networks is still in its infancy, and potential future research trends include the following:
Data collection and processing: As sensor technology advances, it is increasingly used in data collection. Future research could concentrate on large-scale, multi-source, heterogeneous data processing and fusion, as well as the accuracy and efficiency of data collecting. Model complexity and refinement: The existing urban 3D landscape network visualization model frequently relies on geographic data and a spartan architecture model. Future studies can focus further on finer details, such as the internal construction of buildings, the road system, the amount of green space, etc. Visualization technology and interaction design: An intuitive and interactive display and study of the urban environment is what the urban 3D landscape network visualization model aims to offer users. Future study could concentrate on more sophisticated visualization technologies, including virtual reality, augmented reality, mixed reality, etc., as well as user-interaction design, enabling users to understand and explore the spatial characteristics and potential issues of cities more intuitively.