
Abstract
It is difficult for traditional data processing methods to make full use of the potential of braiding driven data, unable to quickly collect and preprocess data, and difficult to ensure the accuracy of data. Rote learning (RL) is part of the research field of artificial intelligence, which aims to enable computers to learn autonomously, just like humans. This allows understanding of relationships and patterns between data and helps computers process information quickly. In order to solve the problems of poor data integrity, slow data processing efficiency and poor information sharing in traditional data processing, and further optimize the braiding driven data processing technology, this paper combined RL with braiding driven data. Through the method of mechanical learning, the potential of weaving driving data is fully exerted, so that it can better cope with nonlinear relations and high-dimensional features. It used the effective method provided by the RL to process the braiding drive data, collect the data, and preprocessed the collected data to ensure the correctness of the data. It extracted the features of the data, which was convenient to classify the data according to its attributes. At the same time, this paper verified it by the steps of feature extraction, model training and data analysis. In order to test whether braiding drive data processing by RL can effectively solve the problems existing in traditional drive data technology, this paper tested the performance of compiled drive data processing, and the analysis results were as follows. The data integrity rate of braiding drive data was as low as 81%, which was much higher than that of traditional drive data processing. The recognition ability of data acquisition and matching was much higher than that of traditional drive data processing. Compared with the traditional drive data processing, the information sharing has been greatly improved. In terms of data processing efficiency, it is also much higher than the traditional drive data processing. It can be seen that the method of braiding drive data processing through RL effectively improves the accuracy of data processing. It strengthens the identification ability of data collection and matching, improves the sharing of information, enables users to obtain data and analyze it faster, and also improves the processing efficiency of data.
Keywords
Introduction
Traditional data-driven processing methods often oversimplify the complexity between data. Braiding driven data is a single, unified architecture with an integrated set of technologies and services designed to deliver integrated and rich data to the right data consumers at the right time and in the right way. The traditional data-driven processing method is difficult to process and compile the driven data. Traditional methods are difficult to deal with complex data relationships, such as the interaction between multiple factors and variables, which makes it difficult to fully mine potential patterns and associations in data in practical applications. In order to solve the problem that the traditional data-driven processing method is difficult to solve the correlation between complex data, RL is combined with compilation-driven data processing.
Braid drive data contains information from different data sources. Compared with traditional data processing systems, it can make full use of the potential of braiding driven data to deal with nonlinear relations and high-dimensional features. Tatiana Delgado F believed that digital transformation requires accelerating profound changes to leverage technology and data to make decision making more effective, agile and self-sustaining [1]. Wang Yongming believed that due to the complexity and breadth of linked data, it was difficult for many people to understand its technical details and its potential. Braiding driven data can help people better understand some important concepts [2]. De Guire Eileen proposed that braiding drive data can improve work efficiency by using more data analysis, thus developing better functional materials more efficiently [3]. Weaving Dan believed that braiding driven data can better support practitioners to overcome the challenges associated with multivariate data analysis and interpretation [4]. Moon Seok-Jae believed in adopting a data platform that drives data in a multi-cloud environment where data can be easily accessed anytime, anywhere. It was applicable to the cloud environment with a distributed platform as the center, overcoming the limitations of traditional systems [5]. Although the existing braiding driven data improves the work efficiency to a certain extent, it overcomes the challenge of multivariate data analysis and interpretation. There are still some limitations in information sharing, identification ability of data collection and matching, and efficiency of data processing. RL is defined as a new field of research, which is used as a learning tool that can be combined with braiding driven data. The use of RL can help to braiding drive data for data preprocessing to ensure that the error value of data is reduced, and provide a new way for the compilation of drive data processing. Simeone Osvaldo believed that RL, especially its deep learning subfield, has made many amazing advances in recent years, given the unprecedented availability of data and computing resources. There is widespread renewed interest in applying data-driven RL methods to address the problem of developing traditional engineering solutions challenged by modelling or algorithmic flaws [6]. Botu Leon believed that scale RL represented a unique environment. In such an environment, the Stochastic gradient (SG) method plays a central role, while traditional gradient-based nonlinear optimization techniques often have problems, and he emphasizes the opportunity to design algorithms with improved performance [7]. Aydemir Salih Berkan believed that the overlearning algorithm of RL in prediction problems can not only work quickly, but also have low error value [8]. Handelman G. S proposed that RL is an emerging field in medicine, and its vast resources are being used to fuse computer science and statistics into medical problems. Proponents of RL also praise its ability to handle large, complex, and disparate data [9]. Abbasi Bardia believed that RL, using statistical and computer science principles, can be used to develop algorithms that can improve performance by interpreting data rather than by explicit instructions [10]. With the increase of data volume, the traditional weaving-driven data processing technology may become inefficient and unable to process large-scale and high-dimensional data in a reasonable time, which limits the real-time performance and processing speed. RL can understand the relationships and patterns between data, helping to braiding drive data processing technology to process information quickly. However, no scholars have proposed to combine RL with braiding drive data to achieve the purpose of obtaining data quickly and accurately.
Braiding driven data is the key to modern data management and integration, which provides cross-platform and flexible data source integration for business users. It makes the data available wherever it is needed, regardless of where it is located. This is an important development direction for the future, and this new mode of working requires new infrastructure to be fully effective. RL is a great tool for looking at the links between data and making improvements in ways that allow computers to be autonomous, which can help build data-centric innovation platforms. It helps braiding drive data to accurately target, quickly collect, extract, transform, and analyze data, and extract real value from the data. RL is a tool that can be used to enhance human problem-solving to more quickly highlight or find patterns in other data that humans might have missed. It is also not up to standard in information sharing, which is easy to cause data information to be blocked and unable to circulate, resulting in low efficiency of data processing [11]. RL can be introduced into traditional data processing methods as a tool, using RL to predict future problems, important data can be accurately captured and data collection can be carried out. The acquisition data can be preprocessed effectively, so as to improve the recognition ability of data acquisition and matching. It can strengthen the sharing of data information and improve the processing efficiency of braiding drive data processing system.
The combination of RL and braiding drive data processing solves the limitation that traditional drive data processing can not quickly collect and preprocess data. While ensuring the rapid processing of data, it also ensures the accuracy of data and improves the efficiency of data processing. In order to understand whether braiding drive data processing by RL can effectively solve the problem of traditional data-driven blowing technology, this paper examines the performance of compiled drive data processing. The results show that the braiding drive data processing method can improve the accuracy of data processing, strengthen the ability of data acquisition and matching, and improve the efficiency of data processing. The innovation of this paper lies in the application of reinforcement learning in mechanical learning to the data processing of weaving drive, which solves a series of problems faced by traditional data processing methods, including data integrity, nonlinear relationship processing, information sharing, data acquisition and matching recognition ability and data processing efficiency.
Preparing the driving data processing process
With the continuous advancement of global digitalization, data sources and data volumes are also increasing, so data and application silos have proliferate in the past few years, which precisely proves that traditional data-driven data can no longer meet people’s current needs. In order to solve this problem, this paper introduces RL into braiding drive data processing technology and uses data acquisition method to collect high quality data. It uses the method of data preprocessing to clean, transform and organize the data sources collected in the early stage in order to further improve the data quality. Finally, this paper uses the method of data prediction to improve the speed and accuracy of data, so as to meet the needs of modern data [12, 13].
Data collection
The forms of data are various, such as text, pictures, audio and video, etc. With the progress of science and technology, the world has ushered in the digital age. The digital age is actually synonymous with the electronic information age, because all the machine language of electronic information is represented by numbers [14]. This paper holds that if the information can be extracted and used effectively, it would bring great energy to people’s life and work.
Data acquisition process.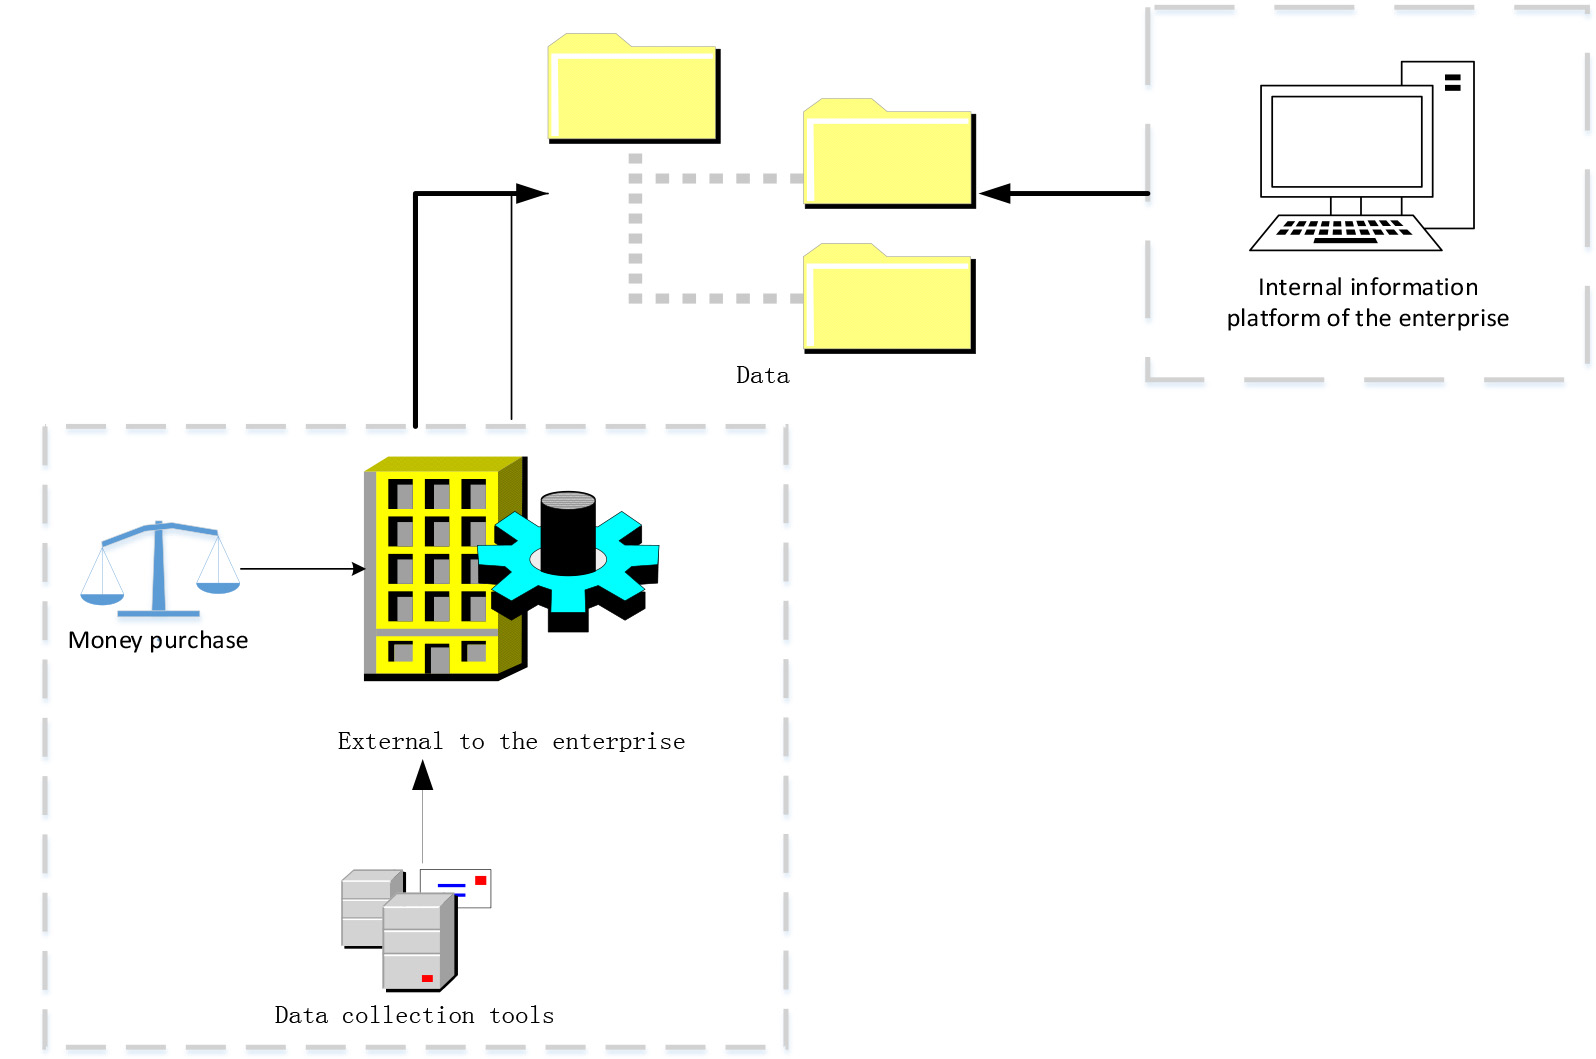
Braiding data drive can link various resources. In this paper, data collection would be carried out through data sources such as database, data lake, BI (Business Intelligence), application system or document. The collected data sources come from both internal and external enterprises, as shown in Fig. 1.
In Fig. 1, data acquisition within the enterprise can be directly obtained through the data shared by the system platform. The acquisition of data by external aspects of the enterprise can be completed by money purchase or through various data acquisition tools. External data collection and internal data collection are carried out together to complete the data collection work.
Traditional data-driven technology cannot analyze and collect data sources well. This paper introduces RL as a tool into the traditional drive data processing technology, which makes the existing data acquisition have advantages different from the traditional data acquisition. It makes the existing data acquisition method have more advantages that the traditional data acquisition method does not have, and improves the comprehensiveness, multi-dimension and high efficiency of data acquisition [15]. This change makes data collection as the first step of data security construction and plays an important role in realizing data security management.
Data preprocessing flow chart.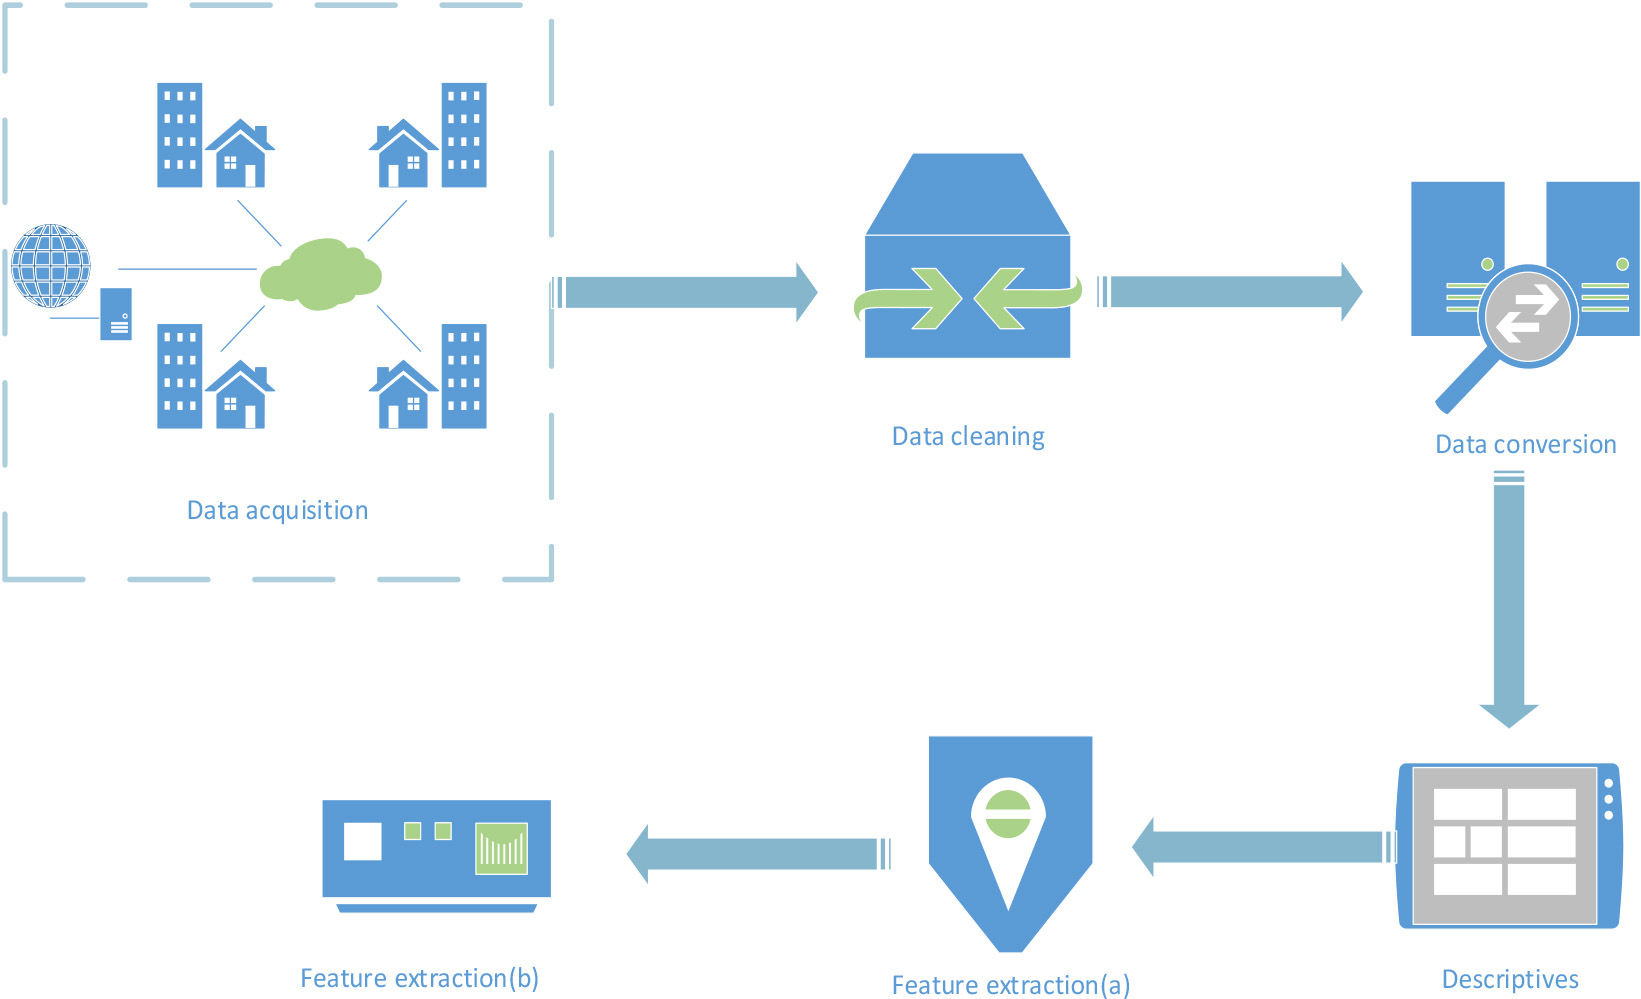
The data collected by the previous data acquisition method can not be directly used, and there are still some problems, which need to go through data preprocessing. In the following, five methods of data preprocessing, namely data cleaning, data conversion, data description and feature extraction, are adopted, because they have corresponding targeted theories and technologies. The data problems existing in the data sources after data collection can be improved to improve the data quality, so that the subsequent data can be better analyzed, as shown in Fig. 2. The following would adopt the data preprocessing method to realize the data cleaning, data integration, data transformation, data protocol and other basic functions of the data source. Next, it can extract some attributes that have an important impact on the target output from a large number of data attributes collected in the early stage, reduce the dimension of the source data, and carry out operations such as type conversion. This can provide clean, accurate and more targeted data for data mining algorithms, thus reducing the amount of data processing for mining algorithms. Improving the quality of data through data-driven processing can effectively improve the mining efficiency in data preprocessing.
In Fig. 2, before data preprocessing, data should first be collected from internal or external aspects of the enterprise; the collected data sources should be simply sorted out, and then data preprocessing can be carried out. The first part is to clean the data source of data collection to avoid error information in the data source. The second part is the data transformation of the correct data source after data cleaning, so that different data types can be comparable. The third part is the data description of the data source, which is generally the visualization of the data source. The fourth part (Feature extraction(a)) is to extract the features of the data source after visualization, and select the most relevant attributes with data feature selection to reduce the difficulty of the problem. After the previous four parts, the last part of Feature extraction(b) should be carried out on the data source.
This paper finds that most of the data sources collected after data collection by specific tools are “dirty”. This “dirty” does not refer to the “dirty” in the daily mouth, but specifically refers to the data collected by data collection may have problems [16]. In order to solve these problems, this paper decides to clean the data information after data collection.
In order to effectively solve the problem of “dirty” data, this paper implements data cleaning in the data preprocessing stage. This method needs to deal with missing data, outliers and duplicate data in the data cleaning stage. If the missing data in the data source is relatively small, these records can be deleted directly, or the data can be filled by re-collecting the data, or based on domain knowledge, or automatically filled. In order to solve the situation that there are duplicate value records in the data source, the exact same records would be de-duplicated, or some key features of the data would be de-duplicated. In order to solve the problem of missing data, statistical methods, interpolation methods and model-based methods can be used to fill in the true data. In order to solve the problem of data errors, an anomaly detection algorithm can be used to identify and correct the wrong data.
By cleaning the data source, the problems of duplicate, missing and wrong values in the data source can be effectively solved. This can make the data source obtained by using data acquisition more accurate, thereby improving the quality of the data, so that the data can be used and adopted, and provide a more reliable data basis for subsequent data analysis and modeling.
Data conversion
After the data source goes through the data cleaning stage, the data set can be basically obtained without errors [17]. In order to further summarize and organize the data set better, this paper carries out data transformation for the data preprocessing stage. Data conversion is the process of converting data from one form of representation to another. Specifically, the methods of data conversion include data type conversion, data semantic conversion, data range conversion, data granularity conversion, table/data splitting, column conversion and so on. In this paper, data sampling processing, data type conversion and data normalization would be carried out in the data conversion stage.
In this paper, sampling, type conversion and data normalization are used for data conversion in the data preprocessing stage. The types of data can be divided into numeric and non-numeric types. For non-numerical types, category conversion can be performed, that is, non-numerical types can be converted to numerical types, so as to facilitate subsequent processing by RL algorithms [18].
Data transformation is the process of merging, cleaning and integrating data, transforming from one form of representation to another, and maintaining semantic consistency between different source data. By using the method of data transformation, the data can be transformed into a more suitable form for subsequent analysis and modeling, so as to effectively improve the data processing efficiency and model performance.
Data description
In the data preprocessing stage, after data conversion processing, descriptive analysis and statistics of data collection should be carried out. Descriptive statistical analysis is the basis of any data analysis, which is to reduce a series of complex data to a few representative numbers. These numbers can represent the whole. In popular terms, they are used to describe the characteristics of some data quantitatively, which can help understand the overall characteristics of the data and provide the basis for subsequent data analysis and modeling. Because descriptive analysis can be used to describe the overall situation of quantitative data, preliminary analysis of each index of the sample is carried out to understand the characteristics of the overall palm sample, so it can be used in the data processing stage.
The general descriptions of the data are minimum, maximum, mean, standard deviation, median, 25 score, 75 score, quartile, variance, standard error. As a simple example, suppose there is a set of age data: 25, 30, 35, 40, 45, 30, 35, 40, 50, 55, 60, 35, 40, 45, 50, then descriptive statistics of minimum, maximum, mean, standard deviation, median, 25 score, 75 score, quartile, variance, and standard error can be calculated. Descriptive statistical results were obtained for this group of age data, as shown in Table 1.
In Table 1, the following descriptive statistical results can be obtained for this set of age data. The minimum value is 25; the maximum is 60; the mean is 41; the standard deviation is 9.86; the median is 40; the 25 score is 35; the 75 score is 50; the quartile is 15; the variance is 97.14, and the standard error is 2.54. The minimum value is the minimum value of the exponential data; average value is the most commonly used index in daily life, which is used to measure the average level of the whole population and can reflect the central trend of data. Standard deviation is used to measure the fluctuation size of data (also can be said to measure the degree of dispersion and variability of data); the median is the middle value of the ascending order of the sample data. There are two applications of the quartile: (1) by comparing the overall situation of different categories of data sets, it can be seen that the quartile can reflect the distribution state of the data as a whole better than the average; (2) possible outliers and variances can be identified to calculate the difference between each variable (observed value) and the overall mean; the standard deviation of standard error to sample homogeneous can reflect the dispersion trend of sample data.
Description of common descriptive indicators and statistical results
Description of common descriptive indicators and statistical results
In this paper, the maximum and minimum values obtained in the descriptive statistical analysis of the data would be used to test whether there are abnormal conditions in the data. The mean and median can be used to describe the central trend indicators of the data. Standard deviation is a discrete trend indicator used to describe the data.
By calculating these descriptive statistics and visualizing the data (such as histograms, box plots, scatter plots, etc.), the distribution, trend and relationship of the data can be intuitively understood, thus providing valuable information for subsequent data analysis and modeling.
The data features used are numerical features, and the minimum, maximum, average, standard deviation, median, 25th percentile, 75th percentile, quartile, variance and standard deviation of the data are obtained by statistical methods.
After the three stages of data cleaning, data transformation and data description, the data is more accurate. In order to transform the raw data into a representation more suitable for subsequent analysis and modeling, feature extraction is performed on the data source. When doing a particular analysis, there may be many attributes, but some attributes are irrelevant and some attributes are repeated. In order to improve the fitting ability of complex relationships, some discrete features can be combined in pairs to form higher-order features in feature engineering. So people need to use feature selection to pick out the most relevant attributes to reduce the difficulty of the problem.
Using Z-score standardization to standardize numerical features to the same scale helps to avoid unreasonable influence of some features on the model. Combine the original features and create new features to better capture the complex relationship between data. Principal component analysis retains the most important features and reduces the data dimension.
Predictive modeling method of multiple linear regression in RL
This paper refers to the predictive modeling method of multiple linear regression, which can solve the problem of traditional braiding driven data [19]. Suppose the sample point capacity is n, the dependent variable at time
If
are denoted, the cross product matrix
The least squares estimator of regression coefficient
It can also be proved that the
The goodness of fit (adjusted complex determination coefficient) at time
At the same time, the estimated standard error with time
According to the key techniques introduced above, the predictive modeling method of multiple linear regression is given below.
Calculate Calculate the eigenvalue According to the eigenvector matrix of the cross product matrix Quantity matrix According to the eigenvalues of the cross product According to the calculation results of the above two steps, the cross product matrix
According to Eq. (3), the estimator of the regression parameter at time According to Eqs (4)
Data preprocessing is the first and most important step to build a RL model, which plays a decisive role in the final result. If the data set is not cleaned and preprocessed, then the model is likely to be ineffective.
In order to test whether the application of RL as A tool in braiding drive data processing can solve the problems of poor data consistency and timeliness, low information sharing, low data processing efficiency and large information repeatability of traditional drive data processing, five companies A, B, C, D and E are selected for trial. It would record the performance state during trial, so as to provide experimental basis for RL as a learning tool to effectively improve the efficiency of traditional driven data processing.
Analysis of existing data processing status of each company
Analysis of existing data processing status of each company
This paper first analyzes the current data processing status of A, B, C, D and E companies. The questionnaire survey method was adopted to investigate the current internal data management status of the company, and the use of internal employees was questioned, as shown in Table 2.
In Table 2, employees of companies A, B, C, D and E believe that there are problems in internal data management such as poor data consistency and timeliness, low information sharing, low data processing efficiency and large information repeatability. In order to test whether the combination of RL and compilation-driven data processing can solve the above problems, this paper examined four aspects: data integrity, recognition rate of data acquisition and matching, information sharing, and data processing efficiency.
Data integrity analysis. A. Braiding driven data processing for data integrity analysis; B. Traditional data processing for data integrity analysis.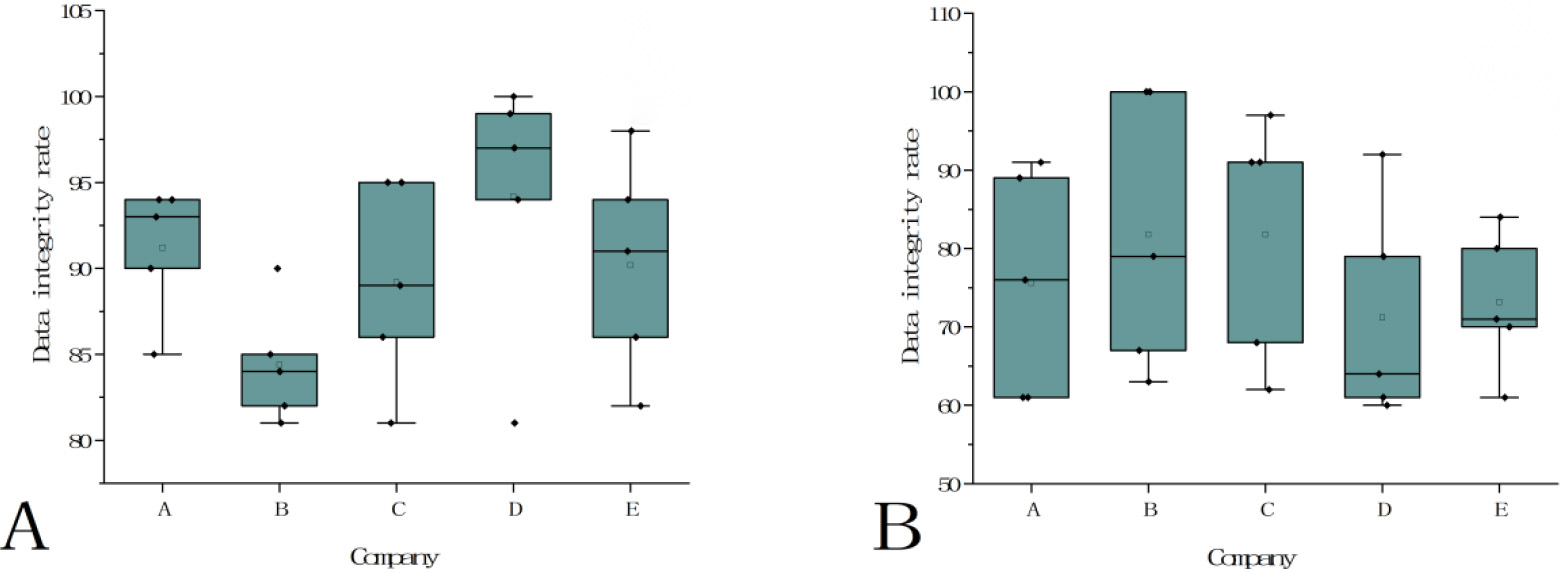
Data integrity is an important test standard in braid driven data processing, especially in data analysis, decision and application, data integrity is very important to ensure the quality and credibility of data. Therefore, this paper analyzes the data integrity of braiding driven data processing. Each company is divided into five groups of data for testing, and the analysis results are shown in Fig. 3.
In Figs 3A and 3B, X axis represents each company, and Y axis represents the data integrity rate. According to Fig. 3A, the data integrity rate intervals of five groups of data tested by companies A, B, C, D and E using braiding driven data processing can be seen. It was generally distributed in the 80%-100% range, with a maximum of 100% and a minimum of 81%. In Fig. 3B, data integrity rate intervals of five groups of data tested by five companies A, B, C, D and E using traditional data processing were shown. The data integrity rate of traditional data processing ranged from 60% to 100%, with the highest reaching 100% and the lowest only 60%. According to the results of integrity analysis in Fig. 3A and Fig. 3B, it can be seen that traditional data processing has a significant impact on data processing. The fluctuation range of data integrity rate is large, and the integrity rate of data processing is high without compilation of driving data.
Investigation and analysis of data acquisition and matching. A. Traditionally driven data processing score; B. Braiding drive data processing scoring.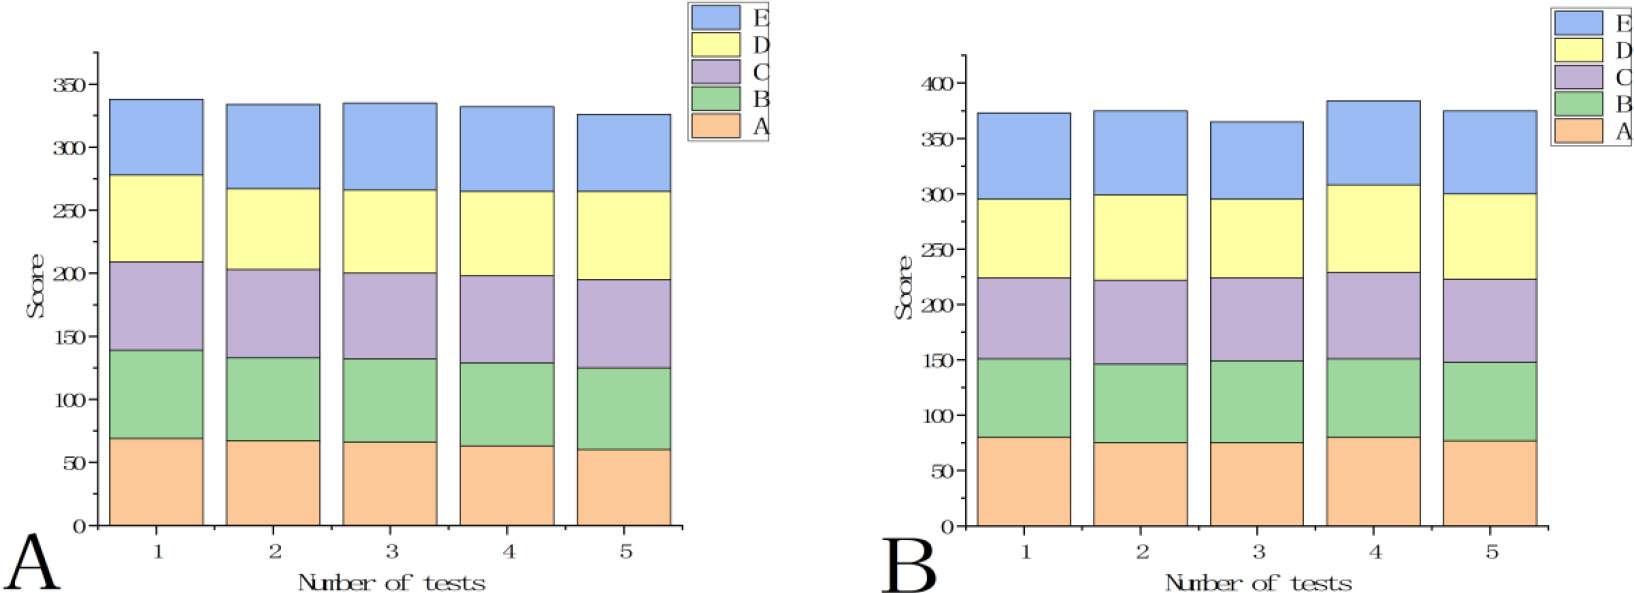
Data collection and matching are the two most important steps in the process of data analysis. Only when these two steps are relative to each other and meet the needs of consistency, can the data processing program continue to run. Therefore, this paper analyzes the data collection and matching aspects of compiling driven data processing. Five companies, A, B, C, D and E, scored traditional driven data processing and braiding driven data processing, as shown in Fig. 4.
In Fig. 4A and Fig. 4B, X axis represents the number of tests, Y axis represents the score, and legend A, B, C, D and E represent the five companies participating in the test. In Fig. 4A, the total score of the first five companies was 337; the second five companies was 333; the third five companies was 334; the fourth five companies was 332; the fifth five companies was 325, and the average score of the five times was 332.2. In Fig. 4B, the total score of the first five companies was 374; the second five companies was 375; the third five companies was 373; the fourth five companies was 377; the fifth five companies was 375, and the average score of the five times was 374.8. It can be seen from Fig. 4A and Fig. 4B that the scores of five companies on compilation-driven data processing are higher than those on traditional data-driven processing, indicating that the braiding drive is more accurate in identifying data. Compared with traditional compilation-driven data processing technology, it has a great improvement and is more sensitive to data capture.
Compilation of statistics of analysis results driving information sharing in data systems. A. Scatter plot of information sharing analysis of each company on the compilation drive system; B. Analysis results of information sharing mean value of braiding drive data system by each company.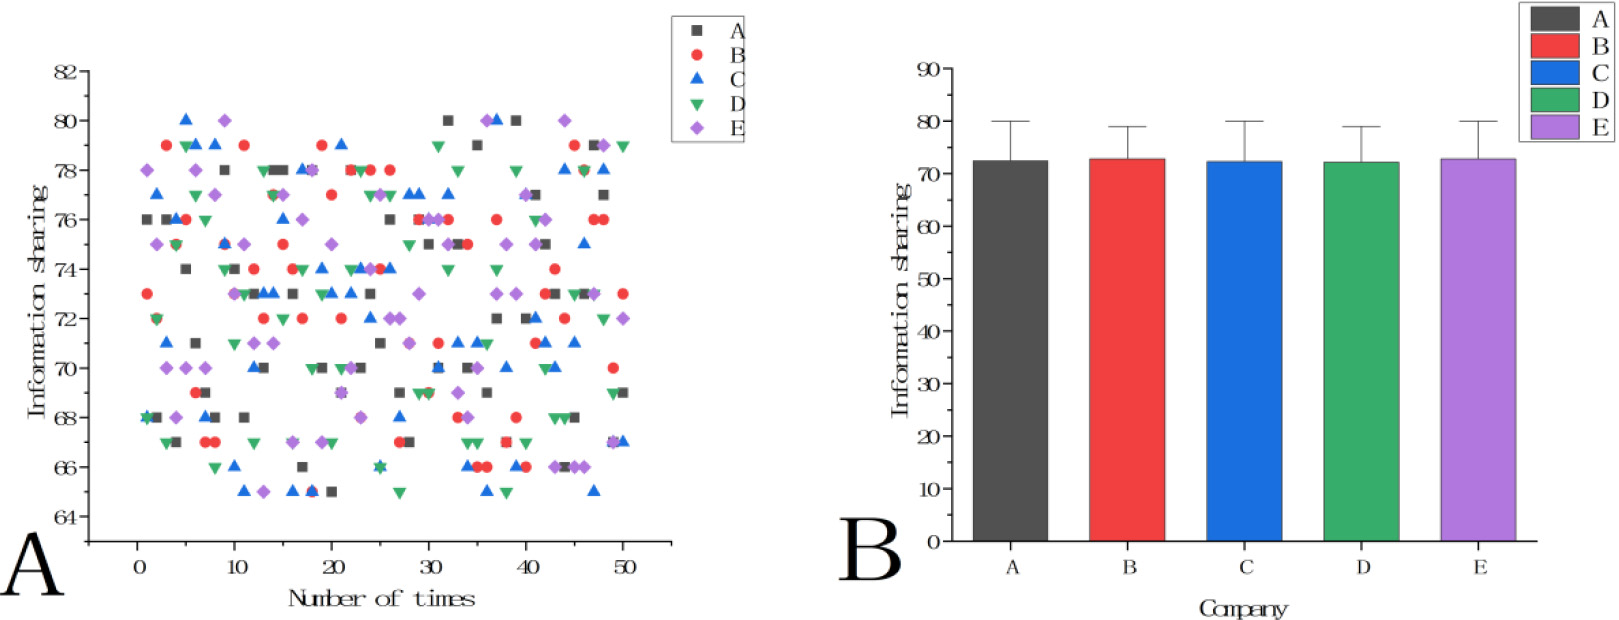
Information sharing is a very important part of braiding drive data processing system. Only by realizing information mutual transmission and sharing can data be applied more efficiently and processed properly. In order to better test the application of braiding drive data processing in information sharing, this paper analyzes the sharing of the data compilation drive system according to the test results, and records the results, as shown in Fig. 5.
In Fig. 5A, the X axis represents the number of tests, and the Y axis represents the information sharing, which is mostly distributed between 64% and 82%. In Fig. 5B, X axis represents each company, Y axis represents information sharing, and the average value of information sharing is not less than 72%. It can be seen that the information sharing of braiding data-driven system through RL has been greatly improved, and the improvement of information sharing has brought great convenience to the data management of braiding data-driven data processing system. It can not only make the user of the system can reasonably manage the data, but also make the data quickly spread in the user enterprise, so as to improve the data management process and greatly improve the efficiency of data management.
Braiding driven data processing system attaches great importance to data processing efficiency. The efficiency of data processing affects the analysis of data and the utilization of data. The faster the system processes data, the more it can meet the needs of users for data analysis. With the development of science and technology, under the impact of big data, the faster the speed of data processing, the more enterprises can quickly acquire data and analyze the data, so as to gain a dominant position in business competition, so as to expand their own influence. Therefore, this paper tests the data processing speed to check whether the system can meet the current requirements, as shown in Fig. 6.
Survey results of data processing efficiency of traditional drive data processing system and compilation drive data processing system. A. Five test results of traditional drive data processing system and compilation drive data processing system; B. Comparison of average data processing efficiency between traditional driven data processing system and authentically driven data processing system.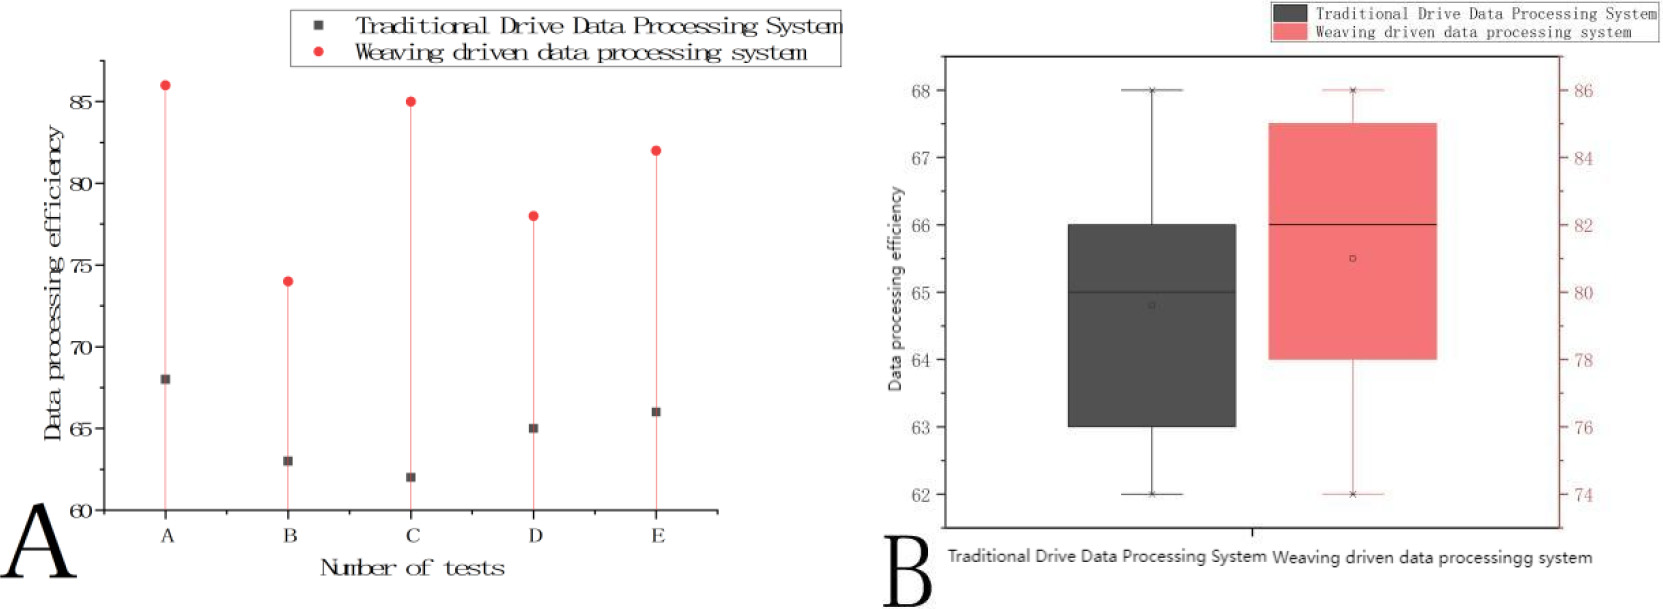
In Fig. 6A, x axis represents five tests A, B, C, D and E, and Y axis represents data processing efficiency. The figure shows the data processing efficiency of the traditional drive data processing system and the compilation drive data processing system respectively. The data processing efficiency of the traditional drive data processing system was as high as 68%, as low as 62%, and neither of them exceeded 70%. The data processing efficiency of braiding drive data processing system was as high as 86% and as low as 74%. In Fig. 6B, Y-axis represents data processing efficiency, and the data processing efficiency of traditional drive data processing system is significantly lower than that of braiding drive data processing system. The median value of data processing efficiency of the compilation driven data processing system is obviously higher than that of the traditional data-driven data processing system. It can be clearly seen from Fig. 6A and Fig. 6B that the braiding drive data processing system has a significantly higher data processing efficiency than the traditional drive data processing system, which can process and analyze data at a faster speed and expand the competitive advantage of enterprises.
The RL is used to process the braiding drive data, which strengthens the sensitivity of the braiding drive system to the data, enables the system to collect the required data more comprehensively, and preprocess the data quickly. It strengthens the data sharing in the internal platform, makes it easier to collect and organize the data in the early stage, and also strengthens the recognition rate of data collection and matching, ensuring the correctness of the data. The addition of RL method to the compilation of driven data processing system provides substantial help to enterprises and meets the needs of users. This can enable enterprises to seize important data faster in the data war, seize the opportunity, so as to gain an advantageous position in business competition and expand corporate influence.
Braiding driven data is a complex collection of data made up of multiple related data sources because it contains information from different data sources and may involve complex relationships between multiple factors and variables. However, traditional data processing methods often oversimplify this complexity and thus fail to handle this information well. At the same time, the traditional data processing method is difficult to make full use of the potential of braiding driven data, and can not deal with the nonlinear relationship and high dimensional characteristics. RL is a subdiscipline of artificial intelligence, which studies the basic algorithms, principles and thought methods in the field of artificial intelligence. The content of RL research would be used in other subdisciplines. Because RL is based on algorithms that can learn from data without relying on rule-based programming, the science can let computers take actions without being explicitly programmed. In order to solve the problem of traditional compilation-driven data processing system, this paper combines RL with compilation-driven data. It uses RL to make traditional data processing technology better and faster to solve the complex relationship between multiple factors and variables involved in data, so that the potential of braiding driven data can be fully utilized and developed.
In order to understand whether braiding drive data processing through RL brings good changes compared with traditional data processing technology, and whether it can solve the drawbacks of traditional drive data processing technology, this paper conducts some experiments to test. In this paper, integrity, identification ability of data collection and matching, information sharing and data processing efficiency are tested. The integrity of the braiding drive data system can be as low as 81% and as high as 100%, which is much higher than the traditional drive data processing system. In terms of information sharing, most of the information sharing is distributed between 64% and 82%, and the average is no less than 72%. Compared with the traditional drive data processing system, the information sharing has also been greatly improved. In terms of the data processing efficiency of the system, the data processing efficiency of the braiding drive data processing system is up to 86% and down to 74%. The maximum data processing efficiency of the traditional drive data processing system is 68%, and the minimum is 62%, which does not exceed 70%, so the braiding drive data processing system is also much higher than the traditional drive data processing system in terms of data processing efficiency.
To sum up, braiding drive data processing through RL can effectively change the traditional drive data processing, which is difficult to start with complex data sets, and the potential of braiding drive data can be fully tapped and utilized. It solves the problems of poor data integrity, low recognition rate, low information sharing and low data processing efficiency of the traditional drive data processing system, so that the braiding drive data can be optimized and improved under the impact of big data. It can help users grasp the main data faster, and analyze the data, so that the data management process tends to be perfect, and greatly improve the efficiency of data management.
Conclusions
Braiding driven data is a complex collection of data composed of multiple related data sources. Because braiding data drives can link a variety of resources, the type of data acquisition from a data source can be a database, data lake, BI (Business Intelligence), application system, or document. This data can come from within or outside the enterprise, so braiding drive data can involve complex relationships between multiple factors and variables. Traditional data processing methods often oversimplify this complexity of data. It can not deal well with braiding drive data, it can not deal well with nonlinear relations and high dimensional features. Therefore, the traditional data processing methods lack high integrity of data, identification ability of data collection and matching, and are not up to standard in information sharing, which is easy to cause data information blocked and unable to flow, resulting in low data processing efficiency.
RL is a tool that can be used to enhance the human ability to solve problems and make intelligent inferences from a wide range of problems, thus helping people to come up with a solution to a certain problem. At the same time, RL is the science of making computers take actions without being explicitly programmed, allowing them to learn some tricks on their own. Because they have all the processing power, they can more quickly highlight or find patterns in other data that humans might have missed. The application of RL improves the accuracy of data processing of knitting drive. Through the reinforcement learning method, data collection, matching and preprocessing can be carried out more accurately, and at the same time, the overall data processing efficiency can be improved, and large-scale and high-dimensional data can be dealt with more quickly.
Traditional data processing methods lack high integrity of data, identification ability of data collection and matching, and are not up to standard in information sharing, which is easy to cause data information blocked and unable to circulate. This can lead to inefficient data processing. This paper introduced RL as a tool to traditional data processing methods. It can use RL to predict future problems, accurately grasp important data, and carry out data collection, and carry out effective data preprocessing for the collected data. This can improve the identification ability of data acquisition and matching, strengthen the sharing of data information, and improve the data processing efficiency of braiding drive data processing system. However, the data types collected in this study are not comprehensive enough. For future work, we can consider using more extensive and diverse data sets to verify and expand the research results.
Data availability statement
Data is available upon reasonable request.
Funding statement
No funding were used to support this study.
Footnotes
Conflict of interest
The authors have stated explicitly that there are no conflicts of interest in connection with this article.