
Abstract
At present, motorcycles are mainly tested on the road with real drivers. In the course of shifting the scope of testing from the road to complete vehicle test rigs, the driving task of longitudinal dynamics is also being shifted to the test rig. The claim is that the real driving task will be reproduced with comparable characteristics on the test bench. The state of the art knows the description of the temporal actuation sequence of gearshifts primarily from the passenger car sector, which usually takes place according to optimal criteria such as comfort or sportiness. Actual and sometimes non-optimal driver inputs are thus not taken into account and may well deviate from the definition of “optimal” gear changes. With our method, it should be possible to parameterize a variable model for shifting operations by feature extraction and an evaluation environment to describe varying driver characteristics in reality. The gearshift model comprises activation and deactivation curves for three actuators. To parameterize the model, the necessary data are collected in a pilot study. The data are fed into the evaluation method, with initial trends being derived through exploratory data analysis. This will be used to derive parameter sets for real driving situations. The evaluation shows that the underlying model for the description of shifting processes is suitable for describing real shifting processes sufficiently accurately with few features. After the feature analysis, there are clear trends for the actuation of the clutch and throttle grip for the use in test rig environments. In summary, our method enables a real impact on the human-machine interfaces by driver inputs as on the road, even in test bench operation. In the future, driving robots of test benches can be parameterized with the presented feature sets, thus ensuring the transferability of real driving maneuvers to test benches.
Introduction and state of research
In the automotive industry, an ever-increasing demand for testing methods can be perceived. However, there is not only demand for simulative testing methods but also testing the real vehicle properties at the end of the development process. For this purpose either real riding maneuvers or test rig maneuvers can be used. On the test rig, usually the environment and the rider itself have to be simulated. With this research, the focus is on a rider model that is able to synthetically reproduce even non-optimal rider actuations to match realistic testing conditions on test rigs. For now, it is favored modeling shift processes during normal riding. Thus, the modeling of start-up processes is excluded in this paper.
Motorcycle rider robots
Conventionally, a motorcycle drivetrain comprises an internal combustion engine, clutch, gearbox, and final drive thus delivering force to the wheel and tire to drive the vehicle. Usually, the gearbox is manual and shifted in a sequential manner with the following gear sequence: 1-N-2-3-4-5-6. 1 To meet changing thrust demands by the rider, the gearbox has to be shifted through its gears, which normally happens through the motorcycle rider.2,3 The task of shifting the gearbox as well as applying the clutch and actuating the gas has to be fulfilled by a motorcycle rider robot (MRR) when operating the vehicle on an unmanned test rig. Paulweber and Lebert 4 (p. 312 et al.) call this kind of control type a “Road Load/Rider” as the test rig would control for road load and the vehicle under test is actuated by the “Rider,” whether a robot or real person.
There are only few known concepts of MRR but those should be examples of the actuation of the previously named interfaces to the vehicle’s drivetrain. A popular known provider for vehicle robot systems is Stähle GmbH, 5 which provide the SMC2000 MRR, see for example, SYMTEC Engineering. 6 This can be named a humanoid robot that sits on the motorcycle like a real rider does. Another rather similar example is described in a patent by YAMAHA, 7 detailing a robot and its control system to actually ride a motorcycle on closed roads.
Furthermore, various concepts can be found to automate manual motorcycle transmissions through constructing additional actuators to the interfaces, such as Lobonț et al. 8 and Patil and Wani. 9
OEM motorcycle shift automation
Different suppliers deliver control modules for motorcycle automatic transmissions, such as Continental 10 and Ricardo Motorcycles. 11 The goal of these modules is to automate the shift process of mechanical gearboxes with internal actuators, which are engineered during the development process of the vehicle. It should be highlighted that those recently emerging manually automated gearboxes and dual clutch gearboxes are not within the focus of this research. However, this work could also help during the parametrization of such advanced transmission systems. Domains like the optimization of drivability or transmission feel could profit from the objectified data like real driven gear shift durations or ability to transfer torque in the course of changing gears.
Quick shifter
An implementation of the so-called “Quick Shifter” assists the rider while shifting, making it possible to shift without clutch actuation by automatically interrupting injection and/or ignition for a short time during the shifting process, thus relieving the drive so that the gear change can take place. The traction interruption is extremely short and shifting is very fast and in the best case very comfortable. As usual, gear changes are performed manually by the driver using the foot control lever. A sensor in the shift linkage registers the shift request and provides the control signal for the engine electronics to interrupt injection and ignition. 1 (p. 278). For downshifts, rev-matching throttle commands can be implemented to reduce excitation due to the fast change in transmission ratio.
Motorcycle test rigs
Besides concepts for other R&D areas (e.g. vertical dynamics), the concept for roller test stands for longitudinal dynamics should be in the focus of this research work. Motorcycle test rigs for full vehicles are widely found in the motorcycle and tuning industry, while the state-of-the-art implementation is a tire-coupled drum test rig that is able to load the vehicle’s drive train through road load simulation. As a vehicle restraint system, a widely used clamping system of the front wheel is known. 4 New but very rare concepts feature two drums for the front and rear wheel. This demands a special fixture system to the vehicle structure to stabilize the normally unstable motorcycle while driving.
Gear shift modeling
As the closest related paper to current knowledge, the work of Kiran Wani can be mentioned. 12 In this research, a data collection system including different sensors is applied to a conventional motorcycle. This motivates the notion that through a custom fit data collection system valuable data can be collected to derive important driving parameters from them.
As the main basis for the presented approach of gear shift modeling, a state-based driver model such as described by Dolcini et al. 13 is used. As an addition, based on previous explorative sighting of the measurement data, it is proposed to use sigmoid-based activation and deactivation curves rather than linear functions. This aims to result in a more realistic reproduction of rider actuations and also leads to smooth actuator path planning for the development of a future MRR.
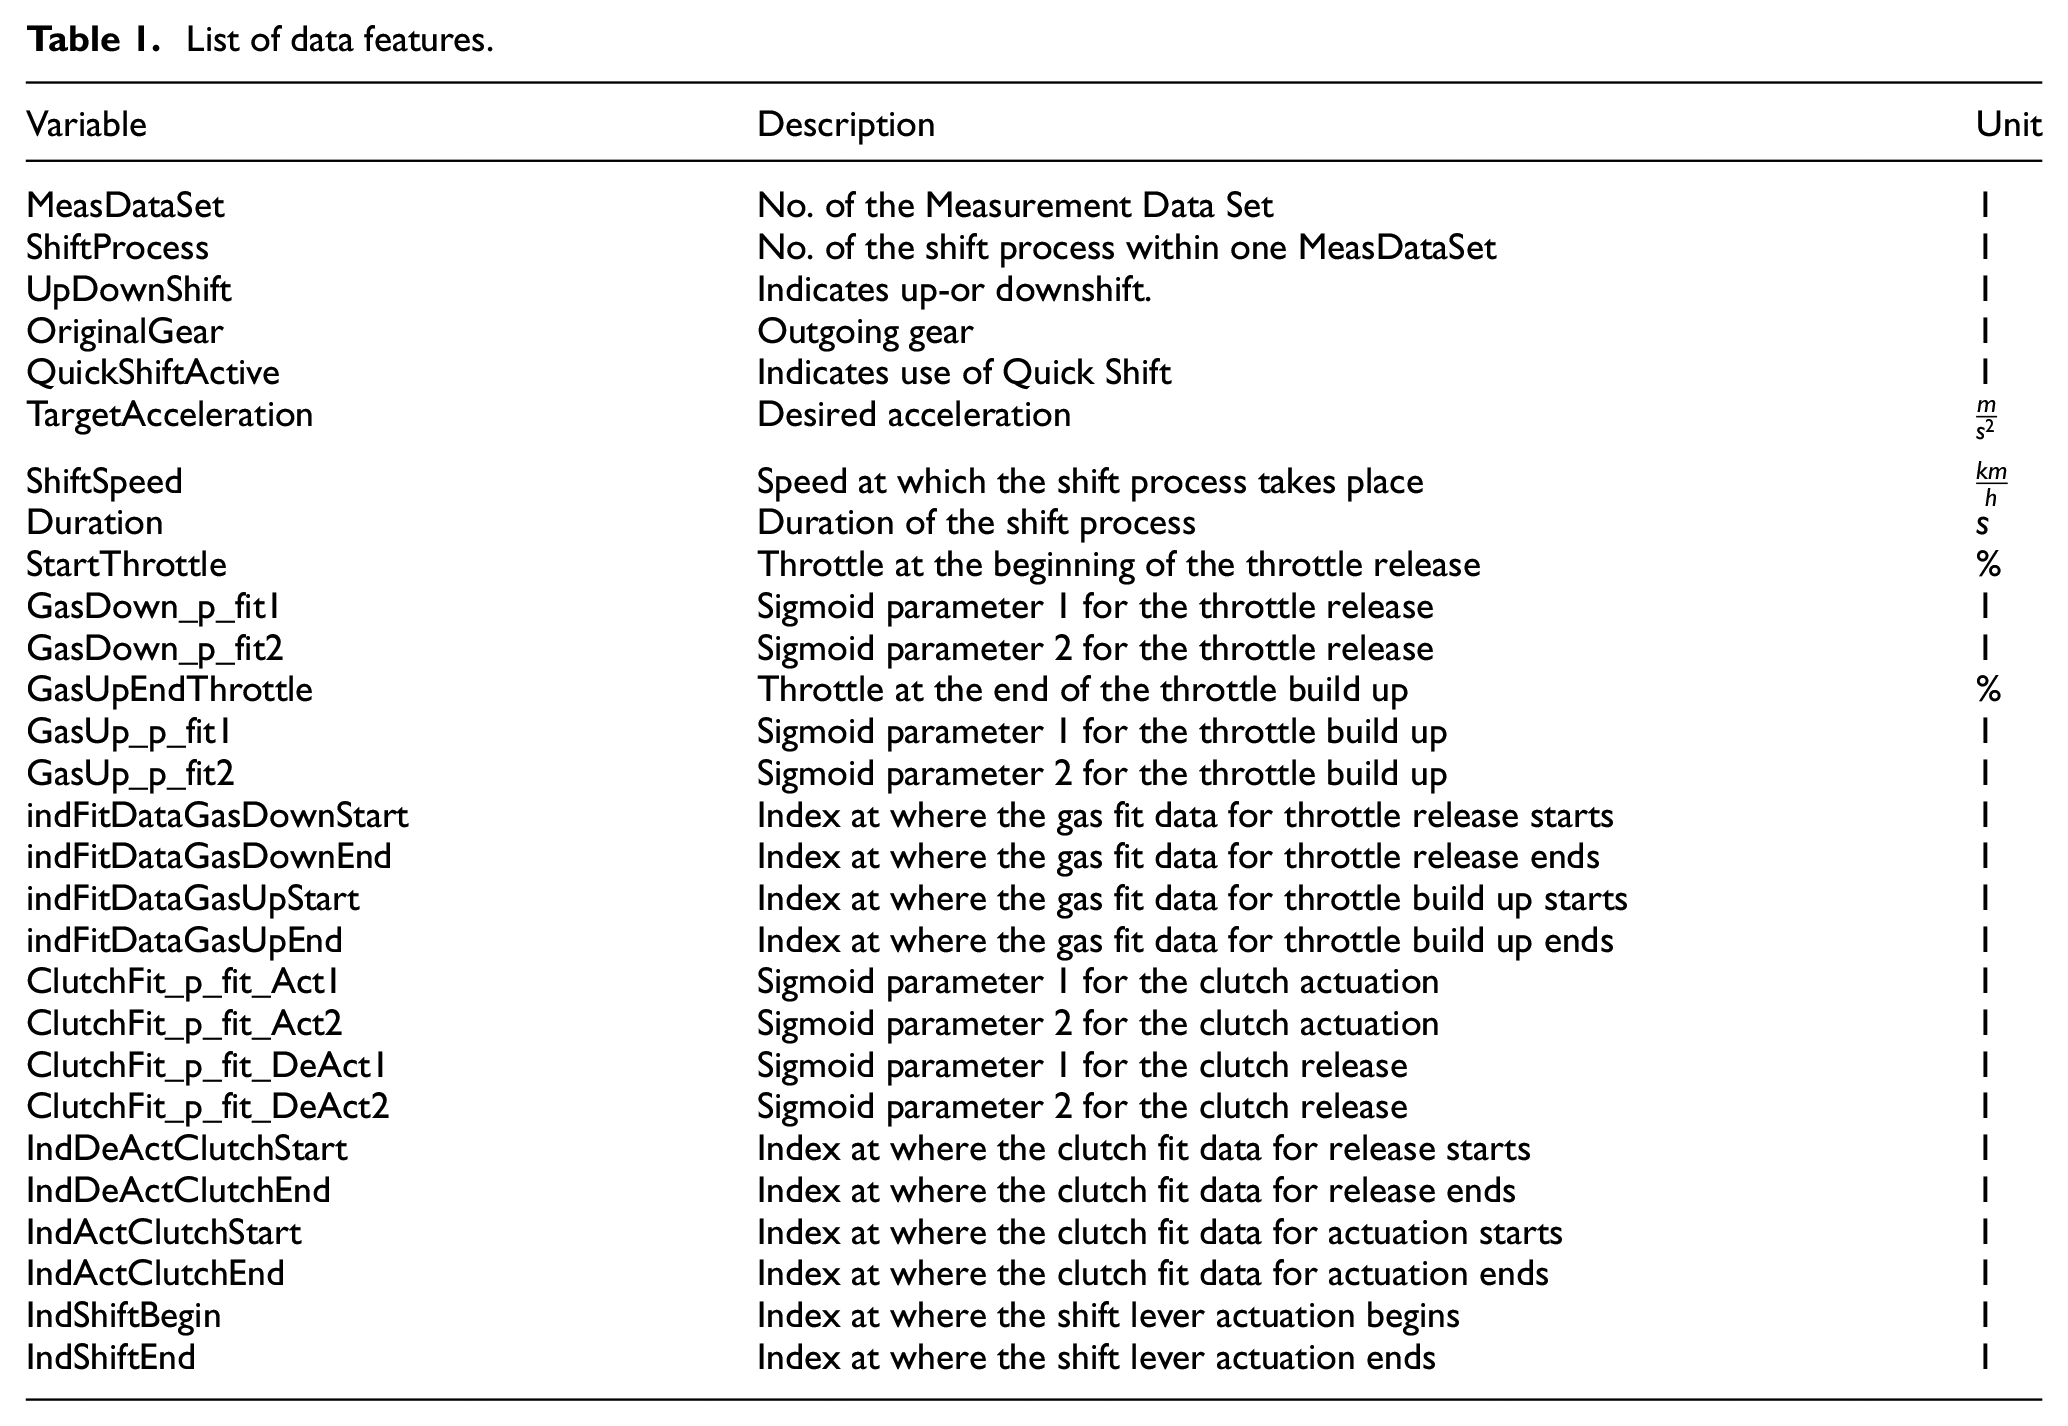
Figure 1 depicts the overall approach, describing a normal shift process while driving. Different models should apply when focusing on the start-up process. Regarding the throttle trajectory, two sigmoid functions are used: one for deactivation and the other for actuation of the throttle grip. After releasing the throttle grip, the clutch shall be activated by another sigmoid curve and held activated during shifting. After shifting, the clutch is released with the trajectory of a sigmoid function with its base being near the kisspoint value. After that, the clutch shall be released by a constant velocity curve to full deactivation. In parallel, the shift lever is actuated and deactuated during the clutch full opening time. All parameters of the state-based model are found with a brief introduction in Table 1.
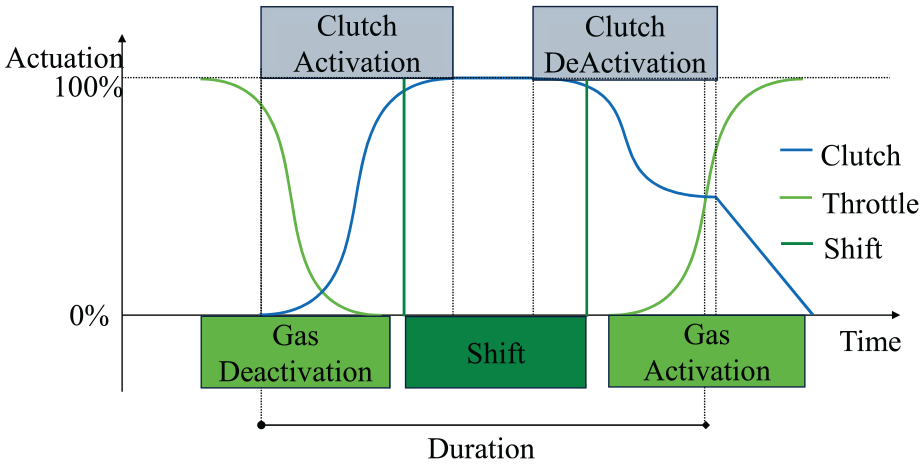
Model for shift, clutch, and throttle signal generation. Inspired by Dolcini et al. 13
List of data features.
Measurement method
The aim of the measurement method is to monitor all positions of the human-vehicle interface for riding the motorcycle in the matter of longitudinal dynamics. Braking is excluded for this work. This means that the throttle grip position, shift position, and clutch position have to be measured by either additional sensors or onboard sensors.
Additionally, the most important vehicle parameters such as vehicle position, orientation, and relevant drivetrain parameters are monitored.
Measurement system
Measurement system
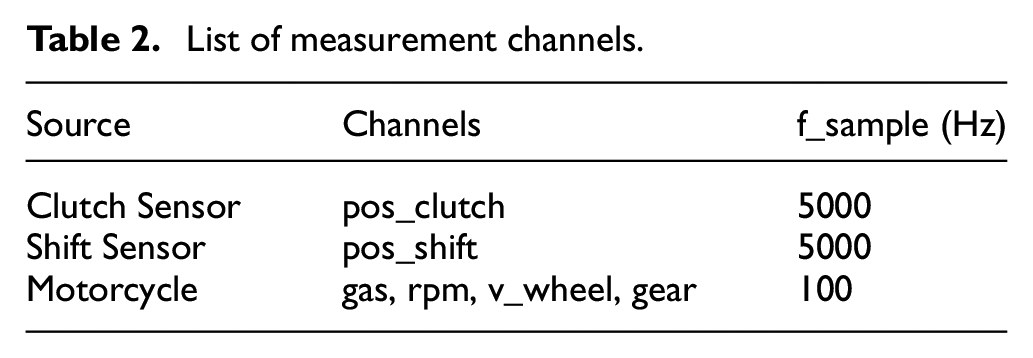
The measurement setup comprises all sensor channels described below, which are amplified and recorded in an imc CRONOSflex measurement system within the topcase of the OEM motorcycle luggage system. CRONOSflex can be configured in a modular manner in order to amplify diverse engineering signals. In this case, it was configured with a CRFX-2000G main module and a DCBC2-8 amplifier. The main module has a dual channel CAN-option on board. The measurement system is set to a recording rate of 5000 Hz including an Anti Aliasing Filter to ensure a high data rate, including for further investigations. Additionally, the provided channels are listed in Table 2.
List of measurement channels.
Clutch lever position
The measurement of the clutch lever position has to be implemented preferably without additional friction nor any obstruction of the lever to ensure further drivability. A common angular encoder (elobau, 424A10A—120B) was chosen in combination with a custom fit kinematic to transfer the clutch lever position to the sensor (cf. Figure 2 in the bottom right portion). The angular sensor position can then be linearized to output the actual hand translational position just in the middle of the lever by one-time offline calibration. The total resolution through all kinematics is indicated by 0.2 mm for the clutch lever position.
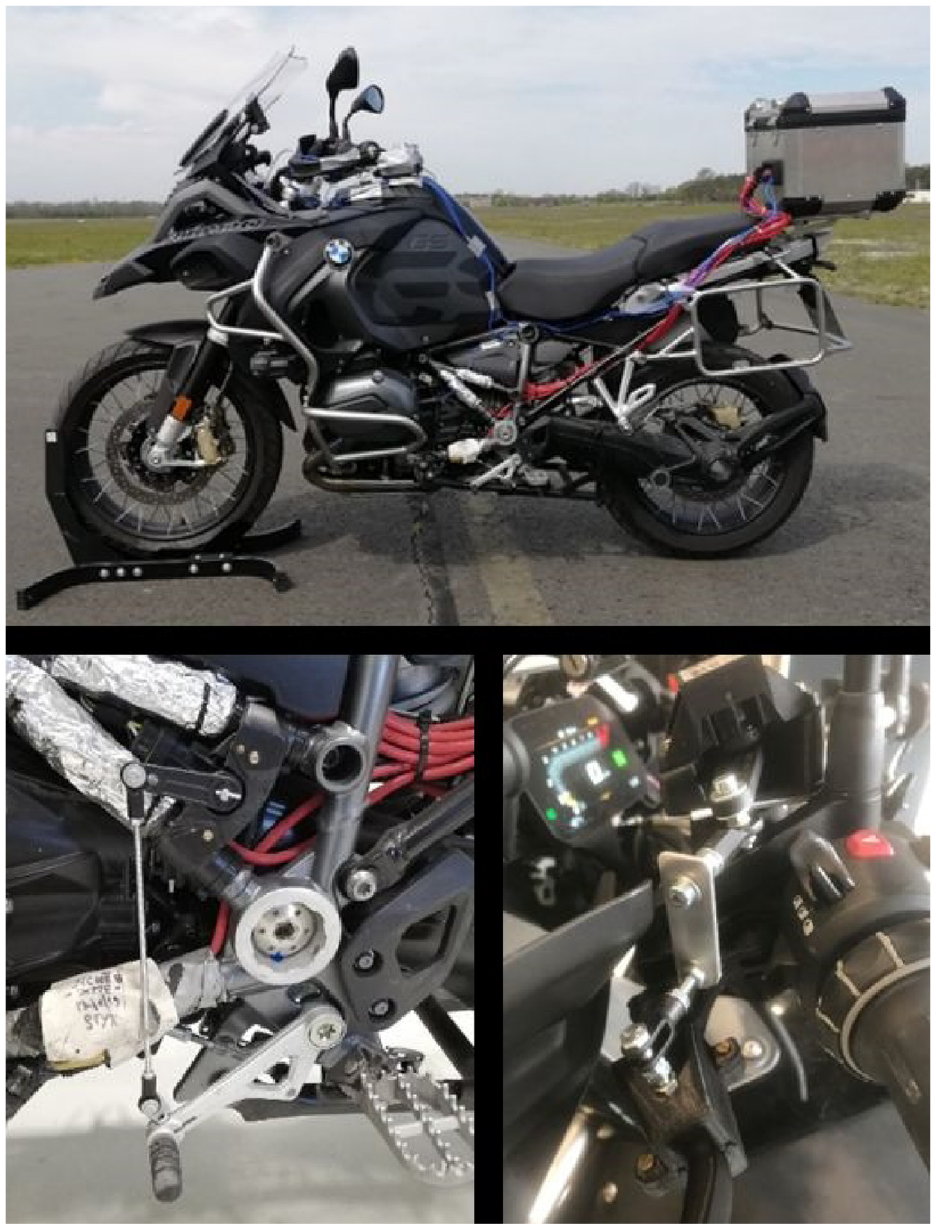
Measurement Motorcycle R1200GS (K51) with clutch lever and shift lever sensor.
Shift lever position
The shift lever position measurement is also asked to result in a linear position of the end part of the shift lever (rubber part). Therefore, it is favorable to mount the same angular encoder (cf. clutch lever position) in a tangential position to the lever. The same restrictions regarding drivability and durability apply here. Through rapid prototyping, a sensor bracket was designed to safely mount the sensor to the frame (cf. Figure 2 in the bottom left portion). The total resolution through all kinematics is indicated by 0.1 mm for the shift lever position. The actual selected gear can be recorded by the vehicle’s CAN-Bus system and shall not be monitored through the measurement configuration shown here.
Throttle grip position
The rotation of the driving value transmitter (“gas”) is monitored within the throttle-by-wire-system and can be recorded by the vehicle’s CAN-Bus system.
Driven roads
During the pilot study, a total of 250 km were recorded in the wider surroundings of Dresden, driven by a single person. All routes start and end at the same location at the TU Dresden campus and mainly of outside of the city.
Features and extraction
Mainly, combine shifting features with recent knowledge regarding research for automated shifting in motorcycles
14
are combined. Giani et al. present objective assessment parameters of the gear shift quality, which are used to estimate the parameters of real shift maneuvers from measured data. With some slight changes to the evaluation of the parameters, their duration index
Object-oriented evaluation environment
In order to structure the feature extraction process, an Objected Oriented Programming (OOP) MATLAB 15 script environment was developed. The structure contains the Study as top-level class that holds all single rides, called MeasDataSet. One MeasDataSet holds all gear shift events named ShiftProcess. Whereas the Study and MeasDataSet objects contain additional organizational data to the datasets, they are not further described. The descriptions in the following section focuses on the ShiftProcess objects.
Signal processing
After reading in the raw measurement data, different actions are applied for better data handling and usability. First, the gear selection number is recorded as a raw value from the engine control unit such that the correct values have to be assigned correctly.
Then, the channels from different timebases have to be edited to match a common timebase. It is proposed that 200 Hz is suitable for the application here. Therefore, oversampled channels are filtered (cf. Anti-Alias Filtering) and undersampled channels are sampled to the common sample frequency of 200 Hz. This results in a clean data-timetable with all datapoints ready for the following feature extraction.
Features for time trajectories
Shift lever actuation
In order to change the later discussed overall transmission ratio, the gearbox has to be actuated by the rider. The actuation of the shift lever is measured by the potentiometer and evaluated by thresholds for up- and downshift actuations. The thresholds are determined such that unwanted touches by the foot are omitted but wanted shift action can be detected. Threshold values chosen are
Change in transmission ratio
The task of a gearbox within a manual transmission driveline is to change the reduction ratio between the crankshaft and the wheels as the engine revolution speed range is limited.
13
The reduction ratio from engine speed to vehicle speed is called
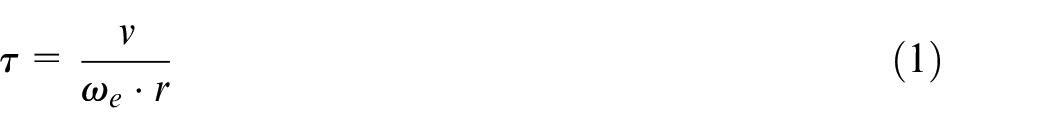
Corresponding to the findings of Giani et al.,
14
it is pointed out that
This shows that the end of a shift process can be calculated from the moment when the transmission ratio of an incoming gear is stably reached.
In Figure 3,
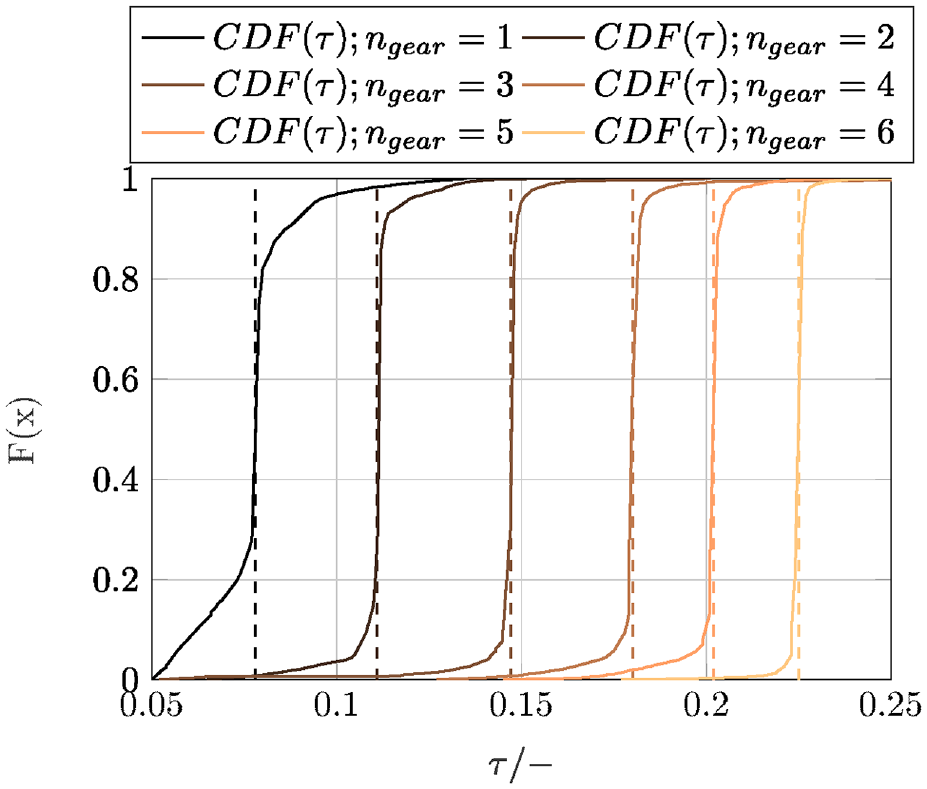
Values for
Giani et al. propose considering the change of transmission ratio finalized when the computed transmission ratio
Therefore, it is proposed to not only considering the value for
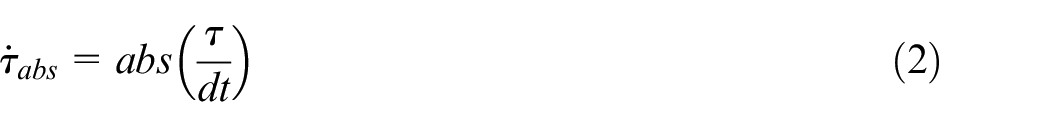
In addition to the absolute gradient of
In Figure 4, a typical upshift time-plot for
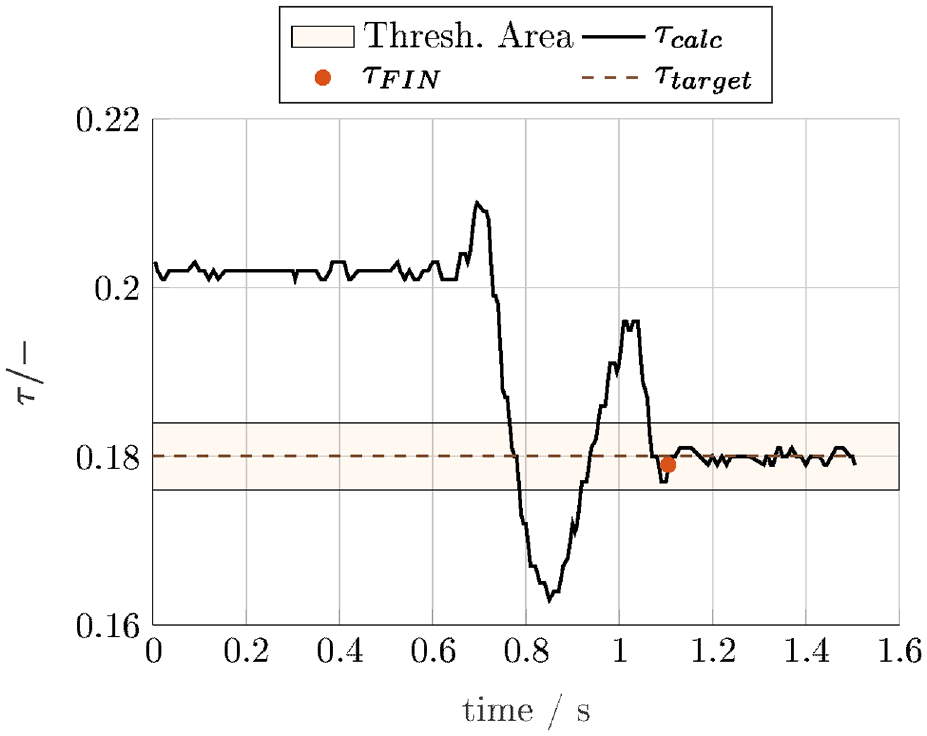
Determination of the end of a gear shift due to the threshold value of
Shift duration
The moment of a successful change into a new transmission ratio is important for determining the shift duration. According to Giani et al.,
14
the shift duration

They suggest that the shift start is defined by the moment of clutch actuation for manual shifts or a button press as a request for a gear change on automatic gear boxes. Due to explorative data analysis, it was found that the gear change may even be started before clutch actuation. In this case, the throttle grip is released with a significant velocity to release the torque from the drive train before the decoupling of the clutch for better drivability. For drivability, see for example, Matthies, 16 p. 8ff.
Therefore, it is proposed to consider three options for the shift start determination on shifts:
Throttle grip release: Detecting the moment where the throttle grip release velocity exceeds a threshold value.
Clutch actuation: Detecting the moment where the clutch lever is actuated. Actuation is measured by exceeding a threshold value.
Change in transmission ratio: Detecting the moment where the original
For downshifting, only the clutch activation moment is considered as the gas is mostly already released and therefore a release velocity cannot be measured or detected.
The
Throttle features
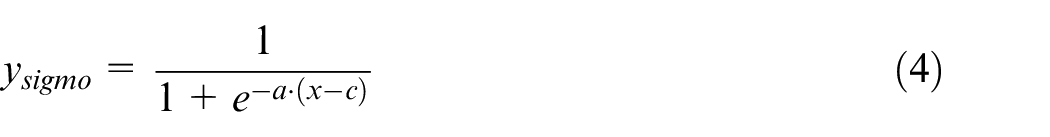
The throttle deactivation and activation curves state an example for the following features of one shift process. Therefore, the sigmoid function defined in equation (4) is used, which describes the logistical function
Within the feature fitting process, the following actions are taken.
Normalize the throttle position data to GasDownStartThrottle.
Find the deactivation curve in measurement data by threshold values for the release velocity and throttle position.
Provide the segmented measurement data for the fitting process within the data indices
Fit the gas deactivation curve by least square fit.
Extract the two sigmoid function fitting parameters GasDown_p_fit_1 and GasDown_p_fit_2.
The result of this procedure is depicted in Figure 5. It can be seen that the sigmoid function fits the measured values with minimal errors.
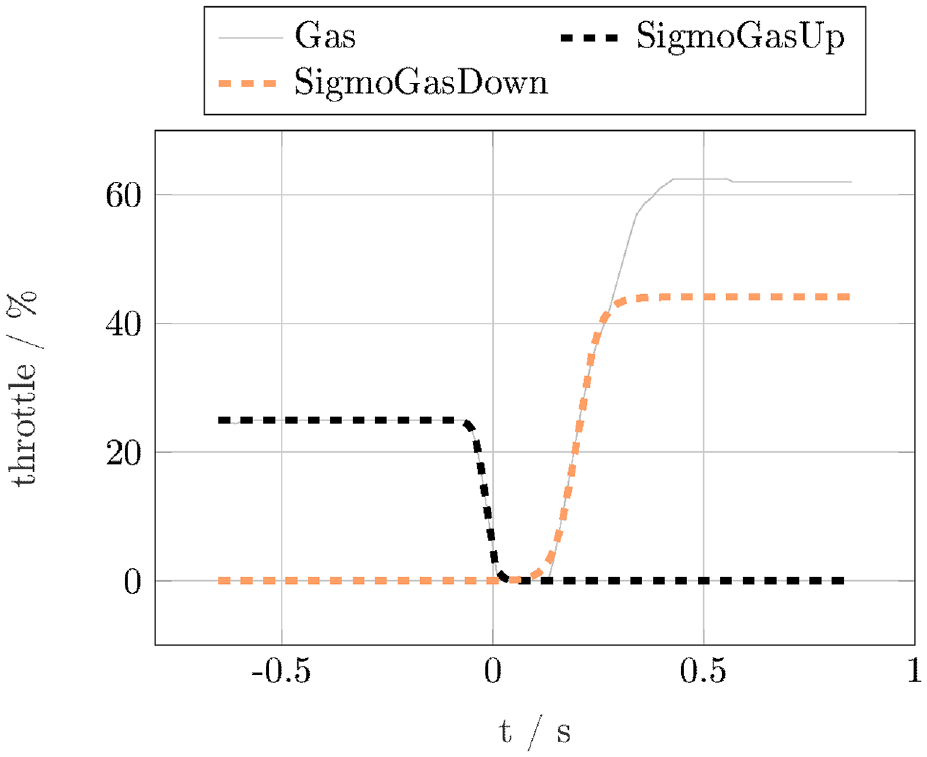
Fitting result of Gas Grip Throttle datapoints.
The same procedure applies to the activation of the gas after gear shifting with the indices
Clutch features
The clutch features are in principle fitted in the same way as the throttle features, but deviate for the clutch deactivation (engagement at the end of a shift process). The difference is that the clutch deactivation is separated in two parts, namely (1) deactivation with clutch disk engagement and synchronization and (2) full release of the clutch lever (Full Clutch Release) for full torque transmission capacity. Those two parts of engagement are depicted in Figure 1 and can also be verified with real measurement data in the upper part of Figure 6. Therefore, the clutch kiss point (where the clutch plates touch) separates the two proposed phases of clutch deactivation which is, for this example, assumed to be at
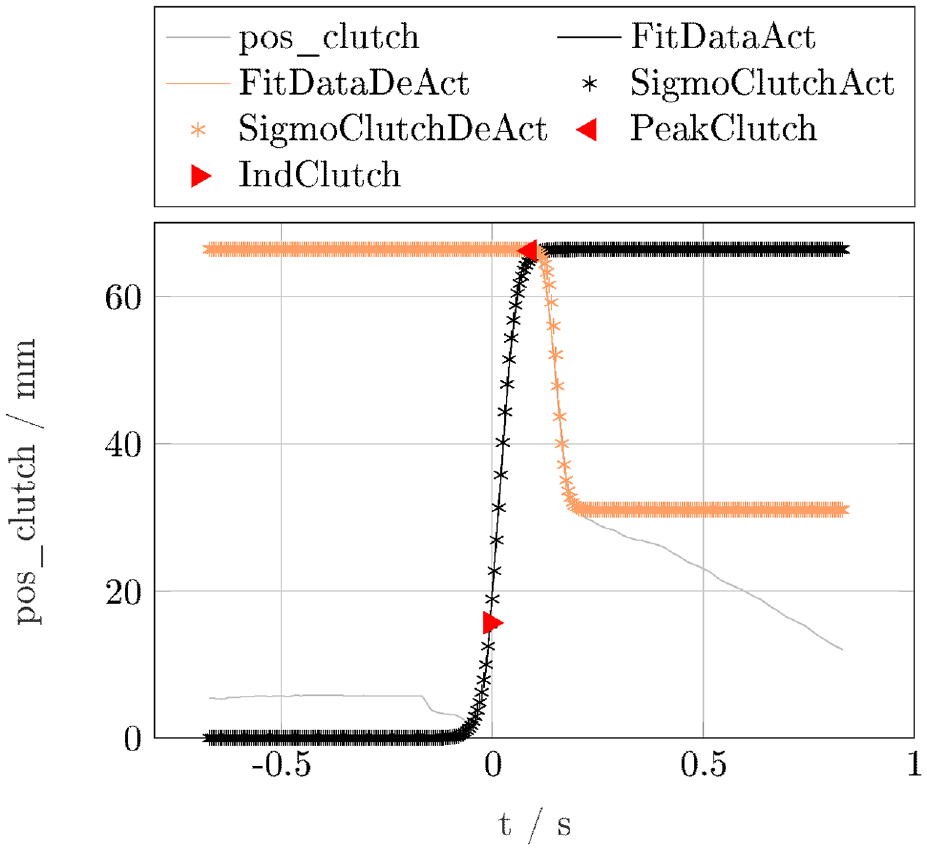
Segmenting and fitting result of clutch actuation data.
The fitting process is therefore split up in the following steps for activation and deactivation:
Take over the measurement data datapoint indices from the shift process.
Extend the datapoint indices backwards with an additional time for the fitting process.
Determine the datapoint index where activation and deactivation separate.
Provide data for the fitting process with the indices
Normalize clutch position data by the peak value for activation and the difference between the peak value and kiss point value for the deactivation part.
Fit the clutch activation and deactivation sigmoid functions to the segmented data and extract
The missing parameterization of the FCR section is simply modeled by a constant velocity curve whose velocity can be extracted from the mean velocity after the clutch kisspoint.
Performance features
Target acceleration
Shift performance is described by Giani et al.
14
as the performance for “continuously transmitting the torque to the wheel during the maneuver.” They propose calculating the shift performance out of the acceleration before the gear shift
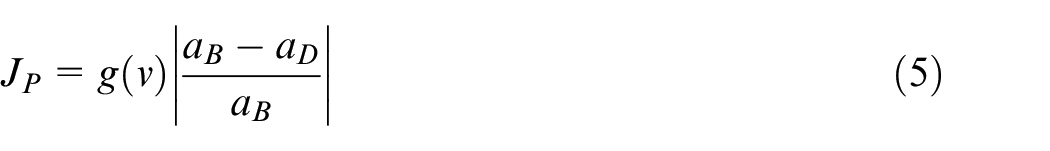
Similar to the proposal by Giani et al., it is aimed to measure the aspired or targeted acceleration that the rider wants to reach with the shift maneuver. Rather than measuring the acceleration before and during the gear shift, the acceleration during the gear shift is left aside. This is justified by the fact that the gearshift operations are carried out manually by the driver and therefore there must be near-zero acceleration during the clutch opening time anyway. It can be seen that there is only one acceleration term left, which makes any correction for speed dependence obsolete. Therefore, the following acceleration calculation formula 6 applies:


For the time querying constant
Shift speed
The
Feature evaluation
In this chapter, the aforementioned feature extraction methods are applied to the data of the pilot study and first results are shown. The goal is to find a first useful correlation for the parameterization of a rider model.
Input variables
In order to come up with useful parameter models, following four variables as known inputs before a shifting process are defined:
Based on the known inputs, the various outputs can be calculated.
Shift process duration
As first results, in Figure 7 the calculated shift times for upshifts give an insight into human-typical shift times and are compared to shift times when assisted by the shift assistant.
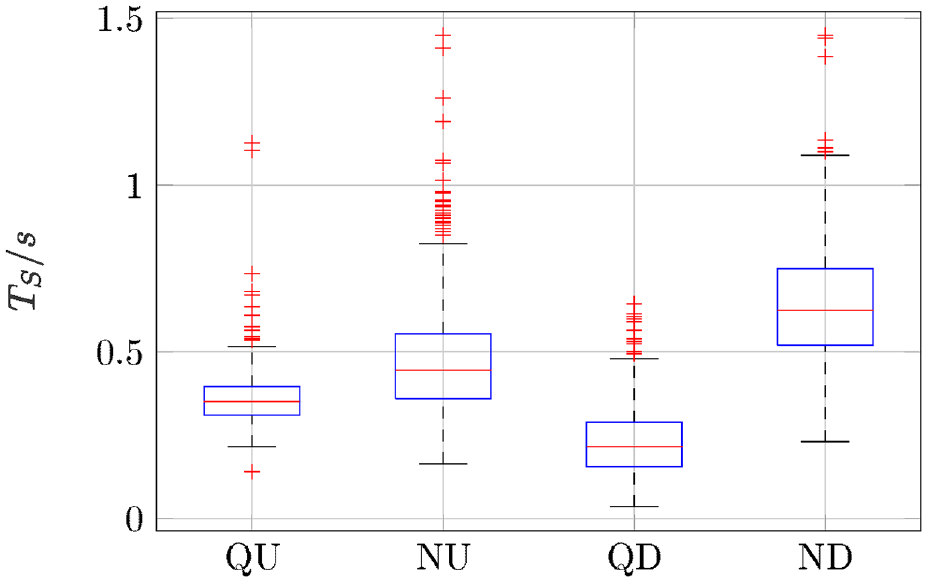
Shift duration when upshifting.
The data for different shift types are presented in categories for normal (e.g. fully manual) and assisted up- or downshifts. The y-axis prints the shift duration
For manual shift processes, the clutch actuation is considered as the begin and
Typical values for the manual upshift duration are around 0.3 s up to 0.7 s without outliers. While being assisted, typical shift durations are around 0.3–0.5 s, but with smaller scatter range as the shift assistant is a fixed parameterized process within the engine control unit (ECU).
When shifting downwards, the shortest manual downshift
In order to bring context to the evaluated shift times, a time of 0.5 s seems realistic for manual shifting maneuvers in unsynchronized racing gearboxes 17 (p. 83). In relation to this, motorcycle gearboxes are also sequential but not necessarily unsynchronized. Nonetheless, the evaluated shift times classify in a comparably range to those shift times.
In order to model the total shift duration, the shift duration with the help of two non-linear functions respective to the
The functions within the research data show that for high decelerations and vice versa high accelerations the shift times become smaller. When riding at a rather constant speed, shift times tend to be higher, which presumably leads to better shifting comfort.
Clutch engagement
The clutch actuation within one shift process is separated into the two stages of activation and deactivation. Therefore, the fitting and data evaluation process can also be divided into those sections.
The actuation fitting parameters comprise two parameters, the first one for compression (“how short/long does the process last?”) and the second one time deviation (“when does the process happen?”). Small compression means a longer duration and vice versa. Since the time deviation is directly related to the dependent variable and is fitted in the time domain, it has the unit of seconds. Positive time deviations shift the actuation/deactuation “later” in the shift process.
Figure 8 depicts the first fitting parameter for the actuation of the clutch. Data is colored according to the two categories of up- and downshifting. It can be seen that when upshifting, most of the datapoints are located in between the area of mean: 0.134; median: 0.1301. Downshifting means that most values are located above 0.13.
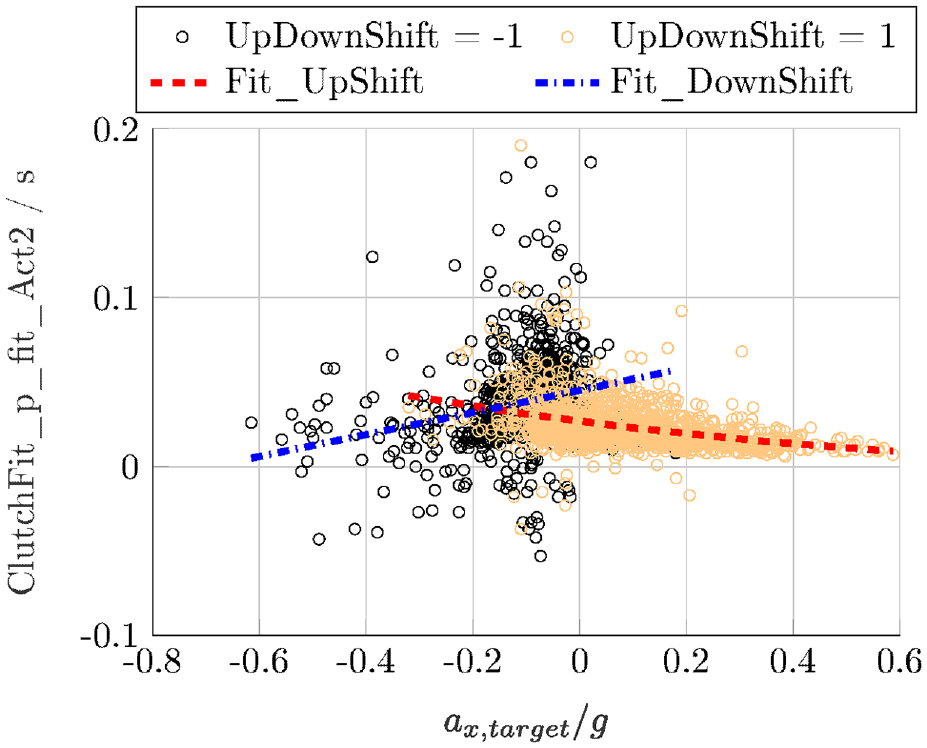
Clutch actuation time fit over target acceleration.
In Figure 9, the derivation of the second parameter for the clutch actuation fit is presented. As the data depicts a very narrow variance of the data, the first parameter can be derived from the second parameter via a simple non-linear function. It is proposed to distinguish between up- and downshifts as this additional parameter separates the data quite well.
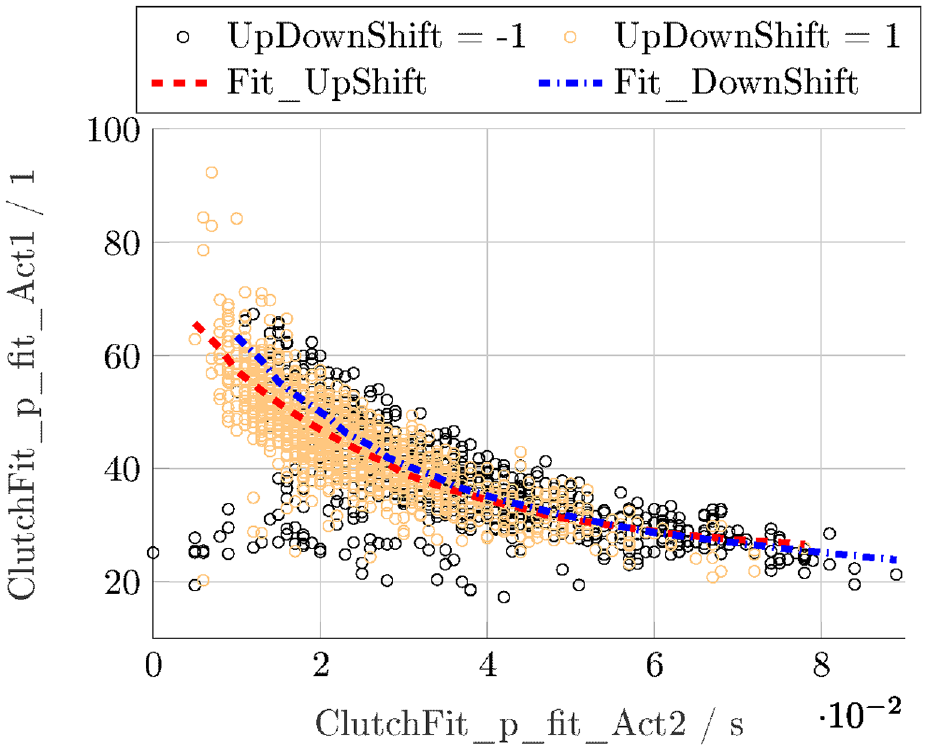
Clutch actuation compression fit over clutch actuation time.
From this plot, it is derived that when upshifting, the actuation usually happens earlier and often faster than for downshifting.
The clutch deactivation parameters can be modeled accordingly. Data shows that the second parameter of the clutch fit also depends on acceleration, whereas the absolute values are significantly higher mean: 0.3631; median: 0.345. Analogous to the activation, two separate functions to model the deactivation of the clutch over TargetAcceleration are used.
The dependence model of the two fitting parameters comprises the most commonly used linear-exponential function. It can be seen that sooner actuation time (X-Axis) leads to higher compression factors, which is physically plausible. This means that earlier clutch release (correlated positively with duration) is accompanied by a more aggressive release speed profile.
Throttle actuation
As for the throttle actuation, the gas actuation process – comparably to the clutch actuation process – comprises leaving the throttle loose (GasDown) and actuating it (GasUp) after shifting and deactuation of the clutch.
For the sake of completeness, the throttle actuation always describes upshift maneuvers as downshift maneuvers are excluded from the Gas parameter fitting.
The release of the throttle grip can be modeled over the target acceleration, introducing an additional gear-dependent decision as a switching factor between the curve shares. The curve shares indicate that positive accelerations lead to rather constant compressions (around 40) with a slight rise to 60 whereas near-zero accelerations let the compression rise up to 180.
In order to model the GasDown_p_fit2 factor, another lookup model can be derived.
It can be seen that the actuation deviation time is again dependent on acceleration. It will be rather constant for positive accelerations, but near-zero accelerations lead to a later deactuation.
In the next paragraph, the GasUp parameters are modeled.
The data shows that the compression of the throttle actuation can be described by means of gear-dependent curve shares. Higher gears mean smaller accelerations and therefore smaller actuation compressions. The smaller the gear is for positive accelerations, higher compressions can be seen in the data. Near-zero accelerations lead to a rise in compression. This might be caused by small initial values for the gas values because of the low torque demand.
The deviation time of GasUp_p_fit_2 can be modeled over Target Acceleration. Gear-selective behavior could not be seen in the data. As there could not be found a strong trend for the need of nonlinear functions, simpler linear functions are used here.
Shift actuation
The third and last objective to parameterize is the actuation of the shift lever. As the actual time trajectory is hard to fit because of the ever changing force-displacement-characteristic, at least an actuation start- and end time is to be presented.
To describe the actuation times, a cumulative density plot has to be chosen, from which important statistical features can be read at a glance. The median of the shift actuation (F(x) = 0.5) in Figure 10 reads 0.6 s for the actuation and 1.0 s for the release of the actuation. Therefore, in most cases the shift lever actuation duration amounts 0.4 s.
Shift actuation begin and end.
Results
In the presented paper, the applicability of our measurement method has been proven to extract features from driving maneuvers on normal roads. All data channels from the measurement system were fused together from different sensor sources to one database. To evaluate the single shift processes, an object-oriented evaluation environment was used. With this powerful tool, it could be shown that there are significant differences for the clutch and throttle actuation by different target accelerations. Selective parameters could be described better by an additional dependence of speed or OriginalGear. For the given parameters, relational functions to the known input parameters of acceleration, vehicle speed, and selected gear can be derived.
Future research should focus on the fitting of the throttle command. It is possible that there can be found relations to driving style-related parameters.
In general, researchers and developers can now use this toolchain to extract important features for parameterizing motorcycle driver models in different driving situations. This can be particularly advantageous when maneuvers that were previously performed on the road are to be reproduced automatically by a robot on a test bench with the requirement of the most realistic possible reproducibility of the maneuvers. Given the amount of human-driven road distances in vehicle development, this method could also help to enhance rider safety when reproducing rides with early development vehicles in dangerous maneuvers.
Finally, practitioners could use the knowledge gained to understand the actual human-machine interaction in that way to further enhance it or translate the knowledge even to unique selling points for their vehicles.
Model usage within test rigs
Lastly, it should be highlighted how our models could be applied to test rigs. The findings show that nearly all shift actuation parameters can be modeled using acceleration as an indicator of vehicle performance. This allows to rearrange the equations, solve for output parameters, and feed the datasets into test rig automation systems. During online simulation, only acceleration needs to be measured, enabling parameter selection for each shift process.
Conclusion
With the help of our work, parameters for the actuation of throttle, shift lever, and clutch lever can now be described with few parameters. The parameters are stored in a database which can also be enhanced through the study of more than one motorcycle rider. This leads to reproducible rides on test rigs. Additionally, not only rider, but also prototype safety can be optimized.
In related work, models and programming techniques are presented to optimize for different quality functions. No other work could be found dealing with reproducing the imperfect real rider actions when riding a motorcycle. As this work just focuses on finding first data clusters and their correlation, there is even more parameters to be studied. For example, by taking into consideration riding style and riding experience, more dependent variables can be added to the explorative data studies.
Footnotes
Acknowledgements
We would like to acknowledge the third party funding by BMW Motorrad as they provided the test motorcycle within a jointly conducted project.
Declaration of conflicting interests
The author(s) declared no potential conflicts of interest with respect to the research, authorship, and/or publication of this article.
Funding
The author(s) received no financial support for the research, authorship, and/or publication of this article.
Research data availability
The presented research data is available upon request.