
Abstract
An economic analysis is required to determine the financial status of every city throughout the world The economic growth of a city depends on multiple factors like health, finances, transport, industry, and so on. Therefore, it is necessary to have a user-friendly factor for handling the economic data regarding the financial evaluation outcomes The main motive behind this research work is to tackle the issue of low prediction accuracy of the conventional economic and financial growth trend assumption model by developing a model using the latest deep network technology. The data regarding the economic status of a city is collected from standard online sources. The collected data are given to the preprocessing for economic prediction in any city throughout the world phase. After that the optimal attributes from the preprocessed data are extracted with the help of a newly suggested Accuracy-based Shell Game Optimization (ASGO) algorithm Consequently, the chosen optimal attributes are given as input to the final prediction stage. The economy prediction of a city is done using the Optimized and Deep Shallow Learning Network (ODSLN). The parameters in the ODSLN are tuned using the same ASGO algorithm. This helps in enhancing the prediction functionality of the deployed model over large dimensional data. The developed model is validated with standard performance metrics against other conventional prediction models. Throughout the result analysis, the developed model attains a 94% accuracy rate and 93% sensitivity rate which is much better than the existing approaches. The efficiency of the suggested deep learning-based economic prediction model is evaluated against the recently developed model based on several performance measures.
Keywords
Introduction
In general, cities throughout the world are often referred to as urban systems or city networks. Cities throughout the world are the first ones to cope with the fastest-growing technological advancement and modernization. In the international and transnational process, cities all over the world are required to shape the economy of the country. Economic growth in the finance sector describes that a region accomplishes the economic appraise caused by the entire production and labor within a particular time period. From the financial-economic enhancement, the development of the economics in a region or country may be judged effectively [1]. The faster development in financial growth, the more development is seen in the economy. Moreover, analyzing the economic status shows that economic improvement is comparatively slow [2]. If the economy of the finance sector shows growth, then it denotes the degradation of the economy. The improvement trend of the economics in finance could solve the future economic improvement situations [3]. Thus, to correctly learn the status of economic improvement, it is essential to efficiently assume the financial economy [4]. World cities are divided into various small-scale sectors, thus leading to the economic analysis of cities. The improvement of infrastructure in the world cities needs to be analyzed in the economic analysis and substantially, that needs to be covered in the wider city areas. But, in the present experimental findings, there is still a lack of efficient economic assumption measures. Also, it should be noted that the forecast outcomes are not always the same; therefore, it is complicated to make better utilization of the forecast findings. So, various experts have managed deeper experiments on the enhancement of the financial economy [5].
The high-functioning of financial banks and organizations is not only important for defending the growth in economics but also for supporting the dispersing of income and wealth in economics evenly. Educational organizations have suggested that the monetary, fiscal authorities, bank managers, credit ranking agencies, and fiscal authorities have miscalculated essential issues in functioning environments, which leads to overvaluing the bank credit status [6]. The overvalued banks require few capital requirements as a buffer, as opposed to losses, and thus tempt the banks for more deposits and funds. When major deposits support the managers to offer more loans, managers, on the other hand, can terminate the bank issue by considering features that create inefficiencies [7]. Furthermore, the existence of political and macroeconomic issues disfigures asset allocation and reforms in finance and thus makes banks an inefficient mode in the middle of the deposit in loans [8]. The deficient metrical literature concerning the offering of economic problems, political conditional, and the country problems to measure the effectiveness of the economic policies in a bank compared with the necessities that the atmospheric measures have in evaluating the efficiency of banks is another drawback. If those measures have a notable impact on positive measures, ignoring the measures will lead to biased effective results [9]. Prior researchers have utilized economic measures as control measures for atmospheric variations for the purpose of evaluating a general frontier for panel information following this data. The major problem is to describe all data in an international differentiation regarding the effectiveness in the banking sector consisting of country issues and political issues [10].
The Neural Network (NN) model evaluates the financial driving force and the economic framework and acquires the relevant attributes impacting the enhancement rate of the financial economy [11]. The Back Propagation (BP) NN built along with the utilization of the “Genetic Algorithm (GA),” when provided with relevant measures, is given as input in order to obtain the economic enhancement as the output [12]. The “Autoregressive Integrated Moving Average (ARIMA)” system is employed to assume the overall result of the financial economy and creates fault evaluation based on the assumption outcomes. Assuming the influence of measures on the prediction outcomes, the Consumer Price Index (CPI) is employed to optimize the assumption system to gain the assumption outcomes of economic development and financial trends with minimum faults [13]. The multi-category feature model utilizes the long-term storage structure to construct a learning system with a multi-class feature model to gather efficient information from the financial turning as well as the development points and to give the gathered information into the learning system for obtaining the original assumption outcomes [14]. A “1-D Convolutional Neural Network (1DCNN)” on the night-time illumination histograms joined with land-covered histograms to assume the “Gross Domestic Product (GDP) of the United States of America (USA)” at the regional level for a four-year time.
Research questions
How does machine learning influence the future economy?
How is machine learning applied to economic data?
How to improve the prediction accuracy of economic and financial growth using machine learning and heuristic approaches?
What were the major reasons for the growth of prediction accuracy?
Issues of state-of-the-art methods
Yet, the categorization is insufficient for some particular data [15]. In the past centuries, more research has accomplished the above task by learning the GDP and its related variables. At present, most of the enhanced methods have been commonly linear, and therefore, the existing models are not capable of obtaining the entire features of macroeconomic measures like GDP while developing the model [16]. To solve these problems, Artificial Intelligence (AI) methods like “Evolutionary Algorithms (EAs)”, “Adaptive Neuro-Fuzzy Inference Systems (ANFIS)”, “Artificial Neural Networks (ANNs)”, and “Support Vector Machines (SVMs)” have been utilized by experts that seemed to more enough to describe the character of the economic time series [17]. However, these models also seem to have some limitations which are shown here. An accurate analysis is not possible by the existing approaches. Somehow, the existing model often falls into the local minima issues, and also, the accuracy provided by these models is lower. Thus, the Quality of Services (QoS) is affected. Owing to these issues, a new model is developed to provide effective performance regarding economic analysis. Here, the standard performance metrics are validated to show effective performance. An accurate economic analysis of the world cities is offered by the developed model. Hence, enhanced performance is offered by the implemented system.
The contributions of the recommended design are summarized as follows.
To create a framework for analyzing the economics of the world cities with the aid of an optimization technique capable of providing efficient prediction of economic data. To ignore the unnecessary and replicated features by employing an optimal feature selection approach to the pre-processed data, where the features are optimally selected by the designed ASGO technique. To design a new optimization approach called ASGO, which infers the concept of traditional SGO algorithm for optimal feature selection and the optimization of ODSLN network parameters. This offers better functionality of the developed system. To predict the economic data effectively by utilizing an advanced deep learning model called ODSLN, where the hidden sequences are optimized by the suggested ASGO algorithm. This enhances the prediction functionality. To formulate the efficacy of the developed system by adopting various factors and differentiating its performance with various conventional classifiers and optimization designs.
The development of the implemented model is organized in this paper as given here. Module II presents a review of the conventional models regarding economic prediction works. The framework of the suggested economic analysis of the world cities is given in Module III. Module IV includes the enhancement of accuracy based on the optimization algorithm and the process of optimal feature selection for economic analysis. The economic analysis model utilizing a heuristic-based deep learning approach is described in Module V. The results and discussion about the recommended model are demonstrated in Module VI. Module VII summarizes the suggested design.
In 2004, Welte et al. [18] constructed a user-friendly measure for handling the economic movement for estimation. Measures might affect the transfer of economic research findings that were mathematically detected, and the path experts were affected by the conditions that were examined. A transferability resolution chart was made that consisted of the knock-out condition, models for enhancing the transferability, checklist-assisted transferability measures, and uncertainty examination details for analyzing the outcomes. This model was examined in multiple cost-effective types of research in the sector of interventional screening, cardiology, and vaccination Here, if the research results were not received, then the transfer of research designs or models was examined to save time while introducing the latest research.
In 2022, Yang and Park [19] offered two models for better economic decision-making and prediction. The authors have provided a deep learning method assisted by the “Long Short-Term Memory (LSTM)” structure model to assume the economic development ratio and problems by holding the linear dependencies with the period of economics. Moreover, the authors have presented a machine learning method that extracted economical features of enhancement and problems via effective utilization of the “eXplainable AI (XAI)” architecture. For various G20 regions from the year 1990 to 2019, the suggested LSTM method performed better than the conventional assumption systems, significantly in developing countries.
In 2022, Atkinson and Price [20] have suggested a data-dependent regionalization model. Employing the transfer learning technique, the authors have used a method that learned the “fine spatial resolution” in the day satellite nodes and imagined the best regionalization model to separate the “Visible Infrared Imaging Radiometer Suite (VIIRS)” on the night illuminations for the prediction of GDP. When considering these evaluations, the authors have revealed that the usage of urban to rural division was not encouraged by the system and declared that viewing the night illuminations of a few land kinds as agents of the entire economics was a good path to know the system.
In 2001, Yu et al. [21] recommended a smart city economic handling assumption system that depended on the data evaluation model. The authors have presented a general assumption model of time sequences that described the definition of the smart city and explained the issues in the economical handling of the smart city. Next, the performance needed of the economical dataset for the handling model for the smart city was given. The suggested model was examined, and the outcomes of the information analytics measures were displayed that the chosen time amount of the prior five years was perfect, and the sequential graph was also perfect. It ensured and verified the operation stability, correctness, and integrity of the model’s performance.
In 2016, Coskuner and Emsia [22] recommended the latest hybrid system named Genetic Algorithms–Support Vector Regression (GA-SVR). The suggested model included three phases. In the first phase, the most effective attributes in later lag selection were chosen employing the Stepwise Regression Algorithm (SRA). Next, these attributes were employed to build a suggested model in which the system employed SVM. The variables in the SVM were optimized by GA. At last, the estimation of the suggested system was performed on the examination data resources.
In 2021, Cong and Li [23] suggested an assumption model for financial and economic development trends depending on the “Panel Vector Autoregressive (PVAR)” system. Based on the existing variables of economic and financial growth, the PVAR system was built, and the impulse reaction measure was employed to handle the impact of arbitrary trouble in the PVAR system to decrease the system’s fault. The “Ant Colony Algorithm (ANA)” was utilized to mine the crucial information on the financial status of the economy and to generate the information cluster. Research findings displayed that the suggested system fault and the assumption findings were consistent with the present measures.
In 2020, Zhao et al. [24] assumed the organization’s economic development depended on policy control and regulation, evaluated the value and marketing of the economic assumption in an organization, economic handling below the module of monetary policy control and regulation to good play the value and role of the regulation in the policy offered reference for related organizations and assured the enhancement of the organization economy. At last, the present research and investigation have revealed that the prediction fault was very less in the present method, and the time consumption was low. Then, the control and prediction of economic growth were more effective.
In 2022, Shen and Tay [25] offered a financial and economic prediction model employing a rough sets system with unique significance on financial investment, database marketing, and business failure prediction. These three developments needed the correct assumption on the future stages depending on the detection of the patterns in the past information. Moreover, the past data were in the type of multi-attribute data table. The distinct rough sets systems and problems regarding the development of hard sets system- validation and discretization test indicator selection were explained. It was illustrated that the sample sets system was allowable to a huge range of practical issues covering financial and economic prediction. Moreover, the findings displayed that the rough sets system was a successive alternative to the traditional systems for financial and economic prediction.
In 2022, Elmond et al. [26] addressed the 3RC framework for analyzing the critical analysis of the smart city in Africa. Here, the interventions of the smart city in Africa have been categorized by the socio-economic inequalities and chaotic transport system. Moreover, the adoption of the smart city in Africa has been routed in contextual realities.
In 2022, Parenti et al. [27] designed a diffusion model for blockchain-based technology for analyzing the 30 startup leads in Latin America. Here, the smart governance BT diffusion model has been processed based on the input, throughput, and output. This model has focused on enhancing the understanding of the technology diffusion in the smart city. Moreover, a cost-benefit analysis has been conducted. Thus, the method has been validated and applied in the smart city.
In 2021, Honarvar et al. [28] introduced a novel model for predicting Particulate Matter (PM), which was considered for the air quality in the region of the smart city. However, the work has been expanded within the dataset of Aarhus and Denmark. Additionally, the suggested model has been performed over various baseline approaches for analyzing its enhanced efficacy. Also, the Multiple Data Set Aggregator and heterogeneity Remover (MDA&HR) and Train Data Splitter (TDS) model have been utilized to find a similar pattern in air quality. Throughout the analysis, the model has shown significant performance.
In 2023, Rabia et al. [29] integrated the deep learning model with the development of an Optimized Genetic Algorithm-Cuckoo Search (GA-CS) for analyzing the economics. Here, the efficiency of the Cuckoo Search Optimization (CSO) algorithm has been modified using the exploration phase of the GA. Also, the diverse standard deep learning models have been evaluated to show enhanced performance. The performance of the developed model was better regarding accuracy.
In 2023, Khurram et al. [30] have developed the Particle Swarm-Cuckoo Search (PS-CS) optimization algorithm. Here, the PC-CS algorithm has provided effective optimization of the network parameters. Here, several deep learning models were combined and integrated to provide an effective outcome. The analysis has shown that the PS-CS algorithm has attained enhanced performance while utilizing various performance measures.
Research gaps and challenges
The economic prediction models do not provide accurate results when it is applied to real-time economic scenarios. Economic evaluation approaches are arbitrary, abstract, and selective. The change of policies impacts economic prediction. Most economic prediction models provide high error rates. The characteristics and difficulties of the existing deep learning-based economic prediction in the world cities model are given in Table 1. Decision Criteria [18] are capable of increasing the transferability of economic evaluation results. But, it does not meet the standard requirements needed for prediction. LSTM [19] is useful in enhancing forecasting accuracy, and it is useful in deriving economic patterns. However, it requires more training data and time, and it needs high memory bandwidth. Transfer learning [20] needs less computation and less data for training, and it is useful in preserving useful information. Still, it cannot analyze the new features, and it finds it difficult to handle the public management system. Information Analysis System [21] is used to analyze the key technologies and technical system of economic information management system. However, it is not able to analyze the new features, and it finds it difficult to handle the public management system. SVM [22] is used to manage high-dimensional data, and it consumes less memory. However, it cannot perform well in large data sets, and it needs more training time. PVAR [23] has an enhanced consistency in prediction. But it provides unpredictable results. Monetary policy regulation scheme [24] is used to nurture predictability and transparency, and it is used to achieve low inflation rates. But it requires more time to implement. The rough sets model [25] does not require any additional or preliminary information about data, and it can reduce errors. However, it is not applicable for classification tasks.
Summary
Therefore, a deep learning-based economic prediction in world cities is developed to solve these issues. A new framework is developed to analyze the economics of the world cities. Intelligent techniques like the ASGO algorithm and ODSLN model are initiated with the purpose of optimizing the variables and also to predict the economic data in an effective manner. This performance improvement for the designed method is applicable for the IoT platforms and middleware to support the enhancement of applications and information systems for Smart Cities. The empirical findings of the designed approach are proved that it secures low computation time and also it is applicable for real-time applications. Handling of the public management system will be considered as an upcoming work. It has the ability to perform the classification tasks and also it helps to resolve the overfitting issues.
Features and challenges of existing deep learning-based economic prediction models
Features and challenges of existing deep learning-based economic prediction models
Data collection
“World Economic Outlook”: The important data for the developed economic prediction system are obtained from the source mentioned in the link “
Architecture illustration of proposed economic analysis model
Economics helps to overcome the issue of scarcity which is when people’s needs for services and goods are greater than the existing supply. The latest economy shows a labor section, in which humans obtain income by providing what they generate and then utilize that income to buy the goods they want or need. Global cities play a crucial part in the overall as well as the regional economic stage. Variations in the framework of the economy prediction are very important and are also an interesting research topic. The enhancement of organizations is always unpredictable and fluctuating, and if people can predict which organization is in the air of booming in the future, it would be great to take advantage of both private investment and planning and also for the government investment attraction. The layers closer to the input are regarded as the shallow layers, and the ones farthest from the input are regarded as the deeper layers. However, it is not a common terminology and is quite informal. This shallow neural network includes one or two hidden layers. In shallow learning, there are two data processing layers. One is non-linear, and the second layer is linear. So, generally, it takes a linear integration of various kinds of measures. The merit of the shallow network is that it consumes very less amount of money to train the data, and it is enough for simple tasks. Figure 1 displays the architecture of the developed economic analysis of the world cities model.
The architecture of the developed economic analysis of the world cities model.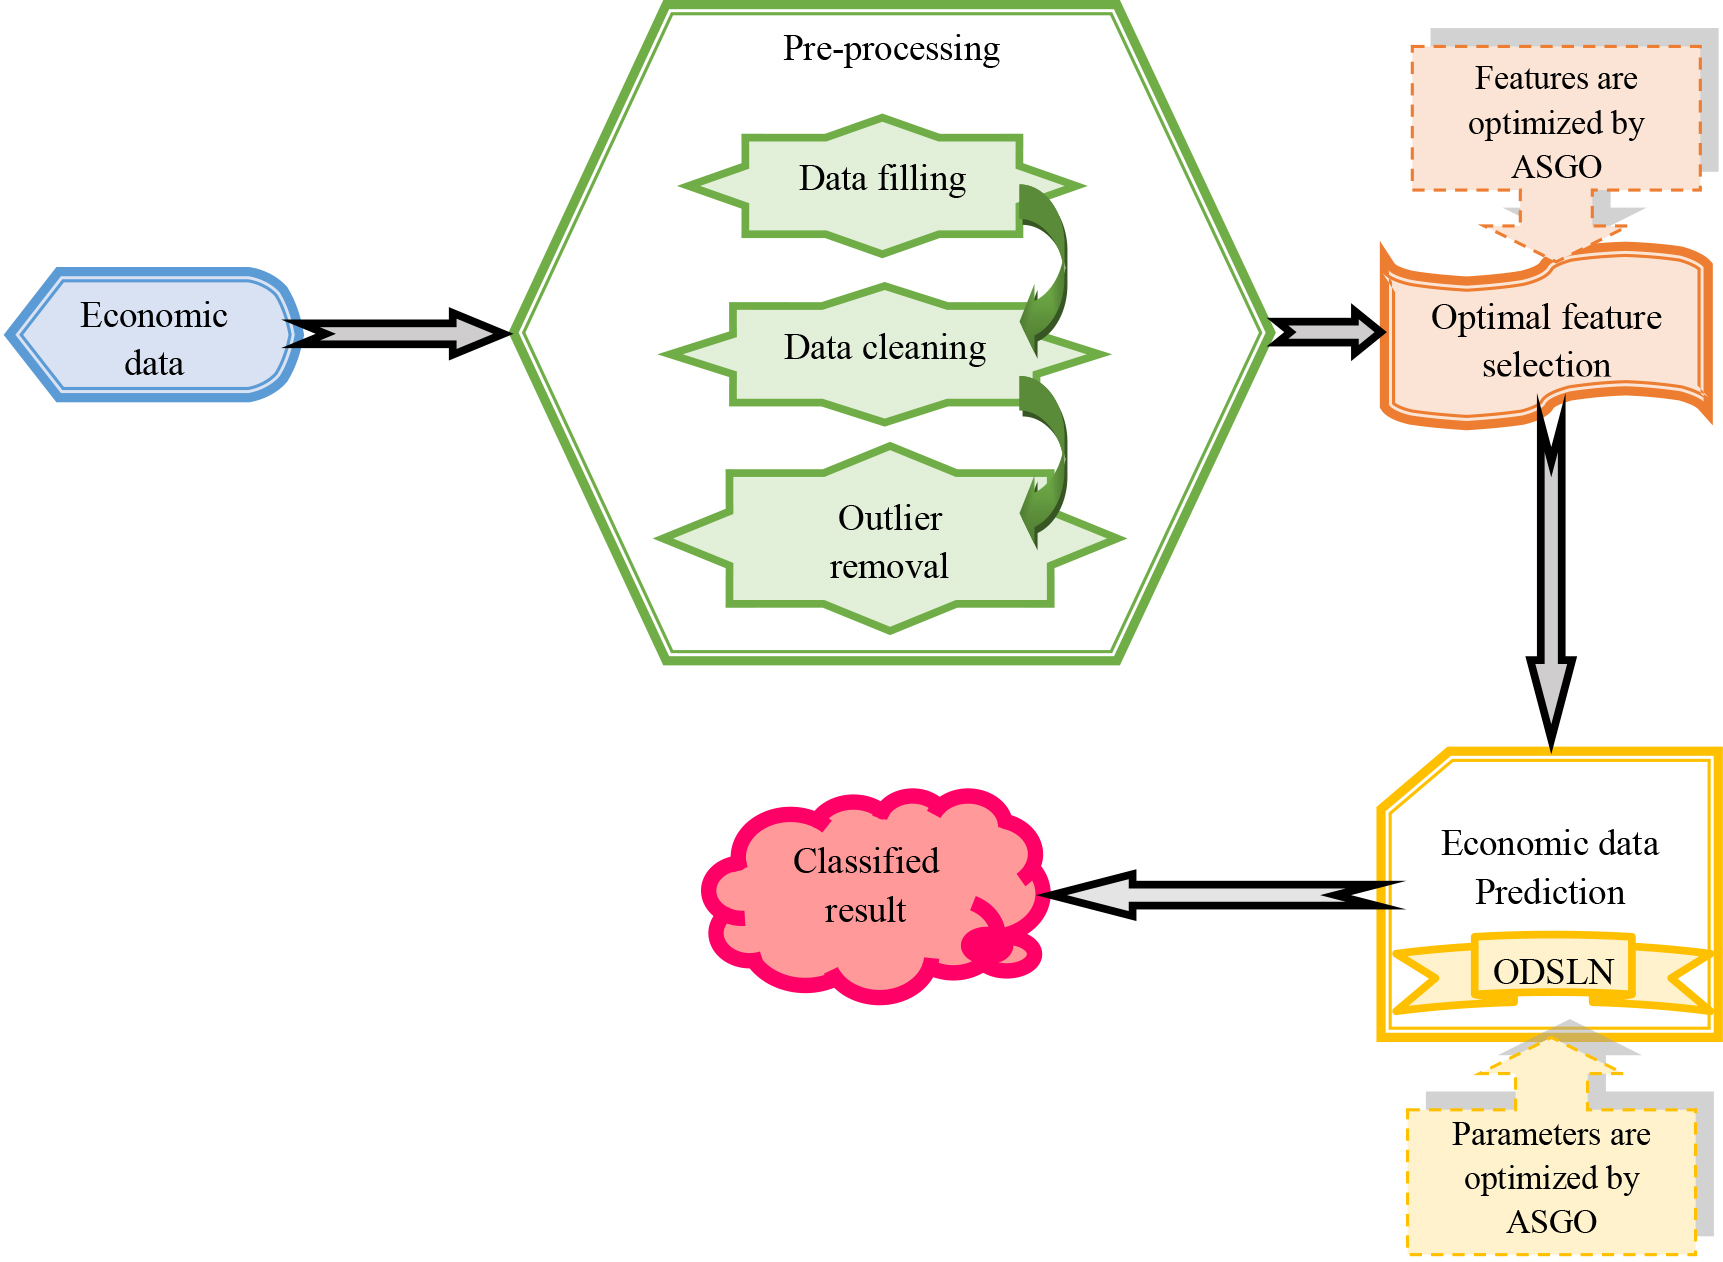
A deep learning-based model is designed and employed for predicting the economics of the world cities. Initially, the required data for the prediction of economics in the world cities are gathered from the traditional dataset. Then, these data are fed to the pre-processing stage to enhance the data quality. This phase includes three techniques such as data filling, cleaning, and outlier removal. Once the pre-processing procedures are completed, the pre-processed information is forwarded to the optimal attribute selection phase. The optimal variances are obtained with the support of the recommended ASGO algorithm. Next, the selected optimal features are given as input to the economic prediction model. For this prediction stage, the developed ODSLN model is utilized. The implemented economic prediction model is capable of offering better economic prediction results over large dimensional information. The parameters in this model are tuned through the recommended ASGO algorithm in order to enhance the prediction functionality. The effectiveness of the developed deep networks-assisted economic prediction system is evaluated by contrasting it against several modern enhanced models with the aid of distinct performance tools.
Pre-processing is an approach to change the data into a format that is effectively and easily processed to provide effective outcomes. Here, the pre-processing takes place by adopting three processes, namely, “data filling, data cleaning, and outlier removal,” in order to offer better quality data. The functionalities of these three techniques are described in detail as follows.
Data Filling: It is the first method in the pre-processing phase. The data contains missed values and characters, which reduces the correctness of the suggested model. The data-filling process helps in filling these missing values with appropriate values. Here, the gathered data
Data Cleaning: The second pre-processing procedure introduced is the data cleaning process. The data after data filling process
Outlier Removal: The final pre-processing methodology used in this research work is the outlier removal process. The cleaned data
Development of accuracy-based shell game optimization and optimal feature selection for economic analysis
Meta-heuristic improvement: ASGO
The enhanced ASGO algorithm infers the concept of the traditional SGO system. This SGO algorithm utilizes the shell game. This model helps to detect the correct shell that contains the ball. It shows good performance and is also very effective. But this model utilizes the random integers that lie from 0 to 1. This random integer reduces the accuracy of the model and produces uncertainty. So, modifications are introduced into these random integers
SGO [31]: The conventional SGO model is a game-assisted optimization model. This model is motivated by the shell game. The shell game is a traditional game. The basic concept of this game is to detect the ball concealed in one of the 3 shells. This is identified by the players. In this game, the candidate is regarded as the candidate of the game. The one ball and the three shells are presented to the player. Every candidate has two opportunities to detect the correct shell. The arithmetic model of this classical SGO algorithm is as follows.
The group of candidates
The term
Here, the variable
The intelligence and accuracy of every candidate are inspired based on the fitness normalized measure that is formulated in Eq. (3).
Here, the term
The simulation of the guess vector
The likelihood of selecting one of the states for the selection of the shell is based on Eq. (5).
Here, the variable is the likelihood of the best guess at the starting selection, and the factor denotes the likelihood of the correct second guess.
At last, the vector
In the traditional model, the term
Flowchart for the designed ASGO algorithm.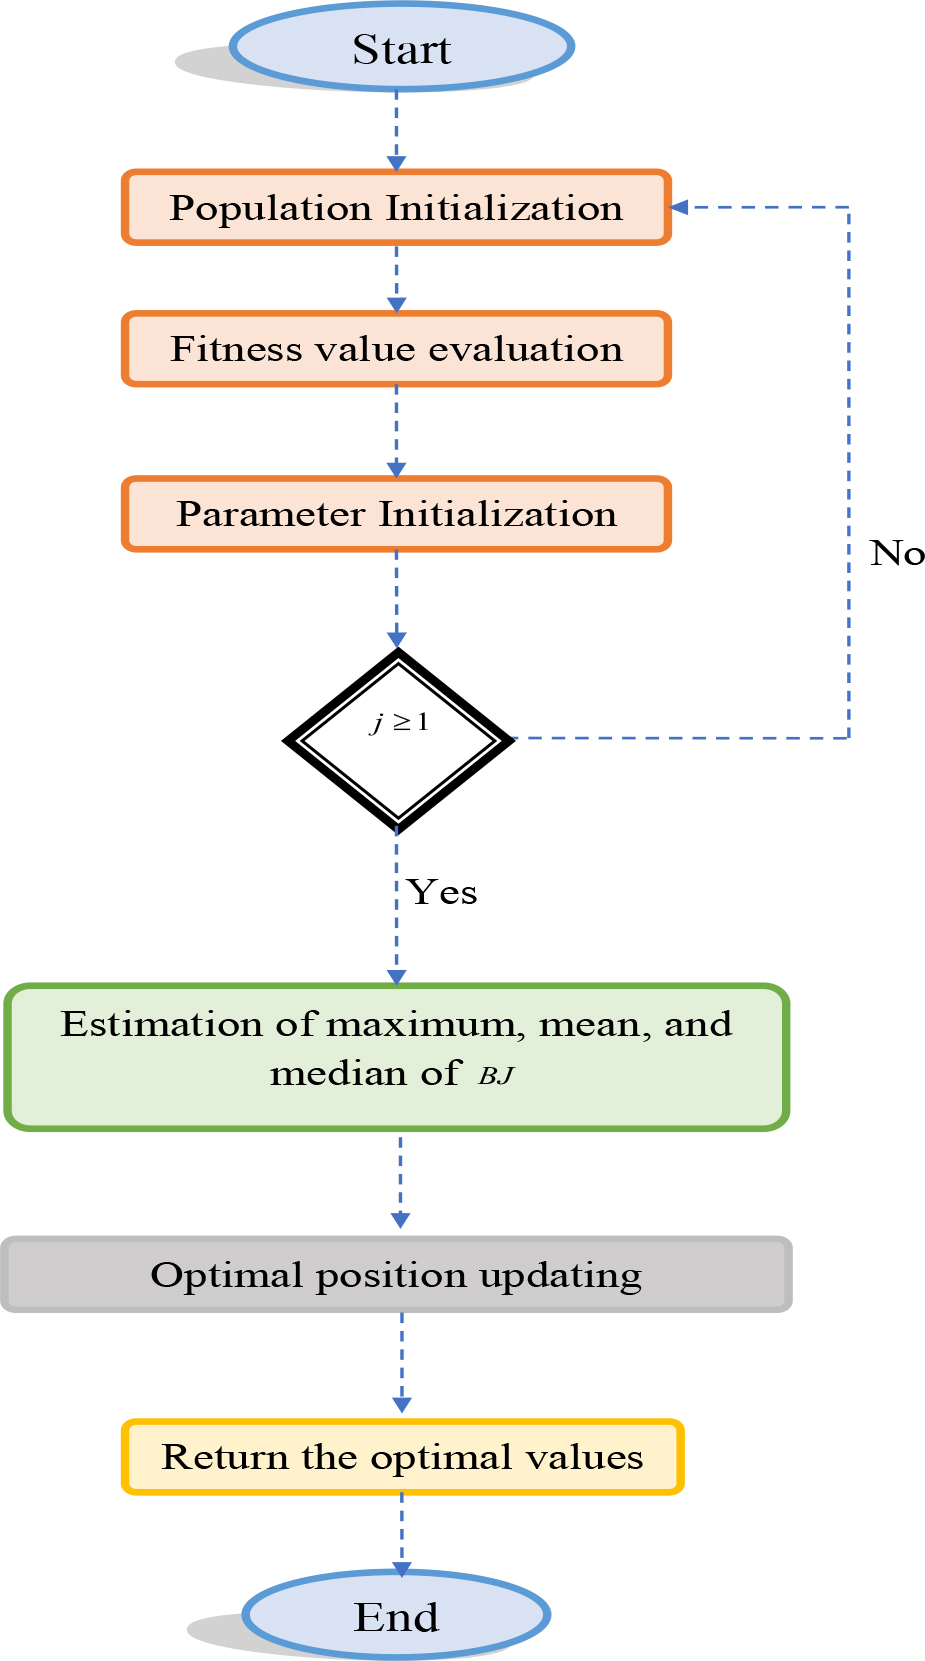
Selection of features is the process of decreasing the amount of given factors in order to enhance the system’s performance. This operation is employed to create a model that is capable of generating more accurate. It also enhances the assumption power of the model by choosing the most crucial features and ignoring the irrelevant and replicated ones. So, the optimal selection of features is necessary to develop an efficient model. In the suggested economy analysis model, the pre-processed information after outlier removal
Optimal feature selection process for the developed model.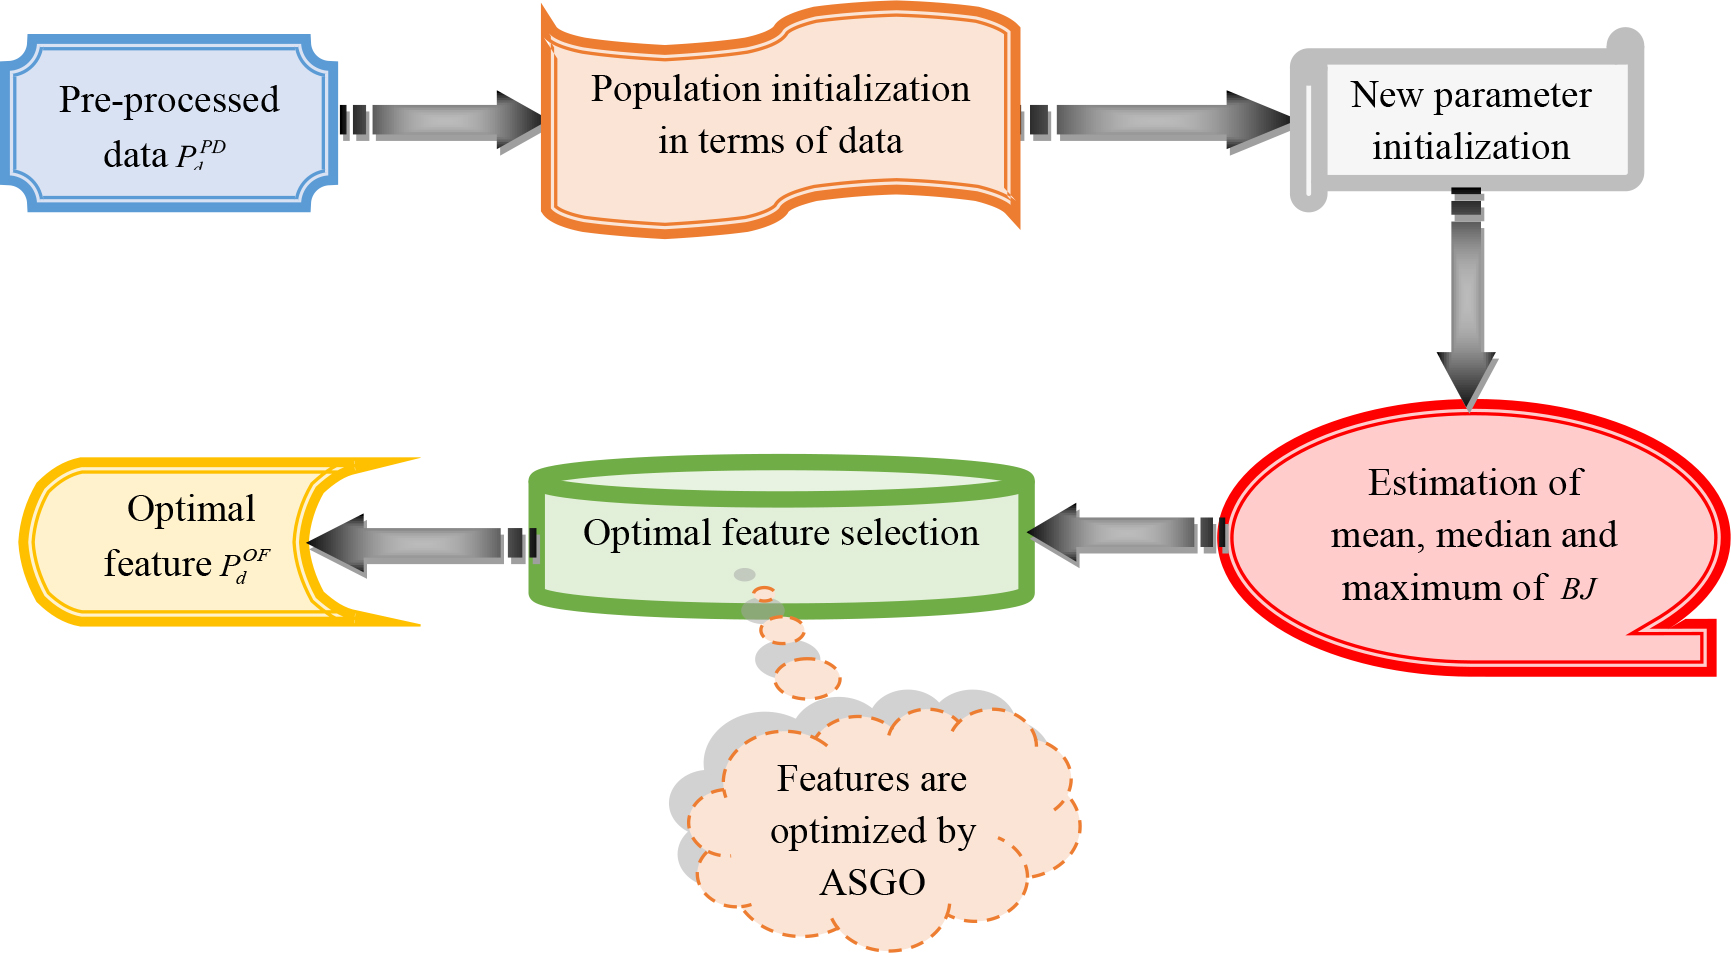
Deep shallow learning network
The Deep Shallow Learning (DSL) [32] model is split into two phases. The first phase is named the Shallow Learning (SL) layer, which includes multiple classifiers generated with the support of distinct learning subsets. The results of general classifiers are combined with the spectrum to produce the crucial attributes that are regarded as the result of the SL layer. The next phase is called the deep learning layer. It performs the categorization employing the attributes provided by the SL layer. The “Deep Belief Network (DBN)” is employed to construct the suggested DSL method. The SL has a maximum of one hidden layer. The classifiers of the SL layer have a simple layout, and it performs in a faster manner. To train the SL layers, very few numbers of parameters are required. After some epochs, a set of base classifiers is utilized in the SL layer. In DSL, the DBN approach is employed to start training the results from the SL layer, and hence, it gains highly accurate categorization outcomes. The DBN model is one of the promising deep learning approaches in data prediction tasks. It integrates some layers of Back Propagation (BP) and Restricted Boltzmann Machine (RBM). The training approach of DBN may be split into two phases, such as pre-training and fine-tuning phases. From the initial RBM, the entire RBMs are trained, including the initial hidden layer and input layer. The result of every RBM is considered as the known layer of the neighborhood RBM. After the pre-training task, the BP neural network and supervised learning are employed to propagate the fault of the results of the final RBM and to tune the bias and weight with some interactions. The architecture of the DSLN model is depicted in Fig. 4.
The architecture of the DSLN for the recommended model.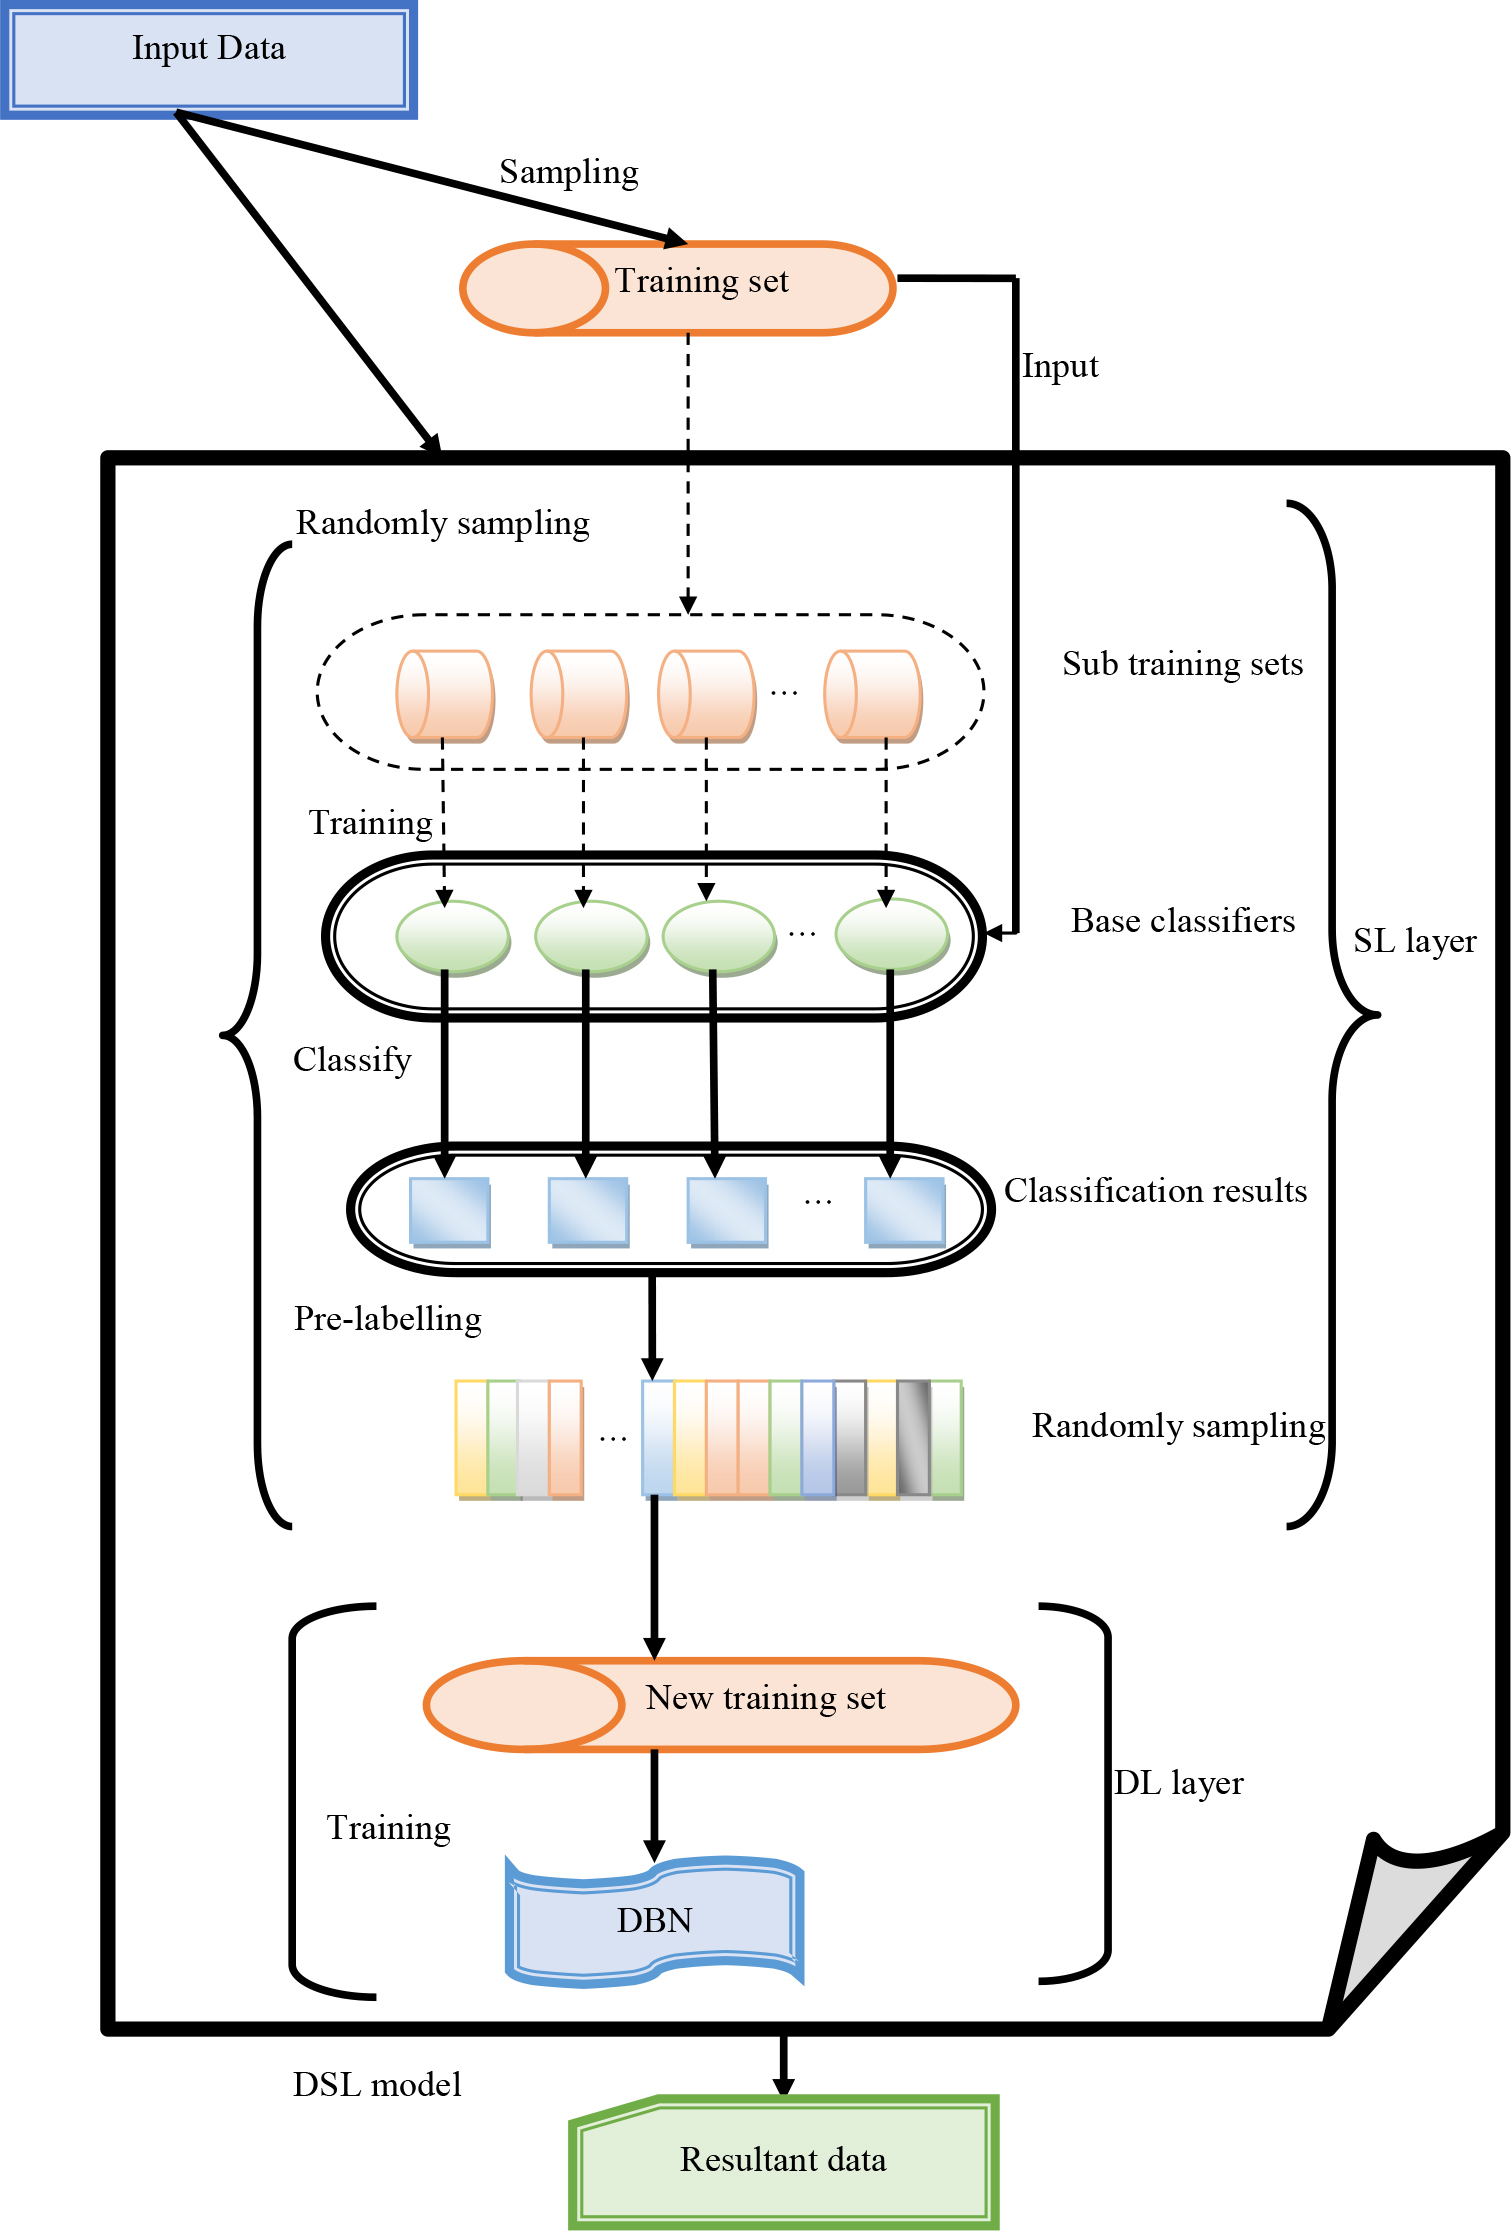
The DSLN model has good performance with hidden layers that are more computationally effective. It applies to more prediction tasks. However, these networks fail to efficiently predict the data when the amount of data is huge. It requires more amount of storage to perform the prediction task better. It makes the prediction task complicated to understand by the less skilled people. This model needs classifiers to obtain the prediction result. It has various hidden layers that affect the correctness of the model’s outcome. Introducing a new model called ODSLN to solve the issues is the major contribution of this work. The hidden neurons in the ODSLN model are optimized to avoid dimensional issues. The objective measure of the designed system is formulated in Eq. (10).
The variable
Precision
MCC: It calculates the “modifications between the predicted data result and true data” and is formulated using Eq. (12)
FOR: It is described as the “conditional probability for the condition being true given a negative decision.” It is calculated as given in Eq. (13)
The variables UV and WX indicate the “true negative and true positive”. Then, the term YZ denotes the “false positive measure”. Finally, the parameter AB indicates the “false negative”.
At last, the classified result is obtained for better economic prediction. Figure 5 illustrates the developed ODSLN with parameter optimization.
Developed ODSLN model with parameter optimization.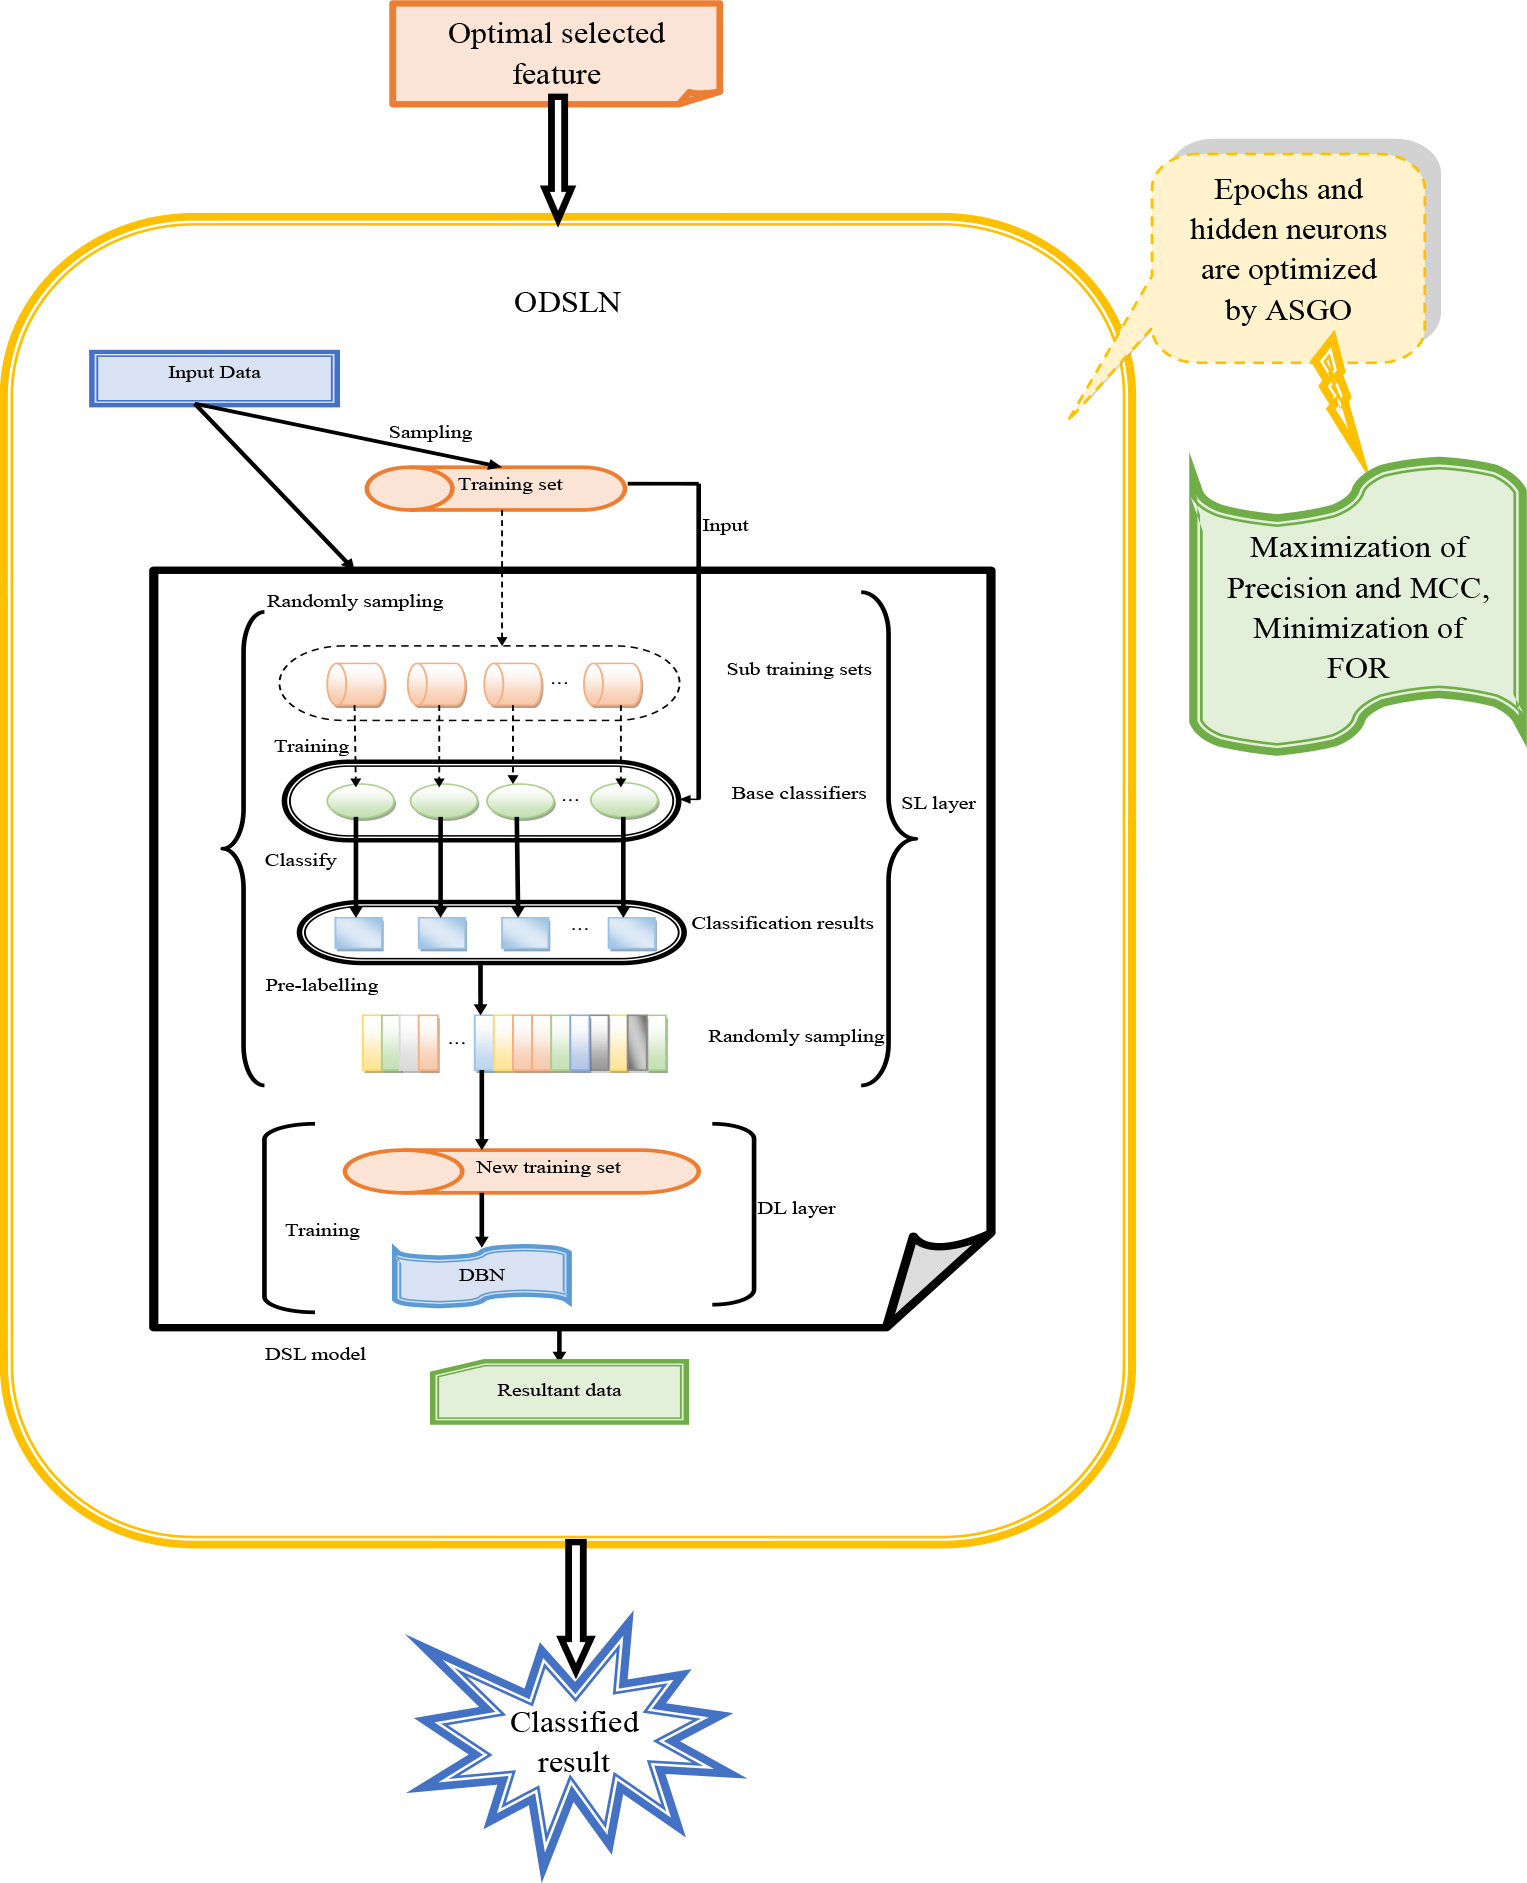
Experimental setup
The enhanced DSL network supported with the optimization algorithm for economic evaluation of world cities was executed in Python software, and the corresponding assessment was provided in this section. The implemented system has taken the chromosome length of 52, and the population count was taken as 10. The highest iteration for the system was 50. Multiple models were employed to compare the prediction outcomes generated by this system. The existing models such as “Harris Hawks Optimization (HHO) – ODSLN [33], Polar Bear Optimization Algorithm (PBO) – ODSLN [34], Light Spectrum Optimizer (LSO) – ODSLN [35], Crow Search Algorithm (CSA) – ODSLN [36], SGO [31]” were utilized. Also, conventional classifiers like “SVM [37], LSTM [38], Deep Neural Network (DNN) [39], and DSLN [32] were adopted. The experimental outcomes and the following discussion were provided elaborately in the below section.
Performance measures
The measures that are applied for the evaluation of system performance are summarized below.
Precision: It is calculated in Eq. (11).
MCC: It is computed in Eq. (12).
Accuracy: It is measured by “how closer to a provided set of factors are to the raw factor,” and it is calculated as given in Eq. (14)
NPV: It explains the “likelihood that following negative research results, that separately not containing any fault,” and it is evaluated using Eq. (15).
FPR: It estimates the factor that is detected by mistake. The FPR is calculated using Eq. (16).
F1-score: It is measured as “the ratio between the recall’s harmonic measure and the precision measurement”. F1-score is computed using Eq. (17)
FDR: It is expressed as “the measurement of explaining the rate of FP and both FP and TP”. The FDR is calculated using Eq. (18).
Sensitivity: It is measured as “the lowest absolute amount of changes that could be identified by the measure”. The sensitivity is computed using Eq. (19).
Specificity: It is formulated as “the evaluation of the likelihood of the negative rate”. The specificity is determined using Eq. (20).
Recall: It is depicted as “the measure that estimates the count of best positive factors out of the entire positive rates”. The computation of recall is provided in Eq. (21).
The implemented design’s prediction performance is measured by the confusion matrix, which is shown in Fig. 6. The usage of the confusion matrix is to estimate the prediction outcomes. Here, the confusion matrix includes true and predicted labels which are tuned to evaluate the model’s prediction efficacy. Each label contains two measures such as true and false. Then, the values were initiated from 100 to 900. From Fig. 6, it is proved that the developed system has better prediction ability with more than 900 correct predictions and around 87 wrong predictions, which assures the effectiveness of the model.
Confusion matrix analysis of the developed economic evaluation of world cities with optimization model.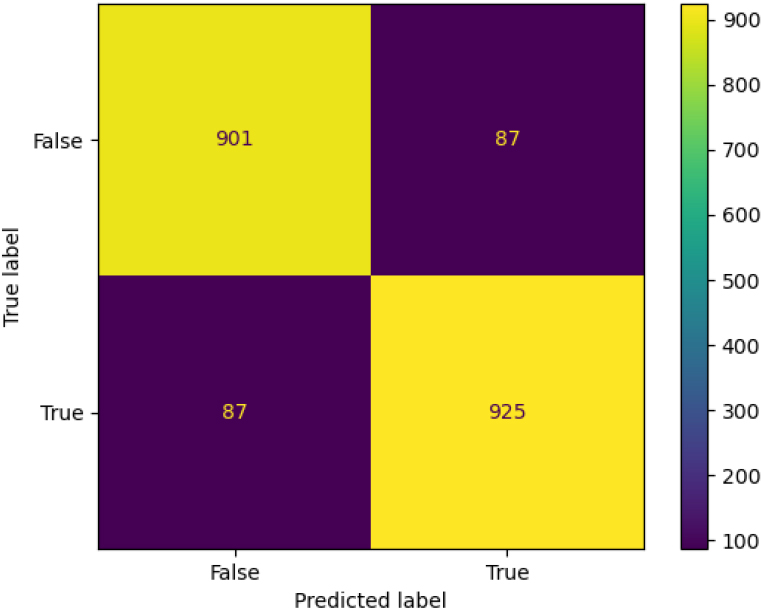
The cost function analysis of the recommended design is shown in Fig. 7. The likelihood of economic measures in the enhanced system is measured by the cost function analysis. The developed model is differentiated from multiple optimization models. Here, the cost measure is altered with the number of executions. The iteration amount is initiated from 0 to 25, whereas the cost function measure is initiated from 2 to 5. The cost measure of the recommended system is enhanced by 46% than the HHO-ODSLN, 50% than the PBO-ODSLN, 60% than the LSO-ODSLN, 62% than the CSA-ODSLN, and 44% than the SGO-ODSLN algorithms, correspondingly when the value of the iteration is 5. Thus, the outcomes revealed that the implemented system has good cost management.
Cost function evaluation of the implemented economic evaluation of world cities with optimization model.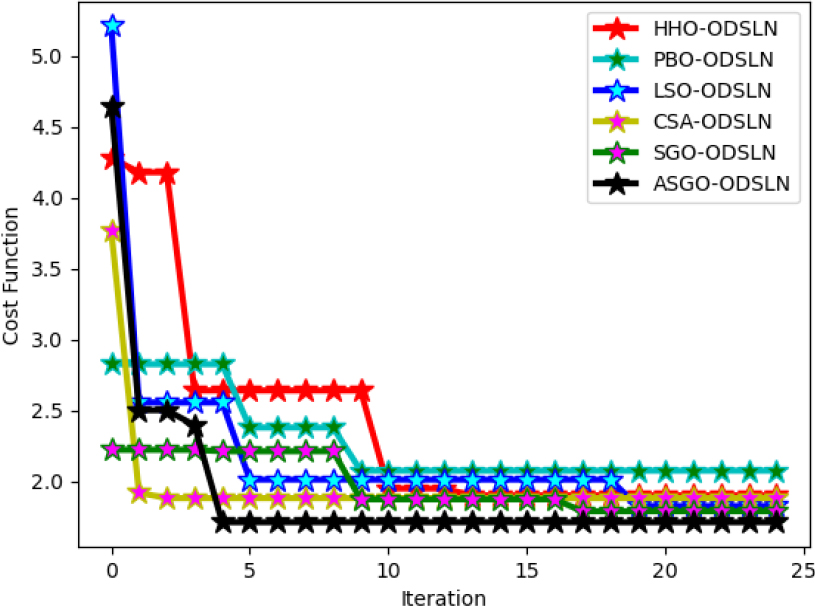
ROC curve evaluation of the enhanced economic evaluation of world cities with an optimization model.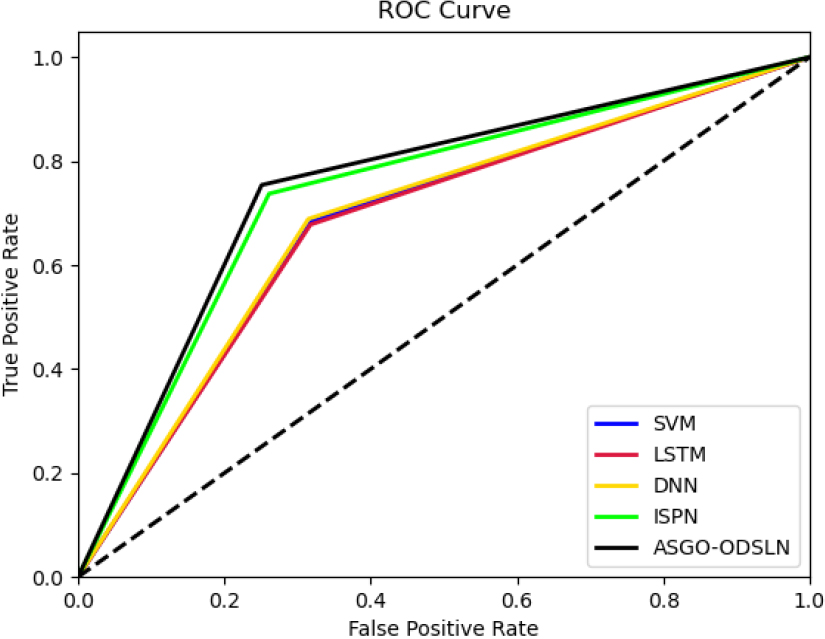
The ROC evaluation of the suggested design, when compared against the classical model, is illustrated in Fig. 8. The Receiver-Operating Characteristics (ROC) curve is utilized to verify the correctness of the system with the conventional models. In this evaluation, the model is tuned with measures such as false and positive rates. These measures are varied from 0 to 1. The suggested model is 50% more than the SVM, 50% more than the LSTM, 60% more than the DNN, and 90% more than the DSLN when taking the false positive rate as 0.2. Thus, the findings of the suggested system proved the better functionality of the system in predicting economic analysis than other conventional models.
Performance analysis of the recommended model over various optimization models and classifiers
The functionality estimation of the developed system over multiple optimization models and classifiers is depicted in Figs 9 and 10 correspondingly. Here, the performance factors of the designed model are contrasted against the learning rate. The learning rate starts from 0.01 to 0.41, whereas the performance measures start from 84 to 84. From Fig. 9(a), the accuracy of the implemented model is 39.99% more than the HHO-ODSLN, 40.75% more than the PBO-ODSLN, 41.66% more than the LSO-ODSLN, 42.28% more than the CSA-ODSLN, and 43.23% more than the SGO-ODSLN algorithms correspondingly when considering the learning rate as 0.21.
Performance analysis of the recommended economic evaluation of world cities when contrasted against the existing optimization techniques regarding “(a) Accuracy, (b) F1-score, (c) FDR, (d) FNR, (e) FPR, (f) MCC, (g) NPV, (h) Precision, (i) Sensitivity, and (j) Specificity.”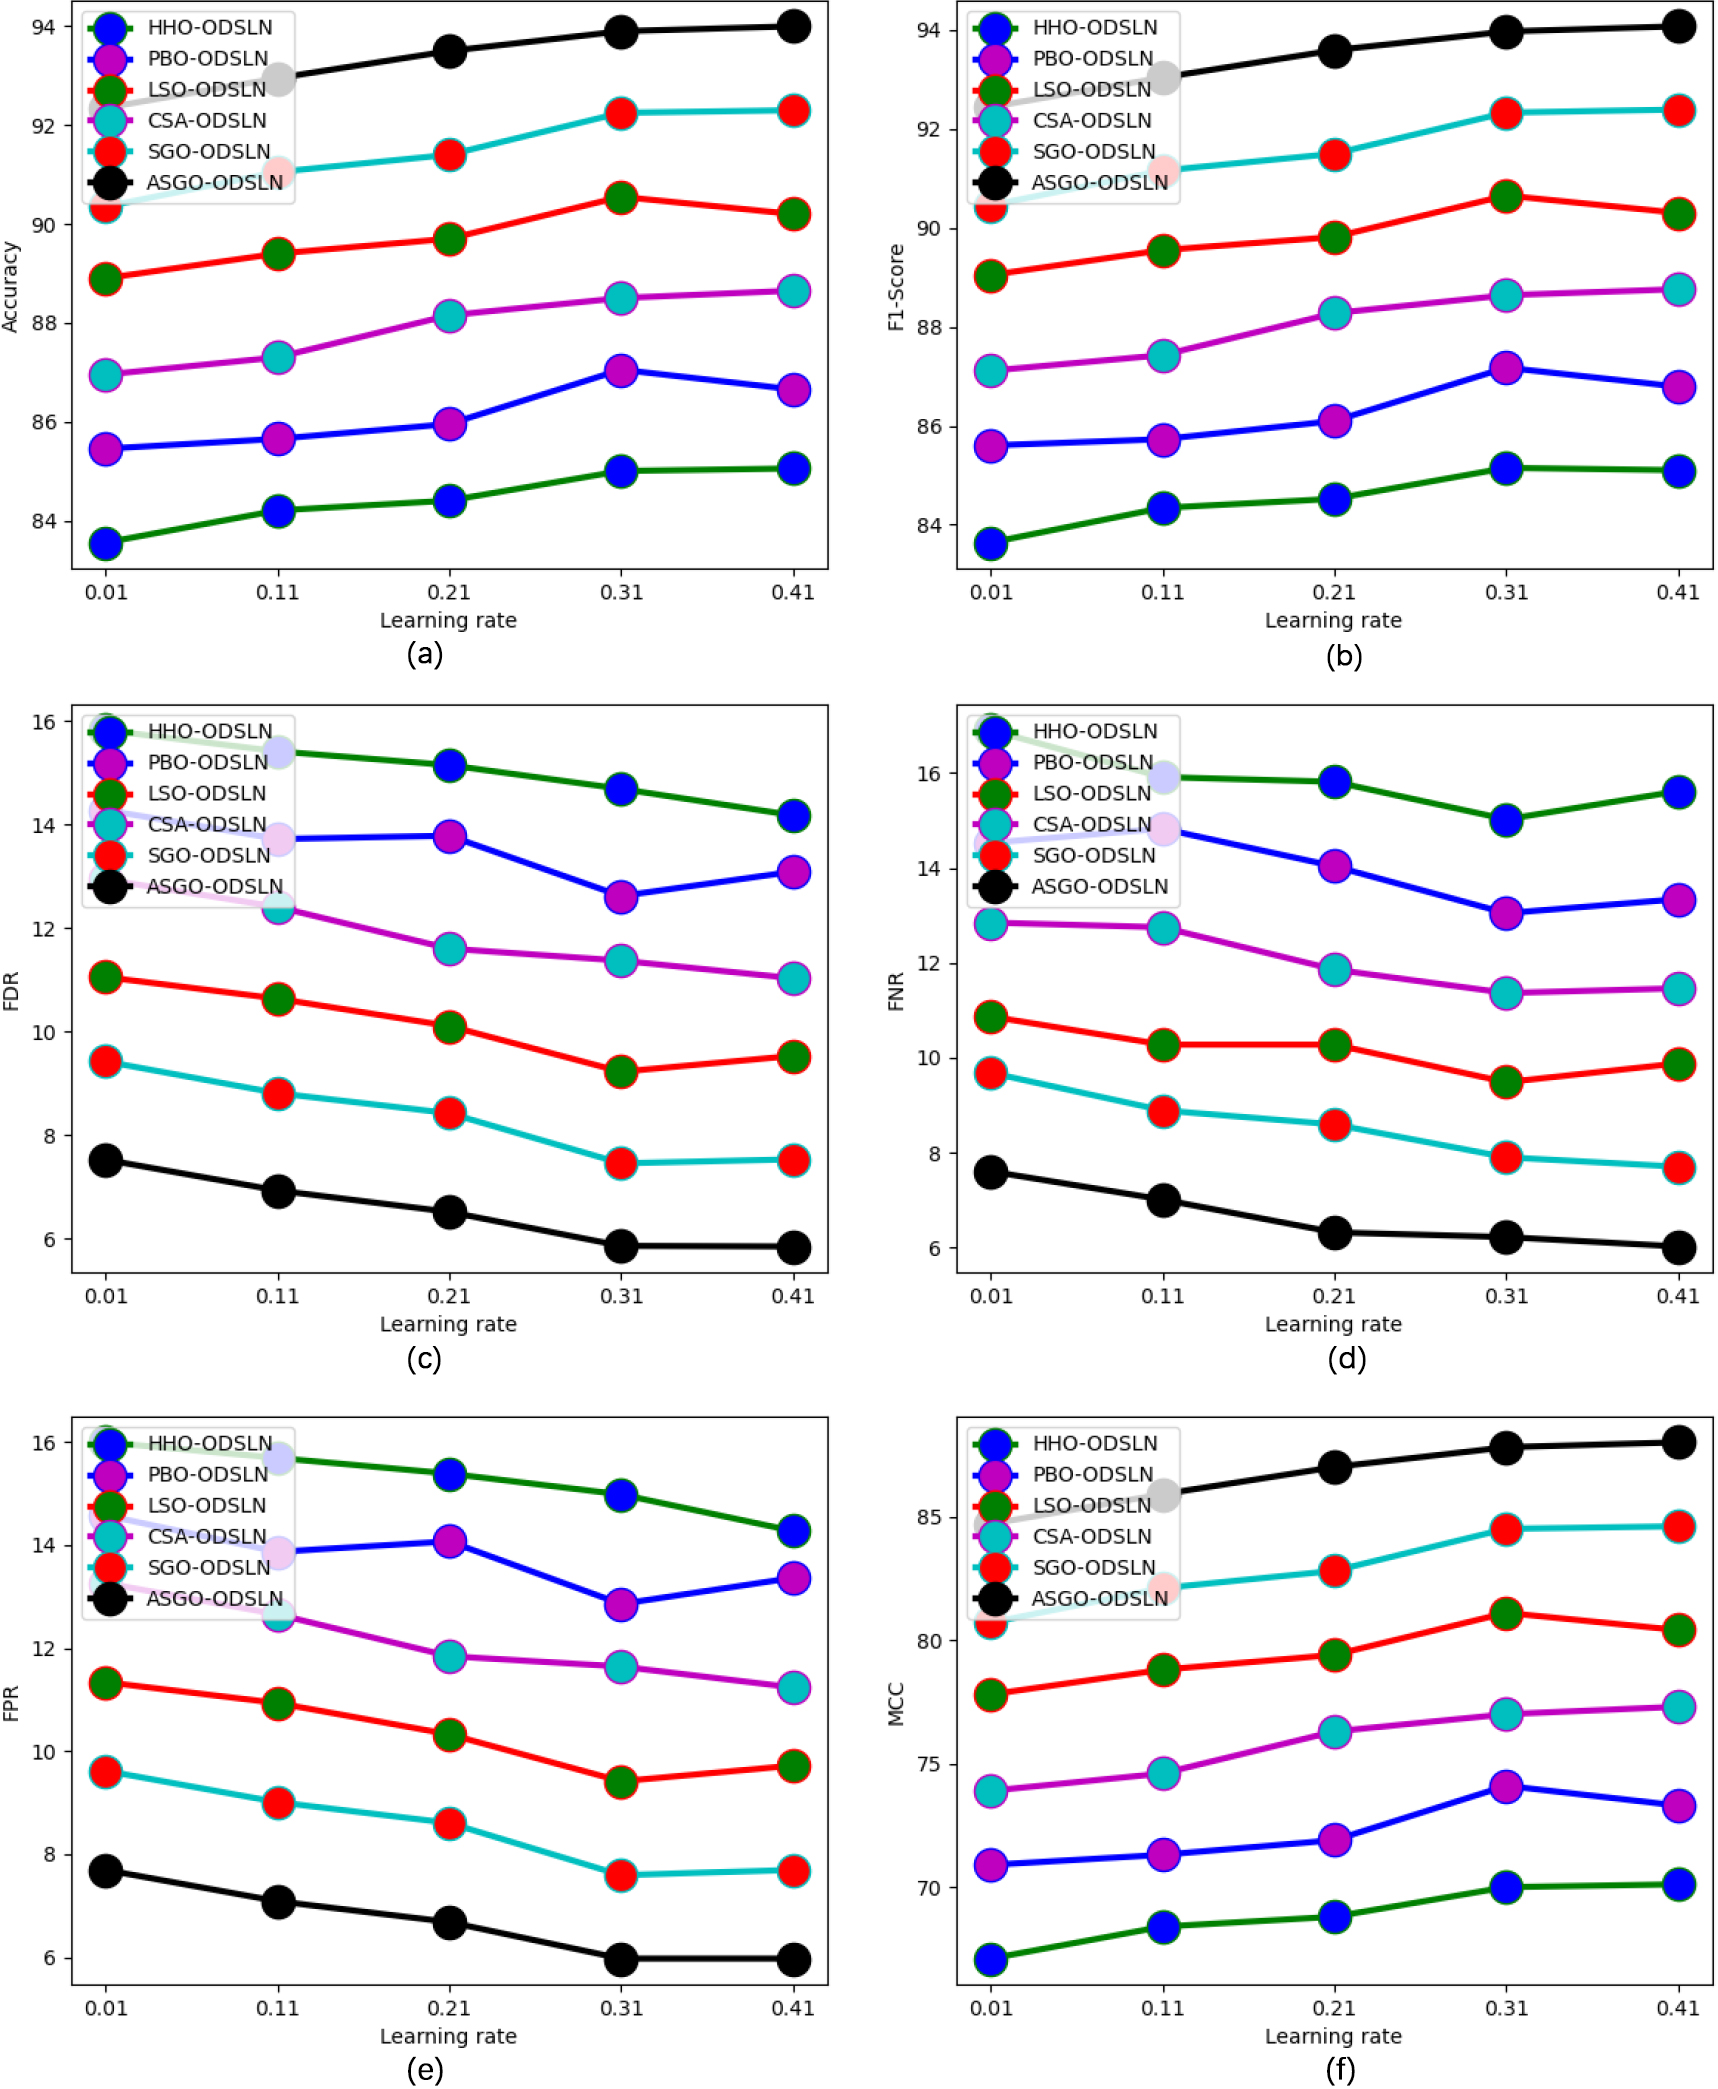
continued.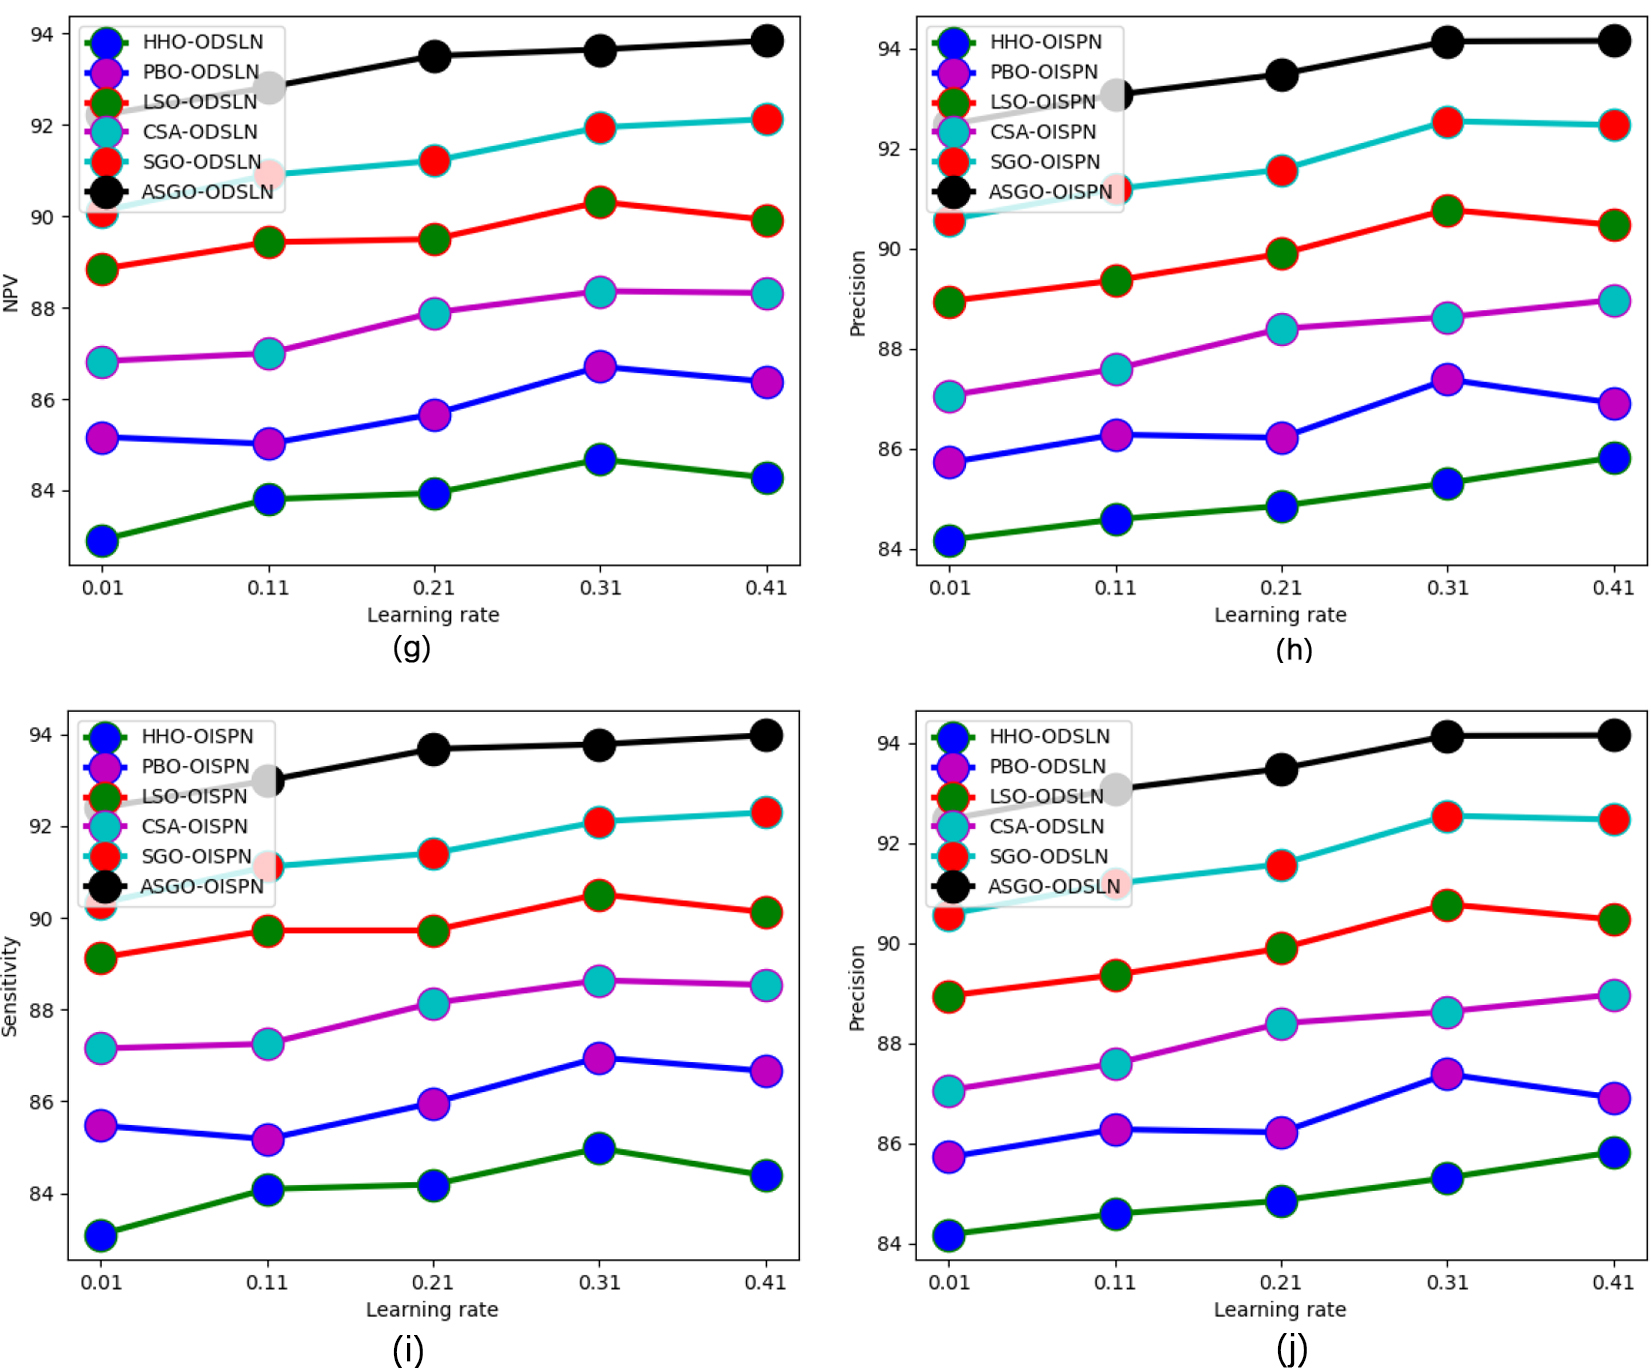
Performance analysis of the recommended economic evaluation of world cities when contrasted with the existing classifiers regarding “(a) Accuracy, (b) F1-score, (c) FDR, (d) FNR, (e) FPR, (f) MCC, (g) NPV, (h) Precision, (i) Sensitivity, and (j) Specificity.”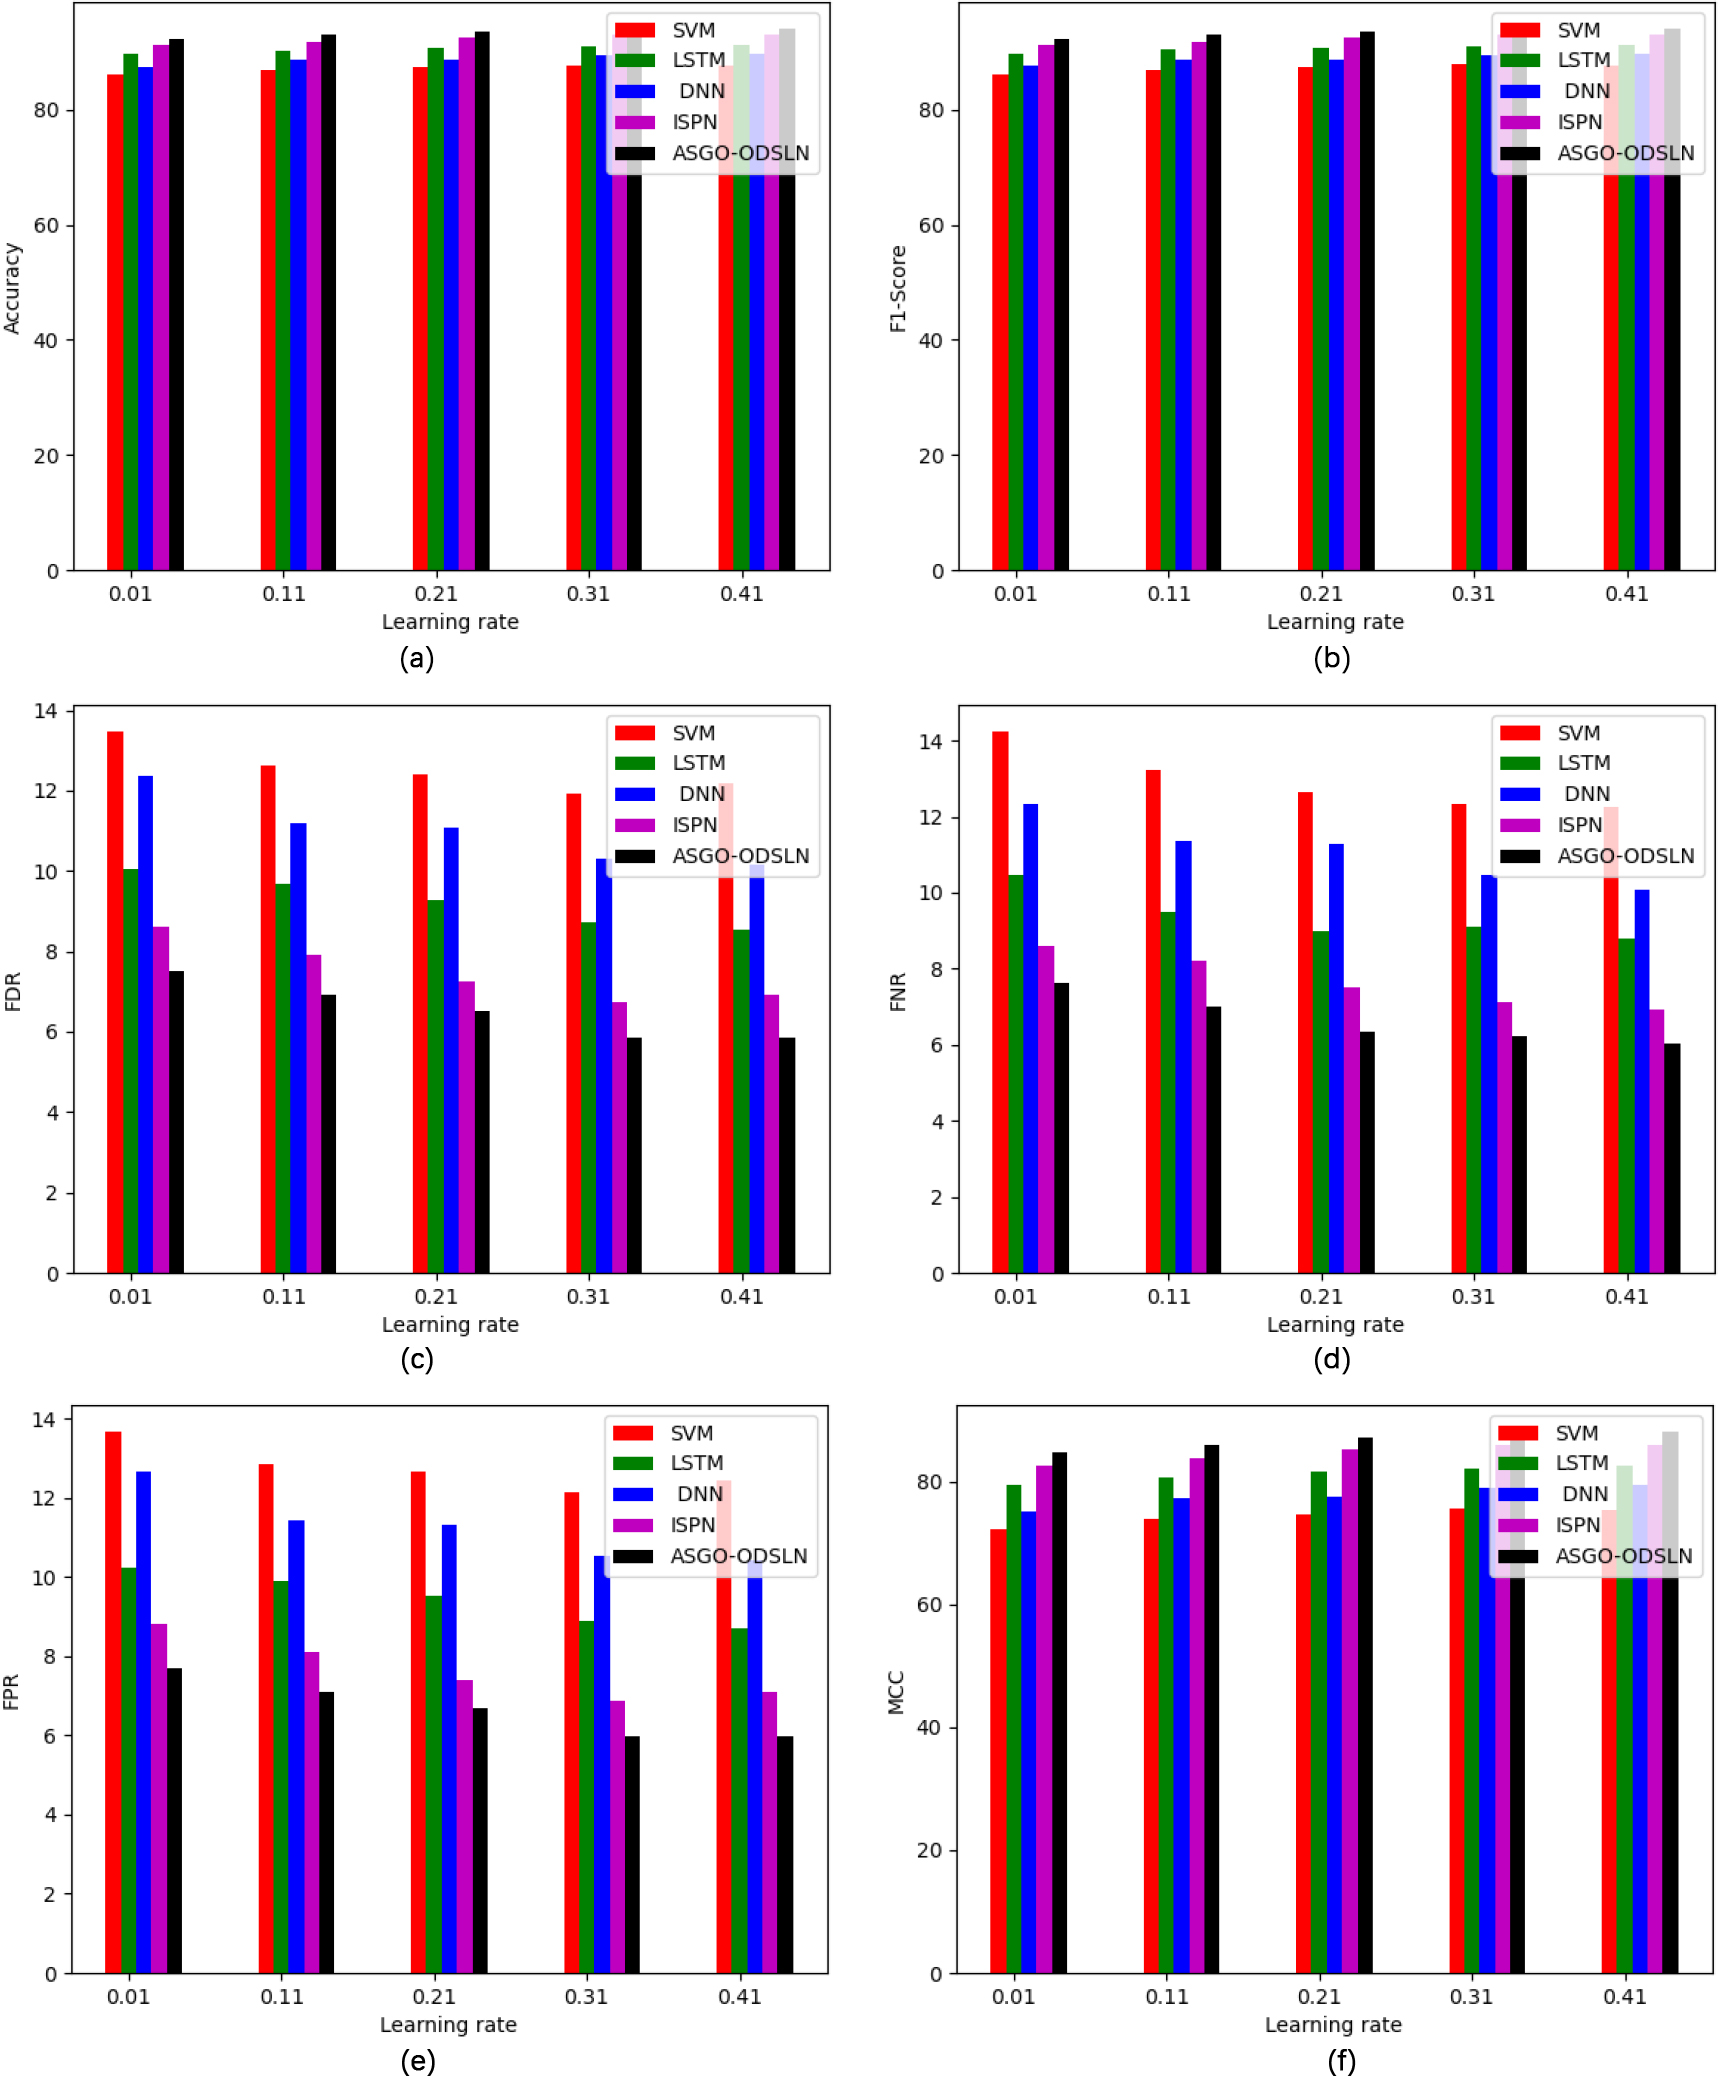
continued.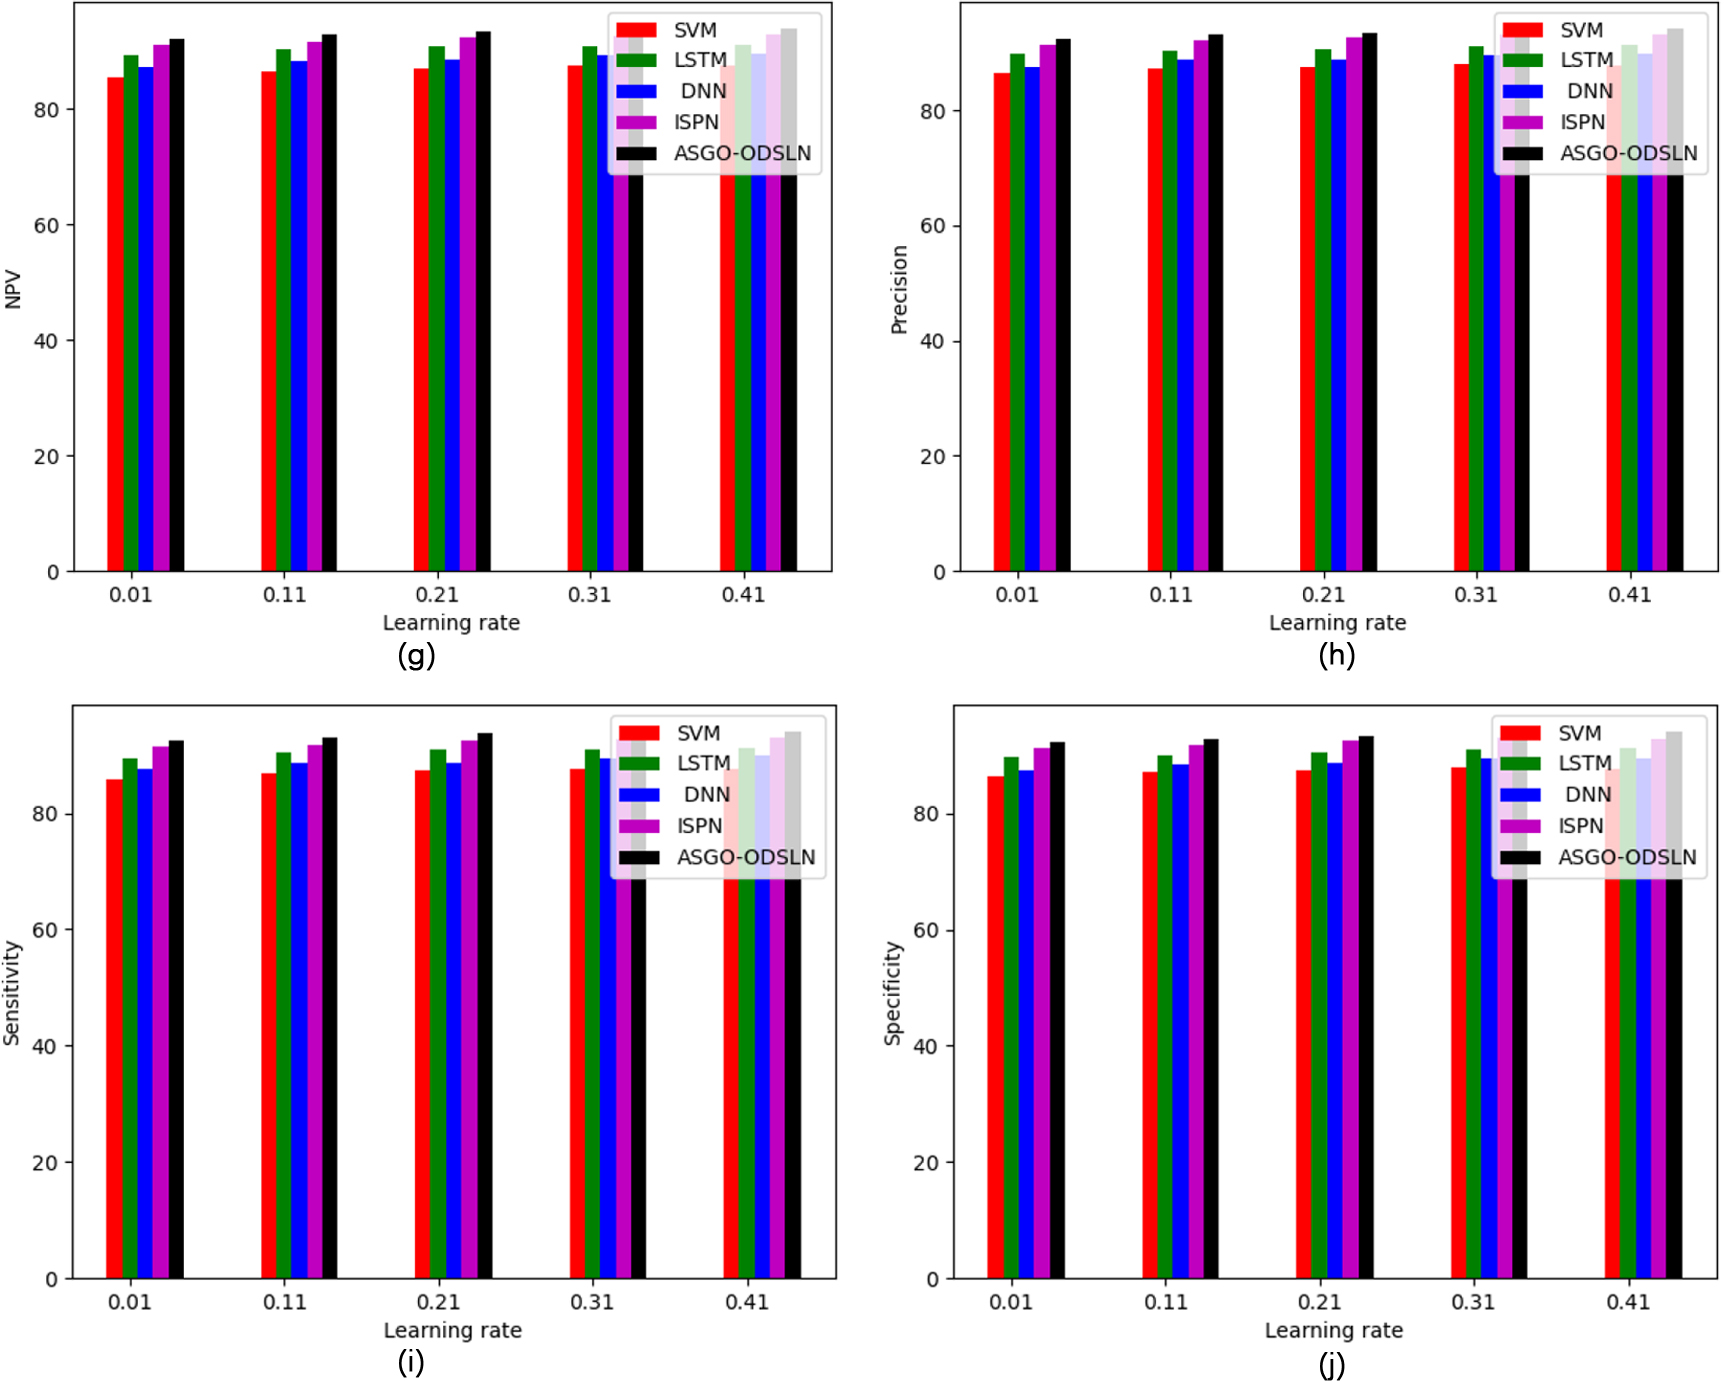
The comparative measurement of the recommended economic prediction model for the world cities compared with multiple optimization techniques and classifiers is shown in Tables 2 and 3 accordingly. The accuracy of the developed model is attained 94% when contrasted with the other traditional models. This confirms that the suggested model has better efficacy in predicting the economy of the world cities than the other models.
Statistical analysis of the recommended model over various optimization models
The statistical evaluation of the suggested model against various optimization techniques is shown in Table 4. The designed model is comparatively 7.81% better than HHO-ODSLN, 39.15% better than PBO-ODSLN, 12.22% better than LSO-ODSLN, 18.94% better than CSA-ODSLN, and 52.15% better than SGO-ODSLN algorithms, correspondingly when taking the best measure. Hence, the outcomes show that the suggested model outperformed the other existing models.
Estimation analysis of the developed model using recent methods
The comparative analysis of the developed ASGO-ODSLN model is validated and compared with recent methods, and the outcomes are shown in Table 5. The developed model shows 7.7%, 5.2%, 3.5%, and 1.2% better performance than FuzzyNet, GrrNet, Mask R-CNN, and PPSF-BODL. The simulation outcome shows superior performance than the existing approaches.
Comparative analysis of the developed economic evaluation of world cities against distinct algorithms
Comparative analysis of the developed economic evaluation of world cities against distinct algorithms
Comparative analysis of the developed economic evaluation of world cities against distinct classifiers
Statistical analysis of the developed economic evaluation of world cities with optimization model over distinct algorithms
Overall performance analysis of the developed model using recent approaches
The advantages of the developed model are listed here in the following section. The developed ASGO algorithm is utilized for the purpose of enhancing the feature propagation process. Thus, this algorithm helps to resolve complex optimization issues that arise in the prediction of the economy of the world cities. It helps in providing only the crucial and significant information to the prediction stage without losing the essential data and thus helps in a faster and easier prediction process. Moreover, the developed ODSLN model tries to solve the overfitting issues. Here, the developed model has the capability to predict accurate economic analysis even from a larger amount of data. This is proved by the validation that provides effective outcomes using the standard performance measures.
Conclusions
The framework of developed economic evaluation of world cities with the ISGO model has been implemented successfully. At first, the required economic data were gathered from standard websites. The collected data for the prediction were then given to the pre-processing phase. The pre-processed data was fed as input to the optimal feature selection phase. The attributes were optimally chosen by the developed ASGO algorithm. For the prediction process, the ODSLN model was developed to offer a better prediction of economic data. The parameters in the ODSLN system were optimized by the recommended ASGO algorithm. The efficiency of the recommended system was estimated with the support of several validation measures against several classical models. Thus, the research findings displayed that the developed system has higher efficacy than the other traditional systems in predicting the economy of the world cities. However, the developed model faces a few limitations. While training a large amount of data, the computational burden was higher than the existing approaches. The economic data for the given developed model needs to apply to all cities and mountainous countries with the purpose of providing the characteristics of ecological and socioeconomic. In future work, various ensemble models will be adopted for analyzing the economy in the smart city. Additionally, the developed model will be focused on evaluating the economic analysis of smart cities in India. Especially, we will apply our economic data to all cities and mountainous countries which will help to enhance the efficacy of the developed model.