
Abstract
High-quality content for the user in video streaming services depends critically on the ability to predict the continuous user’s quality of experience (QoE). However, continuous QoE prediction has proven challenging due to the complexity imposed by the temporal dependencies in QoE data and the non-linear correlations among QoE impact elements. In this research congestion prediction model is developed using the prime herder optimization-based BiLSTM (PHO-based BiLSTM). The input database is first gathered from the NIMS and darpa99 week 1 database and, the data collection is analyzed and the packet information is extracted after that the extracted features are then fed into the optimized BiLSTM classifier to train the classifier. The classifier’s hyperparameters are successfully tuned by the recommended prime herder optimization, which is made by fusing the herding characteristics of a prime sheepdog and herder optimization. Based on the traffic congestion prediction achievements, at training percentage (TP) 90, the accuracy is 94.81%, specificity is 94.90%, and mean square error (MSE) is 4.91 respectively for D1, similarly based on D2 the accuracy is 95.62%, specificity is 95.96%, and MSE is 0.38 respectively.
Keywords
Introduction
Between 2017 and 2018, there was a 65% increase in live video streaming usage, and the recent pandemic scenario contributed to further development by promoting the streaming of significant events. Since 2017, YouTube has made it possible for the general public to livestream content, and it is frequently utilized for sporting events, concerts, and video games [1, 2]. A recent study predicts that by 2022, video traffic will account for more than 80% of all internet traffic [3]. For application developers and service providers, the OoE of video streaming continues to be the key priority. In the current network, packet loss and limited bandwidth still affect video transmission [4]. Due to bandwidth restrictions, the poor quality image might be transmitted. Depending on whether video traffic is streaming in a reliable or unreliable manner, packet loss might result in various outcomes like re-buffering, performance reduction, or mosaic. Such unfavorable conditions are detrimental to QoE [5]. Over the past few years, the popularity of on-demand video streaming over HTTP has increased substantially.
Given this enormous increase in video traffic, network service providers must carefully and optimally employ the resources available for streaming videos while preserving an appropriate level of QoE for video users [6, 7]. Utilizing multipath transmission offers yet another way to improve QoE also concurrent access to heterogeneous networks (WIFI and 4G) is made feasible by mobile devices having multi-homed interfaces. Reliable pathways are provided by data center networks for high availability issues. To lower the danger of internet failures, businesses would select a backup internet service provider [8, 5]. Transmission Control Protocol (TCP) is often used as the fundamental protocol for HTTP live streaming. Over network paths with long round-trip times (RTT), TCP is known to have insufficient throughput in the case where a receiver is geographically remote from the source of a live stream because of things like slow-start and congestion control [9, 10, 11, 12, 13].
Deep packet inspection (DPI) tools find it challenging to differentiate between live streaming and on-demand video because YouTube and other content providers use the same delivery infrastructure. The majority of commercial DPI equipment classifies traffic streams using DNS queries and SNI certificates, but they end up being identical for both live and on-demand video (for example, on YouTube) [1, 14, 15, 16, 17, 18]. Machine learning (ML), including deep learning (DL), empowers users by enabling them to comprehend network traffic behavior and patterns and to distinguish between regular and aberrant traffic has already made it possible to perform traffic analysis in a way that has the potential to revolutionize the industry [19, 20, 21, 22]. For instance, ML-based cyber security techniques have significantly aided in the detection of a variety of threats [9], including Distributed Denial-of-Service (DDOS) attacks with many classes. Consider a user-friendly network traffic flow classifier that would help network administrators identify the many web apps that are utilizing their networks [23, 24].
The research’s primary objective is to create a network traffic prediction model for online video streaming to enhance service quality initially, the input is gathered from the database the packet information is extracted from the data with congestion and the extracted features are fed forward to the BiLSTM classifier after that hyper parameters of the classifier are effectively tuned by the proposed PH0-based BiLSTM optimization.
Prime herder optimization: Prime sheepdog and herder optimization are typically hybridized to create PHO. The herding behavior of the herder includes safeguarding the sheep to reach the optimal solution in this case to improve the security to reach the desired optimal solution hybridization is performed which provides faster convergence and reduces the time complexity. PHO-based BiLSTM: BiLSTM can predict traffic congestion with less complexity and is successfully tuned via prime herder optimization, which also reduces the overfitting issue.
The manuscript is separated into sections following its structure, with Section 2 describing modern works, their methodologies, and their challenges, using deep neural network modeling and prime herder optimization, Section 3 offers an efficient congestion prediction model. In Section 4, the suggested prime herder optimization is displayed, and Section 5 discusses the results.
The accuracy of the traffic congestion prediction model has been the subject of numerous studies however these limitations have motivated us to create a new model because the model’s shortcomings, such as overfitting, have not been resolved. It is feasible to emphasize the necessity for the development of a traffic congestion prediction model by referencing the literature review’s list of advantages and disadvantages of the current models.
Literature review
Context-aware temporary holding of video segments with virtualized content caching capabilities is used to solve the issue at the mobile edge, according to a technique provided by Chang Ge et al. [9] when compared to the traditional E2E scheme, this technology greatly reduces startup time and lives stream latency, eliminates buffering, and provides a high level of assurance for the QoE of live receivers.
A network of cascaded Long short-term memory (LSTM) blocks was utilized by Nagabhushan Eswara et al. [7] to represent the complex temporal correlations and nonlinearities found in time-varying QoE. The mean and median continuous QoE pooling techniques are beneficial for assessing the users’ overall QoE, according to performance analysis of QoE predictions, but the LSTM-QoE model created for wireless networks does not yet support real-time video streaming.
The Bottleneck bandwidth and round-trip propagation time (BBR) congestion control technique was created by Songyang Zhang et al. [5] and when BBR flows compete for bandwidth resources, it causes a high packet loss rate and a significant transmission delay. The results reveal that this model outperformed others in terms of transmission delay and packet loss rate while also achieving maximum throughput and reducing end-to-end latency, which was a previously unsolved issue.
The Google congestion control (GCC)-model, an adaptive low-latency congestion control that maintains performance at a high level under a variety of network conditions, was created by Leilei Wu et al. [25]. They considerably reduced the amount of unnecessary bit rate rollbacks from a small delay fluctuation between zero and the maximum of the required function, even if irrelevant rollbacks show GCC’s problem with a misjudgment and cause difficult video quality degradation for customers.
A method for evaluating the Quality of Service (QoS) of the encrypted YouTube Live service was developed by Luis Roberto Jimenez et al. [26] using packet-level data collected at wireless network interfaces. In addition to contrasting S-KPI estimations with terminal agent measurements taken under various network conditions the network emulator introduced, the analysis of the collected data has revealed a substantial link between average session throughput and model evaluation.
The differentiated rate control data collection (DRCDC) technique was developed by Jiawei Tan et al. [27], which lowers the distortion rate of the information obtained by the network while minimizing network congestion by selectively reducing the data that contains less information.
Using both supervised and unsupervised learning, Labayen et al. [28] created a method for categorizing user activities from network information. The system makes the benefit of network behavior to categorize user activity, although intrusion detection issues and the classification of traffic from legitimate applications and other virus types are still not quantified.
Duc et al. [29] created a Temporal Convolutional Network (TCN) based model for predicting QoE that incorporates the characteristics of sequential data and takes advantage of TCN’s benefits to reduce computing complexity while at the same time simultaneously increasing the prediction accuracy.
Challenges
The research encountered the following challenges:
Due to the implementation of DNS over HTTPS (DoH) Domain Name System Security Extensions (DNSSEC) [1], finding video traffic is particularly difficult because even this data might not be sent to a network administrator. The auto-correlation is unable to identify the periodicity for a sample of YouTube live streaming because of changing network circumstances. Additionally, user-activated actions like trick-play for VoD appear to change the time-trace signal, misclassifying the signal as a live stream [1]. QUIC flows offer extra difficulties, particularly for real-time video feeds because HTTP/2 Modern networks transfer data using secure application-layer protocols and dynamic ports, making it challenging for network administrators to identify online apps using traditional port-based procedures [24]. Classifying network traffic has become more difficult as a result of the new security requirements for contemporary networks, such as packet encryption and port obfuscation [24].
The main aim of the research is to develop and construct a network traffic prediction model for online video streaming to improve service quality. The following is a list of the steps in the proposed method.
The network traffic congestion system’s proposed input info was collected from the network information management and security group (NIMS) and Darpa99week1database. The data set is examined, and packet data including total forward packets (TFP), total backward packets (TBP), a total length of the forward packets (TLFP), the total length of the backward packets (TLBP), size of the packets (SP), flow bytes per second (FBPS), flow packets per second (FPPS), Flow IAT min (FIM), Flow IAT total (FIT), Flow IAT max (F1M), FIN flag count (FFC), SYN flag count (SYN), PSH flag count (PFC), ACK flag count, URG flag count, ECE flag count, sub-flow forward packets (SFFP), sub-flow bytes (SFB) are extracted from the data with congestion. The improved BiLSTM classifier is fed forward with the extracted features to train the classifier. The proposed prime herder optimization, which is created by combining the herding traits of shepherd and Border collie dogs, successfully tunes the classifier’s hyperparameters. In predicting network congestion, the data from the live video streaming is now fed forward to the trained BiLSTM classifier.
Schematic representation of the congestion prediction model.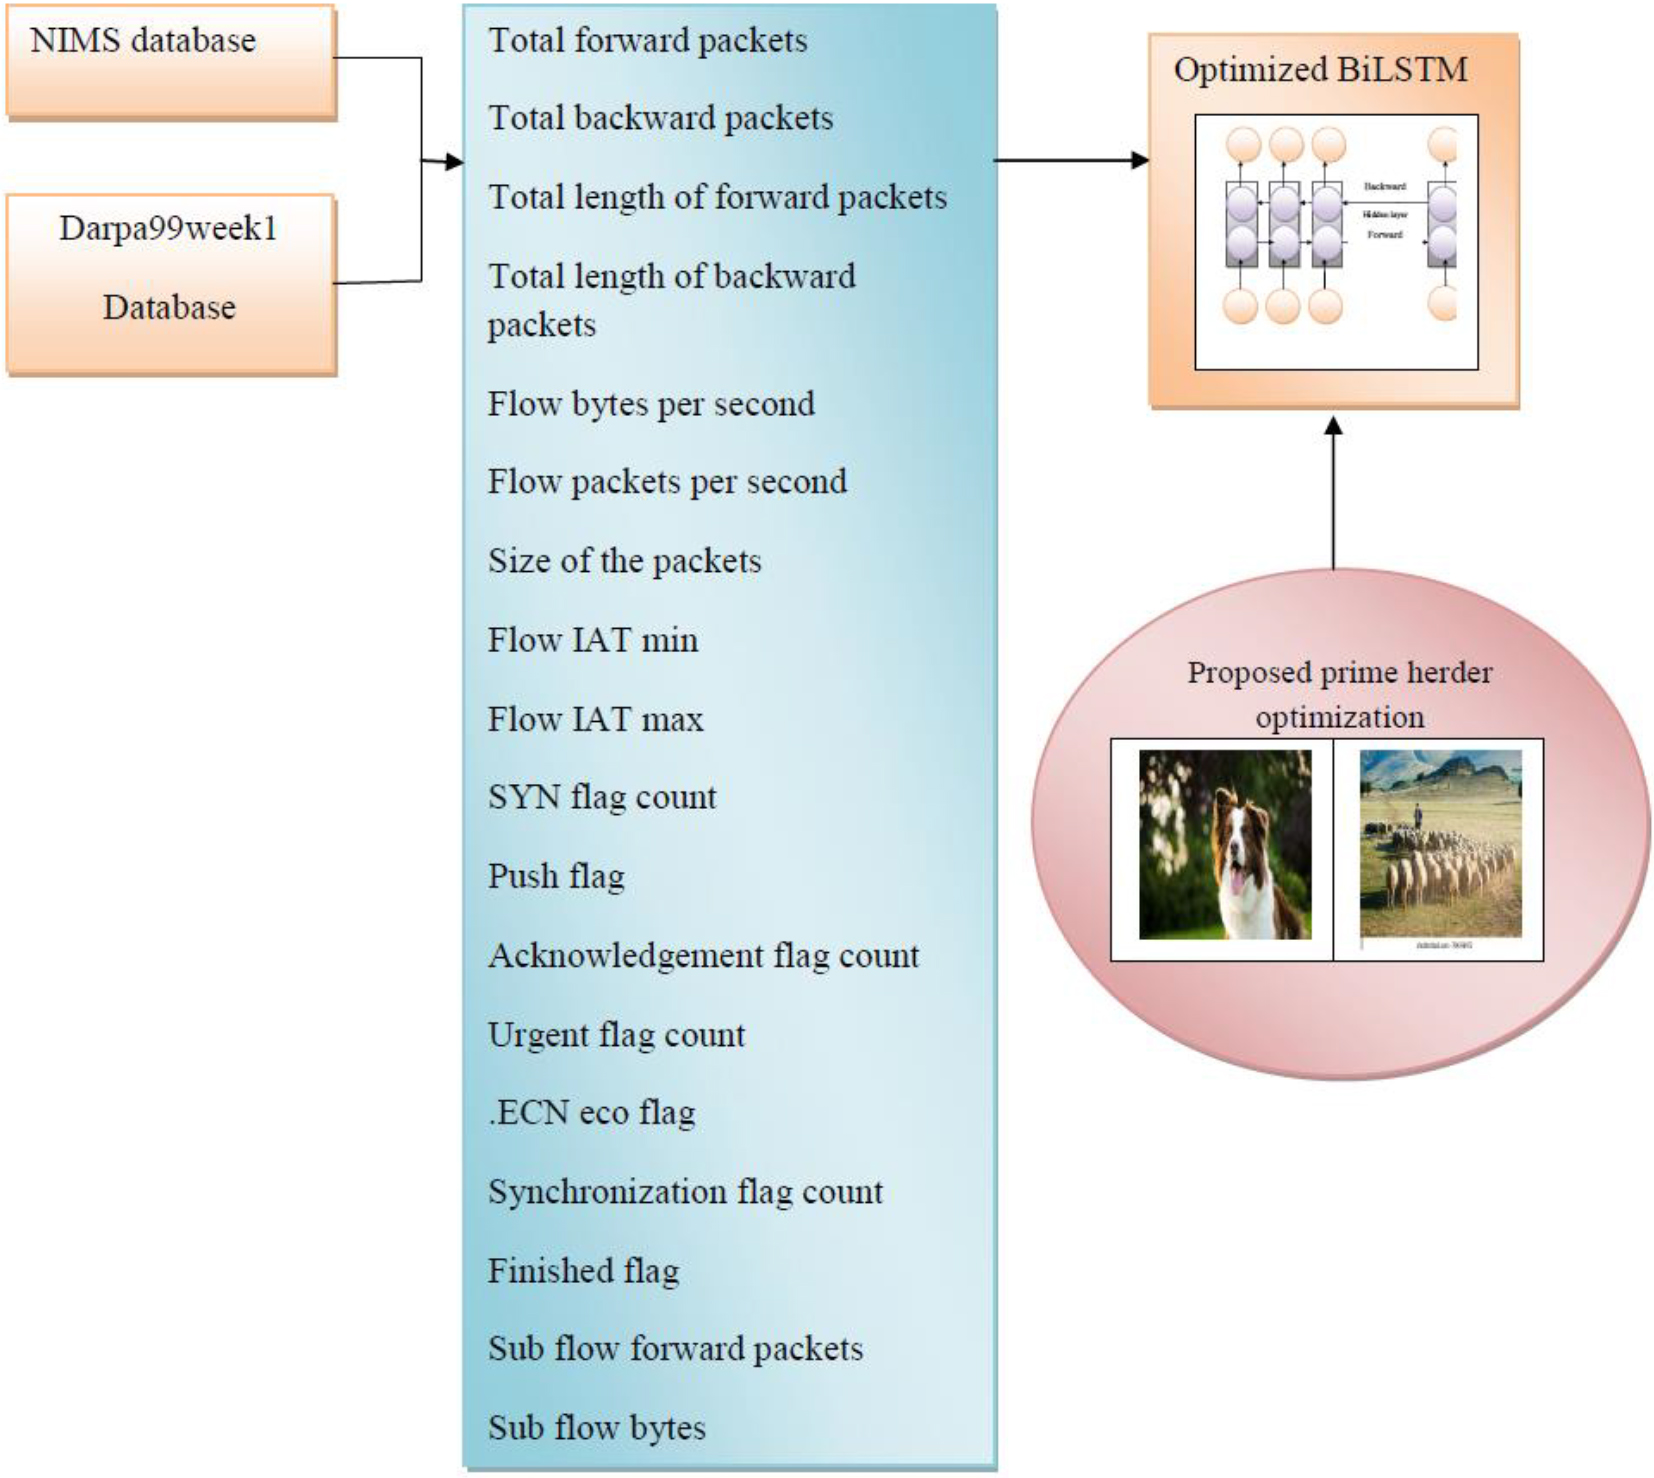
The NIMS and the Darpa99week1database serve as the input for the network congestion system, it has the following mathematical expression
In this instance,
The forward packets encircle the whole packets transmitted in the forward direction Packet forwarding is a straightforward process of routing incoming packets to their designated recipients. Total forward packets unit of measure (UOM) is represented as
Total backward packets
Total packets in the backward path are referred to as backward packets which only refer to the back warding of incoming packets since time series bytes are only transported by outgoing packets. Total forward packets UOM is represented as
Total packet length for forwarding
Total size of the forward-directed packet, total length of forward packets UOM is represented as bytes
Total length of the backward packets
The total size of packets in the reverse direction encloses the entire length of forward packets. The unit of measure for the total length of forward packets is represented as bytes. Total packet size in the reverse direction, total length of forward packets UOM is represented as bytes
Flow bytes per second
A flow is a collection of unidirectional packets with common source and destination attributes in networking terms, by using the flow protocol, network devices can gather data on these attributes and transmit the compiled data to the collector.
Flow packets per second (PPS)
PPS is a unit of transmission measurement used for network equipment like switches, routers, and bridges only when all packet sizes are uniform then it is an accurate measurement. Suppliers frequently rank their products based on PPS, but make sure comparisons are made using the same packet sizes.
Size of the packets
An expression for measuring data transmission in terms of packets is a packet per second. Depending on the application, these packets might have a range of sizes, divide the packet size in bytes by the transfer rate, and the number of packets per second is calculated in bytes per second.
Here
The flow inter-arrival time flows in both directions and is defined as the mean value of the flow IAT. The flow’s inter-arrival time’s minimum value (in both directions) is said to be flow IAT min. Backward Packets describe the rate of the flow in bytes per second.
Flow IAT max
The distance between two packets transmitted in the forward direction is measured by the forward IAT Max. The Fwd IAT Min is the amount of time that elapses between two packets delivered in the forward direction. The time between two packets transported backward, also known as the reverse inters arrival time Mean. Number of packets moving ahead that have at least one byte of TCP data payload.
Synchronization flag count (SYN)
A three-way handshake is established between two hosts using the synchronization flag. This flag should only be set in the first packet sent or received by either party. A three-way handshake is seen in the Fig. 2 below.
illustrative representation of a three-way handshake.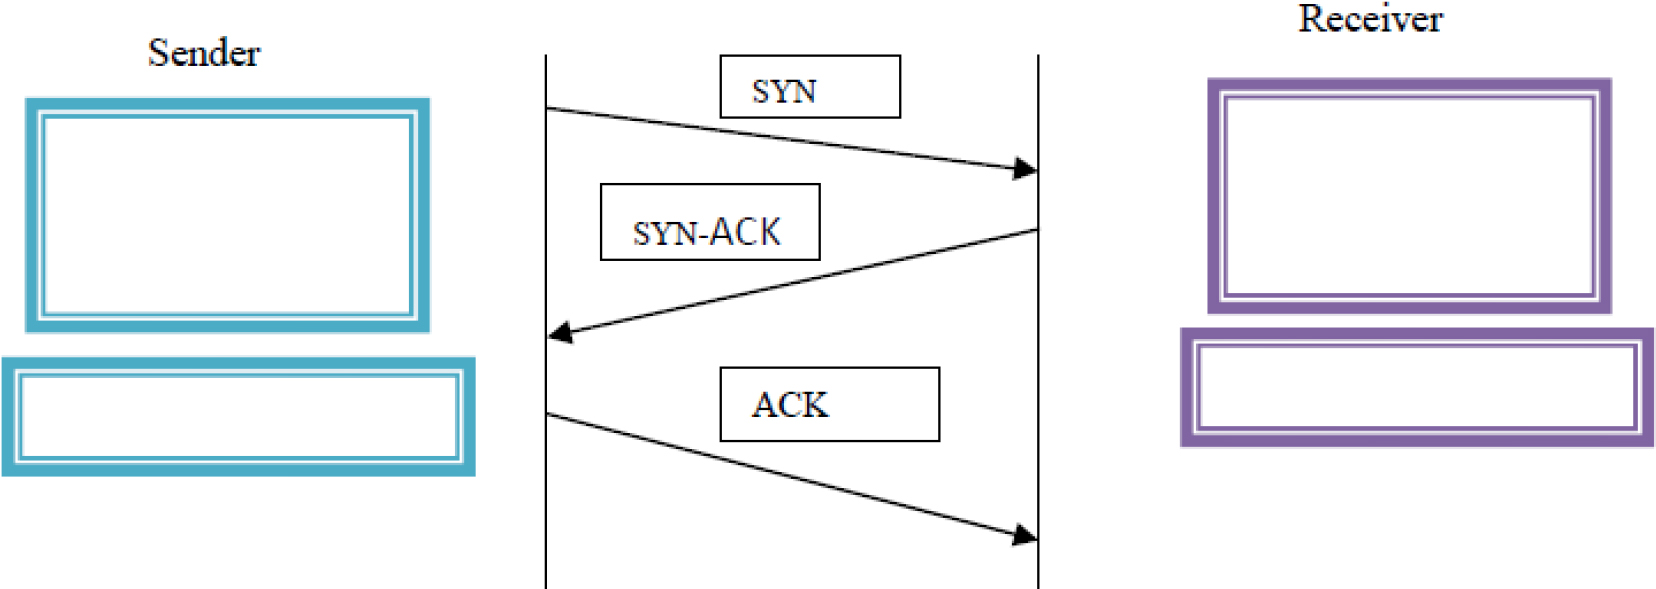
The push flag instructs the receiver to handle these packets as they are received rather than buffering them, and it is analogous to the URG flag. Usually, the transport layer waits until the application layer has sent enough data following the maximum segment size, by default, to reduce the amount of packets that are sent across the network but for other applications, including interactive applications, this is not ideal. This issue is resolved by utilizing Push, which also ensures that the data segment is handled correctly and given the proper priority at both ends of a virtual connection. When a host delivers data, it is temporarily queued in the TCP buffer, a unique region of memory, until the segment has grown to a specific size, at which point it is transferred to the recipient by establishing several segments yet integrating them into one or more bigger ones, this design ensures that the data transfer is as rapid and bandwidth-free as feasible. The segment is inserted into the TCP incoming buffer when it reaches the receiving end before being forwarded to the application layer. Until the additional segments arrive, the data queued in the incoming buffer will remain there. Once they do, the data is transferred to the application layer that is expecting it to avoid buffer deadlocks, and the final push flag is typically set on the final section of a file.
Acknowledgement flag count (ACK)
Bytes received by a peer are acknowledged by a packet with the ACK flag set. The other peer is informed of the most recent bytes received using this information along with the acknowledgment counter. After determining whether any packets have been lost, this information is utilized to evaluate whether the sender peer should retransmit the lost packets.
Urgent flag count (URG)
The receiver is instructed to process the urgent packets before processing any other packets using the urgent flag. The moment all known urgent data has been received, the recipient is informed to use the URG flag to indicate "urgent" data that needs to take precedence over non-urgent data. This information must be prioritized and, if necessary, sent to the application side out of order.
ECN echo flag (ECE)
Using the congestion Window lowered (CWR) signal in the TCP header, the data sender can warn the data receiver that the congestion window has been lowered, and the data receiver can be alerted to CE packets using the ECN-Echo (ECE) flag. To check whether both endpoints are ECN-capable during connection establishment, CN mandates three novel aspects of feature negotiation, the IETF receives various transport protocols for standardization, and it is necessary to decide what support is needed from them. This is especially true for unreliable or reliable multicast transport protocols.
Finished flag (FIN)
There is no further data from the sender according to the finished flag which is used in the sender’s final packet, which politely ends the connection and releases the reserved resources. The FIN flag always occurs when the final packets are sent and received between connections since it is used to terminate the virtual connections established with the previous flag (SYN). It is crucial to remember that when a host sends a FIN flag to terminate a connection, it can still be able to receive data until the remote host has finished doing the same; however, this only happens in specific situations. The buffers set aside on each end of the connection are released once it has been broken down by both sides.
Sub-flow forward packets
A main multipath TCP connection is the basis of a sub-flow, which is a standard TCP connection. The network operator creates automatic network rules that direct specific subflows across all of the available network interface cards (NIC). The end-to-end throughput is increased when the host has several NICs and the sub-flows are forwarded through them due to the sum of throughput. The plan is to use several switch ports to connect each NIC. The subflows are occasionally transmitted to the same path, nevertheless, when the host has just one NIC. Several subflows using a single network link are referred to as a “shared bottleneck” in these situations.
Sub flow bytes
TCP segment flows through a specific path, a component of a broader MPTCP connection which consists of one or more sub-flows through which an application can communicate between two hosts, is established and closed similarly to a standard TCP connection (MPTCP) an application socket and a connection have a one-to-one mapping.
Congestion prediction model using prime herder-based BiLSTM model
The extracted features are fed forward to the optimized BiLSTM classifier to train the classifier here large volumes of data are needed for model construction in neural network applications. Typically, the data is split into two sets: a set of test data for model validation and a set of training data for model calibration. The model is trained to do the specified action using the training data, which frequently contains the most observations. This information is used by a neural network to generate correlations between the various variables and learn the relationships between the inputs and outputs. The model’s validity is assessed using the testing data set, a distinct dataset that wasn’t used for model training. The bidirectional long-term associations between the time steps in a time series or sequence of data can be learned using a bidirectional LSTM (BiLSTM) layer of an RNN. These dependencies can help train the Recurrent Neural Network (RNN) utilizing the whole time series at each time step. The BiLSTM structure is split into two sections: the forward standard LSTM, which computes in the forward direction over time and produces
where gate activation function is denoted as
Architecture of BiLSTM.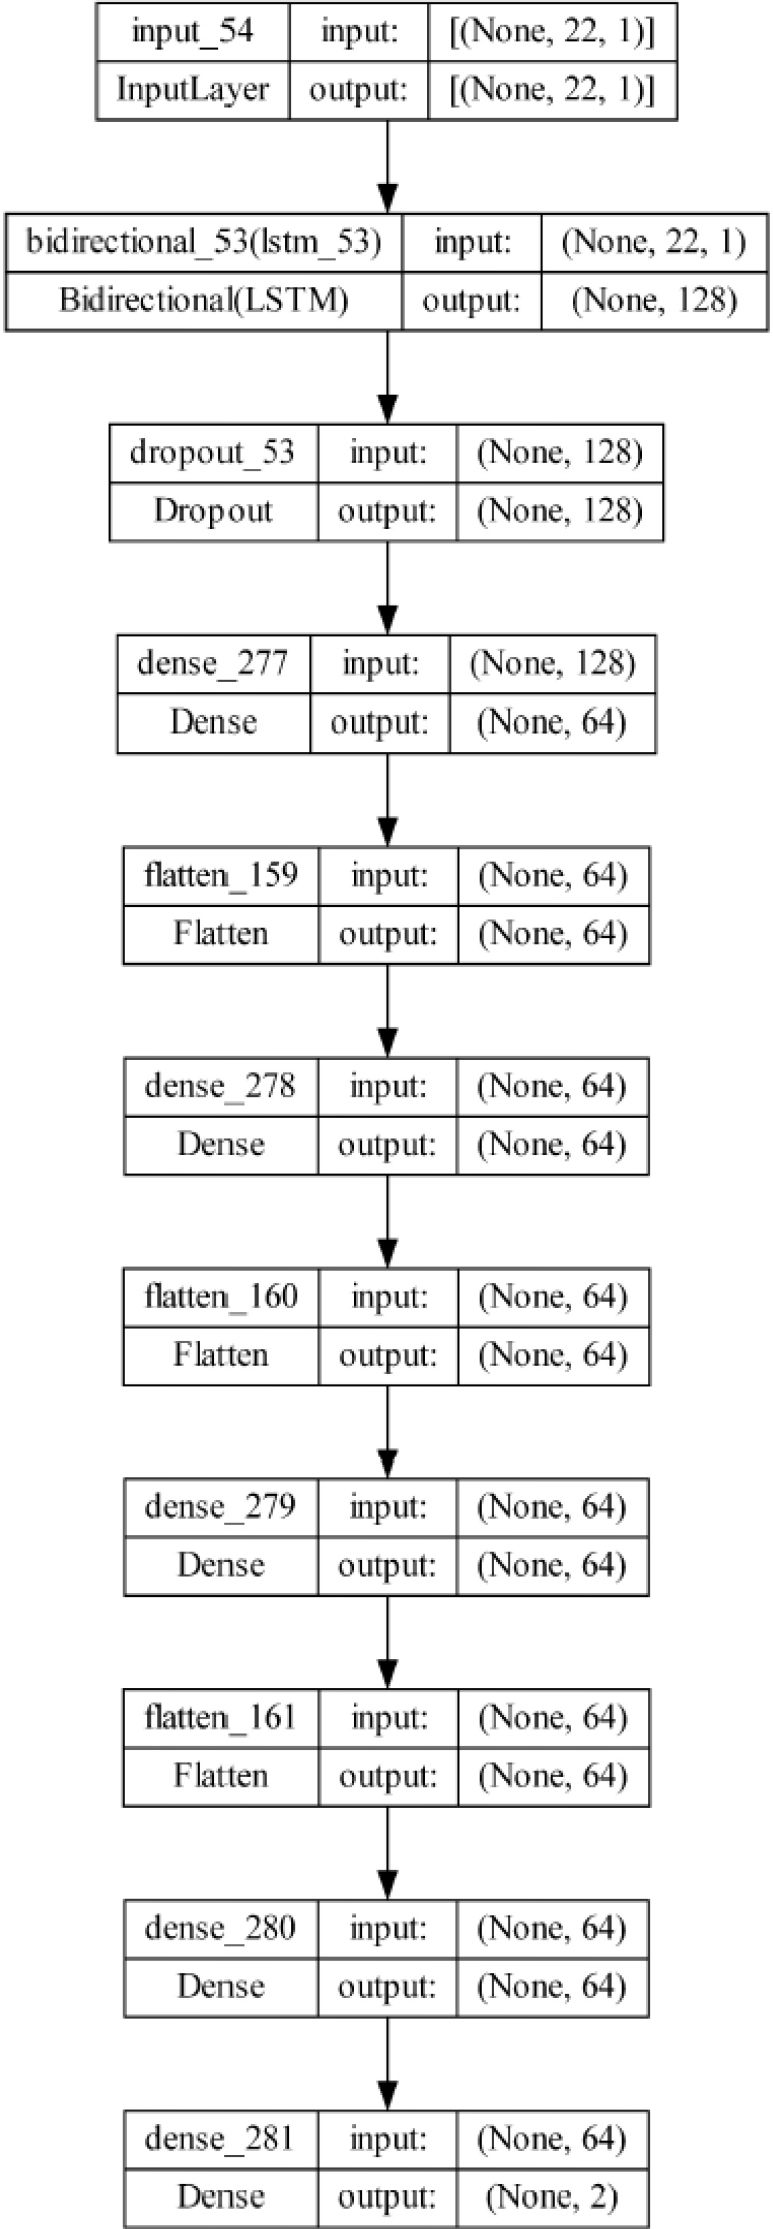
The BiLSTM classifier has PHO optimization turned on for fine-tuning the classifier’s parameters, which change the weights and bias until the desired outcome is attained. PHO optimization is created by conventionally fusing the Border collie [30] and shepherd optimization [31]. The herding behaviour of the herder includes safeguarding the sheep to reach the optimal solution in this case to improve the security to reach the desired optimal solution the characteristics of prime sheepdog optimization are hybridized with the herder optimization which provides faster convergence and reduce the time complexity.
Motivation
Prime sheepdogs are a breed of dog that is very athletic, bright, and trainable. They are also loving, intuitive, and energetic. These dogs typically live 12 to 15 years and are in good health and condition, hence creating a Meta heuristic algorithm based on their behavior because of their aptitude for assessing a situation and making adaptive decisions.
A new population-based Meta heuristic method called herder optimization (HO) is being used to study the development of multi-community. Before being separated into herds, each sheep is first sorted by its objective function (OF) value. The shepherds are then selected from among the sheep in each herd and are referred to as shepherds. The sheep in a herd with the highest objective function are also referred to as horses, so each shepherd has a mix of horses and sheep. By switching to one of the sheep and the horse, the shepherd can find his new location. The shepherd is leading the flock of sheep to the horse. This is done for two reasons: (i) switching to a less powerful agent leads to exploration, and (ii) switching to a more powerful member leads to exploitation. When the shepherd’s position is changed and the new OF is not worse than the previous OF, the process turns elitist.
Step 1: Population Initialization
In the search space, PSO starts with a randomly generated starting community member by utilizing the equation below.
where
Step 2: Shuffling phase
First,
Since each row of UT lists the members of each group, the individuals in the first column of UT are the most accurate representations of each community. The members of each category with the lowest incomes are those who are listed in the final column.
Step 3: Movement of community member
Each community member’s movement is calculated using a certain step size based on two vectors. The first vector illustrates the potential for making the search space
Here
This is the equation obtained by hybridizing the velocity and acceleration of the lead dog
According to the objective function value, the members
IT denotes the iteration and MIT denotes max iteration which is evident that
Step 4: Each community member’s position update
The new position is determined using calculations. If the position is not better than its prior objective function value, it will then be changed.
Step 5: Checking termination conditions
The optimization process is stopped according to a predetermined number of iterations.
Pseudo code for prime herder optimization
The PHO-based BiLSTM model is developed for predicting network traffic congestion model is implemented, after deployed, the model’s performance is compared to that of state-of-the-art models.
Experimental setup
Performance analysis based on TP using D1 a) Accuracy b) Specificity c) Error.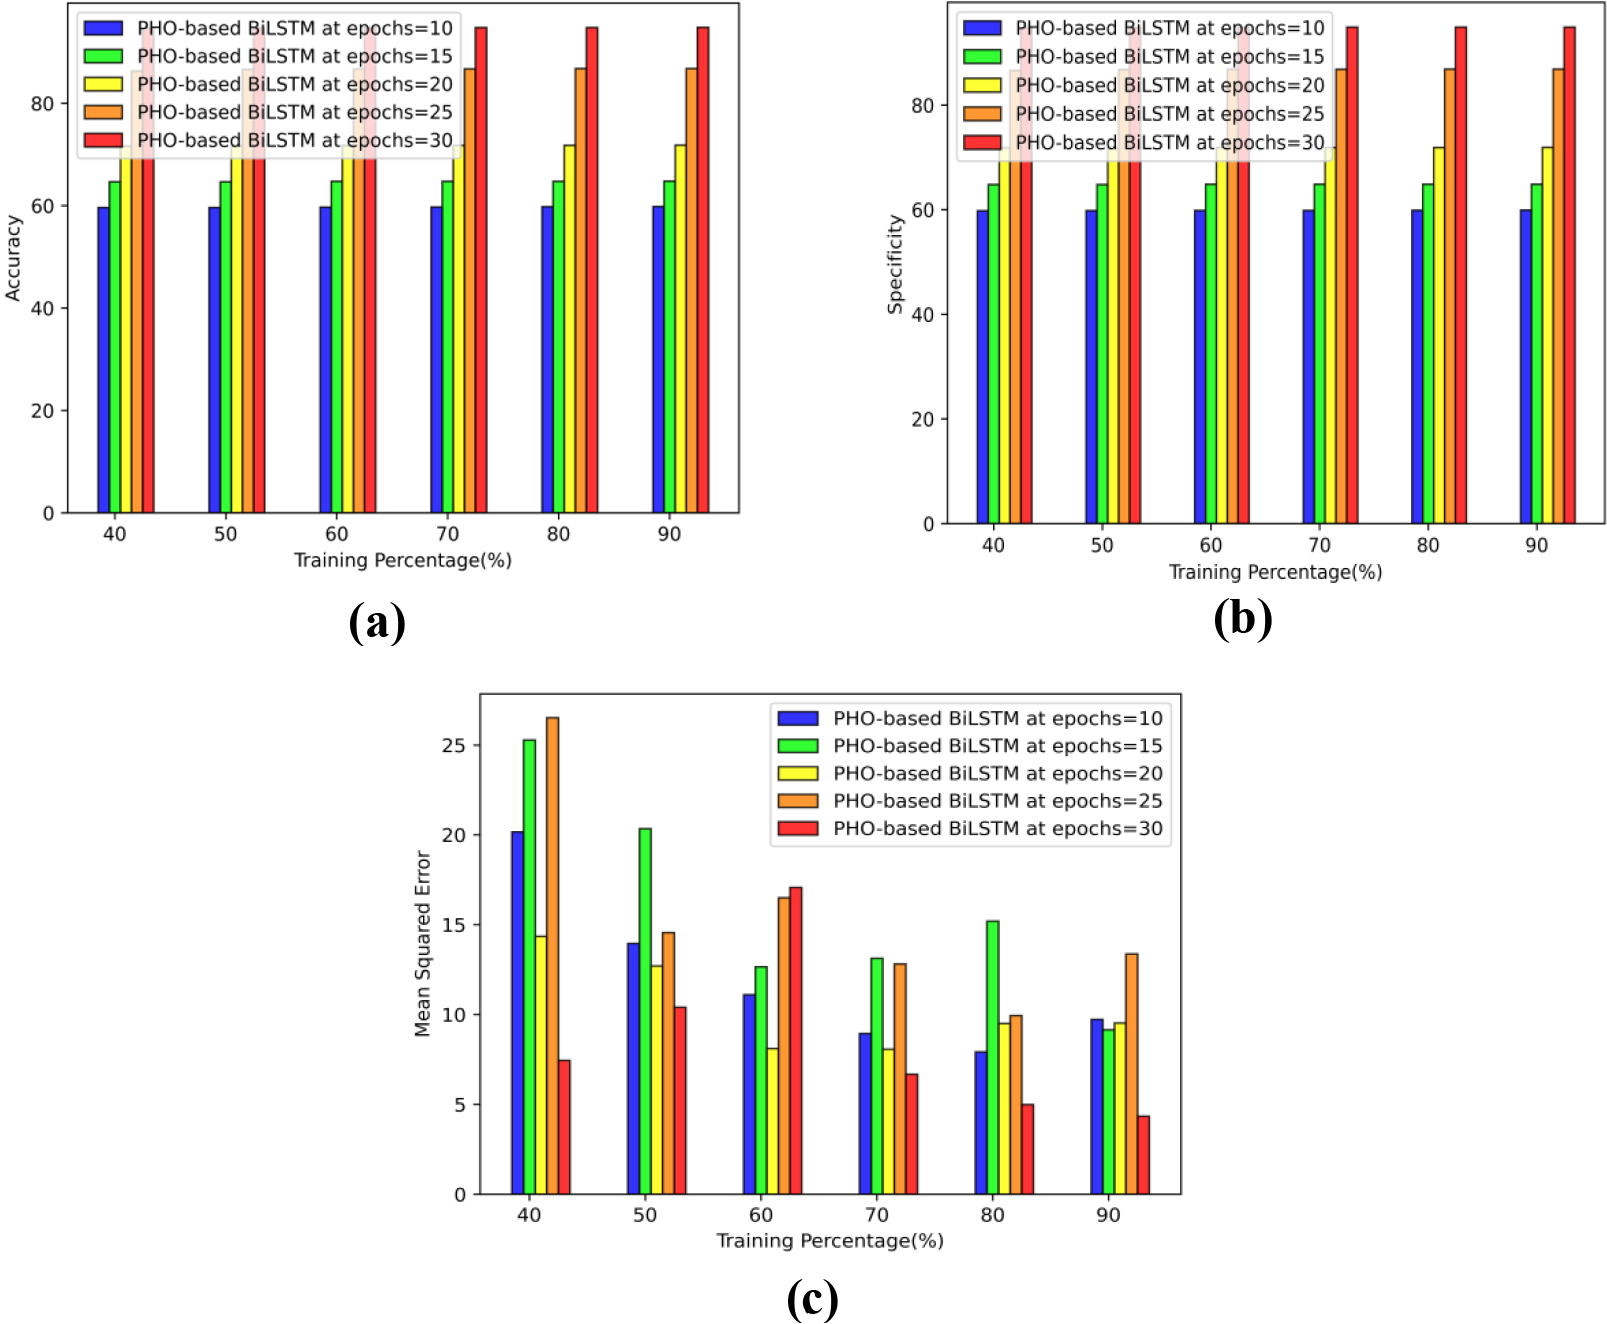
A PYTHON executing under Windows 10 with an internal capacity of 8GB is used to conduct the experiment based on the prediction of network traffic congestion.
NIMS and Darpa99week1 database
An IP communication between a source IP and a target IP is the basis of the Darpa dataset. Different attacks from various IPs are included in this dataset. dynode2vec: Scalable Dynamic Network Embedding is the source.
Performance measures
Accuracy
A classification model’s performance can be assessed using the metric of accuracy according to Eq. (20), accuracy is the percentage of accurately predicted and total predicted values that the prediction model predicts. This percentage can be calculated as follows:
Specificity (or true negative) is the proportion of actual negatives that were predicted to be negatives which indicates that there is a further percentage of true negatives that were predicted to be positive and may be referred to as false positives.
MSE is one of the best measures for evaluating regression the model can be assessed by averaging the square of the discrepancy between the expected values and the actual value displayed.
By utilizing the D1 and D2, The PHO-based BiLSTM model efficacy is assessed using the TP.
Performance analysis based on TP using D1
The results for the PHO-based BiLSTM in predicting congestion Fig. 4(a) shows the accuracy epoch values 10, 15, 20, 25, and 30 which generate values of 59.82%, 64.78%, 71.83%, 86.79%, and 94.84% while maintaining a TP of 90. Using epoch values of 10, 15, 20, 25, and 30 the findings obtained using the PHO-based BiLSTM are shown in Fig. 4(b). The results obtained are 59.90%, 64.88%, 71.91%, 86.88%, and 94.91%, respectively, with specificity TP of 90. Figure 4(c) demonstrates that PHO-based BiLSTM obtains minimum errors of 9.73, 9.15, 9.53, 13.37, and 4.34, respectively, even when the MSE over TP 90 Epoch values of 10, 15, 20, 25, and 30 are considered.
Performance analysis based on TP using D2 a) Accuracy b) Specificity c) Error.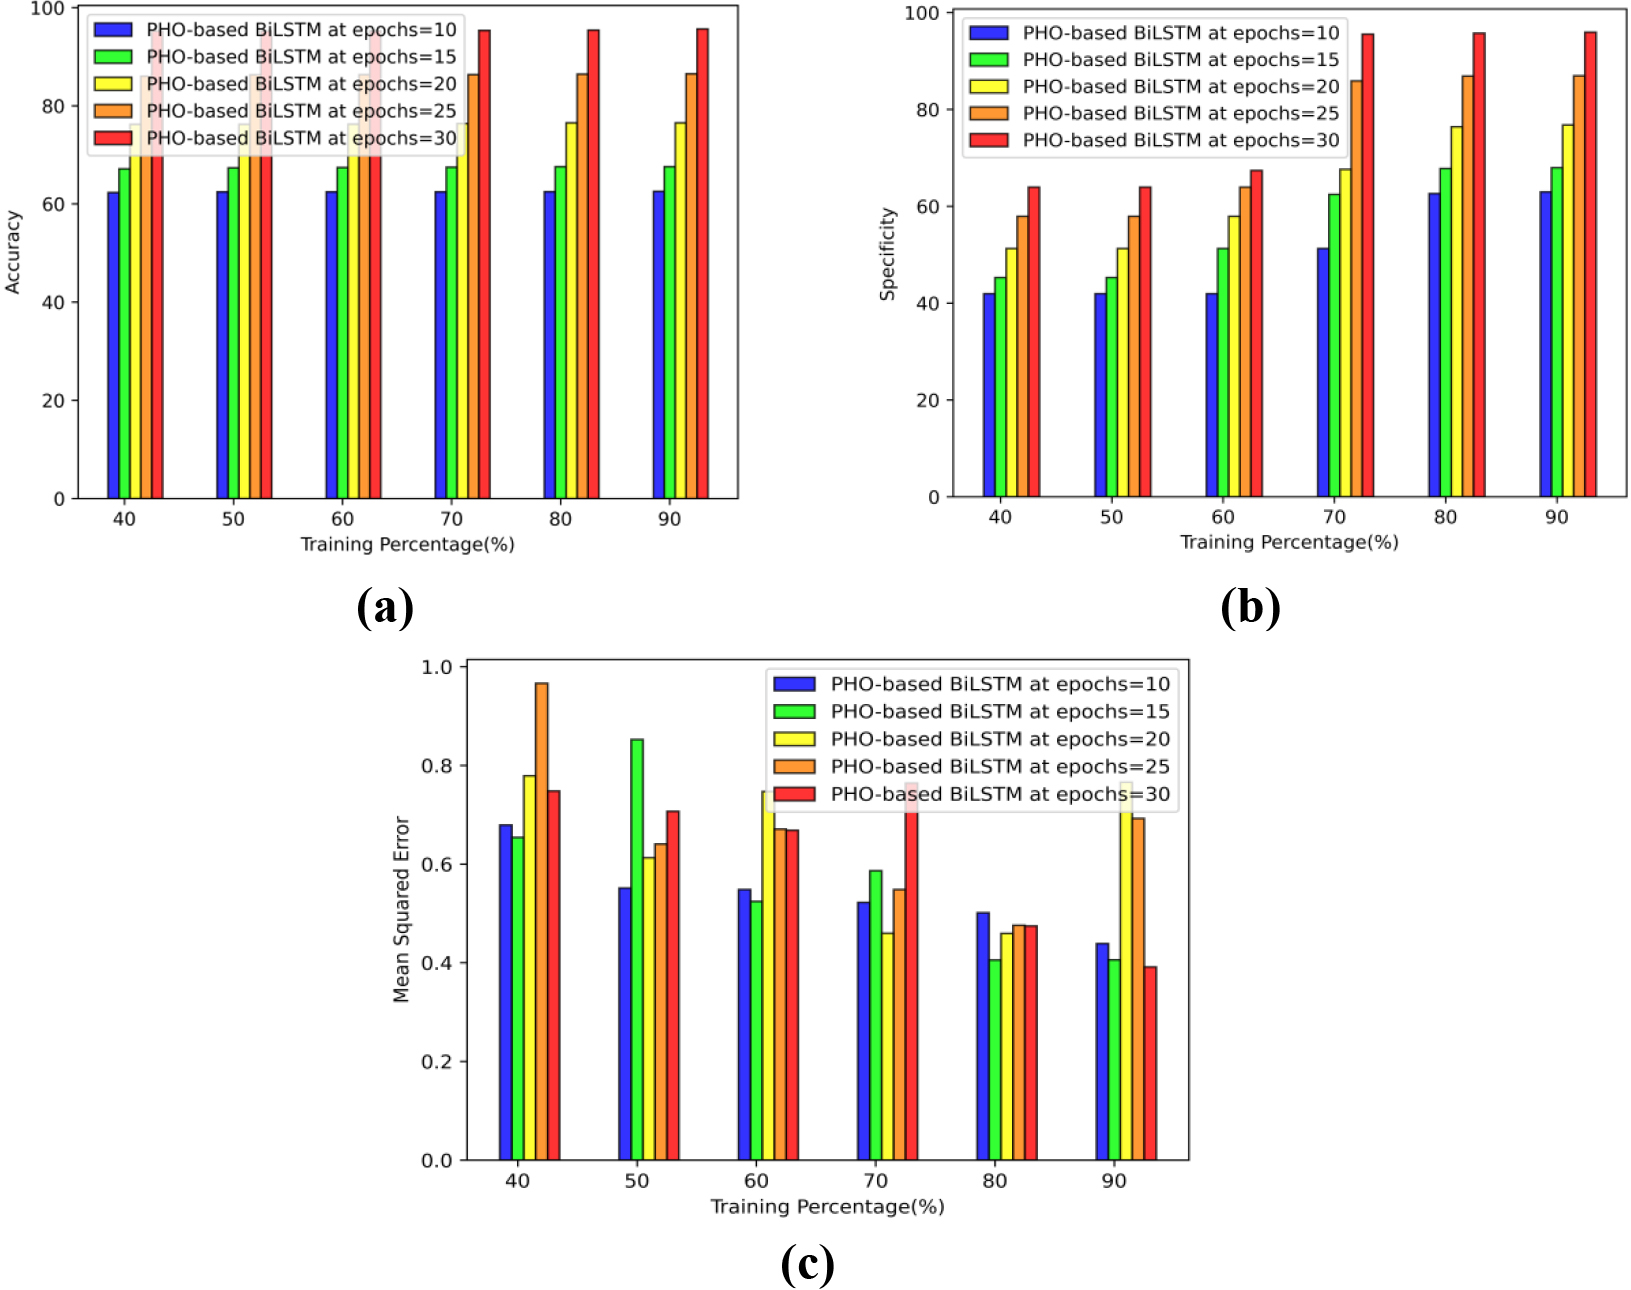
Comparative analysis based on TP using D1 a) Accuracy b) Specificity c) Error.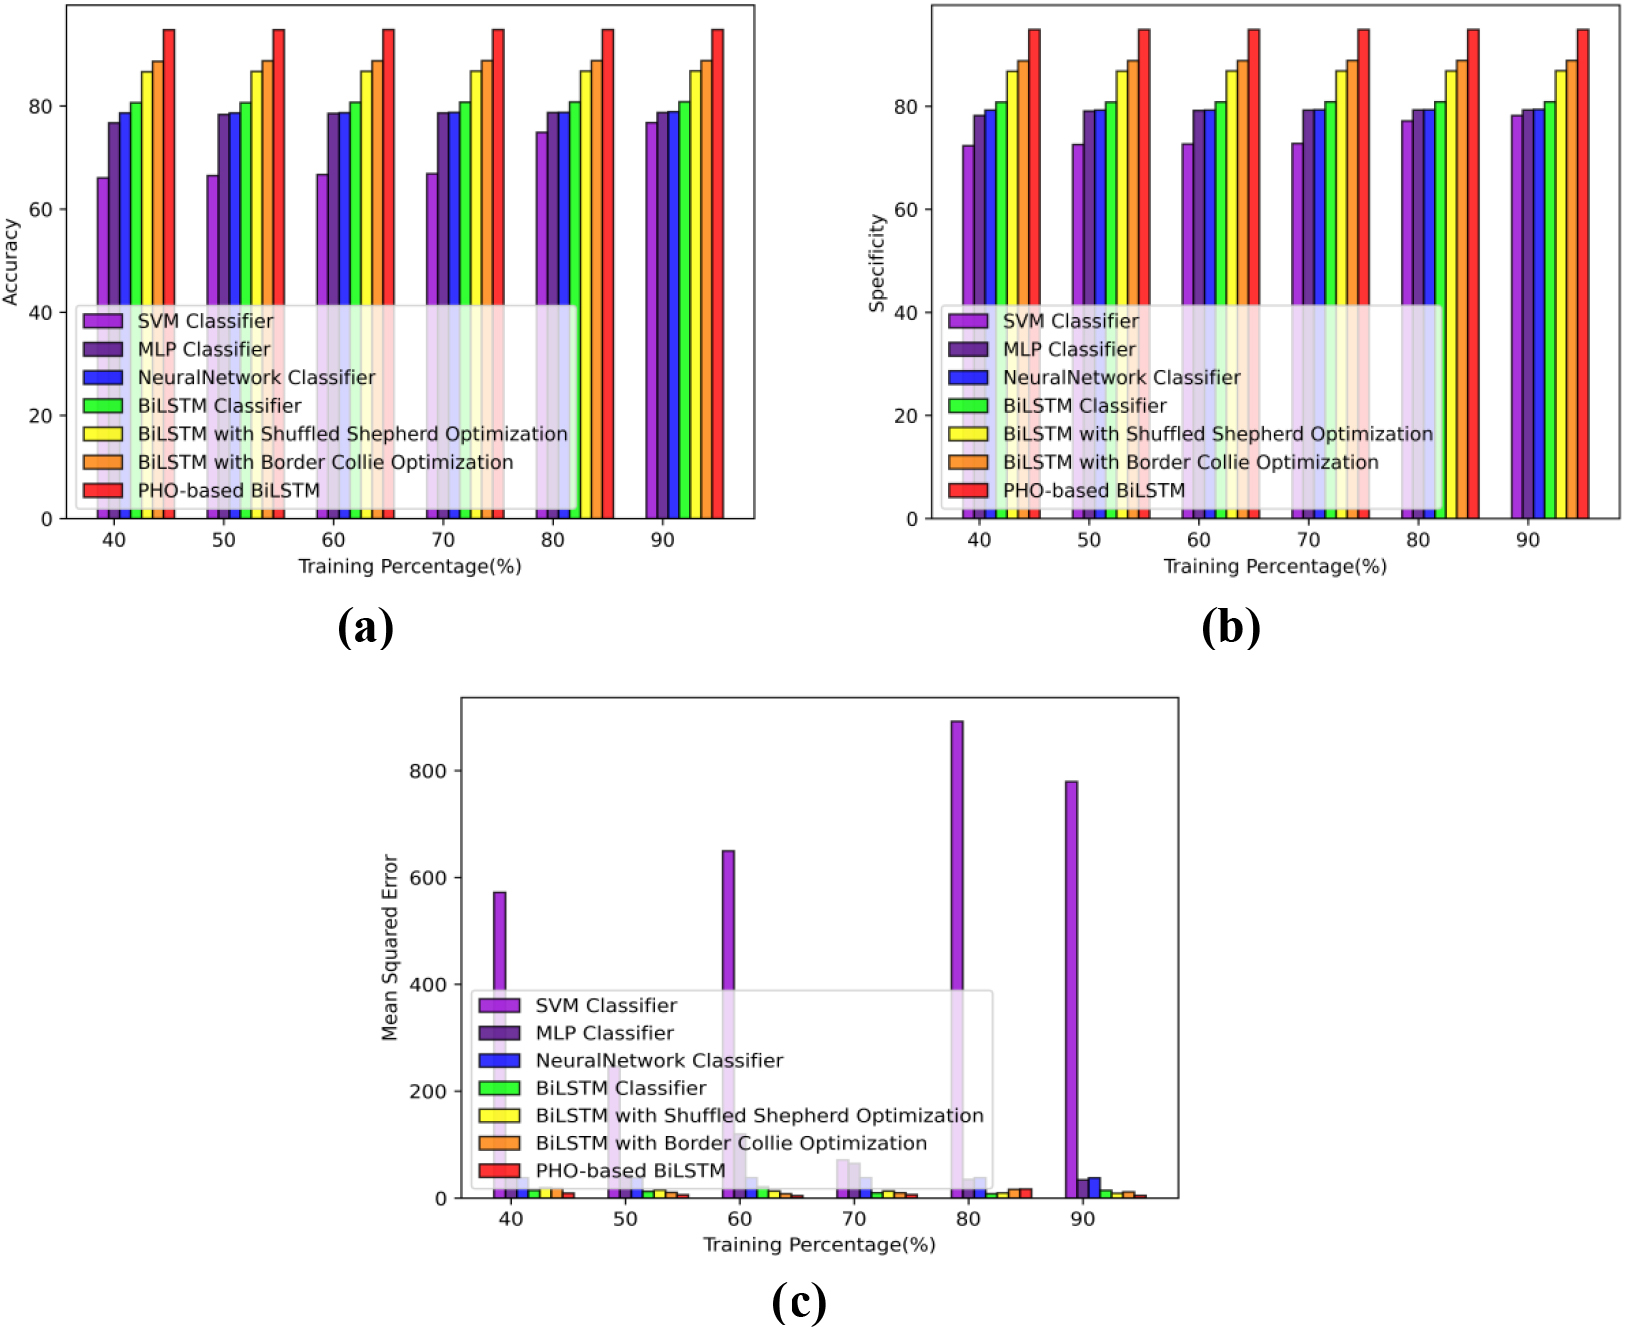
The results for the PHO-based BiLSTM in network traffic congestion system Fig. 5(a) show the accuracy epoch values 10, 15, 20, 25, and 30 which generate values of 62.56%, 67.59%, 76.54%, 86.52%, and 95.57% while maintaining a TP of 90. Using epoch values of 10, 15, 20, 25, and 30 the findings obtained using the PHO-based BiLSTM are shown in Fig. 5(b). The results obtained are 62.97%, 67.97%, 76.78%, 86.97%, and 95.96% respectively, with specificity TP of 90. Figure 5(c) demonstrates that PHO-based BiLSTM obtains minimum errors of 0.44, 0.41, 0.77, 0.69, and 0.39, respectively, even when the MSE over TP 90 epoch values of 10, 15, 20, 25, and 30 are considered.
Comparative analysis based on TP using D2 a) Accuracy b) Specificity c) Error.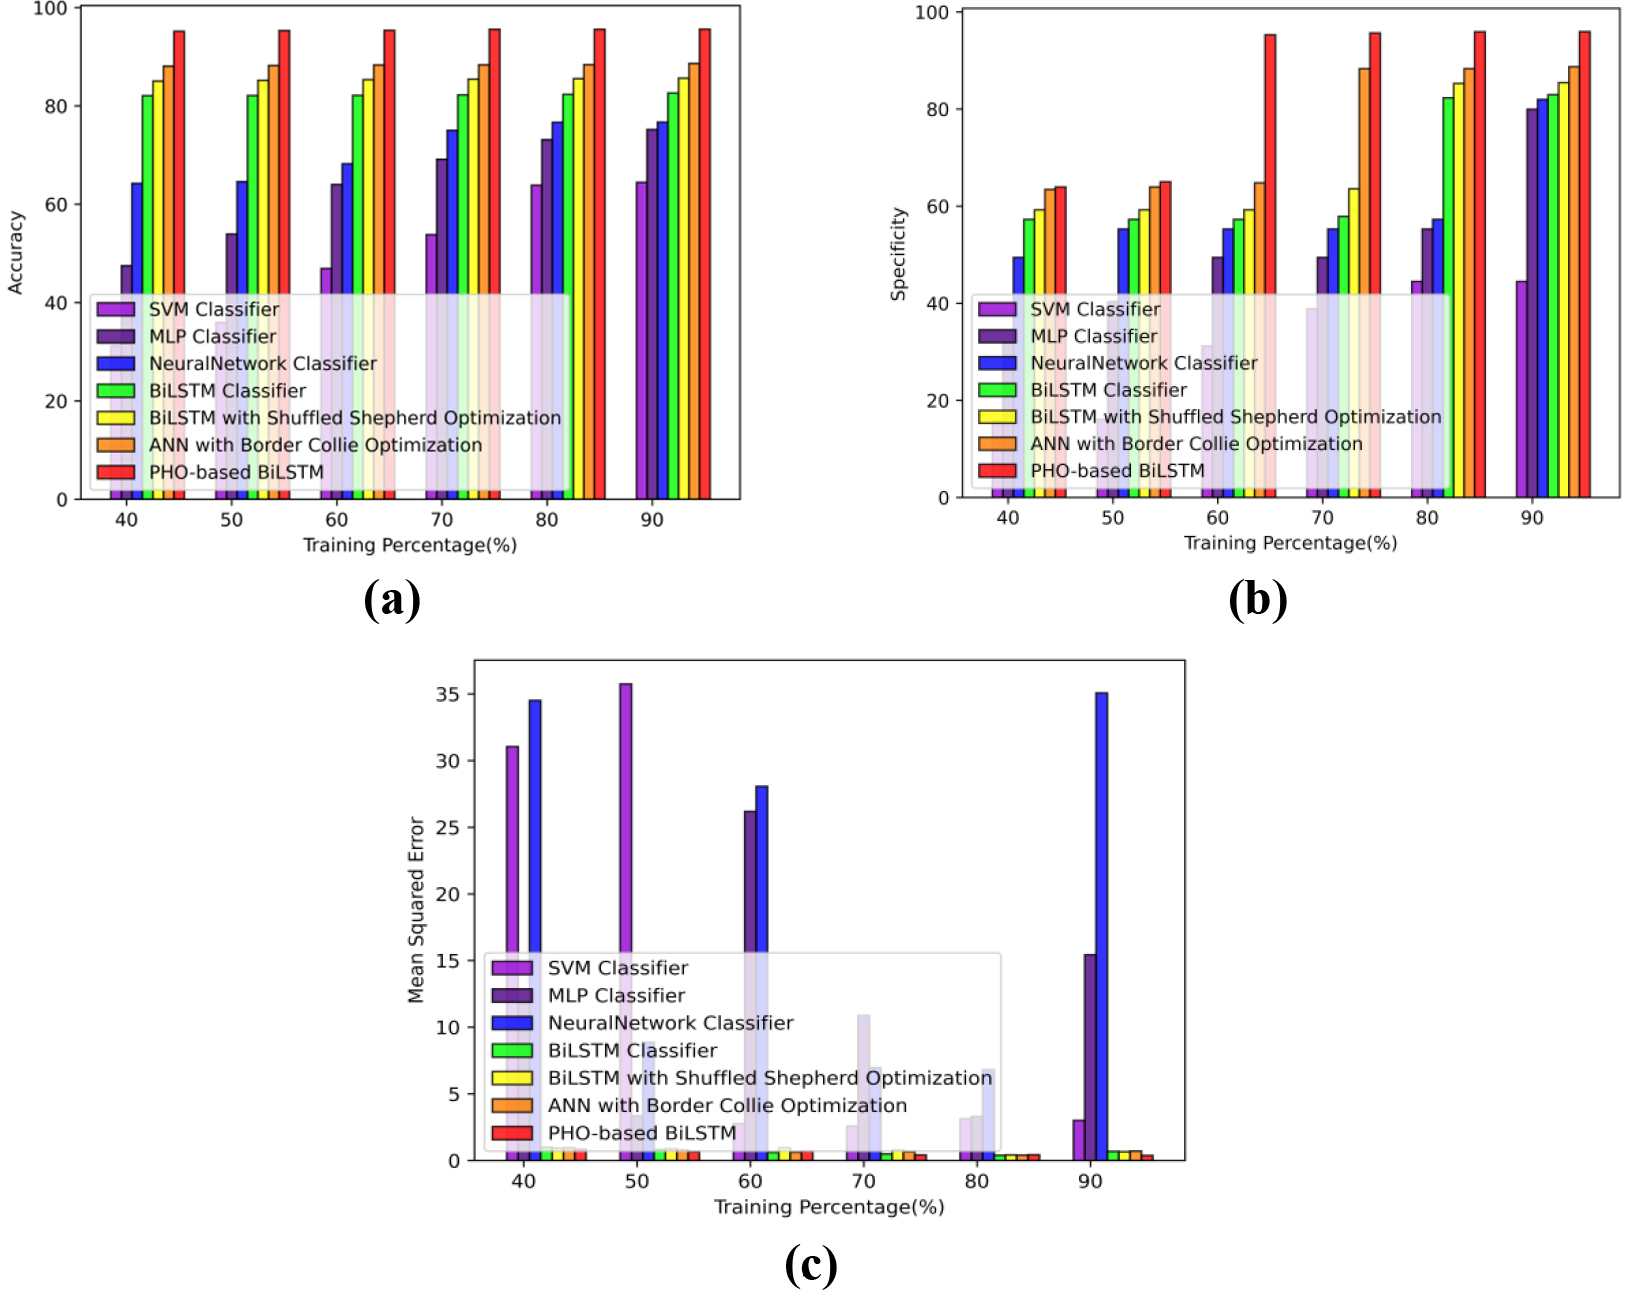
To demonstrate the successes of the PHO-based BiLSTM, a comparative study is conducted. The methodologies used for the comparison include SVM classifier [33], Multi-layer Perceptron (MLP) classifier [34], neural network classifier [35], BiLSTM classifier [36], BiLSTM with shuffled shepherd optimization [37], BiLSTM with Border collie optimization [38].
Comparative analysis based on TP using D1
According to TP Fig. 6, the accuracy, specificity, and MSE are used to evaluate the performance of the PHO-based BiLSTM with those of the other comparison methodologies.
During TP of 90, Fig. 6(a) shows how accurate PHO-based BiLSTM is at predicting congestion, exceeding border collie optimization by 6.35% and having an accuracy rate of 94.81%.
Figure 6(b) demonstrates the PHO-based BiLSTM ability to predict congestion with high specificity. The PHO-based BiLSTM model performs 6.34% better than Border collie optimization and has 94.90% specificity for a TP of 90.
The PHO-based BiLSTM MSE for predicting congestion reaches its lowest error of 4.91 as shown in Fig. 6(c).
Compared to the earlier techniques, the PHO-based BiLSTM outperforms them in terms of traffic congestion prediction.
Comparative analysis based on TP using D2
The performance of the PHO-based BiLSTM is compared to that of the various comparison techniques in Fig. 7 of the TP, which illustrates the use of accuracy, specificity, and MSE.
Figure 7(a) shows the PHO-based BiLSTM model’s accuracy in predicting traffic congestion. With a TP of 90, the PHO-based BiLSTM outperforms the border collie optimization by 7.34% and achieves an accuracy of 95.62%.
The PHO-based BiLSTM ability to predict traffic congestion is seen in Fig. 7(b). Border collie optimization is outperformed by PHO-based BiLSTM by 7.53%, and it has 95.96% specificity for a TP of 90.
The PHO-based BiLSTM MSE for predicting congestion achieves the least error of 0.38, as shown in Fig. 7(c).
In comparison to earlier techniques, the PHO-based BiLSTM outperforms them in terms of traffic congestion prediction.
Comparative discussion
The PHO-based BiLSTM models are compared to the current ones to demonstrate their superiority. The accuracy, specificity, and MSE terms while considering the TP of 90 via D1 are 97.08%, 97.08%, and 97.08% respectively. The values for D2 are 96.80%, 96.80%, and 96.80% respectively. The database executes the following provisions, as shown in Tables 2 and 3.
Comparative discussion for D1
Comparative discussion for D1
Comparative discussion for D2
In this research prime herder optimization-based BiLSTM (PHO-based BiLSTM) model is developed for congestion prediction, initially the input database is gathered from D1 and D2 and the dataset is analyzed and the packet information is extracted after that the extracted features are fed forwarded to the BiLSTM classifier to train the model. The proposed prime herder optimization was created through the standard hybridization of a prime sheepdog and herder optimization, which successfully adjusted the classifier’s hyperparameters and helped produce improved results. Based on the success of the congestion prediction, the accuracy, specificity, and error for the proposed prime herder optimization at TP 90 were 94.81%, 94.90%, and 4.91, respectively. Based on the D2, the accuracy was 95.62%, 95.96%, and 0.38 respectively.
Footnotes
Nomenclature
| Acronyms | Abbreviation |
| Quality of experience | QoE |
| Prime herder optimization-based BiLSTM | PHO-based BiLSTM |
| Training percentage | TP |
| Mean square error | MSE |
| Hypertext transfer protocol | HTTP |
| Round-trip times | RTT |
| Transmission control protocol | TCP |
| Deep packet inspection | DPI |
| Machine learning | ML |
| Deep learning | DL |
| Distributed Denial-of-Service | DDOS |
| Long short-term memory | LSTM |
| Bottleneck bandwidth and round-trip propagation time | BBR |
| Google congestion control | GCC |
| Quality of Service | QoS |
| Differentiated rate control data collection | DRCDC |
| Temporal convolutional network | TCN |
| DNS over HTTPS | DoH |
| Domain name system security extensions | DNSSEC |
| Video on demand | VoD |
| Quick UDP internet connections | QUIC |
| Network information management and security group | NIMS |
| Total forward packets | TFP |
| Total backward packets | TBP |
| Total length of the forward packets | TLFP |
| Total length of the backward packets | TLBP |
| Size of the packets | SP |
| Flow bytes per second | FBPS |
| Flow packets per second | FPPS |
| Flow IAT min | FIM |
| Flow IAT total | FIT |
| Flow IAT max | FIM |
| FIN flag count | FFC |
| PSH flag count | PFC |
| Sub-flow forward packets | SFFP |
| Sub-flow bytes | SFB |
| Unit of measure | UoM |
| Recurrent neural network | RNN |
| Herder optimization | HO |
| Objective function | OF |
| Multi-layer Perceptron | MLP |