
Abstract
A large amount of economic and financial news is now accessible through various news websites and social media platforms. Categorizing them into appropriate categories can be advantageous for various tasks, such as sentiment analysis and news-based market prediction. Unfortunately, news headlines categories may contain ambiguities due to the subjective nature of label assignment by authors or publishers. Consequently, achieving precise classification of news can be time-consuming and still reliant on human expertise. To tackle this challenging task, we proposed a hybrid approach to enhance the performance of economic and financial news classification. This approach combines baseline classifiers with a novel method called the Category Associated Feature Set (CAFS) classifier. CAFS transforms text input from the lexicon-space into the entity-space and discovers associations between entities and classes, akin to association rule learning. Experimental results on three datasets demonstrated that the proposed method is comparable to existing approaches and exhibits a significant improvement in the classification results for out-of-domain datasets. Additionally, employing CAFS in tandem with the existing text classification baselines can provide a general categorizer for distinguishing news categories across various sources without the need for extensive fine-tuning of the parameters associated with those classification baselines. This confirms that utilizing CAFS in a hybrid approach is appropriate and suitable for economic and financial news classification.
Keywords
Introduction
Nowadays, a lot of information is available in the form of text, such as news, online documents, opinions, and content on social media. Extracting interesting patterns or corresponding information from text can significantly impact textual analysis. Using machine learning techniques for automatic text classification can reduce time-consuming and decrease the requirement for domain expertise. Recently, news related to economics has become a significant factor that impacts financial market volatility. The market typically reacts to breaking or unexpected news, resulting in large fluctuations if the news reports major events. In other words, anticipating news such as the Fed interest rate decision can cause anxieties and drive the prices of various assets towards bear or bull markets. Therefore, we can take advantage of the time delay of news release to predict or prepare for any unexpected events to come. This is because economic derivative data or the release of macroeconomic news is known to have some correlation with financial market movements. Additionally, sentiment analysis based on financial news can be applied for stock prediction. Many researchers focus on news-based market prediction or price forecasting based on news. For instance, some studies forecasted the direction of the stock market and macroeconomic indicators using information extracted from news [1, 2, 3]. Furthermore, some scholars used the same technique to investigate the impact of macroeconomic news on asset prices and metal futures [4, 5]. From the reported findings, the information retrieved from news correctly classified into appropriate categories can lead to precise market trend predictions. Consequently, economic and financial news classification plays an important role in economic and market analysis.
In recent years, many researchers have conducted numerous studies on news classification. Some have concluded that news headlines can produce accurate classification results, even with considerably less data [6, 7, 8]. Additionally, news headlines usually have few repetitive words, are brief, and provide clear information, reducing the chances of misclassification in the classification process. Automatic news headline classification has been extensively studied, with researchers presenting approaches to classifying short text, such as Twitter and news headlines, using machine learning methods such as Support Vector Machines (SVM), Logistic Regression (LR), and Naive Bayes Classifier (NB). Research findings indicate that no single method performs very well across all datasets. Some studies claim that NB has the highest accuracy and is best suited for news classification [9, 10]. Others suggest that the SVM method yields the best performance and is suitable for high-dimensional data (data with a large number of features extracted from news headlines) [11, 12]. Currently, text classification tasks, including news categorization, tend to utilize deep learning-based methods such as Long Short-Term Memory (LSTM), Bidirectional LSTM (BiLSTM), and Bidirectional Encoder Representations from Transformers (BERT). Many researchers have claimed that deep learning-based methods require fewer engineered features but provide remarkable results in text classification [13, 14, 15]. However, most deep learning models have structural complexity and large resource requirements. Specifically, they require a large amount of training data, long training time, and high computational power. Previous research on news headline classification has primarily focused on achieving high classification performance using optimized feature engineering techniques that are specific to certain data sources. Conversely, the development of a general and highly efficient classification model that can be used for multiple data platforms without extensive training across platforms has not yet been achieved.
Nowadays, a large amount of economic and financial news is available from many sources, and news articles often fall under multiple topic labels. A single news headline can present a combination of categories, making it difficult to assign a clear category. For example, the headline “World Stocks Hit Highest in a Week as Inflation Scare Fades” could fall under either the “economic” or “stock” category. Additionally, different news sources may subjectively assign overlapping categories to the same news article. For instance, the news headline “Most Asian currencies rise, Taiwan dollar leads gains” was assigned to the “stocks” category by the author, although the content suggests that it should belong to the “forex” category. The ambiguities and subjectivity in economic and financial news headlines can lead to classification fallibility based on individual author’s opinion. To address this issue, the category-associated features set (CAFS) technique has been introduced to improve classification accuracy and create a general model for economic and financial news classification across different data sources/platforms. In this research, our focus is on achieving the single-label classification. Therefore, we propose an approach to automatically classify economic and financial news headlines into their most relevant category, even if they can be classified into multiple categories. The objective of this research is to improve current news and headlines classification techniques by introducing economics and financial entities as representative features for economic and financial news. These entities are used to develop classifiers based on a hybrid approach that combines a baseline classification model with the CAFS. To validate our model, we evaluate the performance of economic and financial news classification on three different datasets obtained from various platforms and compare it with other baseline classification methods to demonstrate its outstanding applicability.
Materials and methods
Dataset
The datasets used in this research were collected from various data sources and include news headlines and short texts related to economic and financial topics. The news headlines were labeled with their respective categories by the authors and publishers of the news websites. In contrast, tweets were categorized based on their source publishers or related content. For instance, “Inflation-tolerant Fed will boost commodity prices” was categorized under the “commodities” category, and “The United States is in the midst of the biggest unemployment crisis since the Great Depression” was categorized under the “economy” category.
Training dataset
In this research, the training datasets were obtained from investing.com, a financial platform and news website that provides information about stocks, commodities, forex, etc. These datasets contain approximately 224,348 news headlines collected daily between April 18th, 2011 and February 21st, 2021. We combined some raw data categories that share similarities, such as “indicators” and “economy” into the same category, and grouped news headlines that are not related to economic and financial topics, such as politics, coronavirus, and world news, into the “other” category. The news headlines in these datasets are categorized into six categories: stocks, forex, commodities, cryptocurrency, economy, and other. The distribution of news headlines and word tokens in each category can be found in Table 1.
The distribution of news headlines and word tokens in the training datasets
The distribution of news headlines and word tokens in the training datasets
The benchmark datasets used to evaluate the classifier’s performance consist of three datasets: the investing dataset, the news headline dataset, and the Twitter dataset, all released from March to May 2021. The investing dataset contains 10,725 headlines from the same source as the training dataset, while the news headline dataset comprises 11,591 headlines retrieved from various news websites such as Trading Economics, Reuters, MarketWatch, WSJ, BBC, CNN, and NYTimes. Moreover, the Twitter dataset contains a collection of 8,186 tweets taken from various Twitter users such as BN Commodities, Cointelegraph, EU Economy & Finance, The Associated Press, DailyForex, and Stock Market News. The distribution of categories in the benchmark datasets is shown in Table 2.
The distribution of each category in the testing datasets
The distribution of each category in the testing datasets
The domain-specific dictionary was created using named entities and financial terms. Initially, we randomly selected 30,000 news headlines from the training dataset to identify named entities in the headlines such as names of persons, banks, organizations, events, and monetary values, by using the noun phrase extraction method [16] and spaCy method (entity recognition) [17]. After word tokenization, appropriate parts of speech were assigned to the words, and then the noun phrases were extracted. The predefined keywords obtained from the previous step required manual inspection for constructing a verified keyword list. The verified keywords from this step consisted of six entity types: BNK, EVT, GPE, MNY, PER, and MSC. The second process involved collecting economic and financial terms, including keywords related to economic indicators, stock market indices (of major world markets), commodities, cryptocurrencies, and currency pairs, from various sources such as tradingeconomics.com, NASDAQ, and the New York Stock Exchange. The financial keywords obtained from this step consisted of six entity types: CMD, CYP, FRX, IDX, IND, and STK. The distribution of words across the twelve economics and financial entities, which define the domain-specific dictionary used in this research, is presented in Table 3.
Entities description and distribution of keywords in the domain-specific dictionary
Entities description and distribution of keywords in the domain-specific dictionary
Text preprocessing is a crucial step that can potentially impact text classification performance. The process involves cleaning the text by removing noisy and irrelevant data, and the procedure can be explained in the following steps:
Select a sample news headline from the dataset. Convert all capital letters in the sample news headline to lowercase characters. Remove sub-headlines or irrelevant words such as “UPDATE 1-”, “CORRECTED -”, “ANALYSTS’ VIEW-”, “MONEY MARKETS-”, “Forex-”, “Stocks-”, and “Q+A-” from news headlines. Extract words with whitespace delimiters and tokenize a sample news headline into single words or multi-word tokens (two or more words that function as a single unit, such as “consumer price index”) based on the domain-specific dictionary instead of using regular tokenization. Remove stop words from the set of word tokens based on the existing stop word list. Remove punctuation marks, delimiters, exclamation marks, and signs from the set of word tokens. Repeat steps 1–6 for all the sample news headlines in the dataset.
Classification algorithms cannot effectively work on raw text, so feature extraction techniques are required to convert raw text into features that help improve classification accuracy. The feature extraction method used in this research can be described as follows:
Vectorization
Vectorization is the process of converting text into a numerical representation. The most commonly used technique is Term Frequency-Inverse Document Frequency, also known as TF-IDF [18]. TF-IDF is used to calculate the feature weight of a keyword in texts and assign importance to that keyword based on its frequency across documents. This feature extraction method is simple and effective for machine learning algorithms.
Word embedding
Word embedding is one of the most commonly used techniques to create vector representations of individual words as real-valued vectors in a low-dimensionality vector space, which is effective for deep learning methods such as LSTM and Bidirectional LSTM. In this research, we used the fastText [19] word embedding model because it can generate vectors for a word even when it does not exist in the training corpus. We trained an unsupervised word embedding model using the skip-gram technique on the 224,348 news headlines from the training dataset.
Keyword feature
We extracted keyword features for our proposed classification method by scanning news headlines for exact matches with terms in the domain-specific dictionary. These keywords were then transformed into their corresponding features. An example of results from this extraction process can be seen in Table 4.
Example of keyword feature extraction result
Example of keyword feature extraction result
WordPiece [20] is a sub-word segmentation algorithm proposed to handle out-of-vocabulary words resulting from segmentation in languages with a large character inventory, homonyms, and few or no spaces between words. WordPiece embedding was used to construct the input representation for the BERT model, which expects input sentences in a specific format, as shown in Fig. 1. The input text should be processed in the following manner.
Tokenize the input text into tokens and convert all unseen tokens by breaking a word into several sub-words. Add the special classification token [CLS] at the beginning and the special token [SEP] at the end of each input text to mark it. Fix a sentence length and then either truncate the sentence to the maximum length or pad it with [PAD] tokens to match the length of the shorter input text. Convert each token into its corresponding unique ID. Create attention masks that indicate the real tokens from padding elements ([PAD] tokens).
Example of input representation for the BERT model.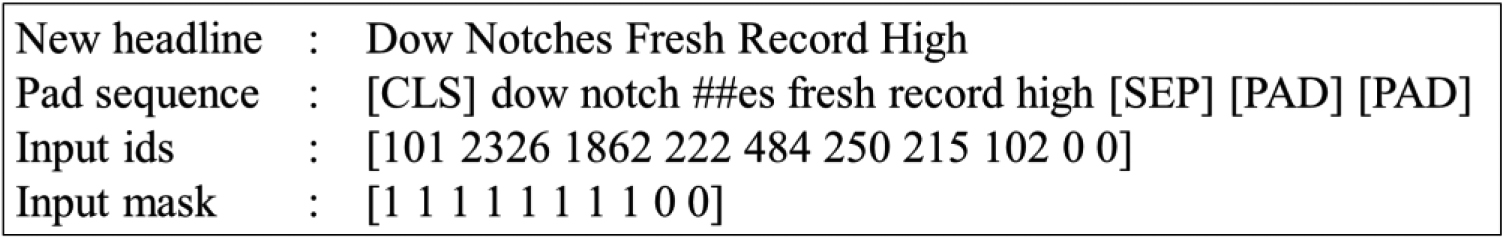
This section discusses a classification method that is widely used to categorize text into predefined categories. This baseline classification method consists of Support Vector Machines (SVM), Logistic Regression (LR), Naive Bayes Classifiers (NB), Long Short-Term Memory (LSTM), Bidirectional LSTM (BiLSTM), and Bidirectional Encoder Representations from Transformers (BERT). The details of the structure and technical implementations of these methods are described below.
Support Vector Machines (SVM)
SVM [21] is a machine learning algorithm that finds the optimal boundary to separate different classes in the data. Linear Support Vector Classification or LinearSVC [22] is a specific type of SVM that uses a linear kernel to find the optimal linear boundary. This implementation can be faster than other SVM methods, making it especially useful for large-scale datasets. Additionally, it can handle high-dimensional data efficiently.
Logistic Regression (LR)
Multinomial Logistic Regression [22] is an algorithm used for multiclass classification tasks. It extends binary logistic regression to handle more than two classes by fitting multiple logistic regression models, one for each class. The algorithm can handle high-dimensional data and learns a set of coefficients that map input features to the log-odds of each class. During training, the coefficients are estimated using maximum likelihood estimation.
Naive Bayes Classifiers (NB)
The Multinomial Naive Bayes Classifier [23] is a variant of the Naive Bayes algorithm. It calculates the probability of each news category by considering a feature vector related to word counts or frequencies within the news headlines, using Bayes’ theorem. This method is simple, fast, and effective for large datasets with high-dimensional features and a small number of training instances.
Long Short-Term Memory (LSTM)
LSTM [24] is a type of recurrent neural network (RNN) that addresses the issue of vanishing gradients in traditional RNNs. LSTM accomplishes this by introducing a memory cell capable of storing information over time and three gating mechanisms: input, forget, and output gates. The input and forget gates selectively update the memory cell with new information and discard old information, respectively. Meanwhile, the output gate selectively outputs information from the cell to the next timestep.
Bidirectional LSTM (BiLSTM)
Bidirectional LSTM (BiLSTM) [25] is a type of LSTM that processes the input sequence in both forward and backward directions, allowing the network to capture dependencies in both past and future contexts. BiLSTM is accomplished by using two separate LSTM layers, one processing the input sequence forward and the other processing it backward, and concatenating their outputs at each timestep.
Bidirectional Encoder Representations from Transformers (BERT)
BERT [26] is a pre-trained language representation model based on the Transformer architecture. It uses bidirectional training to take into account the context from both preceding and succeeding words when processing natural language text. DistilBERT [27] achieves similar levels of accuracy to BERT while being faster and more memory-efficient, making it easier to deploy on devices with limited computational resources. Thus, we are using DistilBERT as the base model in this research.
The proposed method
Our proposed method aims to develop the classifiers based on a hybrid approach that combines a baseline classifier with the category associated feature set (CAFS) classifier.
Category Associated Feature Set (CAFS) classifier
The CAFS classifier comprises a set of associated features that frequently occur in each category. Based on the hypothesis that the more frequent two features occur together, the higher the probability that they are associated with each other. This method consists of the following two key aspects:
1) Frequent Pattern Mining
The Frequent Pattern Mining (FPM) [28] technique is used to extract frequent patterns or sets of items that frequently co-occur in a given dataset. In the context of text mining, FPM can be used to identify common terms that often appear together in a corpus of text. The concepts underlying FPM can be explained using the following terms:
Headlines: The dataset
Frequent entity set: Given a set of headlines
Support: Support can be expressed as
Minimum Support: Often denoted as minsup, is typically set as a percentage or a fraction of the total number of headlines in the dataset. It represents the minimum frequency or support count required for an entity to be considered frequent.
An example of FPM techniques using Apriori algorithm is shown in Fig. 2. The news headlines dataset and their related entities features are represented as
In this research, a total of 224,348 news headlines from the training datasets, categorized into 6 categories, were used to derive frequent entity sets. The APRIORI algorithm [29, 30] was employed for this purpose. The frequent entity sets were selected by filtering out the support values that exceeded 90 percent of all entity sets within each news category. Table 5 presents the top 20 frequent entity sets obtained from the training data using the FSM technique.
Top 20 frequent entity set ordered by the support values
Top 20 frequent entity set ordered by the support values
Example of FPM techniques using Apriori algorithm.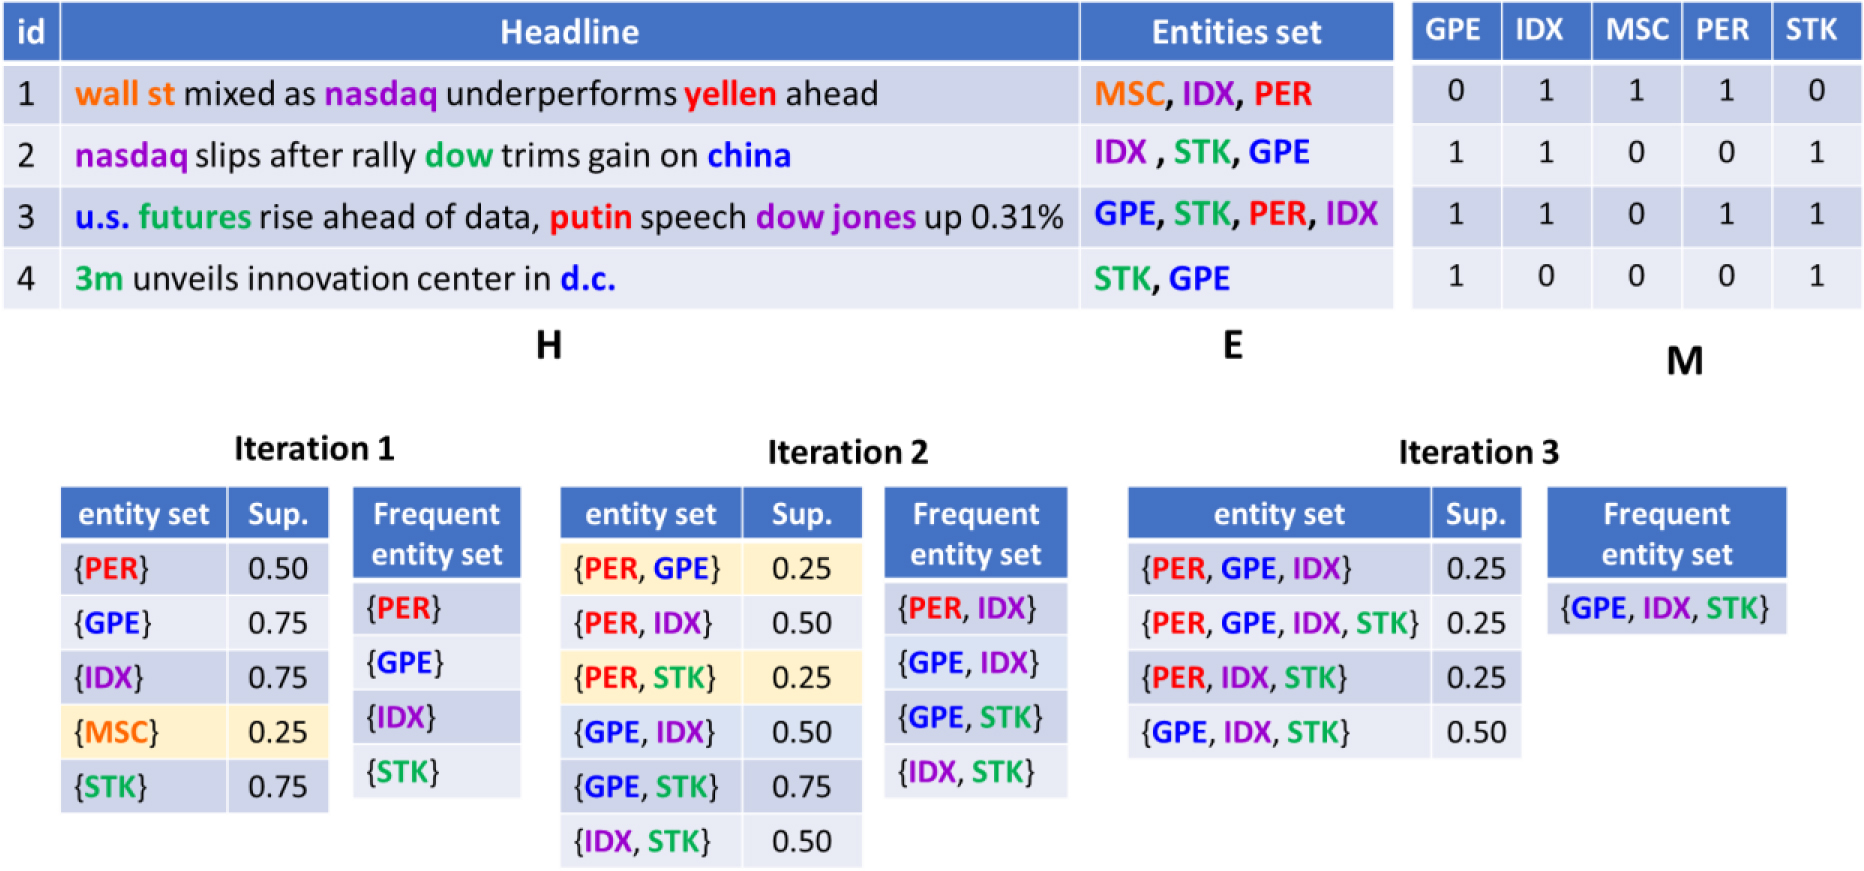
2) Associated feature set
Although frequent entity sets obtained from FPM techniques can represent specific features in each category, some of these features can occur in one or more categories. Therefore, we have elaborated on the relations between frequent entity sets and news categories, as depicted in Fig. 3. In this diagram, unique category-associated features are represented as node labels in different colors, indicating that they may occur exclusively within a single category.
We then constructed a set of rulesfrom the category associated features set based on their confidence value:
The generated rules are in the form:
Set of CAFS classification rules ordered by the confidence score (Conf.)
The diagram of associated feature set for each category.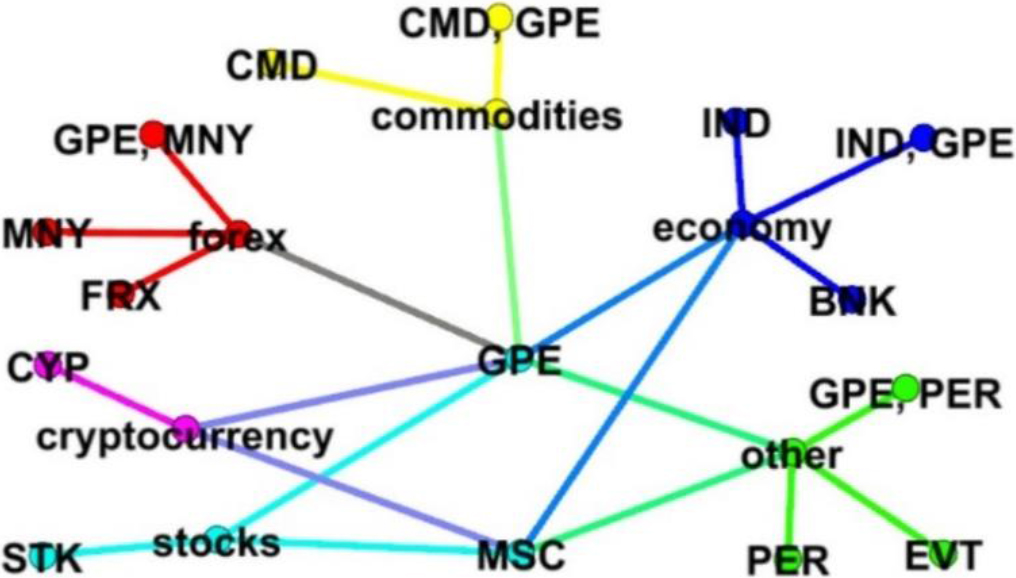
The CAFS classification process can be performed as follows. First, the news headline is tagged and represented as an economic and financial named entity feature. Next, the items are looked up in the CAFS classification rules and matched against every rule. If a rule match is found, the confidence score of the rule is added to the matching score. Finally, the predicted category is the class with the highest score. This CAFS classification process can be summarized with the following example:
News headline:
CMD
Matching score: commodities: 1.63, cryptocurrency: 0, economy: 0.93, forex: 0, other: 0, stocks: 0.6 classification result: commodities
To gain insight into how a particular CAFS method makes predictions and identifies which types of classes it may struggle with, the confusion matrix, ROC curve, and Precision-Recall curves were utilized. The classification results obtained from the training dataset, as depicted in Fig. 4a, indicated that this method performs exceptionally well in the “cryptocurrency,” “forex,” and “commodities” classes, achieving the best classification performance in those categories. Additionally, upon analyzing the confusion matrix depicted in Fig. 4b with the aim of minimizing instances that were incorrectly classified, it was discovered that the CAFS method generated fewer false positive results in the “commodities” and “forex” classes within the “stocks” category. This finding indicates that the CAFS method is more cautious in classifying instances as “commodity” and “forex” classes in this category. Nevertheless, it is advisable to consider utilizing an alternative method in conjunction with CAFS in the hybrid approach for the “economy,” “stocks,” and “other” categories. In summary, CAFS might be proficient in certain aspects, while the other model might perform better in different scenarios. By combining their results, we can leverage the strengths of both models and achieve improved overall performance.
The CAFS classification results, (a) the ROC curves and Precision-Recall curves, (b) the confusion matrix.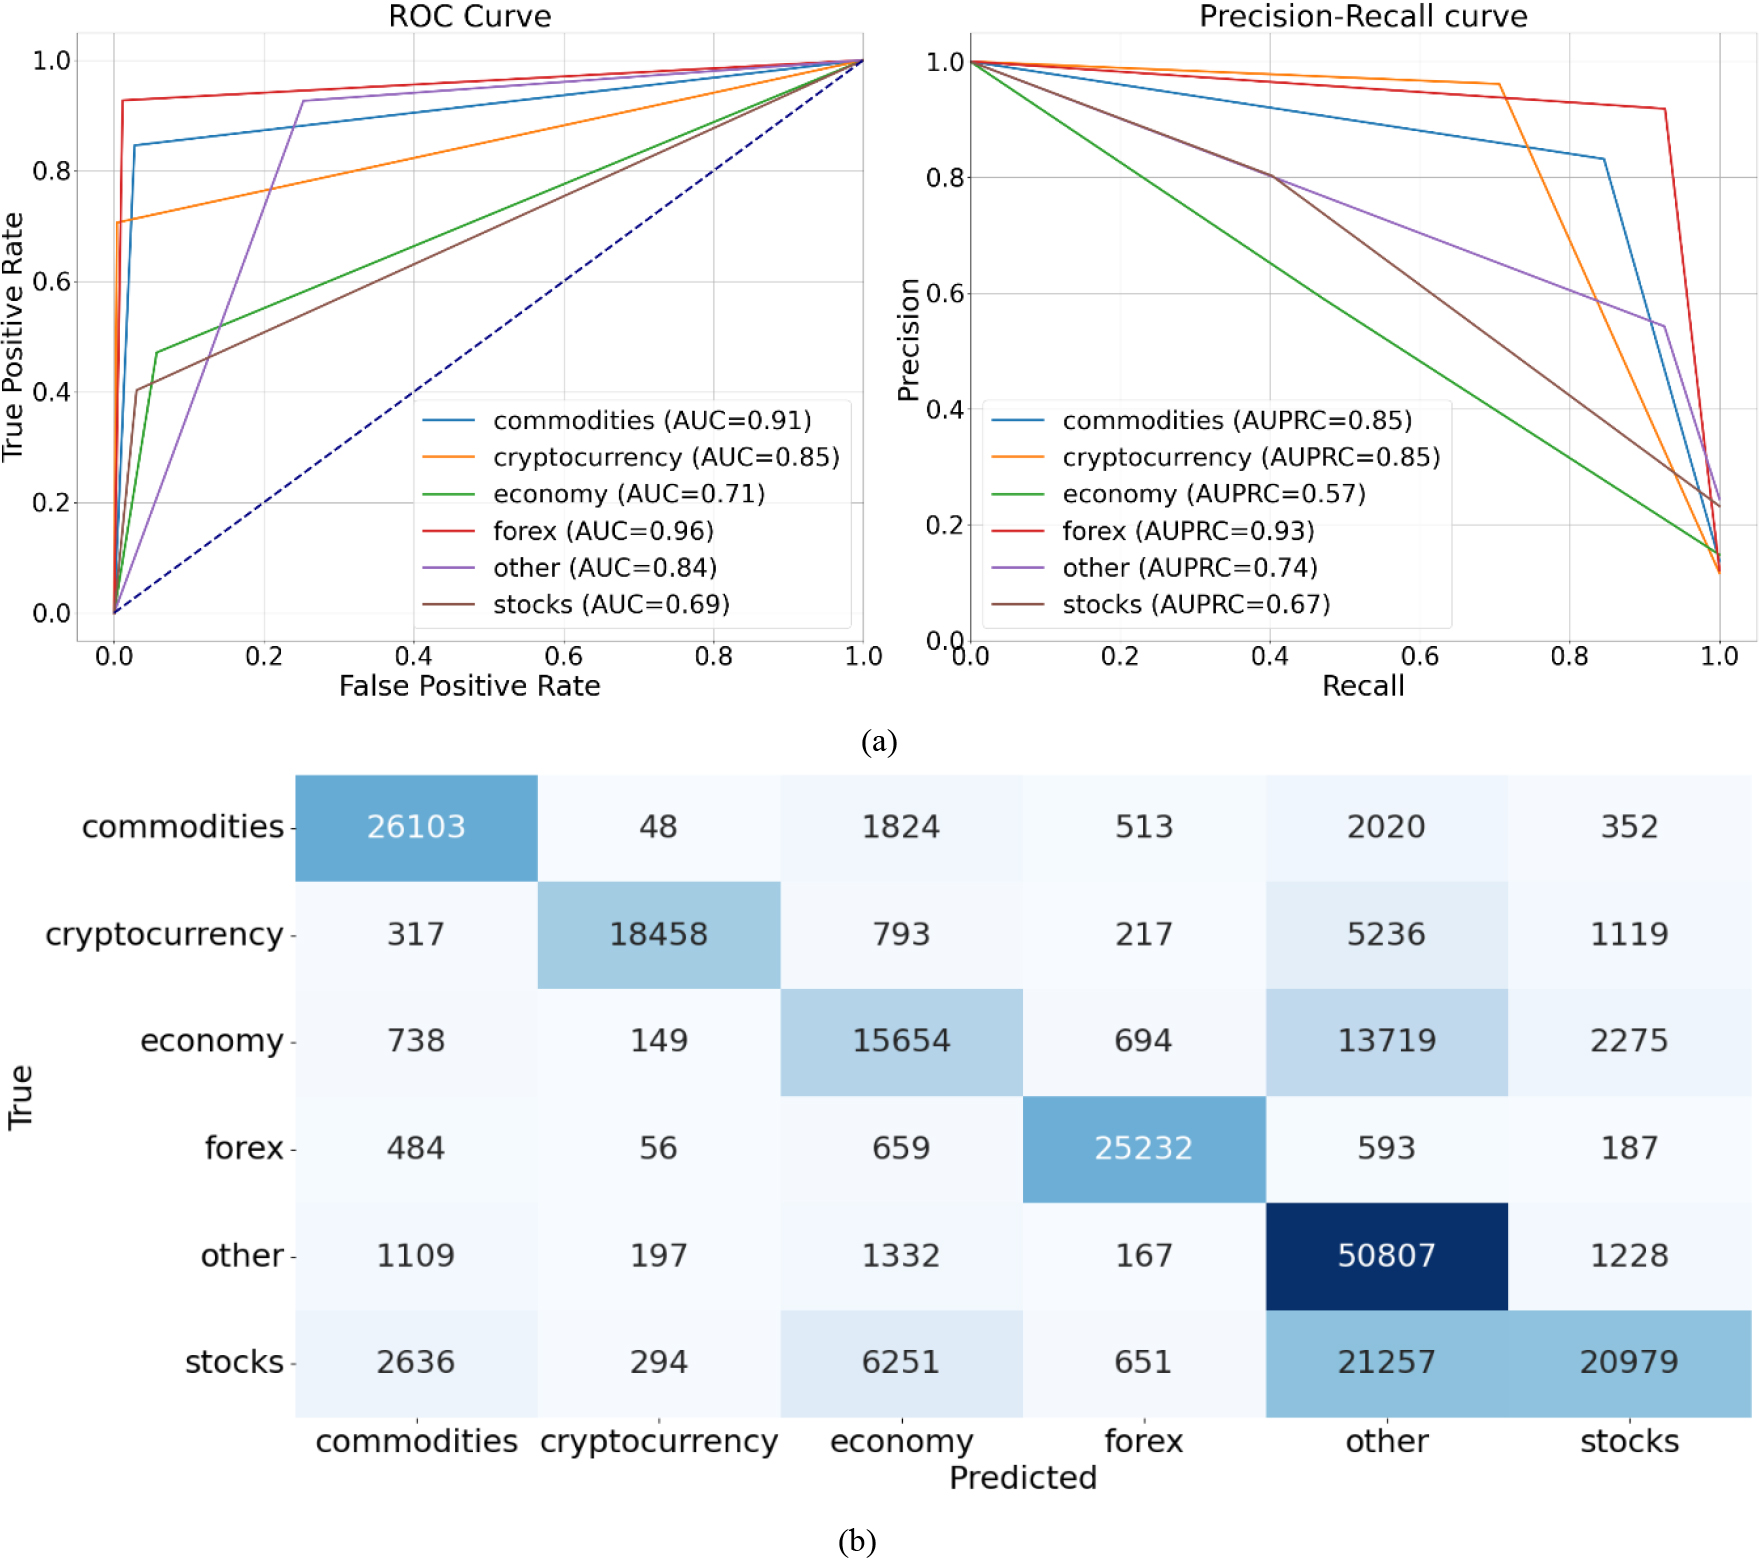
The hybrid classification method aims to enhance the performance of economic and financial news classification by combining the baseline classifiers with the CAFS classifier to provide an effective classification approach. The hybrid method is constructed by applying condition filtering to the classifier’s outputs, wherein additional rules or conditions are set on the predictions to better identify and filter out potential false positives and false negatives. The classification procedure can be described in detail as follows:
News headlines sample x is taken from dataset X and prepared by removing unwanted words and splitting them into the tokens based on the domain-specific dictionary. A significant keyword feature of sample x was extracted as keyfeature(x). The feature from the news headline sample x is examined. If a specific feature is not found in this sample x, the category of sample x (category(x)) is assigned as “other,” and then the first steps are repeated. Otherwise, the process moves on to the next step. After identifying that sample x exhibits a specific feature, the category is diagnosed by looking up in the CAFS classification rules and matching the features in sample x against every rule. The category with the highest matching score will be assigned.
where If the result obtains from previous step (
Repeat steps 1 to 4 for all news headlines sample x in dataset X.
The experiments were conducted using Python 3.7. Three classifiers, specifically SVM, LR, and NB, were implemented using Scikit-learn [22]. The LSTM and BiLSTM models were implemented using Keras [31], while BERT was implemented using transformers [32]. The hyperparameters utilized in the experimental evaluation for the baseline methods can be described as follows:
The SVM model utilized LinearSVC with one-vs-rest classifiers, the loss function employed was the square of the hinge loss, and the regularization parameter was set to 1. LR model employed multinomial logistic regression with l2 regularization. The optimization algorithm used was L-BFGS, and the regularization parameter was set to 1. The NB model estimated the probability distribution parameter using Laplace smoothing, where the parameter was set to 1. The prior probability of the classes was adjusted based on the data in the training set. The LSTM classification model consisted of one hidden layer of stacked LSTM with 15 units. The activation function for the fully-connected layer was SoftMax, the optimization algorithm used was Adam, and the model was trained for 10 epochs. The BiLSTM model was implemented using one hidden layer of Bidirectional LSTM units with 15 units. The activation function for the fully-connected layer was SoftMax, the optimization algorithm used was Adam, the dropout rate was set to 0.2, and the model was trained for 10 epochs. The BERT model was implemented based on DistilBERT. The feedforward network utilized ReLU as the activation function, while SoftMax was used as the activation function for the fully-connected layer. The optimization algorithm employed was Adam, the dropout rate was set to 0.2, and the number of training epochs was 1.
The six baseline classifiers were trained using the training datasets and the appropriate feature extraction method. In addition, hybrid classification methods were created by combining the CAFS classifiers with the baseline classifiers. The effectiveness of the classification methods was evaluated using accuracy (ACC), F1-score (F), and the Matthews correlation coefficient (MCC). These performance metrics are described as follows:
where TP represents the number of news headlines correctly identified as belonging to a specific class, TN represents the number of news headlines correctly identified as not belonging to a particular class, FP represents the number of news headlines that are actually not in a specific class but mistakenly identified as belonging to that class, and FN represents the number of news headlines that belong to a particular class but are incorrectly classified as not belonging to that class.
Moreover, Friedman’s test is employed to determine whether there are significant differences in the performance of all classifiers across multiple datasets. Additionally, McNamar’s test is used to determine significant differences in the performance of the baseline classifiers and the hybrid approach on the same dataset. The experimental results, as shown in Table 7, indicate that the hybrid approach achieves a classification accuracy comparable to the baseline methods. Moreover, the ranking performance based on ACC, MCC, and F1-score demonstrates a significant enhancement in classification results by combining the baseline classifiers with CAFS classifiers. Furthermore, the hybrid approach with SVM as the baseline classifier and CAFS classifier exhibits the best classification performance. Although the results depicted in Table 7 suggest differences in classifier performances, it is important to employ statistical tests to establish benchmarks and determine if a hybrid approach significantly outperforms existing baseline methods. These tests can also provide insights into the generalizability of classification performance by assessing significance across multiple datasets, confirming consistency and robustness across different datasets. Therefore, we utilized the Friedman test to evaluate the overall differences among the models in all dataset. The
The evaluation performance of classification methods with all testing datasets
McNemar statistical significance test for classification performance for all datasets
Example of classification results from CAFS
The ROC and Precision-recall curves of classification evaluation from three datasets: (a) Investing, (b) News headline, and (c) Twitter.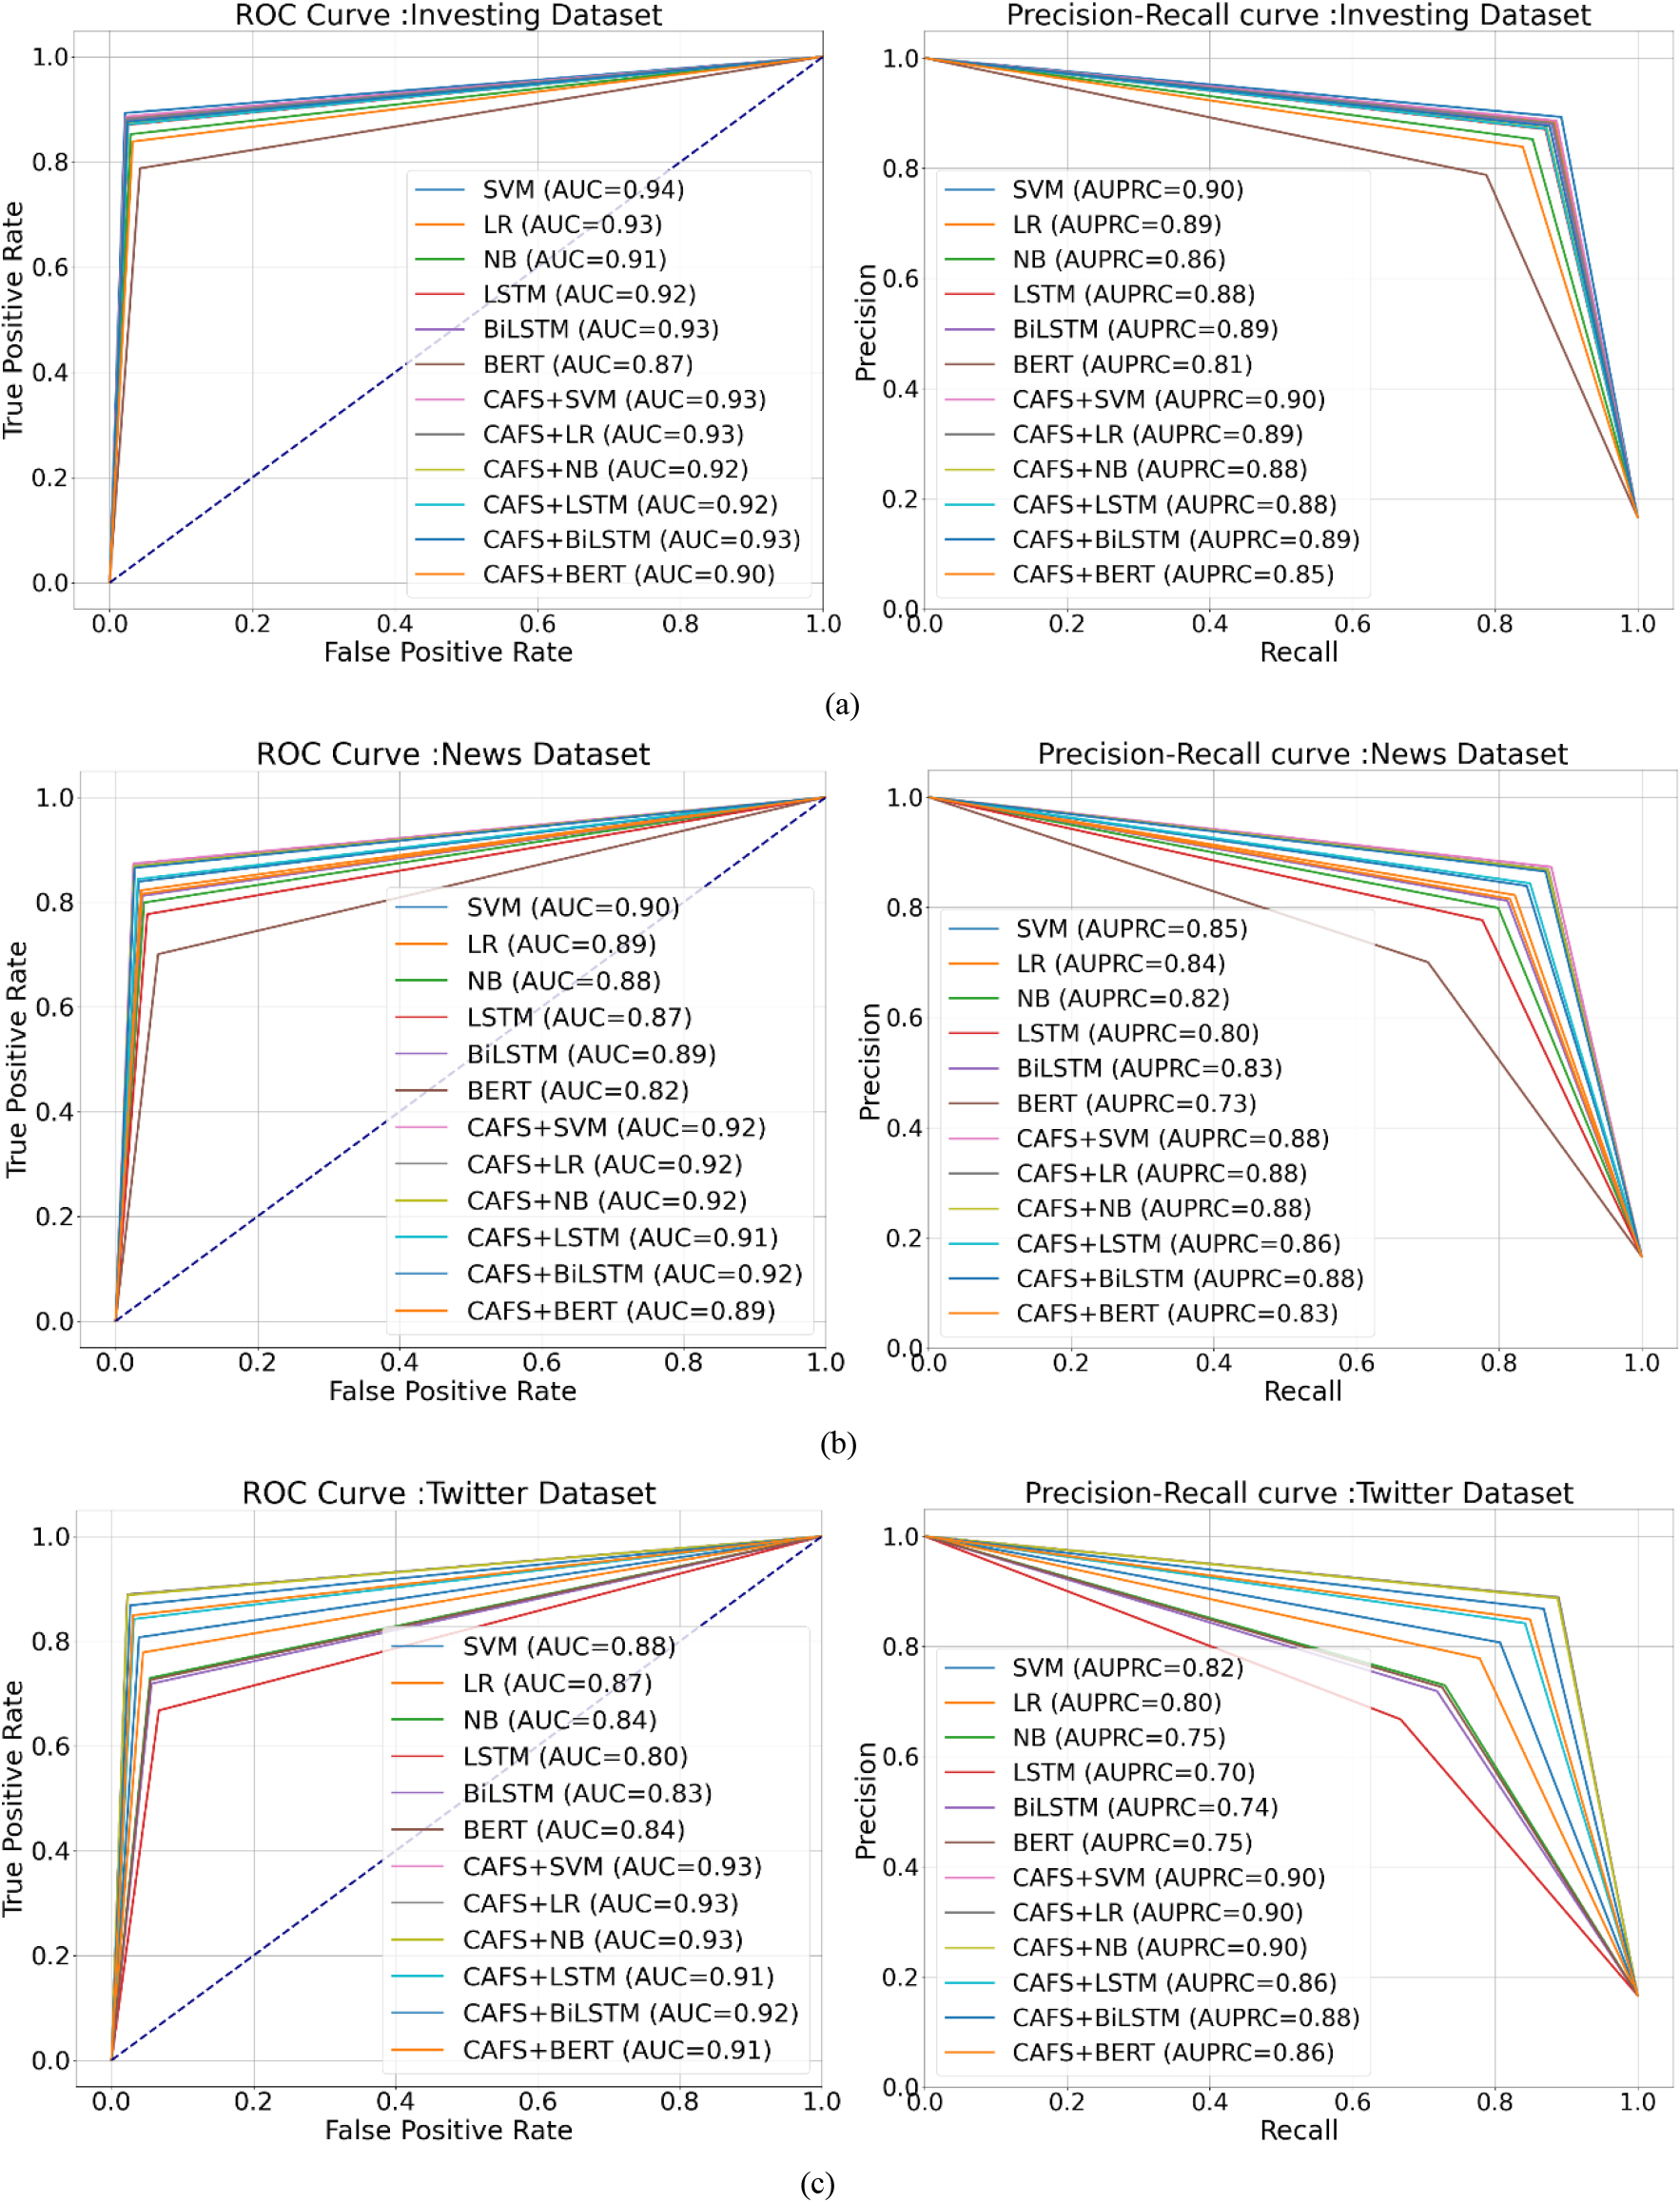
The portion of classification results from the hybrid approach for all datasets.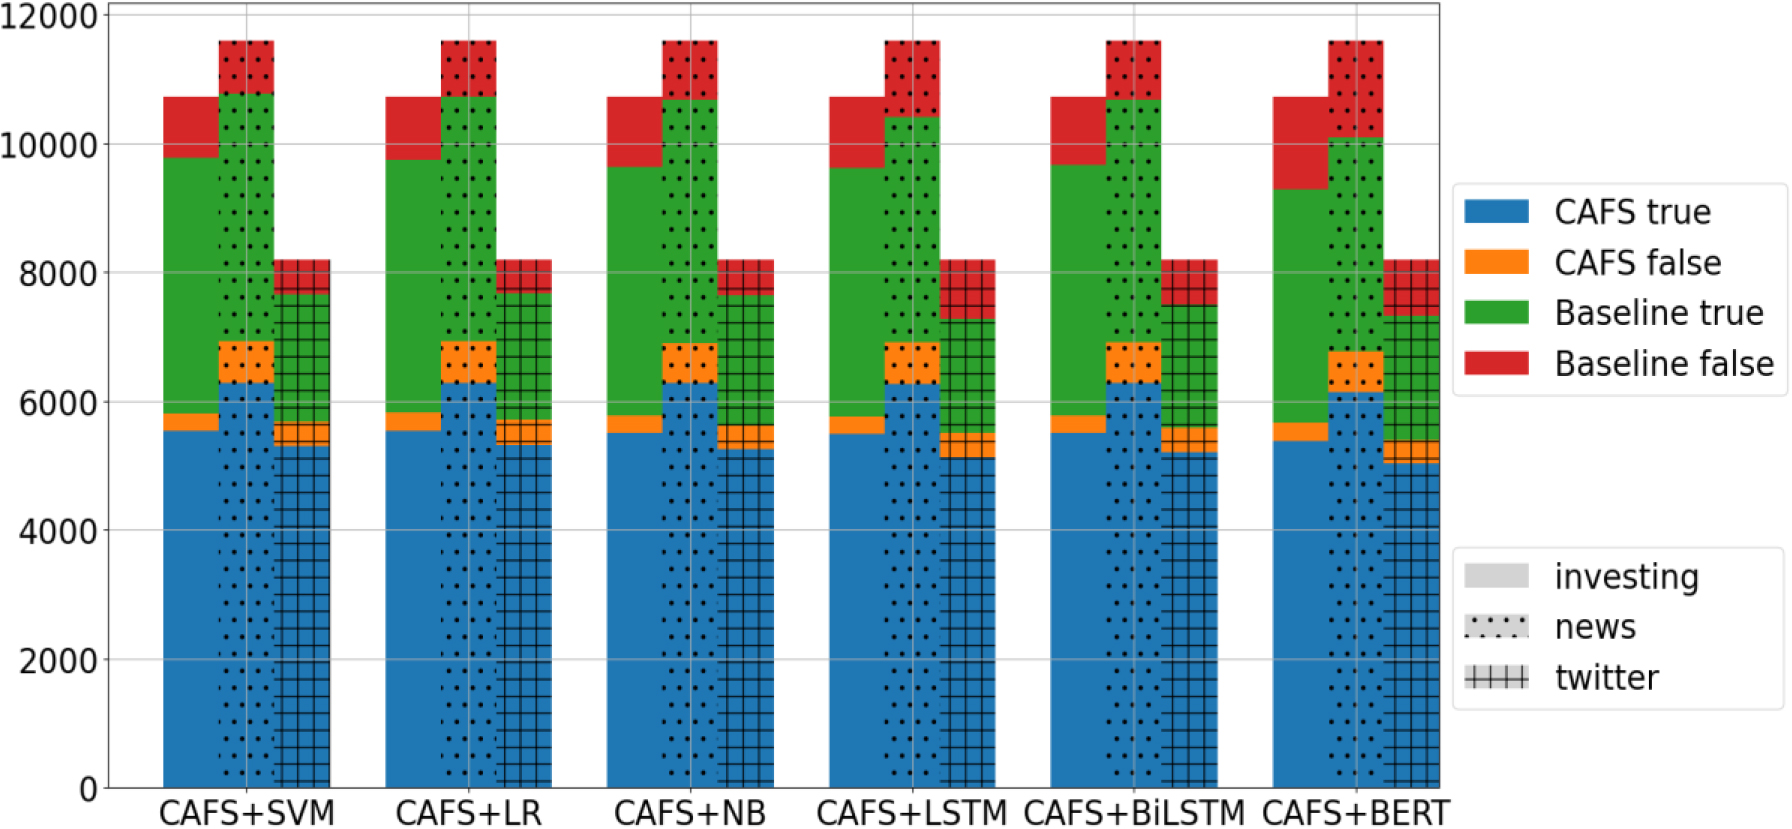
The Area Under the ROC Curve (AUC) and Area Under the Precision-Recall Curve (AUPRC) are employed to assess classification performance. The results of AUC and AUPRC, as depicted in Fig. 5, provide insights into the effectiveness of the hybrid approach across different datasets, highlighting its superiority in news headline and Twitter classification tasks while suggesting comparable performance in the investing dataset. Additionally, in a hybrid approach that combines two classification models, the proportion of classification results from each model can offer valuable insights into the overall classification process and aid in assessing the reliability of the hybrid model’s predictions. Based on the diagram in Fig. 6, the CAFS classifier consistently yields a larger portion of correct classification results, especially in the Twitter dataset. This suggests that it may be more accurate or better suited for categorizing out-of-domain datasets. Moreover, when hybrid models agree on a specific classification and consistently produce similar proportions of correct classifications across the three datasets, it boosts confidence in the accuracy of those predictions and indicates potential strengths in the hybrid approach.
In general, a news headline can be assigned multiple labels, belonging to more than one category. Furthermore, news categorization relies on the opinion of the author or columnist and may not always be relevant to the content itself. In this research, news headlines are assigned to only one category, and using a specific feature set for each category to classify news headlines may lead to misclassification, as demonstrated in Table 9. However, it is also evident that news headlines can be accurately assigned to relevant content. Therefore, the utilization of category-associated feature sets can enhance the performance of categorizers, making them suitable for economic and financial news classification.
A significant amount of economic and financial news is available from various sources, and the process of categorizing each article is time-consuming and requires human competence or expertise. Additionally, categorizing solely based on the opinions of authors or columnists may not be relevant to the content of the news headlines. This could confuse readers, as the headlines may not accurately reflect the content of the articles. This issue can have an undesirable impact on readers’ decision-making, particularly during times of an impending economic crisis when investors need to rapidly consume a large volume of news. Therefore, it is important to consider an accurate method for categorizing news headlines into their appropriate categories. Therefore, this research proposed a distinctive feature technique known as category-associated feature sets (CAFS) to enhance classification accuracy and provide a general categorization model for distinguishing news categories across various sources.
The experimental results indicated that the hybrid approach, which combined the baseline classifier with CAFS, demonstrated significant improvement in the classification results. Additionally, CAFS was found to achieve categorization performance comparable to the baseline methods in out-of-domain datasets. The SVM baseline classifier is recommended for use in the hybrid approach. The preliminary advantage of combining CAFS for classifying economic and financial news headlines is that the distinctive features can efficiently differentiate categories with impressive performance. Although all classifiers are trained solely using the news headline datasets, they are capable of delivering excellent classification results for short texts like the Twitter datasets. These findings demonstrate that CAFS has the ability to enhance the performance of categorizers by reducing the ambiguity of news headlines. It enables the evaluation of headlines from a multi-aspect-based opinion and accurately assigns them to a category with relevant content.
In conclusion, utilizing category-associated feature sets for economic and financial news classification proves to be valuable and appropriate for categorizing news headlines. Undoubtedly, this process holds great significance as it offers numerous benefits in analyzing financial markets and the economy. For instance, achieving a substantial number of accurate classification results for financial or economic categories can greatly impact the perception of market trends and facilitate the anticipation of important or critical events. Moreover, accurate category classification can lead to precise predictions, thereby benefiting various tasks such as sentiment analysis, news-based market prediction, and forecasting economic indicators.