
Abstract
BACKGROUND:
Nowadays organizations have made their human resource management process more strategic and serve as a strategic tool for achieving competitive advantage for the organization with the development of electronic-Human Resource Management (e-HRM) Systems. To measure e-HRM system acceptance for performing various HR functions of an organization, especially the HR department, a perception model for acceptance of e-HRM systems in IT and Non-IT organizations has been developed in this research paper.
OBJECTIVE:
The objective of the study is to derive an acceptance model that can predict the acceptability and the factors affecting the acceptance of e-HRM systems in IT and Non-IT organizations. For this purpose, an electronic-survey-based questionnaire with a set of questions with categorical response options has been developed and the responses collected through this questionnaire are eligible to measure the acceptance level with effectiveness and usefulness of the e-HRM systems by IT and Non-IT business organizations.
METHODS:
Here, the questionnaire has 22 parameters. During data collection, 400 samples are obtained from 20 IT and 20 Non-IT (other services) organizations where ten employees from each organization participated in the survey. For the Data analysis for the acceptance model and also for testing of the hypothesis, several statistical-based data analysis techniques such as Data Reliability, Cross Tabulation, Normality test, Correlation ∖& Regression-based analysis, Factor Analysis, along with Pearson Chi-Square, Mann-Whitney U, Wilcoxon W for hypothetical testings are done. Apart from these criteria, using the data analysis techniques, a well-known technology acceptance model for the e-HRM system has also been employed to test with variables of the proposed questionnaire for the acceptance of e-HRM systems.
RESULTS:
All the statistical tests and testing of hypotheses are done in a sequential manner for comparison purposes of factors that affect e-HRM systems in IT and Non-IT organizations. The results are reported in detail with explanations and justifications.
CONCLUSION:
The results of the data analyses can be concluded with finding and discussing that the acceptability of e-HRM systems by the end users in IT firms is much higher than in other service organizations because of the significant difference in presence of external factors, perceived usefulness, perceived ease of use, user attitude, and behavior between the IT and Non-IT groups of organizations.


Introduction
Any organisation’s success is primarily based on the competitive advantages it has over its rivals in the industry and the related industries, which is only possible by the sincere and integrated contributions of the employees through their innovative and creative moves in the organization. To develop and maintain a creative workforce in an organization, a Human Resource Management (HRM) [1] System is much needed to help strategically manage the employees’ effectiveness and other functional areas in the organization. The HRM system works with the employees to benefit their growth, development, and job satisfaction while ensuring their job safety, enrichment, and participation in strategic decision-making. Human Resource (HR) professionals use technologically derived information to make decisions for the organization’s success. This IT-related HR information speeds up the response time, increases productivity, and improves decision-making. The IT-based HR solutions have successfully reduced cost, improved service quality, and improved the culture of the users [2]. The vast development of the internet and online-based applications help implement and accept HR solutions most effectively. Finally, when it comes to an electronic solution to Human Resource Management (e-HRM), software or models can show high-end results [3]. An e-HRM system is based on support and HR activities’ networks using IT facilities. Several organizations already use these facilities that have enhanced their HRM functions and outcomes by introducing in-house or bought e-HRM systems in organizations [4].
The HR function of an organisation is responsible for complying with the organization’s HR needs. Likewise, other business functions, HR strategies, policies, practices, and systems must be implemented to ensure the organization’s smooth running and also prepare the organization for guaranteed smooth operation in the near future. Implementing e-HRM technology can be a way of successfully executing these HR strategies, policies, and practices. Through web-technology-based channels, the e-HRM technology supports the HR function in complying with the HR needs of the organizations [5]. Managers, employees, and HR professionals can view, attract, or alter information necessary for managing the organization’s human resources using different e-HRM portals. Berber [6] suggested that e-HRM and its self-service features can be one of the cheapest and fastest ways to perform specific HR activities. So, for the HR function, e-HRM can significantly affect efficiency and effectiveness. Efficiency can be improved by reduced cycle times for doing routine paperwork, increased accuracy in data and information gathering, and reduced HR headcounts. Effectiveness can be enhanced by improved managerial and employee capabilities in making better and timelier decisions. E-knowledge management and the creation of intellectual and social capital using e-HRM systems provides the HR function the opportunity to create new avenues for contributing to organizational effectiveness [7].
Hence, the implementation of the e-HRM system is based on the below literature-based facts in place of the e-HRM systems: Managers can have better access to relevant information and data, conduct analysis, make decisions, and communicate with others by the Manager Self Service (MSS) application of the e-HRM system without being dependent on the HR professionals. Employees can control their personal information and, update it, make their own decisions based on their situation without being dependent on HR professionals through the Employee Self-Service (ESS) application of the e-HRM system. The HR department can enhance organisational efficiency and effectiveness with the e-HRM system by improvising the competencies of both managers and employees in making better and timelier decisions. HR functions performed on the e-HRM system have the potential to create value for the organization in new and varied ways.
Literature review
Human Resource Management (HRM) goals are incorporated into the e-HRM technology [8]. Generally, the goals of HRM are divided into four categories: (a) addressing the strategic business objectives, (b) increasing the cost-effectiveness, (c) improving the services for internal customers, and (d) improving the global orientation for HRM [9]. These goals are the drivers for e-HRM technology that make the HR function’s transformational and transactional goals successful. Transformational goals are related to the relaxation of time for HR managers and executives to focus on more strategic issues and make them capable of finding solutions with more business strategic objectives. The transactional goals are related to the cost reduction and improvement of the productive factors and delivering services to HR stakeholders [10]. These goals contribute toward understanding any e-HRM model being implemented in different organizations. E-HRM uses web-based technology that makes the HRM functions more worthy, strategic, efficient, and effective for the organization [11]. It helps the organization face various challenges and change the belief of top management of HRM, considered more of a cost center. e-HRM eases employees’ HR-related routine work and improves their jobs, making employees valuable and rare and rare and inimitable, and organized assets to the organization. Apart from these, the other usability of HRM systems has also been discussed by the different models proposed by HRM researchers.
According to Lepak and Snell [12], Information Technology (IT) has an operational, relational, and transformational effect on HR services which are as follows: (i) Operational goal is one of the outcomes of e-HRM services which has the objective to measure the types of the transaction, the purpose of reduction of HR staff from the administrative services [3], (ii) The relational goal provides HR information through remote access to the managers and employees. It increases their connectivity with the organization’s other services as well as outside of the organization [7], (iii) The transformational goal provides the facilities for communicating and sharing information between employees through a network system [13]. Zhang and Wang [14] developed an e-HRM model for intelligent information processing for China enterprises by summarizing various HRM problems with their solutions concerning their tasks, goals, and software modules. The objective of e-HRM is to achieve automatic outcomes that may be unrealistic or simple but will lead to the same consequences as HR services perform. Parry and Tyson [15] have discussed e-HRM goals into five different categories, which are (a) Operational and efficiency, (b) Service delivery, (c) Empowerment of managers, (d) Strategic orientation, and (e) Standardization. To achieve these e-HRM objectives concerning their goals and outcomes, a case study for e-HRM technology is performed by Parry and Tyson for both IT (BSB, IBM, Nortel) and Non-IT (BOC, CRUK, CPS, MaS, NU, TfL) companies.
E-HRM activities are the essential functioning components of the e-HRM model. These activities take care of various IT-based HR applications like e-Compensation, e-Learning, e-Performance management, e- Selection, e-Recruitment, etc. [16]. Based on these activities, e-HRM packages with the diffusion of innovation theory were proposed by Bondarouk and Schilling [17]. The quantitative analysis for social media is introduced into e-HRM practices. This technology-based HRM (e-HRM) model has different modules such as recruitment (hiring process, mapping for the position, handling carrier pages, managing candidates, evaluation of candidates, analysis, and report), core HR functionalities, payroll, benefits management, expense management, compensation management, employee management, talent management, performance management and workflow of HR [8]. E-HRM is more beneficial to the organization than traditional or paper-based HRM, but it still has some limitations and pitfalls. According to the usability of e-HRM, it may reduce the cost of HR personnel, but it may increase the technical staff requirements with specialized knowledge of technology.
Research gap
The research objectives were set after an extensive review of the literature which suggested that though much has been highlighted, the inter-segmental (IT & non-IT) differences need to be addressed. The best practices to accommodate these differences have yet to be highlighted. Technology firms are better able to accept external technology knowledge than non-tech firms. E-HRM being a web technology-based system, requires technical know-how, which IT firms have in their very inherent nature. At the organizational and individual levels, e-HRM acceptance and usage depend on perceived usefulness, ease of use, attitude, and behavioral intentions associated with organizational systems. Since IT work culture differs from work culture in the non-IT sector, the acceptance level for e-HRM systems may differ in these two sectors, and finding out the actual scenario is the objective behind this study. A firm with businesses in IT adopts HR management practices very different from those of firms dealing in other services. Technology firms have a better capability to absorb external technology knowledge [18] successfully. There needs to be more initiative to understand e-HRM practices under the umbrella of IT/non-IT sectors, though many organizations have implemented various initiatives within the last few decades to deal with this web-based technology. This is a big gap as, going by the current trends, the work culture in these two segments will converge slowly to a common platform. The practices and culture in IT are gradually creeping into the non-IT regarding technology introduction, implementation, and acceptance. This exchange of practices is needed in the current scenario as non-IT companies structured mainly around the old homogeneous model are diminishing their potential to grow and compete in a global marketplace. At the same time, IT companies also envisage a stable and mature organizational culture to sustain their business models. Hence for both sectors to survive and thrive, there is an inherent value in incorporating each other’s best e-human resource management practices.
Methodology
In the HR context, e-HRM has excellent potential to improve both efficiency and effectiveness. With the development of the e-HRM concept, organizations have made their human resource management process more strategic and serve as a competitive advantage. Hence, studies need to be conducted to measure e-HRM system acceptance for performing various functions of an organization, especially the HR department. E-HRM implementation may take a different course in different kinds of organizations, mainly when grouped under the IT and Non-IT categories. This comparative study will highlight the different ways of implementing e-HRM systems in different kinds of organizations and their acceptance. New technology means more expense, training, and getting acceptability in the organization. Based on the above concepts, this study will also try to find out the actual and not just the expected benefits of e-HRM systems for different types of organizations so that the organizations start implementing this new technology-based HRM without hesitation and uncertainty. Here the acceptance of the HRM has been incorporated through e-survey-based questionnaires with some set of questions with categorical responses. The data collected through this questionnaire will be eligible to measure the acceptance level with effectiveness and usefulness of the e-HRM system by IT and Non-IT business organizations.
Questionnaire description
In this section, questionnaires used for the study incorporate a set of questions with a choice of answers for the statistical and empirical study of the effectiveness and usefulness of the e-HRM system in an organization. The layout of this questionnaire rests on the research questions that address the issue of ‘how e-HRM can be best and effective for the organization.’ Generally, the questionnaire can be prepared based on two survey methods: (a) self-administered questionnaires and (b) interviewed-administered questionnaires [18]. The Self-administered survey method [19] is conducted by sending the questionnaires the hard copy or soft copy electronically (i.e., via mail or email through the internet). The interview survey method is performed through telephonic interview recordings on the phone or in person. Here we have employed the self-administrated questionnaire (SAQ) survey method. Here the SAQ method is executed without any feedback process. We minimize the data collection errors, double negatives, confusing words, and ambiguous words in the questionnaire-based e-Survey method.
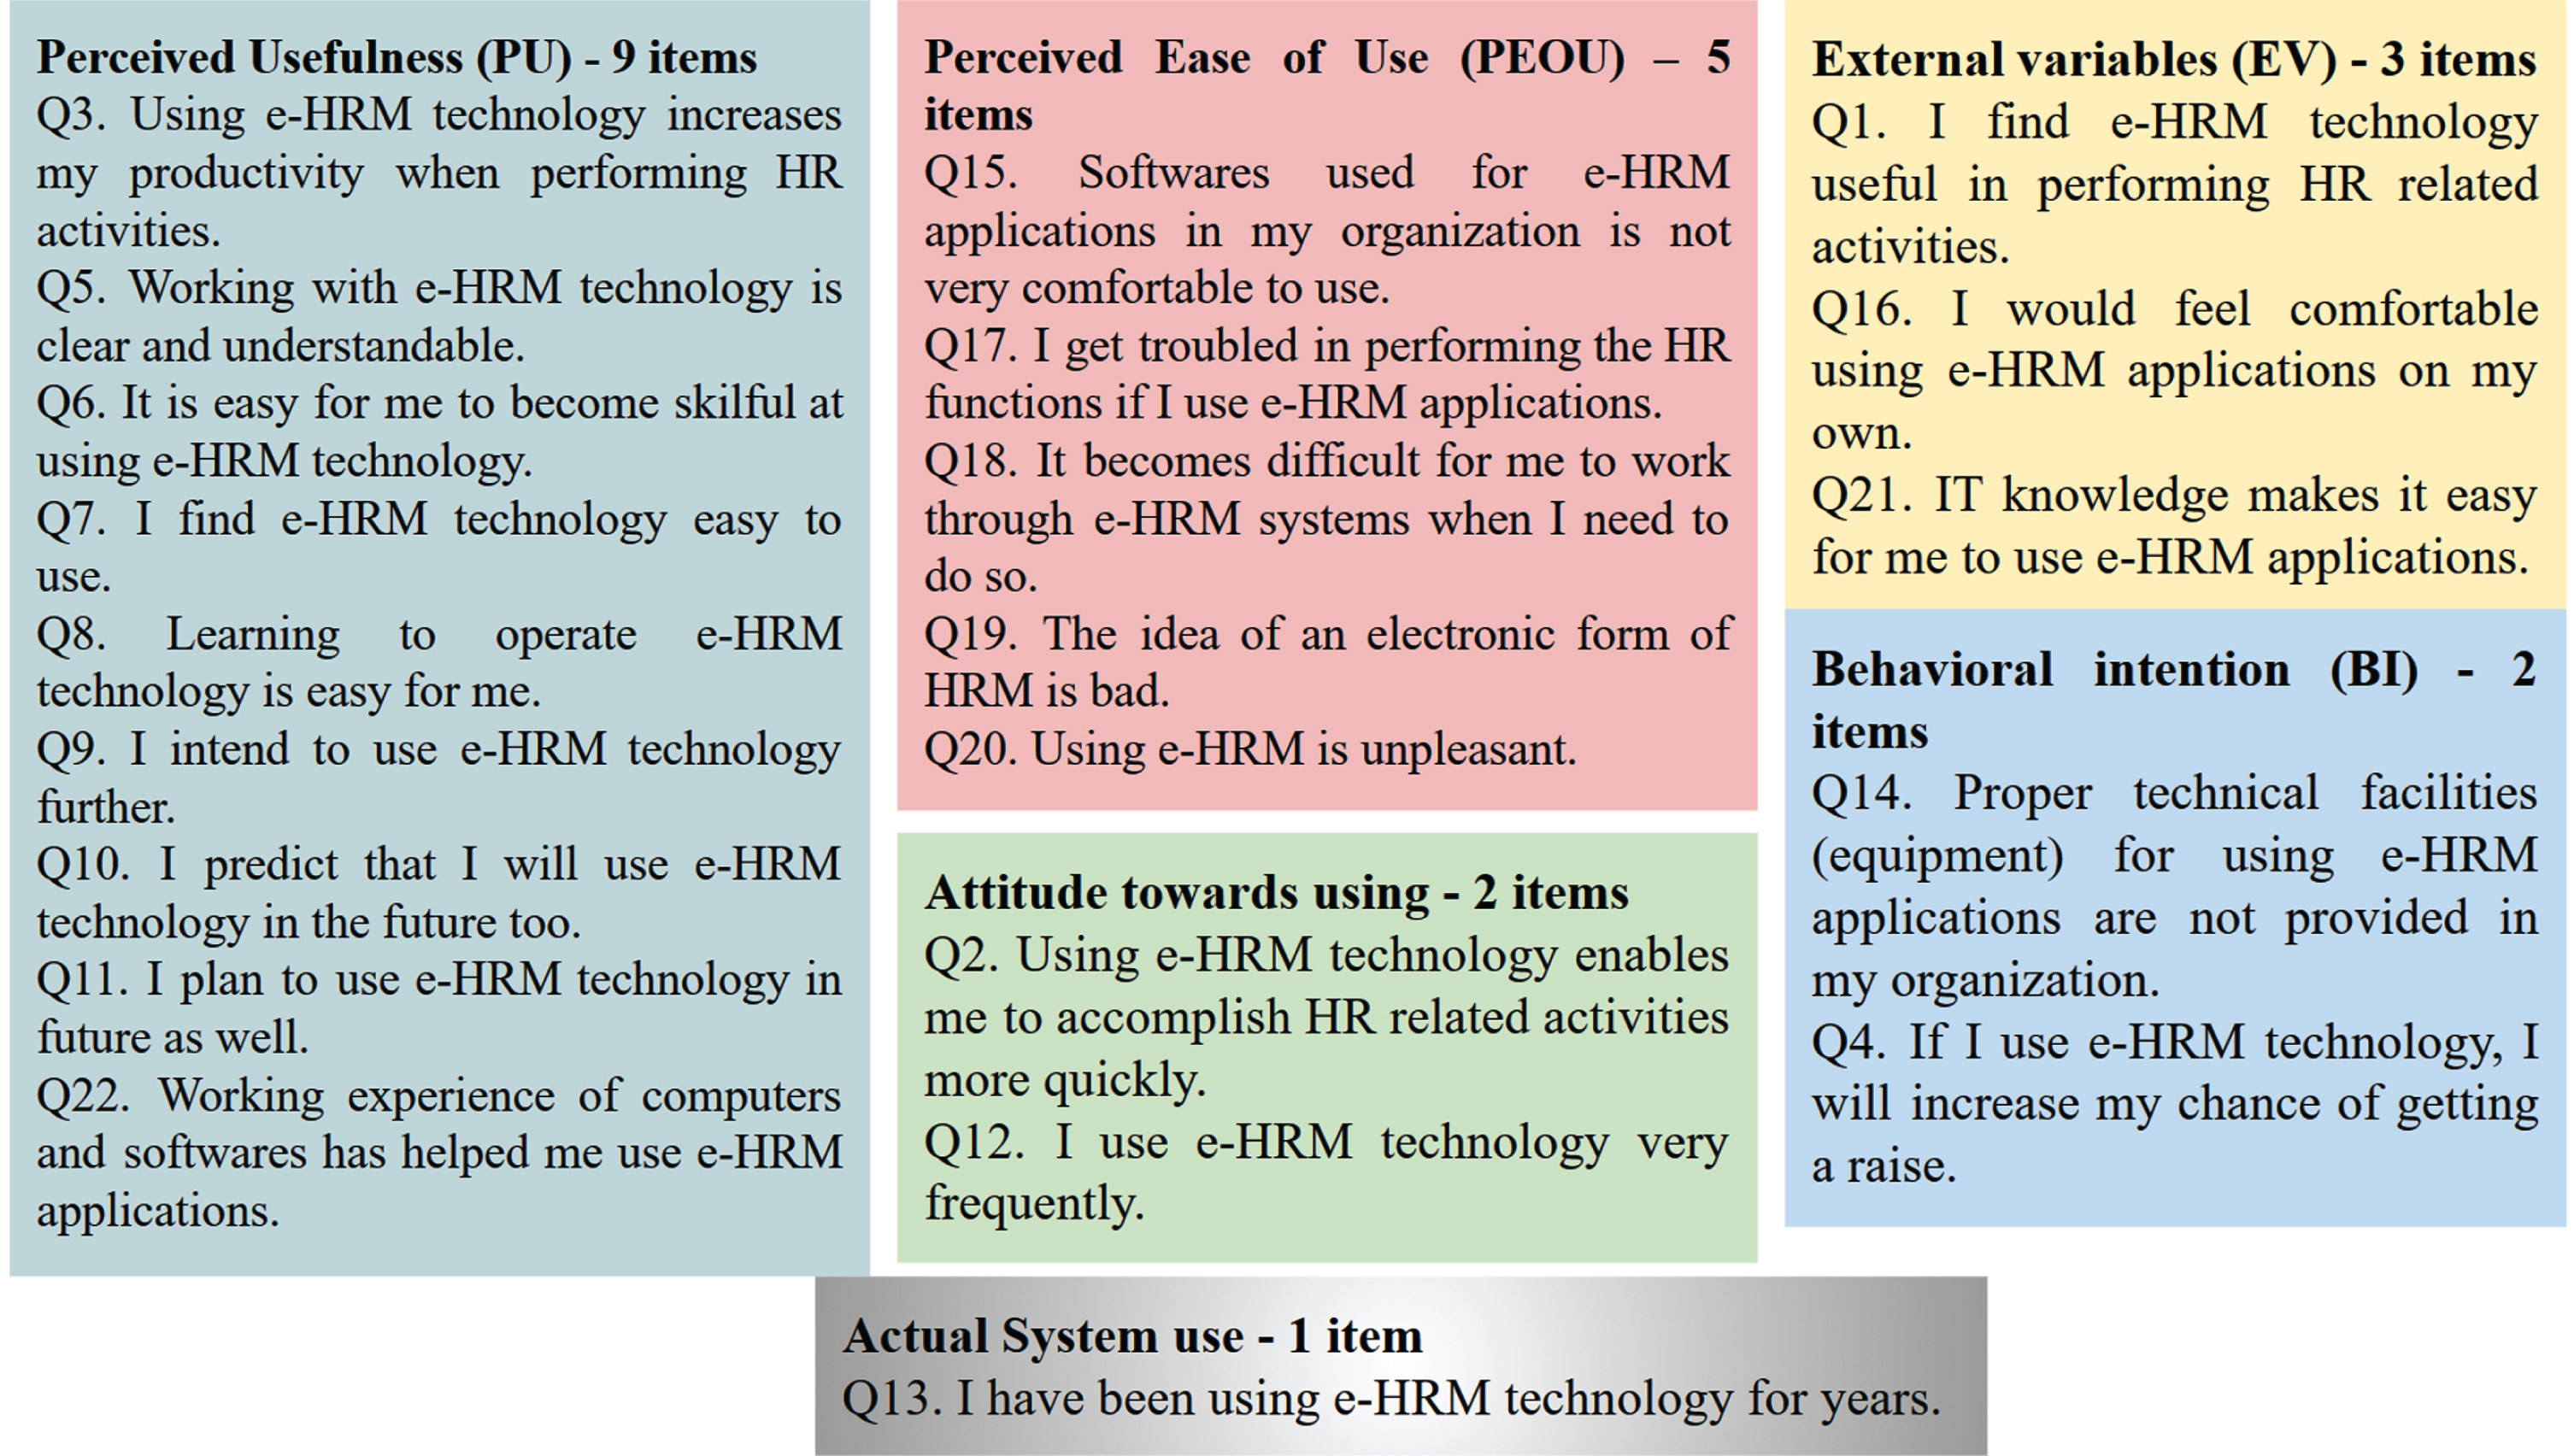
The questions in the questionnaire are well-formatted and made available online for the web-based survey purpose to maximize the information gathered while incorporating the cross-cultural data collection designs. The aim is to measure the user perception of factors of the e-HRM acceptance model that affect an organization’s human resource management performance. So, using this e-study based on a questionnaire, we try to find the fruitfulness, effectiveness, and success of the usability of the e-HRM system within the organization. Here, we have introduced twenty-two questions (variables) for the questionnaire (shown in Fig. 1 in the Annexure section). The questionnaire variables have been fixed based on some literature reviews [20] discussed above in the context of e-HRM technologies and their applications. Each variable has been framed as a sentence. The answer type of each variable is categorized into five scales such as Strongly Agree (scaled 5), Agree (scaled 4), Neither Agree Nor Disagree (scaled 3), Disagree (scaled 2), and Strongly Disagree (scaled 1) respectively corresponds to each variable. Here, each variable has positive sentences, while some negative sentences are introduced to the 14, 15, 17, 18, 19, and 20 variables. To maintain the unbiasedness between the answers of the variables, these positive and negative sentences have been introduced in the proposed questionnaire. Here, the five scales of answers to negative sentences are set as Strongly Agree (scaled 1), Agree (scaled 2), Neither Agree Nor disagree (scaled 3), Disagree (scaled 4), and Strongly Disagree (scaled 5), respectively.
The questionnaire (Fig. 1 in the Annexure section) has 22 variables, each with five scales to be answered. The items of e-HRM acceptance measure the experiences, knowledge, comfortability, level of difficulties, and understandability of the use of the e-HRM model by the employees. Each item of the questionnaire is responded to in five Likert scales: ‘Strongly Agree’ (scaled 5), ‘Agree’ (scaled 4), ‘Neither Agree Nor Disagree’ (scaled 3), ‘Disagree’ (scaled 2) and ‘Strongly Disagree’ (scaled 1)). The objective of using these variables is to study the acceptance of e-HRM technology for IT as well as Non-IT organizations and derive the prediction model that will bring the following criteria: A cause-effect relationship is established between IT and other organizations by statistically analyzing the combined effects of IT and HR capabilities and validating the e-HRM model. A decision-making system is proposed to predict the usability and rationale of e-HRM. The usage and usefulness of the e-HRM model are achieved by finding its satisfaction level for acceptance within the organization. To test whether the e-HRM applications in IT and Non-IT organizations are equally or unequally accepted among users.
So, to establish the above criteria, some rigorous data analysis requirements have been employed to prove these criteria and test the hypotheses. Working flow diagram of the employed data analysis is demonstrated in Fig. 2.
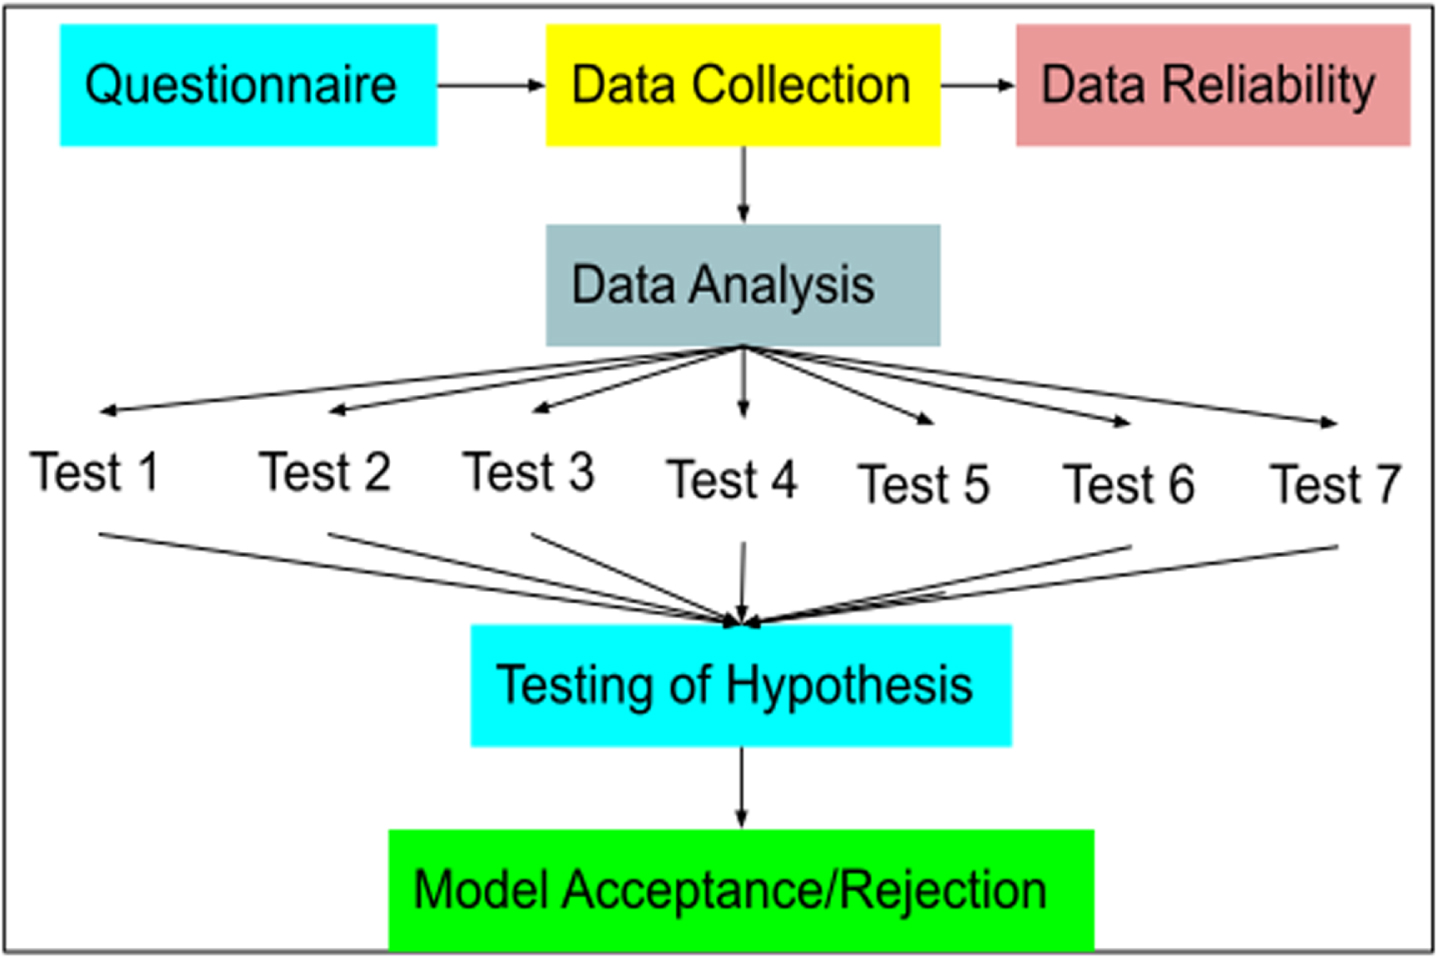
Working flow diagram of the employed data analysis.
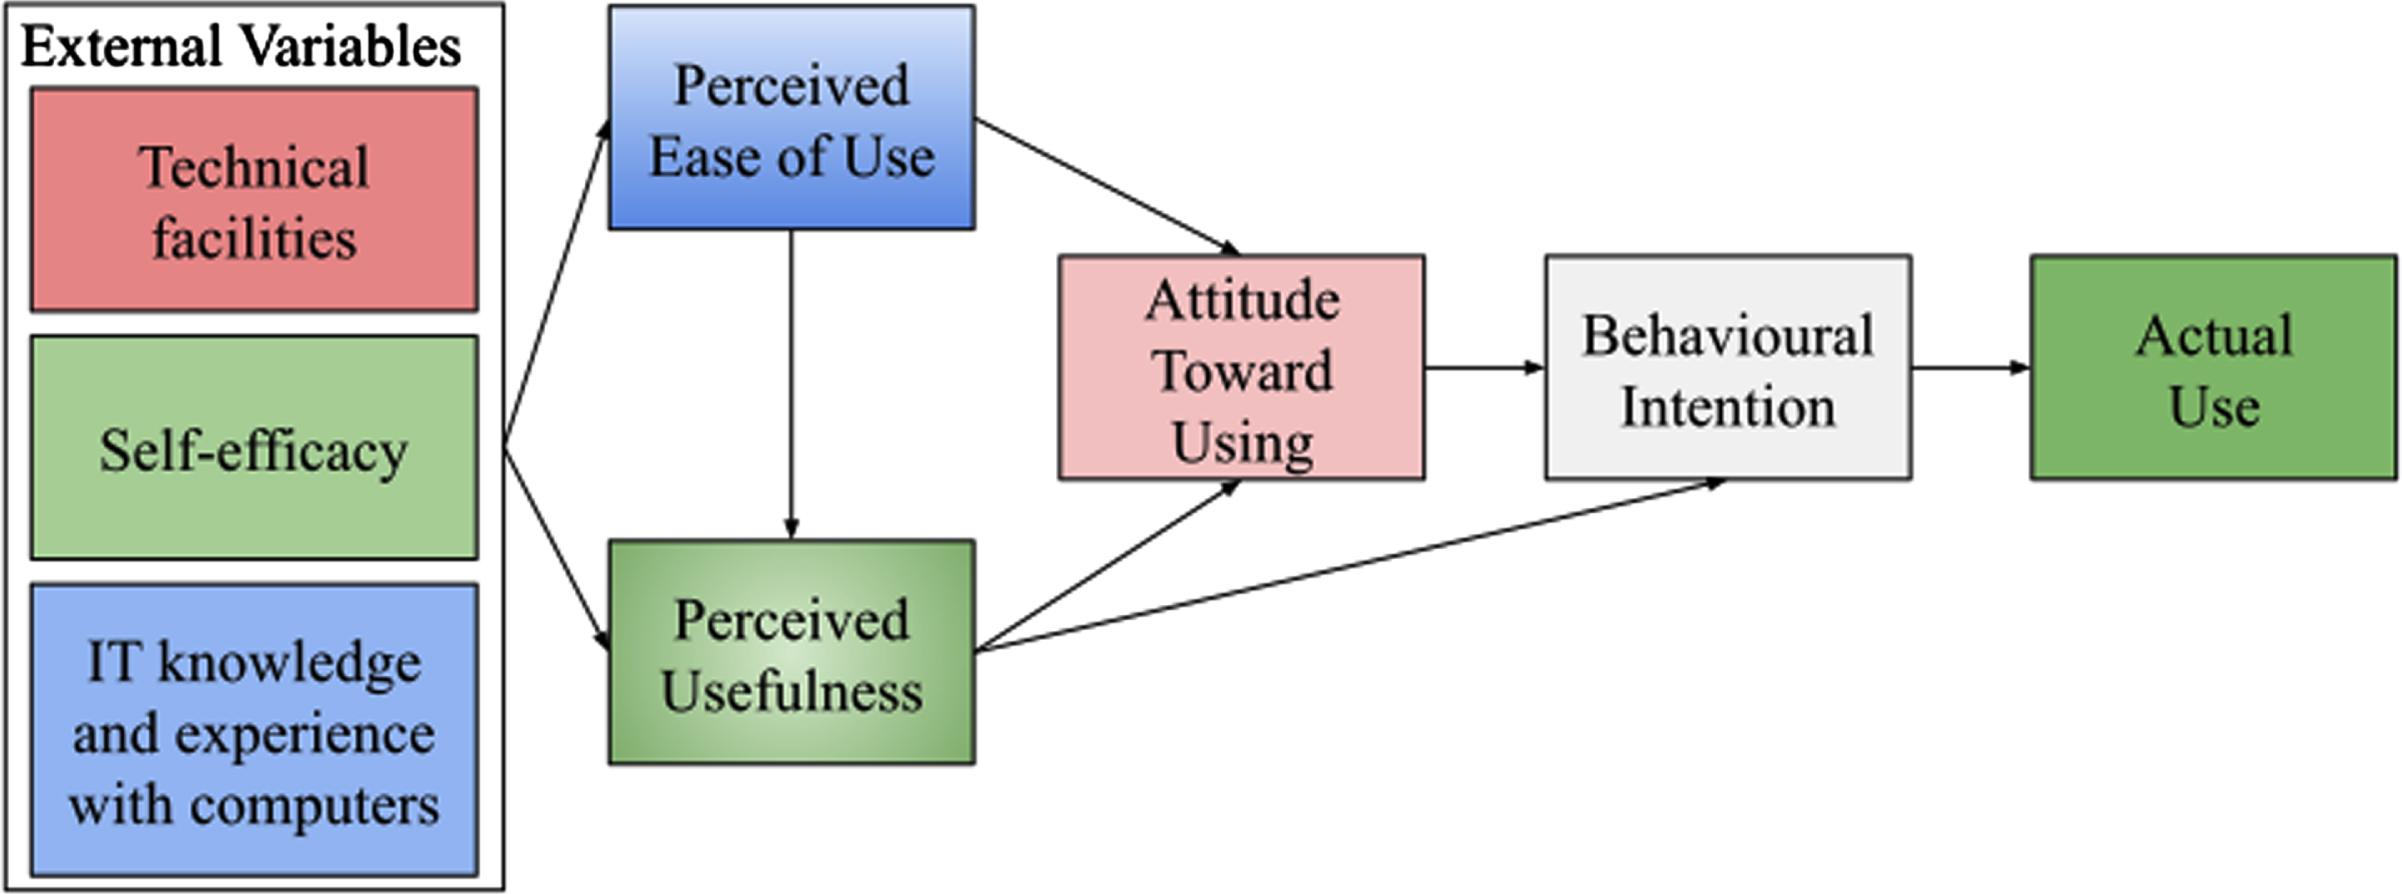
Apart from these criteria, using the proposed data analysis techniques, a well-known technology acceptance model for an e-HRM system [21, 22] has also been tested with the questionnaire variables. The employed Technology Acceptance Model (TAM) was developed by Davis (1986). It comprises two beliefs, the perceived utilities and the perceived ease of application, which determine attitudes to adopt new technologies. The attitude toward adoption will decide the adopter’s positive or negative behavior concerning new technology. External factors influencing the perceived ease of use and attitude are social (Peers and Superiors) influences, self-efficacy, and technological facility. Adapted from the study Extended TAM model, conducted by Nath, Bhal and Kapoor (2013) (Factors influencing IT adoption by bank employees: An extended TAM approach. Vikalpa, 38(4), 83-96), the e-HRM’s acceptance will be determined.
A block diagram of this TAM is shown in Fig. 3. The usefulness of TAM here comes with its capability of explaining user behavior in a wide range of end-user acceptance of computing technologies. The objective for employing this model is to validate the perception model through the parameters in the questionnaire so that the acceptability of e-HRM systems by the end users of IT and Non-IT organizations can be found. To fulfill this objective, some hypotheses are also proposed for testing the TAM for e-HRM in light of parameters employed in the questionnaire for the acceptability of e-HRM systems.
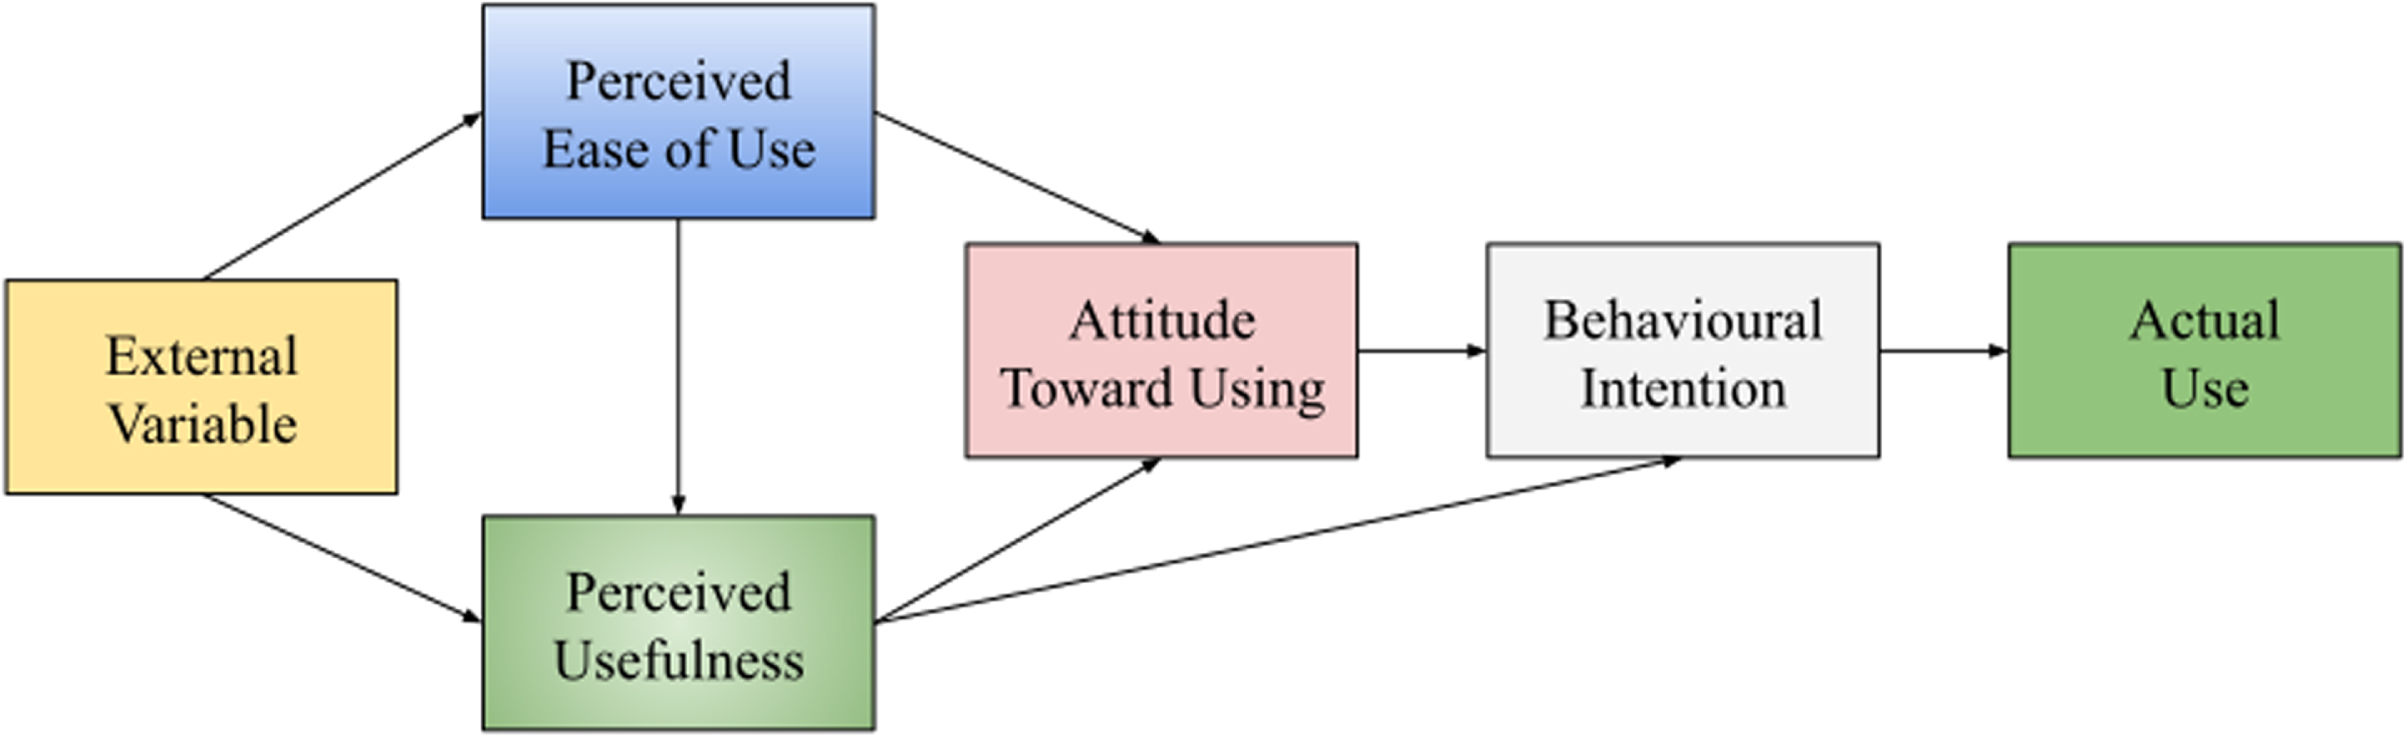
Technology acceptance model (TAM). Source: Davis et al. [21].
So, to test the perception model of acceptance of the e-HRM system using Davis TAM, here, the grouping of twenty-two variables of the questionnaire is performed into six groups based on the multi-factor analysis (performed in the Results and discussion 2 section) for each mediating variable which are as follows:
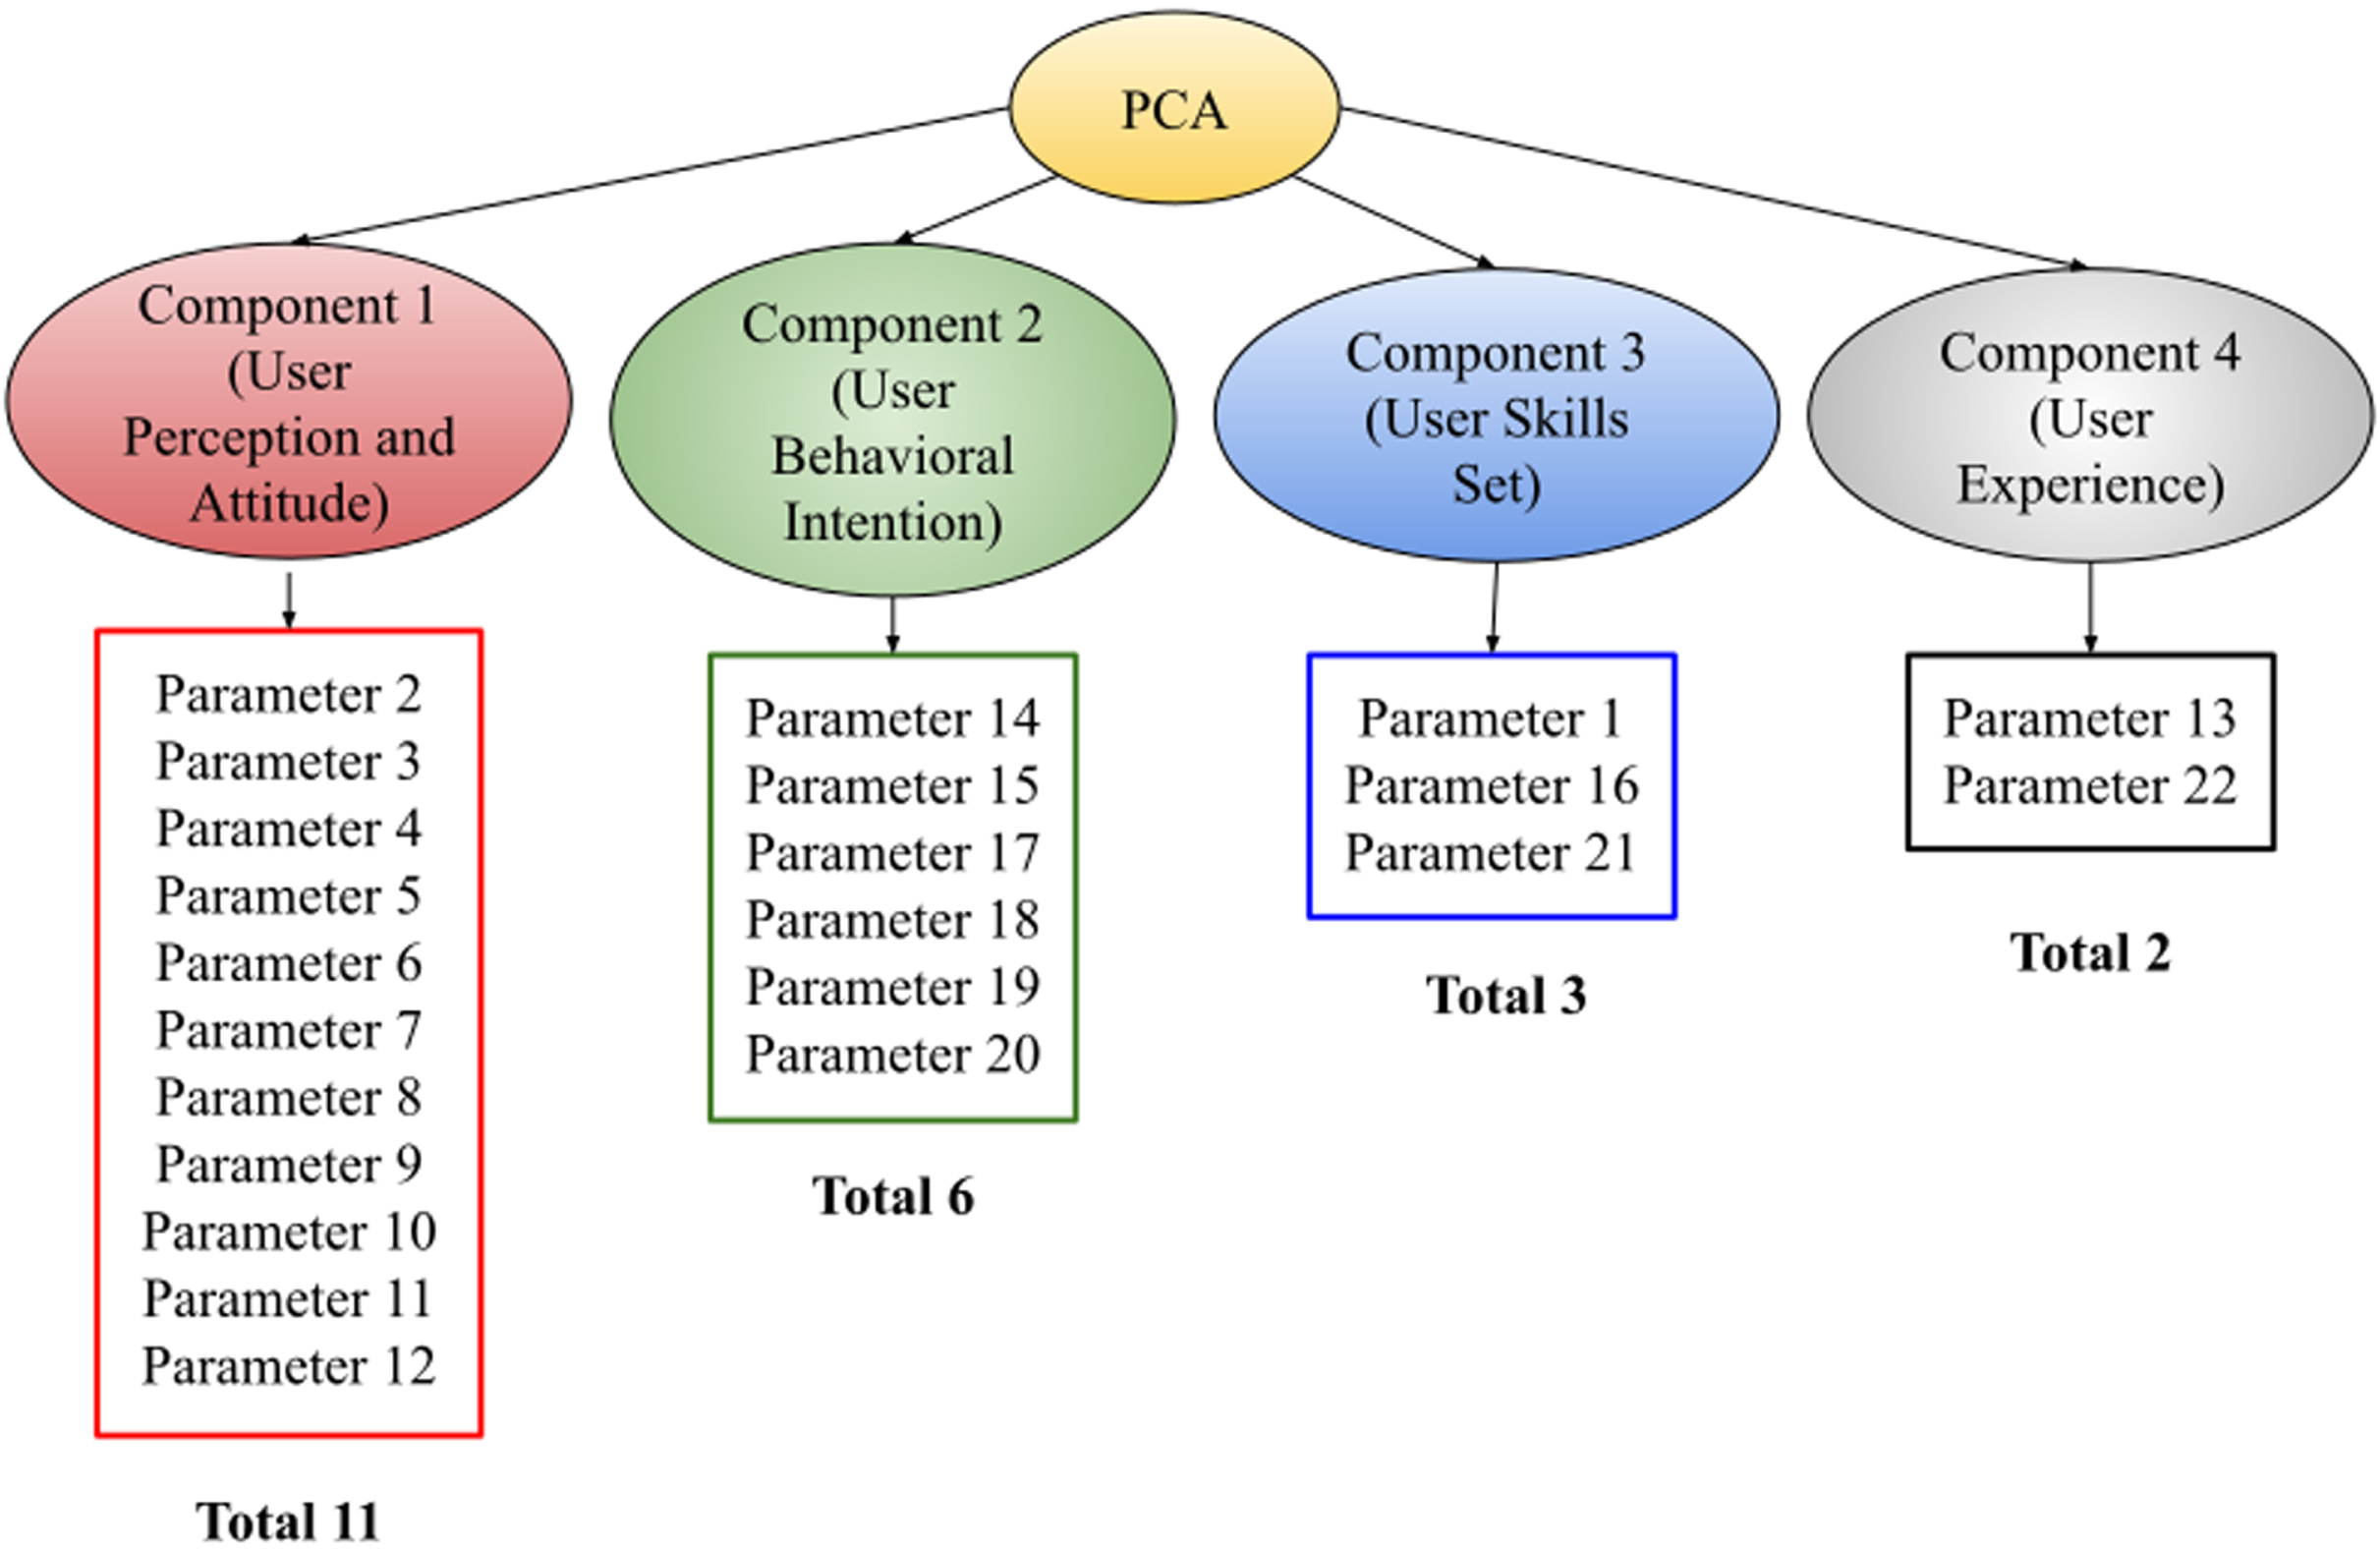
Grouping of principal components with respect to parameters listed in Table 7, keeping 0.0 threshold for factor values.
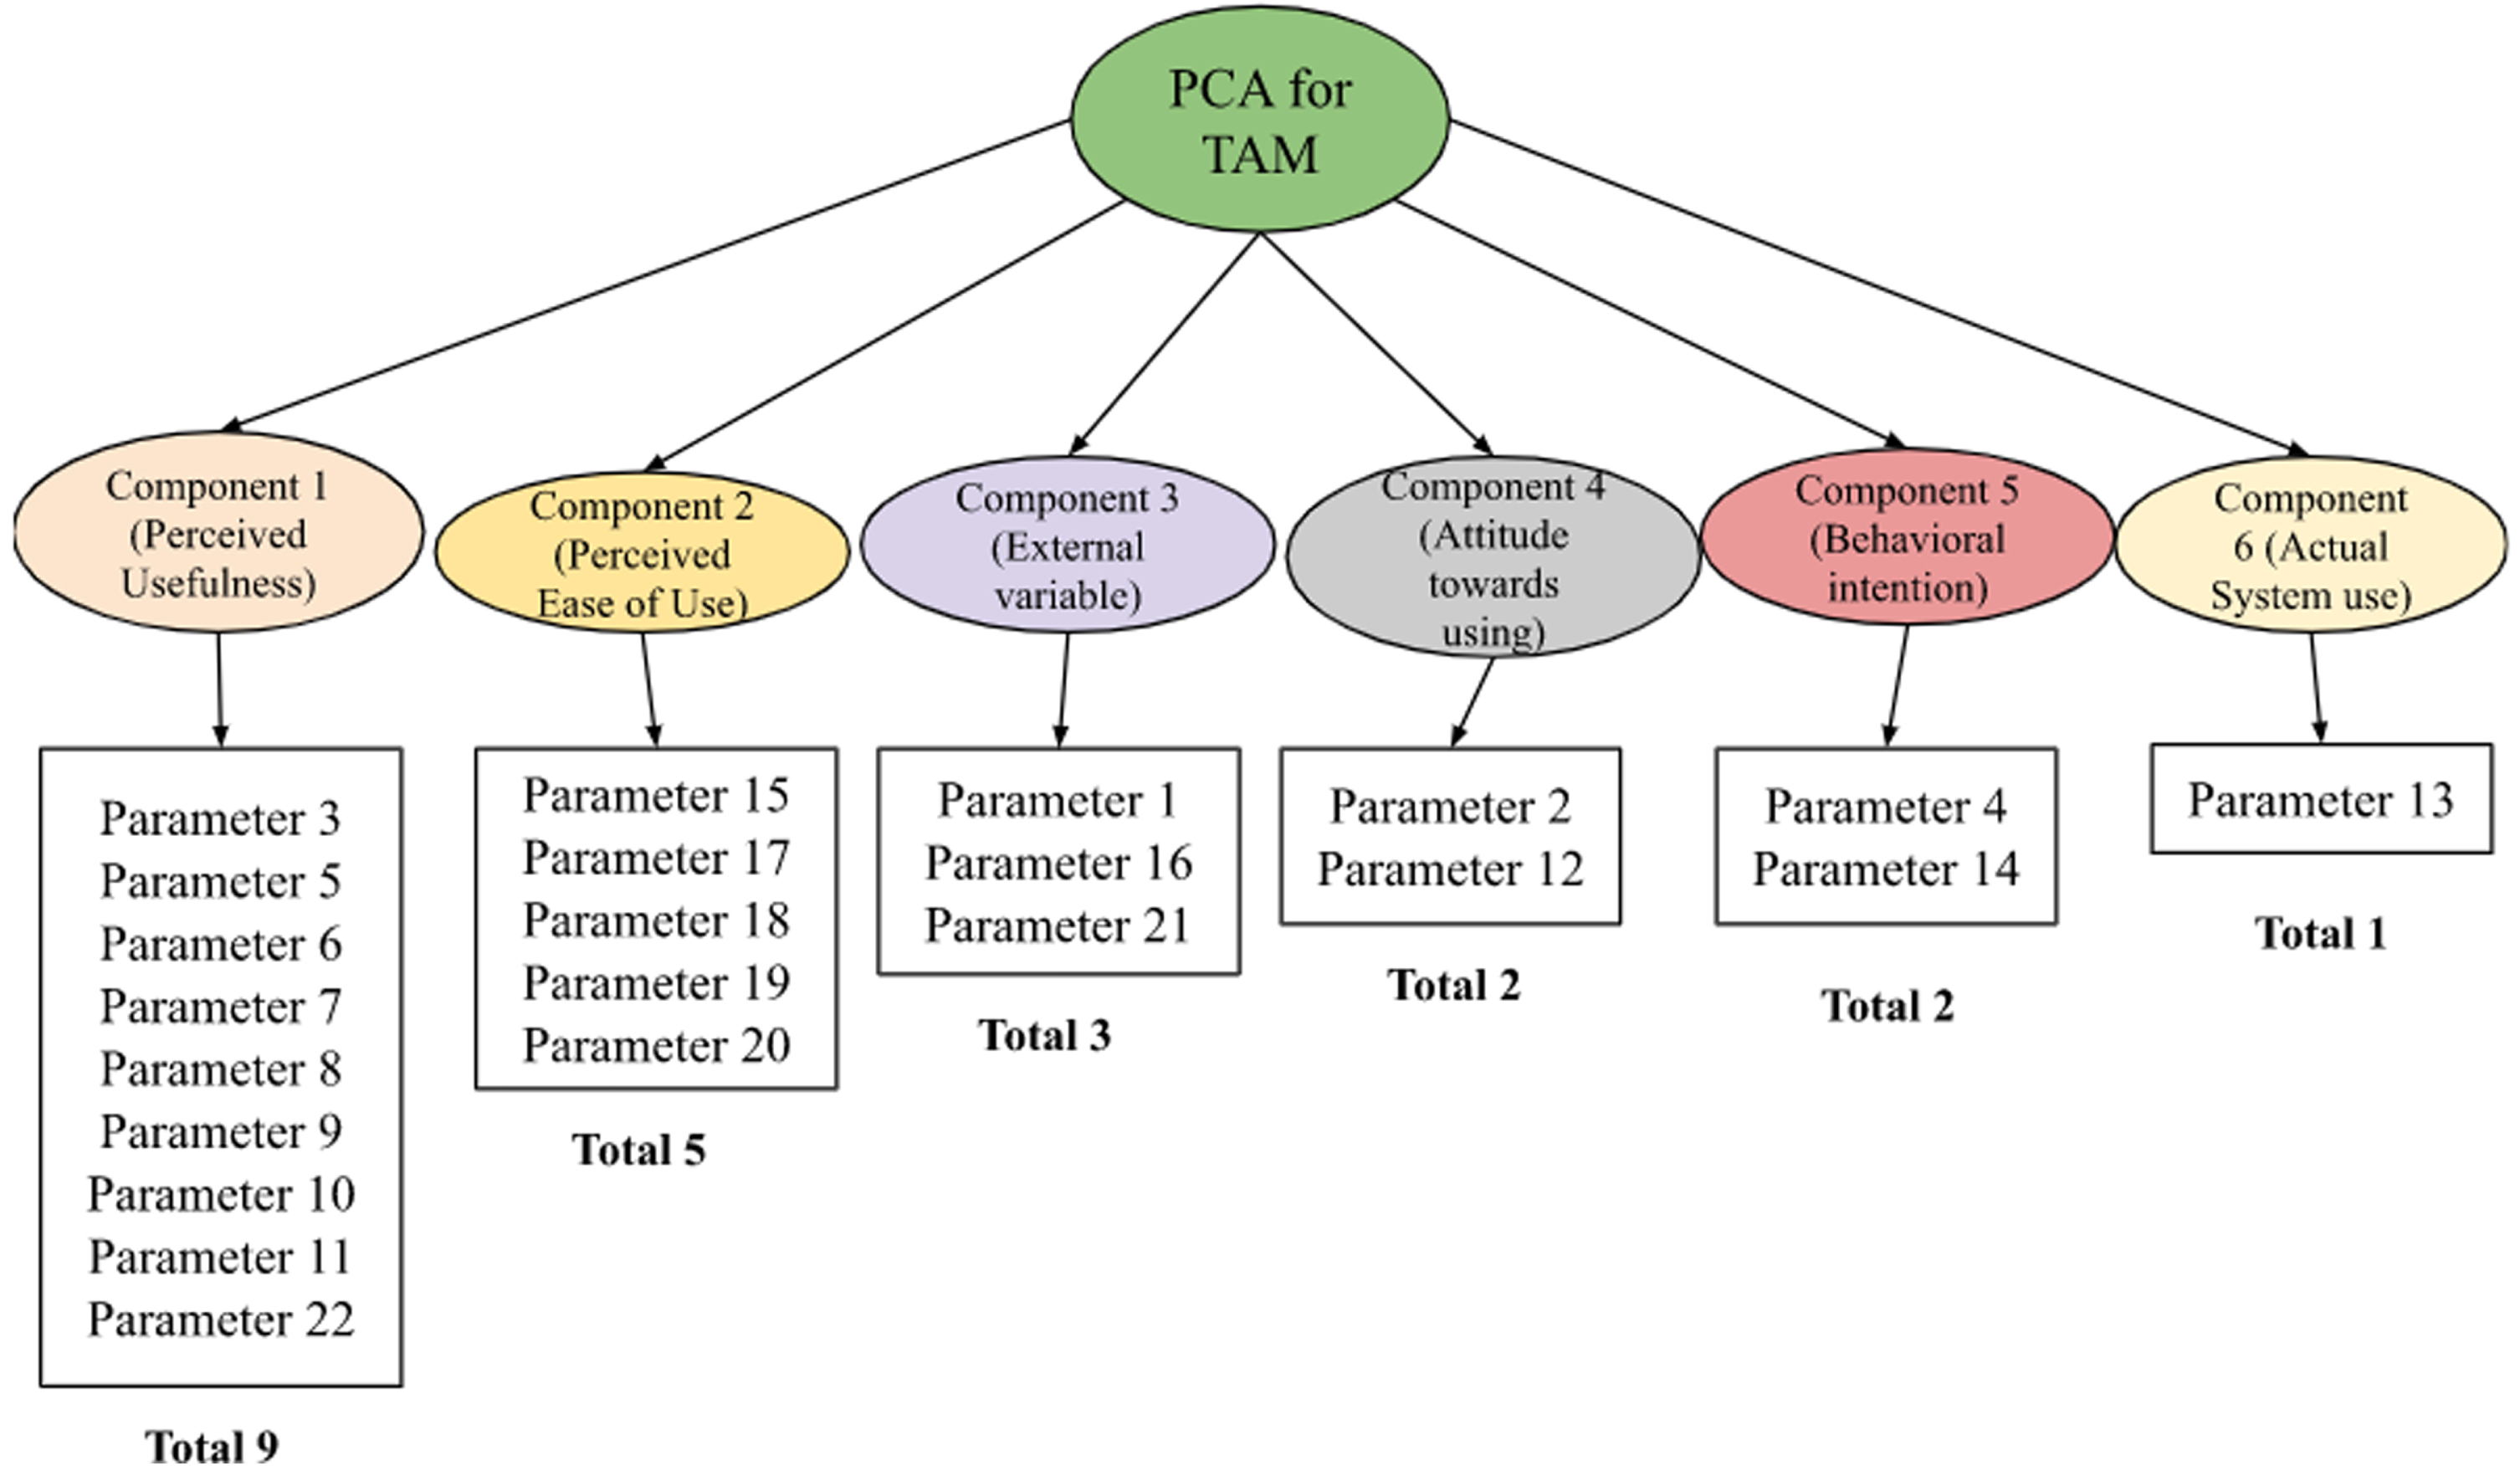
Grouping of principal components with respect to parameters listed in Table 9, keeping 0.0 threshold for factor values.
During testing the proposed perception model of acceptance, the following hypotheses are set: Hypothesis 1: e-HRM applications in IT and Other Select Non-IT organizations are equally accepted among users. Hypothesis 2: External variables have an equal impact on the perceived ease of use of e-HRM systems in IT and Other Select Non-IT Organizations. Hypothesis 3: Perceived ease of use has an equal impact on the perceived usefulness of e-HRM systems in IT and Other Select Non-IT Organizations. Hypothesis 4: Perceived usefulness has an equal impact on the attitude towards using e-HRM systems in IT and Other Select Non-IT Organizations. Hypothesis 5: Perceived usefulness has an equal impact on Behavioural Intention to Use to adopt e-HRM systems in IT and Other Select Non-IT Organizations. Hypothesis 6: Perceived ease of use has an equal impact on the Attitude towards using e-HRM systems in IT and Other Select Non-IT Organizations. Hypothesis 7: Attitude towards using e-HRM systems has an equal impact on Behavioural Intention to Use to adopt e-HRM systems in IT and Other Select Non-IT Organizations. Hypothesis 8: Behavioural Intention to Use to adopt e-HRM systems has an equal impact on Actual System Use of e-HRM systems in IT and Other Select Non-IT Organizations.
For the above hypothesis testing, the following data analysis techniques are performed.
Data analysis for prediction model
Several statistical-based data analysis techniques help the system predict the model and test the proposed hypotheses. So, some required statistical-based techniques employed in this work are as follows:
The hypothesis testing consists of four steps such as: State the hypotheses - This step involves stating null and alternative hypotheses. The hypotheses must be stated so that both null and alternative hypotheses are mutually exclusive. If one is true, then the other must be false. Set the criteria for a decision - The value specified in the null hypothesis is either retained or rejected based on a set of criteria. The population is sampled, and the sample mean is calculated. Compute the test statistic - Find the value of the test statistic (using properties like mean score, proportion, t-statistic, z-score, etc.) stated in the analysis plan. Make a decision - Reject the null hypothesis if there is a less than 5% chance of getting a sample mean when the null is true. Retain the null hypothesis if there is a larger than 5% chance of getting a sample mean when the null is true. The criterion for a Good Hypothesis It should be compatible with current knowledge in the area. It should follow logical consistency. A good hypothesis must be stated briefly and clearly. A hypothesis should be testable.
By using above these statistical-based data analysis techniques, the following list of tests are performed to derive the prediction model and testing of hypotheses.
Implementing effective HR systems is difficult, but firms frequently need to invest in their people and invest correctly. Many firms are unaware of the consequences of their investment decisions involving people. Introducing e-HRM systems in companies cannot solely justify the considerable investment into installing this newer technology-based HRM, the e-HRM. Proper implementation, goal realization, and its impacts on HR in particular and the organization as a whole will finally decide the success of e-HRM systems being widely introduced and implemented in various companies. Different companies may have different e-HRM goals, different levels of implementation, and varied impacts of e-HRM applications. Also, the acceptance of technology varies from organization to organization. The conceptual framework for this study was developed through a review of the literature and is a depiction of the potential track that results in the appropriate planning and components necessary to successfully e-HRM implementation and acceptance.
Data collection
The proposed questionnaire contains questions, and the employees have given responses to those questions. Here, the answers to queries from each segment have their importance and are used to obtain a sample corresponding to each user. These answers undergo the data collection and arrangement tasks, where the questionnaire responses are arranged sequentially to their objectives. The questionnaire proposed is collected through a Google forms framework that effectively separates the questionnaire representation contents. Here, the Sampling technique is that the organizations must be large enough to have a minimum of 10 HR professionals, and the organization must use the e-HRM systems to perform HR activities. The service organizations included in the study comprise Banking, Electric-distribution companies, Hospitals, Insurance Companies, and others. The data are collected from 20 IT organizations and 20 service organizations, where ten employees of each organization have participated in giving the response to queries of the proposed questionnaire. Hence, 200 individual sets of responses are obtained from IT groups of organizations, and 200 individual sets of responses are obtained from Service organizations. In this e-HRM acceptance, the answers are rated (Likert Scale) here as ‘Strongly Agree’, ‘Agree’, ‘Neither Agree Nor disagree’, ‘Disagree’, and ‘Strongly Disagree’ for the closed-ended type questions. The acceptance of e-HRM measures the experiences, knowledge, comfortability, level of difficulties, and understandability of the use of the e-HRM model by the employees.
The below “Results and discussion 1” section is employed for the data analysis being performed for the acceptance of the e-HRM system, while the“Results and discussion 2” section is for the data analysis for e-HRM acceptance through the Technology Acceptance Model (TAM).
Data reliability test analysis result
Data reliability test analysis result
Count of categories responses from all items of e-HRM acceptance questionnaires with respect to IT and Non-IT organizations
This analysis starts with performing the data reliability test, which measures the consistency achieved for the proposed questionnaire. During this data reliability, some pilot study has been conducted where the Cronbach’s alpha is computed for smaller to larger datasets such as for 50 IT and 50 Non-IT observations (samples), 100 IT and 100 Non-IT observations, 150 IT and 150 Non-IT observations, and 200 IT and 200 Non-IT observations. The results of Cronbach’s alphas for these datasets are shown below in Table 1. So, from Table 1, it has been observed that in each fragment of the dataset, Cronbach’s Alpha is in the range of 0.8≤α< 0.9, which is good. Hence, this test allows for the usability of samples for further analysis. The validity of the questionnaire was checked with the help of experts in the research area and also experts on questionnaire construction. Content validity (Experts) and construct validity (factor analysis) have been done, and the results are shown in the further results.
Comparison of IT and Non-IT using variable-wise analysis of response frequency (Test 1)
Here this test is needed (i) to find the percentages of the matchup of categories of responses to the questionnaire variables and (ii) to check the independence of categorical variables in the parameters. The proposed questionnaire contains questions about accepting the e-HRM system used for IT or Non-IT based organizations. In organizations with the e-HRM model, the employees of those organizations can respond to the questionnaire questions to make a more convenient and effective decision system. Here, in the questionnaire, there are five categories of responses (Strongly Agree, Agree, Neither Agree nor Disagree, Disagree, and Strongly Disagree) shown in Table 2. So, from Table 2 it is shown that for IT organizations, the percentage (%) within the Strongly Agree group, Agree, Neither Agree Nor Disagree, Disagree, and Strongly Disagree groups scores 56.39%, 10.13%, 13.23%, 18.50%, 1.75% whereas the percentage (%) within Strongly Agree, Agree, Neither Agree nor Disagree, Disagree and Strongly Disagree scores 35.25%, 39.05%, 16.20%, 7.25%, and 2.25% respectively for Non-IT organizations. Hence, it is concluded that the score for the Strongly Agree + Agree groups is much higher in IT organizations than in Non-IT organizations. To measure the significant difference in these observed frequencies of five categories (Strongly Agree, Agree, Neither Agree nor Disagree, Disagree and Strongly Disagree) in IT and Non-IT, Pearson Chi-Square has been performed that measures the test statistic of 18.655 with 0.001 p-values which is less than 0.05 corresponds to each category. Hence, from the cross-tabulation and the Pearson Chi-Square test, it is concluded that there are significant differences in the observed frequencies of five categories of parameters, and the values of these observed frequencies of five categories are much higher for IT than Non-IT organizations.
Comparison of IT and Non-IT using normality Tests for Statistical Analysis (Test-2)
Here, the parameter responses of the questionnaire undergo a normality test where the probability p is obtained corresponds to the observations of IT and Non-IT groups to find the normality in the distribution of parameters corresponding to each group of the organization. So, after the normality test (shown in Table 3), it has been observed that the distribution is not normal in each group. For this, the non-parametric tests such as Wilcoxon signed rank test, Mann-Whitney U Test, and Kruskal-Wallis are applied. Hence, these test statistics reveal that the distribution of values in terms of responses to the questionnaire in both IT and Non-IT organizations is probably not normally distributed in the population. Again, the mean score of the collected samples is higher for IT organizations than for Non-IT organizations. The reason behind this is that the higher scaled categories like ‘Strongly Agree’ with 5 scaled are much answered in the corresponding parameters of the questionnaire respectively.
Tests of Normality of the questionnaire with respect to IT and Non-IT organizations
Tests of Normality of the questionnaire with respect to IT and Non-IT organizations
Hence, the distribution is not normal, so some nonparametric tests Wilcoxon signed rank test, the Mann-Whitney U Test, and the Kruskal-Wallis are applied. The results of these tests are shown in Table 4. From this table, it has been observed that the descriptive statistics for the acceptance of e-HRM systems are different concerning IT and Non-IT organizations, and it is higher in IT than Non-IT organizations.
Descriptive statistics for acceptance of e-HRM for the select IT and Non-IT organizations
Descriptive statistics for acceptance of e-HRM for the select IT and Non-IT organizations
Hereafter normality with percentile and z score statistics, the KMO and Bartlett’s Test has been performed on all the collected datasets, i.e., 400 samples with 22 parameters. The results of these tests are reported in Table 5, and the following observations are found: (i) Here, the KMO test reports the sampling adequacy of factors is 0.886, which is between 0.8 and 1. Hence, the dataset of the proposed questionnaire is eligible for factor analysis; (ii) Bartlett’s Test of Sphericity reports that the Chi-Square test statistic is 2832.549 and the corresponding p-value is 0.000, which is not higher than our significance level (let’s use 0.05). Thus, the collected dataset is likely suitable for principle component analysis (PCA) or factor analysis.
KMO and Bartlett’s test
KMO and Bartlett’s test
After KMO and Bartlett’s Test, the principal component analysis (PCA) (discussed at) has been applied to the collected dataset, i.e., on 400 samples with 22 parameters. Hence, during PCA, initially using the whole dataset, 22 Eigenvalues are obtained. Out of these 22 Eigenvalues, only four have values greater than 1. So only these four principal components are considered for computing principal components corresponding to the parameters of the dataset. So, after computing the principal components using four Eigenvalues, the factors under these principal components result in 51.68% variance, shown in Table 6. Hence, after analyzing the rotated component matrix of these four principal components, it has been observed that 1, 2, 3, 5, 6, 7, 8, 9, 10, 11, 12 factors are under principal component-1, factor 15, 17, 18, 19, 20 under principal component-2, factor 1, 16 under principal component-3 and factor 13 under principal component-4 of the proposed questionnaire. These results are reported in Table 6. Here, for convenience, Component 1 can be grouped by the name’ User perception and attitude’, Component 2 can be grouped by the name ‘User behavioral intention’, Component 3 can be grouped by the name ‘User skills set’, and Component 4 can be grouped by the name ‘User experience. The parameters under these components are listed in Table 7, and Fig. 3 shows the grouping of principal components concerning parameters listed in Table 7, keeping a 0.0 threshold for factor values.
Results for multifactor analysis using principal component analysis (Test 4)
The list of parameters associated with its principal components computed using Test 4 results
From the above multi-factor analysis based on the combined IT and Non-IT organization datasets, we got the following (Table 8) number of principal components (factors) corresponding to each e-HRM system acceptance study variable.
IT and Non-IT comparison using multi-factor analysis for Acceptance required for e-HRM system
Here, non-parametric tests like Mann-Whitney U and Wilcoxon W are performed to determine the impact of these four principal components in IT and Non-IT organizations. So, after the test, the following findings are obtained:
Table 8 shows that the mean for Component 1 of IT is +0.14 while the mean for Component 1 of non-IT is –0.14, which means that IT people have a positive disposition or favorable disposition for Component 1 (i.e., the factors under this category). At the same time, Non-IT people have a negative disposition/ unfavorable disposition for Component 1, and the Test-Statistics show that this comparison is significant. Again, Table 8 shows that the mean for Component 2 of IT is +0.21 while the mean for Component 2 of non-IT is –0.21, which means that IT people have a positive disposition or favorable disposition for Component 2. At the same time, Non-IT people have a negative disposition/ unfavorable disposition for Component 2, and the Test-Statistics show that this comparison is significant. Again, from Table 8, we see that the mean for Component 3 of IT is +0.35 while the mean for Component 3 of non-IT is –0.35, which means that IT people have a positive disposition or favorable disposition for Component 3. At the same time, Non-IT people have a negative disposition/ unfavorable disposition for Component 3, and the Test-Statistics show that this comparison is significant.
Table 8 shows that the mean for Component 4 of IT is –0.12 while the mean for Component 4 of non-IT is +0.12, which means that IT people have a negative disposition or unfavorable disposition for Component 4. In contrast, Non-IT people have a positive disposition/ favorable disposition for Component 4. The Test-Statistics show that this comparison is not-significant, which means Component 4 is more or less an unfavorable disposition for both IT and non-IT people.
Results and discussion 2
For this experiment, Test-4: Comparison of IT and Non-IT using factor analysis, Test-5: Correlation analysis based comparisons of two variables under study for e-HRM system, Test-6: Regression analysis based comparisons of two variables under study for e-HRM system, and Test-7: Hypotheses testing for Hypthesis 2 to 7, are being performed. The results of these tests are as follows:
Test-4: Comparison of IT and Non-IT using factor analysis
Here for Technology acceptance model testing, the factor analysis of acceptance variables of the e-HRM system is performed considering the Eigenvalues greater than 0.9. This factor analysis is shown in Table 9.
The list of parameters association corresponding to its components computed as Test 4 results for TAM
The list of parameters association corresponding to its components computed as Test 4 results for TAM
of factor analysis for TAM
Six different components are required to test the TAM model, so, from the factor analysis of acceptance of the e-HRM system performed in Table 8, six factors (components) are derived. These six factors (shown in Table 10) are used to test the Davis TAM model.
Hence, from Tables 9 10, the following conclusions are found: Here, the KMO test reports the sampling adequacy of factors is 0.886 which is in between 0.8 and 1. Hence, the dataset of the acceptance questionnaire is eligible for factor analysis. Bartlett’s Test of Sphericity reports that the Chi-Square test statistic is 2832.549 and the corresponding p-value is 0.000, which is not higher than our significance level (let’s use 0.05). Thus, this data is likely suitable for PCA or factor analysis. Bartlett’s Test finds the principal components for the dataset of the acceptance questionnaire where 22 initial Eigenvalues are obtained. Out of these 22 Eigenvalues, only six Eigenvalues have values greater than 0.9, so these six principal components are considered. Hence, after analyzing the rotated component matrix of these six principal components, it has been observed that 3, 5, 6, 7, 8, 9, 10, 11, 22 factors are under principal component-1, factor 15, 17, 18, 19, 20 under principal component-2, factor 1, 16, 21 under principal component-3 factor 2, 12 under principal component-4, factor 4, 14 under principal component-5, factor 13 under principal component 6 of e-HRM acceptance. These results are reported in Table 9.
The Correlation Coefficient of combined effect of IT and Non-IT along with Pearson correlation test for TAM using External variables (EV), Perceived Usefulness (PU), Perceived Ease of Use (PEOU), Attitude towards using (ATU), Behavioral intention (BI), Actual System use (ASU) parameters obtained by grouping of variables of the employed questionnaire of acceptance of e-HRM have been demonstrated in Table 11. Similarly, the Correlation Coefficient of individual effect of IT and Non-IT along with Pearson correlation test for TAM using using External variables (EV), Perceived Usefulness (PU), Perceived Ease of Use (PEOU), Attitude towards using (ATU), Behavioral intention (BI), Actual System use (ASU) parameters, have been demonstrated in Table 12.
Correlation Coefficient of combined effect of IT and Non-IT using TAM variables
Correlation Coefficient of combined effect of IT and Non-IT using TAM variables
Correlation Coefficient of individual effect of IT and Non-IT using TAM variables
Here, for testing Technology Acceptance Model for e-HRM, the objective is to test the proposed model of acceptance of e-HRM using Davis’s TAM, where the grouping of 22 parameters in the questionnaire is performed into six groups such as External Variables (EV), Perceived Usefulness (PU), Perceived Ease of Use (PEOU), Attitude towards using (ATU), Behavioural Intention to Use (BIU), Actual System Use (ASU). These groups of variables are discussed above. For TAM, here the factor analysis (Test 4), and Correlation Coefficient Based Analysis (Test 5), are performed at Tables 9, and 12 respectively. So, using the results reported in Tables 11, and 12, the following hypotheses are tested.
From Table 11, it can be seen that Results of the Pearson correlation indicated that there is a significant medium positive relationship between External variables and Perceived ease of use, (r = 0.383, p < 0.001). From Table 12, it can be seen that Results of the Pearson correlation indicated that there is a significant large positive relationship between External variables and Perceived ease of use, (r = 0.525, p < 0.001) for IT organizations. From Table 12, it can be seen that Results of the Pearson correlation indicated that there is a non-significant very small positive relationship between External variables and Perceived ease of use, (r = 0.0767, p = 0.280) for service organizations. From these findings it can be concluded that the External variables have an unequal impact on Perceived ease of use of e-HRM systems in IT and select service organizations. Hence, reject hypothesis 2. From Table 11, it can be seen that Results of the Pearson correlation indicated that there is a significant medium positive relationship between Perceived ease of use and Perceived usefulness, (r = 0.364, p < 0.001). From Table 12, it can be seen that Results of the Pearson correlation indicated that there is a significant medium positive relationship between Perceived ease of use and Perceived usefulness, (r = 0.471, p < 0.001) for IT organizations. From Table 12, it can be seen that Results of the Pearson correlation indicated that there is a non-significant very small negative relationship between Perceived ease of use and Perceived usefulness, (r = 0.036, p = 0.612) for service organizations. From the above findings it can be concluded that the Perceived ease of use has an unequal impact on perceived usefulness of e-HRM systems in IT and service organizations. Hence, reject hypothesis 3.
From Table 11, it can be seen that Results of the Pearson correlation indicated that there is a significant large positive relationship between Perceived usefulness and Attitude Towards using, (r = 0.623, p < 0.001). From Table 12, it can be seen that Results of the Pearson correlation indicated that there is a significant large positive relationship between Perceived usefulness and Attitude Towards using, (r = 0.802, p < 0.001) for IT organizations. From Table 12, it can be seen that Results of the Pearson correlation indicated that there is a significant medium positive relationship between Perceived usefulness and Attitude Towards using, (r = 0.37, p < 0.001) for service organizations. From the above findings it can be concluded that the Perceived usefulness has an equal effect on the attitude towards using e-HRM systems in select IT and service organizations. Hence, accept hypothesis 4.
From Table 11, it can be seen that Results of the Pearson correlation indicated that there is a significant medium positive relationship between Perceived usefulness and Behavioral Intention, (r = 0.341, p < 0.001). From Table 12, it can be seen that Results of the Pearson correlation indicated that there is a significant medium positive relationship between Perceived usefulness and Behavioral Intention, (r = 0.351, p < 0.001) for IT organizations. From Table 12, it can be seen that Results of the Pearson correlation indicated that there is a significant medium positive relationship between Perceived usefulness and Behavioral Intention, (r = 0.319, p < 0.001) for service organizations. From the above findings it can be concluded that the Perceived usefulness has an equal effect on Behavioral Intention to Use to adopt e-HRM systems in select IT and service organizations. Hence, accept hypothesis 5.
From Table 11, it can be seen that Results of the Pearson correlation indicated that there is a significant small positive relationship between Perceived ease of use and Attitude towards using, (r = 0.222, p < 0.001). From Table 12, it can be seen that Results of the Pearson correlation indicated that there is a significant small positive relationship between Perceived ease of use and Attitude towards using, (r = 0.23, p = 0.001) for IT organizations. From Table 12, it can be seen that Results of the Pearson correlation indicated that there is a non-significant small positive relationship between Perceived ease of use and Attitude towards using, (r = 0.134, p = 0.059) for service organizations. From the above findings it can be concluded that the Perceived ease of use has an unequal effect on the Attitude towards using e-HRM systems in select IT and service organizations. Hence, reject hypothesis
From Table 11, it can be seen that Results of the Pearson correlation indicated that there is a significant small positive relationship between Attitude towards using and Behavioral Intention, (r = 0.26, p < 0.001). From Table 12, it can be seen that Results of the Pearson correlation indicated that there is a significant medium positive relationship between Attitude towards using and Behavioral Intention, (r = 0.353, p < 0.001) for IT organizations. From Table 12, it can be seen that Results of the Pearson correlation indicated that there is a not-significant small positive relationship between Attitude towards using and Behavioral Intention, (r = 0.15, p = 0.056) for service organizations. From the above findings it can be concluded that the Attitude towards using e-HRM systems has an unequal effect on Behavioral Intention to Use to adopt e-HRM systems in select IT and service organizations. Hence, reject hypothesis 7.
From Table 11, it can be seen that Results of the Pearson correlation indicated that there is a significant very small negative relationship between Behavioral Intention and Actual System Use, (r = 0.176, p < 0.001). From Table 12, it can be seen that Results of the Pearson correlation indicated that there is a significant very small negative relationship between Behavioral Intention and Actual System Use, (r = 0.189, p = 0.007) for IT organizations. From Table 12, it can be seen that Results of the Pearson correlation indicated that there is a significant very small negative relationship between Behavioral Intention and Actual System Use, (r = 0.17, p = 0.016) for service organizations. From the above findings it can be concluded that the Behavioral Intention to Use to adopt e-HRM systems has an equal effect on Actual System Use of e-HRM systems in select IT and service organizations. Hence, accept hypothesis 8.
Hence, from the above hypothesis testing it can be concluded that parameters employed for e-HRM systems validates the TAM model that methods employed for e-HRM systems accord to TAM and the corresponding e-HRM acceptance model is given in Fig. 6 which is based on our analysis.
User acceptance model for e-HRM system based on our analysis.
Hence, finally, the Regression-based analysis (Test 6) has been performed to evaluate IT and Non-IT e-HRM system based equations through the TAM model. Here, the regression based analysis of combined effect of IT and Non-IT along for TAM using External variables (EV), Perceived Usefulness (PU), Perceived Ease of Use (PEOU), Attitude towards using (ATU), Behavioral intention (BI), Actual System use (ASU) parameters obtained by grouping of variables of the employed questionnaire of acceptance of e-HRM have been demonstrated in Table 13. Similarly, the regression based analysis of individual effect of IT and Non-IT using External variables (EV), Perceived Usefulness (PU), Perceived Ease of Use (PEOU), Attitude towards using (ATU), Behavioral intention (BI), Actual System use (ASU) parameters, have been demonstrated in Table 14.
Regression-based analysis of combined effect of IT and Non-IT using TAM variables
Regression-based analysis of individual effect of IT and Non-IT using TAM variables
The final outcome of regression equation from Table 13 are as follows:
IT: Regression Model
Actual System use = 2.89 + 0.02 * External Variables + 0.01 * Perceived Usefulness + 0.06 * Perceived Ease of Use –0.01 * Attitude towards using –0.16 * Behavioral Intention to Use
Non-IT: Regression Model
Actual System use = 5.88 + 0.07 * External Variables + 0.0 * Perceived Usefulness –0.1 * Perceived Ease of Use –0.08 × Attitude towards using –0.09 * Behavioral Intention to Use
The e-HRM system is widely used in big companies and institutions. It has wide applications and support to the human resource management system in implementing policies, strategies, and practices within the organization using web-based networks and channels. For analyzing the e-HRM system’s degree of acceptance in IT and Non-IT organizations, the e-Survey based on a self-administered questionnaire (SAQ) has been used. The questions in the questionnaire are well-formatted and made available online for the web-based survey purpose to maximize the information gathered. Data analysis for the collected data was performed, where several statistical measures and hypotheses were tested. These analyses results and findings, and discussions can be summarised as the acceptability of e-HRM systems by the end users in IT firms is much higher than in other select services (Non-IT) organizations because of the significant difference in perceived use-fullness, perceived ease of use, attitude, and behavior intention between the two groups. The future research of this work will focus on more in-depth studies for specific industries, and benchmarking could be done on individual HRM activities and how technology has affected organisations performance in quantitative terms. Also, a similar study can be conducted for specific industries, and benchmarking could be done. Studies on the impact of technology on individual HRM activities and finding the appropriate measures to assess the performance of HR activities under the influence of web technology will be done.