
Abstract
The majority of economic sectors are transformed by the abundance of data. Smart grids, smart cities, smart health, Industry 4.0 impose to domain experts requirements for data science skills in order to respond to their duties and the challenges of the digital society. Business training or replacing domain experts with computer scientists can be costly, limiting for the diversity in business sectors and can lead to sacrifice of invaluable domain knowledge. This paper illustrates experience and lessons learnt from the design and teaching of a novel cross-disciplinary data science course at a postgraduate level in a top-class university. The course design is approached from the perspectives of the constructivism and transformative learning theory. Students are introduced to a guideline for a group research project they need to deliver, which is used as a pedagogical artifact for students to unfold their data science skills as well as reflect within their team their domain and prior knowledge. In contrast to other related courses, the course content illustrated is designed to be self-contained for students of different discipline. Without assuming certain prior programming skills, students from different discipline are qualified to practice data science with open-source tools at all stages: data manipulation, interactive graphical analysis, plotting, machine learning and big data analytics. Quantitative and qualitative evaluation with interviews outlines invaluable lessons learnt.
Keywords
Introduction
The pervasiveness of Internet of Things and ubiquitous computing brings unprecedented transformations in several sectors of economy. Nowadays, design, operational, management and regulatory decisions in smart cities, smart grids, smart health services and Industry 4.0 rely on streams of massive data. This radically alters the skills set of domain experts required to automate, analyze and optimize such complex systems [14]. Data science becomes of a paramount importance with research communities expressing active interest on the educational practices for data science [12,26]. Experts’ skills on statistics are not adequate as data may be unstructured, very large in size, may require real-time processing and advanced machine learning techniques that go beyond descriptive statistics [14]. On the one hand, training domain experts to new skills of data science is costly and not all enterprises have the resources for this purpose. On the other hand, replacing the domain experts with computer scientists, who are formally trained on data science may result in imbalances in the job market and lack of diversity, cohesion and domain knowledge. Note that recent rapid development and significant discoveries in the areas of complex networks and biology, for instance mapping human genome, have been made with data science methodologies applied by domain experts rather than computer scientists [33,44]. There is ongoing research on introducing formal models for such discoveries [29].
Given the evident lack of plurality and the high interest for data scientists in the job market [31,48], academic institutes need to respond to their role and educate a broad range of scientists in data science with novel didactic and pedagogical approaches tailored beyond the computer science student. The experience aggregated by the design of such a novel educational course is the focus of this paper. The contributions of this paper are (i) the analysis of effects and implications by design choices made to address a cross-discipline approach to data science as well as (ii) lessons learnt after teaching a cross-disciplinary data science course for 3 years at a top-class university.
The design and teaching of a postgraduate data science course in a cross-disciplinary context can benefit from the constructivism and transformative learning theory. By using research methodologies applied in data science research projects used as pedagogical artifacts, students can benefit from the concepts of the two learning theories: learners’ prior knowledge and experience as well as habits of mind and point of view.
This paper illustrates the experience and lessons learnt from the design and teaching of a cross-discipline data science course at ETH Zurich. It shows how the course overcomes challenges observed in related courses reviewed in this paper such as creating a self-contained content or effectively choosing software tools for teaching, for instance, data manipulation and graphical analysis. Moreover, the diversity of (i) the students, (ii) the projects selected and (iii) the project teams is discussed along with its role to students’ success. The course and learning objectives, as defined within the Bloom’s taxonomy, are assessed with quantitative and qualitative information aggregated from official university evaluations as well as personal interviews conducted for the purpose of this paper. Several lessons learnt are derived related to the content size, the difficulty level, the role of diversity, the choice of software tools, the role of the research projects as a pedagogical artifact as well as the data requirements that students and lecturers need to take care of.
This paper is outlined as follows: Section 2 discusses the perspective of learning theory on data science. Section 3 introduces the course “Data Science in Techno-socio-economic Systems” designed and taught at ETH Zurich. Section 4 illustrates the self-contained content of the course. Section 5 introduces the guideline of data science research projects and shares experiences on students’ work. Section 6 illustrates a quantitative and qualitative evaluation of the course and outlines future evaluation. Section 7 compares several aspects of the illustrated course with other data science educational programs and courses. Section 8 summarizes the lessons learnt and the societal implications of cross-disciplinary data science education. Finally, Section 9 concludes this paper.
Perspectives of learning theory on data science
To the best of the author’s knowledge, there is very limited relevant work on how learning theory applies to data science education, and especially in the cross-discipline education of data science. This section discusses the perspective of two relevant theories in this context, the constructivism and transformative learning theory.
A constructivism pedagogical approach to data science benefits from the prior knowledge and experiences on which learners of different background have been exposed [9]. Beyond the technical computer science content of data science, the background knowledge that learners bring is invaluable to contextualize and develop data science knowledge and practices, as well as articulate a domain-specific reasoning via posing valid research questions and hypotheses from learners’ field of expertise [16].
Data science education with learning methods from the perspective of Papert’s constructionism [38] promote the use of data science tools and techniques as self-learning artifacts to facilitate the construction of new knowledge [1]: learning the actual data science methods and generate new knowledge from their applicability on a domain. In this sense, data science can be seen as an intellectual environment that students actively use as an evocative object [47] to solve a domain problem, while this use entails practicing data science and therefore the development of new skills and knowledge. This view is in line with the learning approach of ‘to-think-with’ and ‘to-learn-with’ technology (data science in this context) [42].
The transformative learning theory is relevant to the education of data science in a cross-disciplinary context. The theory explains how learners revise and interpret meaning [45] and articulates learning as the cognitive process of effecting change in a frame of reference composed of two dimensions: habits of mind and points of view. Emotions are involved [27] and ideas may not be easily accepted if the pedagogical approach does not encounter the diversity of the learners, i.e. values, associations and concepts they have formed [34]. This is especially relevant for cross-disciplinary data science education.
For instance, consider the cognitive process of data speculation by learners of different disciplines, e.g. a (visual) exploratory analysis of residential energy demand data. Self-reflection on this process is evident given the habits of mind and view point of learners. An electrical engineer may speculate about system robustness, for instance power peaks causing blackouts. In contrast, an economist may interpret data in economic terms, meaning a power peak may imply low energy prices. And a social scientists may link power peaks to human behavior, for instance human mobility (returning back from work), residential activities and an overall certain lifestyle. Moreover, a computer scientist may find these data as privacy-intrusive given a prior knowledge on inference techniques capable of, for instance, detecting with high accuracy TV programs chosen by exclusively using data of the TV power consumption [21]. Such ethical concerns may influence the individuals’ choices of the data analytics methods applied over sensitive personal data. The learning process as well as the educational content should encounter for this diversity and should have the capacity to be integrative of different learners’ experiences.
A cross-disciplinary data science course
This section outlines a relevant cross-disciplinary data science course created at ETH Zurich. The 3-credit course entitled Data Science in Techno-socio-economic Systems is designed for MSc students and it is part of the department “Humanities, Social and Political Sciences” (GESS1
Available at
Available at
Students’ educational direction participating in the course “Data Science in Techno-socio-economic systems”. The top-3 educational directions are indicated by the grey boxes and n denotes the number of students
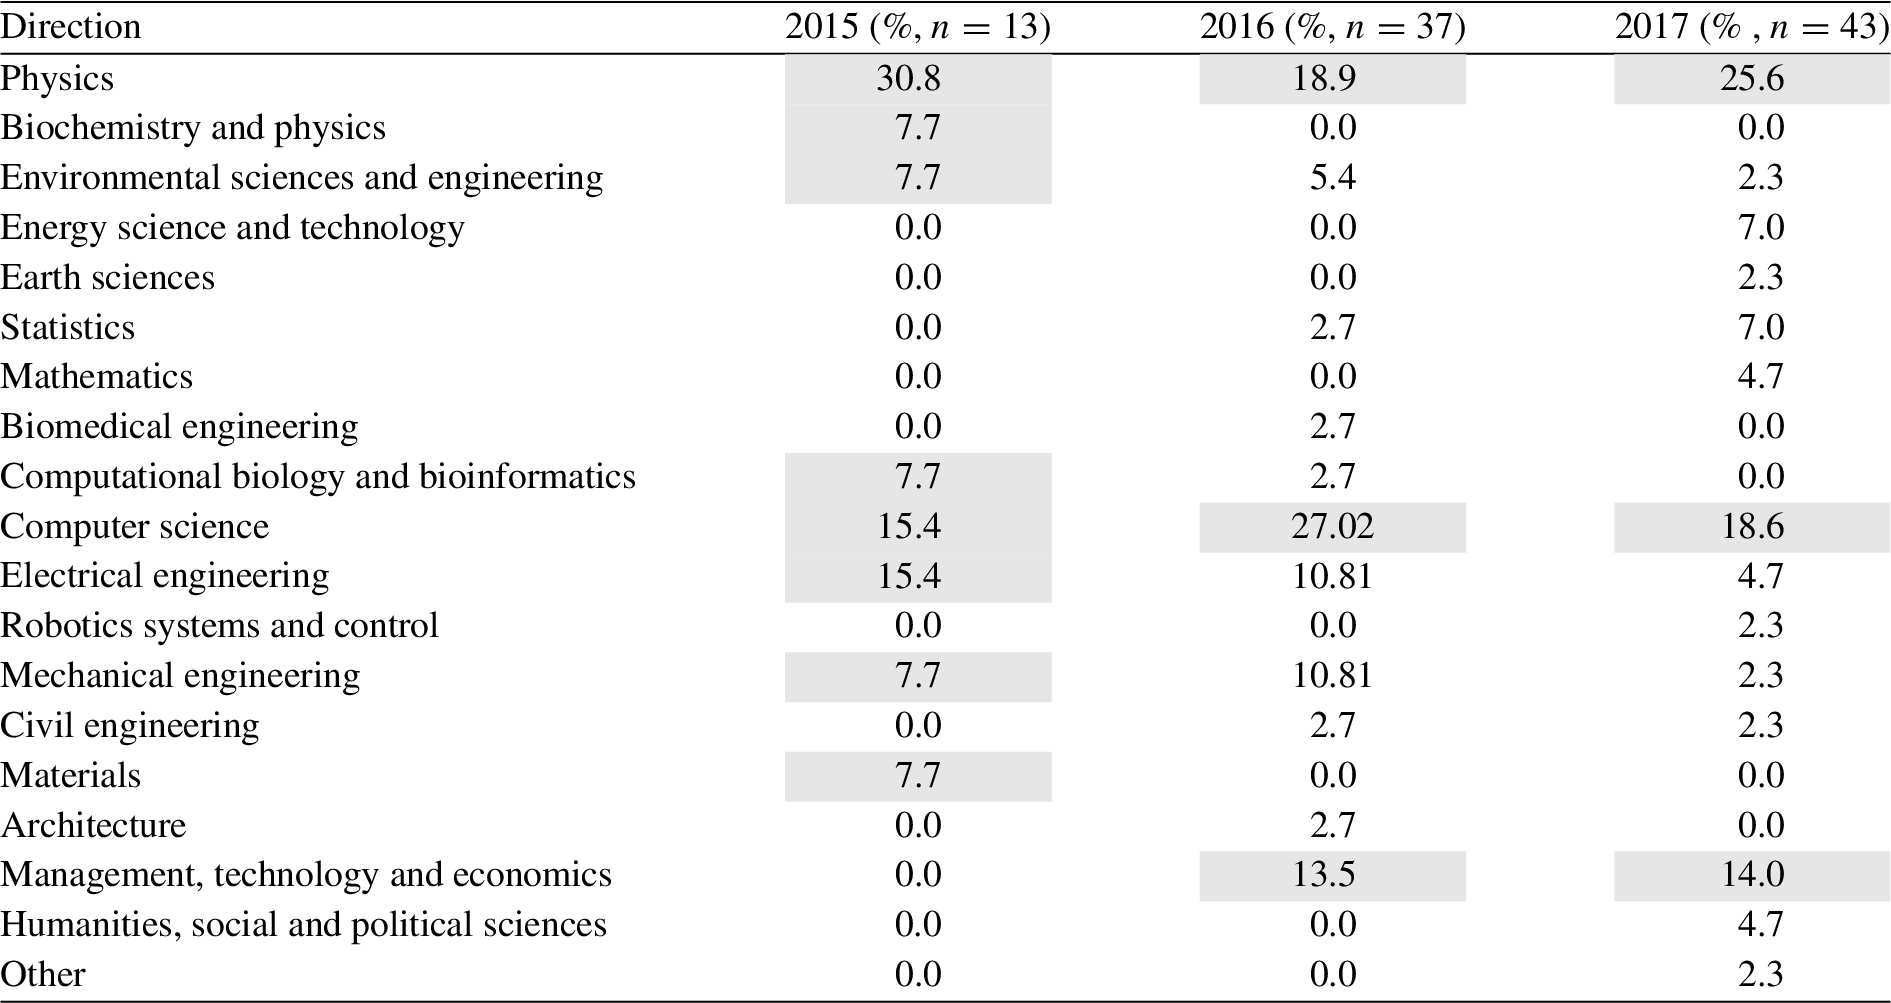
Within the computer science curricula, ETH Zurich offers data science related courses for instance, data mining, big data, machine learning and others. Most of these courses are offered by renowned international experts and they concern state-of-the-art methods and techniques of data science, mainly from an academic viewpoint, i.e. analytical expressions and complexity analysis of machine learning algorithms. For this reason, most of these courses are mainly designed for students with a strong mathematical or computer science background. A similar trend is observed in the vast majority of science and technical universities as reviewed in Section 7. The course “Data Science in Techno-socio-economic Systems” is designed to establish a broader scope of data science education that is highly cross-disciplinary, practical, yet, research-oriented. Without being an introductory course to the aforementioned more advanced and computer science-oriented courses, “Data Science in Techno-socio-economic Systems” minimizes the content overlap, while providing evident learning opportunities to students that attend more advanced courses to unfold advanced knowledge and skills in a new educational context.
Table 1 illustrates the educational background of students participating in the course each year.3
The students’ educational background is extracted from the students demographics available in the Supplementary Material.
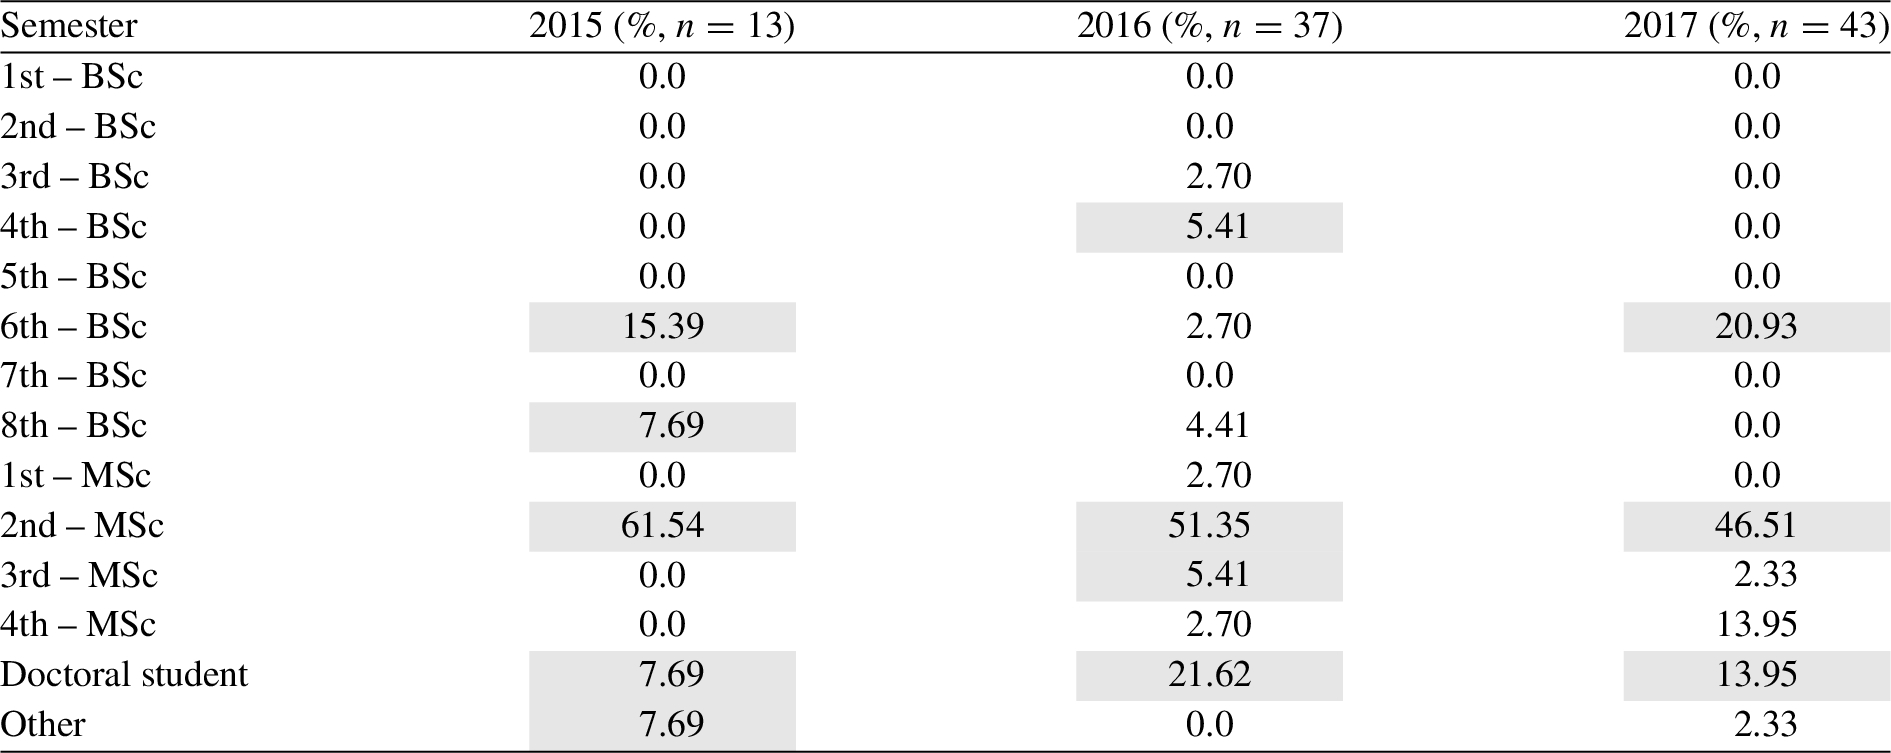
Table 2 illustrates the semester status of the students who have participated.4
The students’ semester status is extracted from the students demographics available in the Supplementary Material.
Students’ semester status participating in the course “Data Science in Techno-socio-economic systems”. The top-3 semesters are indicated by the grey boxes and n denotes the number of students
The goal of the course is to teach a large spectrum of postgraduate students data science and guide them to develop skills with which they can independently practice data science starting from data collection to oral/written presentation of results. Figure 1 illustrates learning objectives of the course according to Bloom’s taxonomy [2]. The educational content relies on epistemic concepts of science and research in order to cultivate a problem-oriented mindset as well as confidence by learning rigorous methodologies and conventions: formulating research questions/hypotheses, presenting results in a quantitative manner, combining the behavioral and design science research strategies [11].

Learning objectives of the course “Data Science in Techno-socio-economic systems” according to Bloom’s taxonomy.
Moreover, the education relies exclusively on open and free software. It has been shown that closed and proprietary software compromises empirical research and replication of results in data science [15].
Content-wise, the course covers the following topics:
The course makes no assumption of pre-requisite knowledge, e.g. certain programming skills, and therefore, it is designed to build up a minimal knowledge at all stages of data science. Data manipulation proves to be one of the most challenging educational material to design here. It is the “makes your hands dirty” job, a critical requirement for the direct involvement of students in data science as it involves processing tabular data, removing missing values or outliers, aggregating, filtering, formatting and transforming data. Although most programming languages, e.g. python, scala, java, etc., provide advanced data manipulation methods, teaching a general-purpose programming language in a cross-disciplinary audience of students entails several drawbacks and limitations: (i) steep learning curve, especially for non-computer scientists, (ii) potential distraction from the main goals of the course, (iii) hard to make a choice for a programming language that would meet the expectations and desires of an heterogeneous audience [50], (iv) may raise motivational issues for students who already perform data manipulation with a programming language of their convenience.
The solution here has been AWK,5
Available at
Examples:
Concerning databases, the focus is on running SQL queries. The free visual environment of MAMP7
Available at
Available at
Available at
The part on data mining and machine learning provides an overview to supervised and unsupervised machine learning algorithms and how to choose one for a certain problem. Teaching these algorithms from a mathematical perspective is covered in depth in other courses that require a narrower focus. Instead, this course aims at qualifying students to make informed decisions about the algorithms they use and their implications. For instance, it is shown that clustering of time series subsequences is meaningless despite a long lasting research that adopts this method [30]. Similarly, extracting a user profile from historical discrete data by using the centroids of clusters may result in a profile that does not correspond to reality, as the mean may not appear in the historic data. The cluster medoids may be more relevant in such a case [40]. Data over-fitting and under-fitting are discussed as well.
The part on big data analytics covers batch vs. real-time data processing using Hadoop10
Available at
Available at
The course is highly application-oriented. One of the goals of the course is to develop domain knowledge and expertise in a cross-disciplinary context. In other words, the students do not only apply data science methods in an application domain but instead they are given the opportunity to understand in more depth challenges of different domains and how data science methodologies can be used to tackle these challenges. Several case-study applications come from the multi-disciplinary research of the tutors [20,39,40], adjusted in an educational context. They are accompanied by the datasets and the software code for the repeatability and expansion of the results by the students. To improve the cross-disciplinarity outcome of the course, lecturers of different discipline can give lectures about applications in the future. Moreover, earlier successful students’ projects are presented to develop a psychological construct of self-efficacy in the course [7]. This proves to be particularly essential for students’ confidence and expectations at the beginning, when they define the goals of their projects.
Students are evaluated based on a group research project of 2–3 people that they have to carry out throughout the semester. The grade of the project covers entirely the grade of the course and it is formed based on the following criteria: (i) scientific clarity-25%, (ii) technical clarity-25%, (iii) writing and content presentation-25%, (iv) oral presentation-25%, (v) data generation and collection-10% bonus. The latter acknowledges the key role that data construction plays on scientific practices of theory development [16].
Unlike a more conventional project report, the research project for this course has several formal requirements that reflect on the knowledge quality of the course material required to successfully practice data science as well as effectively present results in writing and orally. In this sense, the research project can be seen as a pedagogical artifact reflecting on the constructivism learning theory [9]. The project requirements are defined by an educational guideline that is based on fundamental epistemic concepts and conventions of research philosophy and strategy applied in the context of data science. The outline of the guideline is the following:
Define the challenge.
Define the outcome and its significance.
Reason about a data science approach.
Select the data sources.
Define evaluation metrics and measurements.
Build the data analytics pipeline.
Perform validation and evaluation.
Draw conclusions and future work.
In Step 1, defining the challenge involves the formulation of a research question or hypothesis accompanied by related work. In other words, the students are encouraged to develop a problem-solving mindset from the very beginning of their project work. However, the guideline is not strict at this point as it is known that new research questions and hypotheses may become apparent during the exploratory data analysis. The outcome and the significance of a project in Step 2 concerns the broader positioning of students’ work in society. Is the outcome an artifact, such as an algorithm or an engineered system? Or just a better understanding of an observed phenomenon? Can the results be used to design a new policy? And for whom is the outcome relevant? An end user, a policy-maker or a system operator? A certain problem can be studied with other approaches beyond data science, for instance, agent-based simulation or analytical approaches. Justifying the intractability of a mathematical problem or reasoning about the data science approach is part of Step 3 of the guideline. The Step 4 of the guideline stands for the selection of data sources. Datasets need to meet project requirements, e.g. quality, size, format, granularity level etc. For instance, when a data science project on smart grid focuses on residential energy consumption, data about the aggregate load of a power grid are not relevant. In this case, residential smart meter energy data are required or advanced methods for energy disaggregation [32]. The guideline encourages students to be quantitative in their presentations and for this reason they need to define specific meaningful metrics and measurements in Step 5. For instance, the relationships in a social network can be measured with topological and graph spectral properties. When these networks are temporal, the respective temporal metrics should be applied [37]. The data analytics pipeline in Step 6 is the design of the data manipulation, processing and analytics performed. Step 7 suggests a high-quality presentation of quantitative results. Step 8 completes the guideline with explicitly stating the conclusions and future work.
Students’ projects and diversity in their educational direction
Students’ projects and diversity in their educational direction
The guideline is presented to the students at the very first lecture followed by lectures with project examples that adhere to the guideline. Students are asked to deliver an early one-page proposal at the 3rd week of the semester outlining the challenge they tackle, why they employ a data science approach, what the related work is in the problem area and what data they intend to use. At the end of the semester, students deliver their report and present their project to the course instructors as well as all other students in the class, who can challenge their classmates with questions.
Table 3 illustrates students’ projects during the first and the second year of the course. The following two key observations can be made: (i) The diversity of the projects is very high ranging from analysis of twitter data, mobile sensing, Internet of Things, analysis of scientific publications, analysis of traffic and environmental data, medical applications and other. (ii) The diversity of the students’ background in the teams formed is not high. The group formation trend is that students either form teams with colleagues they know from their own study program or they are more comfortable when they work together with people from the same background, even if they choose a project that is not in the domain area of their expertise, for instance Project 4 and 15.
However there are some exceptions worth mentioning and discussing. For instance, Project 11 has been a challenging project, though very successful and resulted in a prestigious scientific publication in conference proceedings [22]. This project was conducted by an architect and two mechanical engineers and involved an advanced data collection process in the context of smart cities using mobile phones, wearables and several environmental sensors carried by participants in the study. The goal of the project was to measure several urban qualities in a city path, for instance, greenery, stress, noise pollution and others. Project 13 is another successful project ran by students of the same, but highly inter-disciplinary study program and resulted in a scientific publication as well [35]. The goal of the project is to measure the spatio-temporal language mobility evolution and detect real-world events as well as tourism patterns via Twitter and the analysis of 10TB of tweets.12
Available at
There are also projects though that faced some serious challenges. For example, Project 10 studied correlations between the use of bicycles and the weather in Zurich. It proved not to be straightforward for the students to go beyond descriptive statistics and a regression analysis of the data without additional supervision effort. In this particularly case, the low diversity of the group played a critical role. At the end the students managed to compare classification results on weather phenomena between k-means clustering and the Gaussian Data finite mixture model fitted by the EM algorithm [19]. Project 2 also proved to be especially challenging for the students due to the low data quality by privacy-preservation constraints introduced during the data collection process [36]. In this case, the initial hypothesis was whether the activity of the Chaos Communication Congress13
Available at
Available at
The course has received so far two official evaluations by the students conducted on behalf of ETH Zurich. The general satisfaction has been 4.4/5.0 and the lecturers’ evaluation 4.5/5.0 on the following aspects: understandable and clear explanation of the subject, learning goals, lecture significance, motivation to active participation, and material made available.
For the purpose of this paper, the author conducted interviews15
The full text of the interviews is available in the Supplementary Material.
Educational background of interviewees
The interview is guided by the following agenda questions:
How effective was the course for you?
Was this course too easy or too hard for you?
If you are a computer scientist, what were beneficial and limiting factors after attending a data science course designed beyond the computer scientist?
If you are not a computer scientist, what were beneficial and limiting factors for you after attending a data science course taught by computer scientists and including other computer science students?
How successful was the course to provide you the minimum set of skills to practice data science?
How effective was in this course to learn doing research by practicing data science?
How effective was in this course to learn data science by doing some research?
Questions 6 and 7 reflect on how students perceive constructionism learning methods [38], data science as an evocative object [47] and the learning approach of ‘to-think-with’ and ‘to-learn-with’ technology (data science in this context) [42]. Questions 3 and 4 reflect on how students experience the transformative learning approach [45]. They are formulated from the perspective of the computer scientist vs. non-computer scientist to encounter the diversity [34] and the dimensions within the frame of reference of the cognitive learning process [45]: habits of mind and points of view.
During the interviews, the effectiveness of the course was communicated by Interviewee 2 as “a very nice change from my normal study life” and “learnt a lot of interdisciplinary skills”. Interviewee 5 gave emphasis on group work by stating that “got to work closely with people, learn how they work and think, brainstorming and share ideas, make friends”. Interviewee 4 realized that “Later on in my studies I could see a lot of areas where a data science approach could be useful, so I am happy to tell that I acquired some basic skills to practice data science.”, while Interviewee 1 experienced the course as “a good overview for techniques in data science”. However, Interviewee 3 noticed that “I would like to have known more about the exact technical details of the example applications that were presented.” and “as a computer science student I really like the implementation details.” This indicates that it is very challenging to capture the right level of detail for a broad range of students with different expectations. This challenge is also identified in earlier work on data science education [23].
Interviewee 5 mentioned that the course had the “appropriate” difficulty level and Interviewee 3 found the course “relatively easy” as the interviewee felt “familiar with most technical details discussed during the course”. In contrast, Interviewee 2 said that the “course is one of the most complex and time intensive courses I did in GESS” but also mentioned that “the level was perfect to learn new skills”. In similar line is Interviewee 4 by stating that “the course was pretty hard for me, but the effort was worth it”. Interviewee 1 identified that the course “was challenging but not too hard, especially since we had to work in groups for our final projects”.
Question 3 answered by Interviewee 3 revealed that “a lot of time the course was focused on data science technical stuff I was already familiar with”. However the student also stated that “A benefit was seeing all those applications on the real world, which we don’t usually focus on in computer science”. Question 4 was answered by the rest of the interviewees. Interviewee 2 mentioned that “I profited from knowledge and experience of other participants and lecturers and learned new terms of data science and statistics” but also stated that “I did not have a lot of background knowledge about the hard skills and libraries. This wasn’t limiting for the course but for the project we did, because we needed a lot of time to find the right sources and libraries”. Interviewee 5 listed as benefits “(i) coaching from the COSS team, (ii) learn about social data, opportunities, limitations, (iii) presentations by the other teams: gives ideas, insights and (iv) learn some new tools, e.g. mawk”. It was mentioned as limiting factor the “Too much material covered during the lectures”. Interviewee 4 found beneficial the “The way of thinking of a data scientist” while Interviewee 1 “would have preferred to have hands on examples/tutorials of various techniques in a given programming language”.
The answers on Question 5 share similar remarks on the beneficial and limiting factors of Questions 3 and 4. Interviewee 5 mentioned “better to focus on the top-3 tools and techniques” with Interviewee 1 agreeing, though adding that “it helped point students in the right direction for which techniques might be useful for which questions”. Interviewee 2 reacted very positively by stating “Very successful, I learned the skills to approach a big data problem and subdividing it into smaller problems. I also got to know nice tools to do that in real problems such as Weka and scikit (a python library).” and Interviewee 4 “I could see a lot of areas where a data science approach could be useful, so I am happy to tell that I acquired some basic skills to practice data science.”
Answers to Questions 6 and 7 have a high heterogeneity, evidently showing how students perceive the link between data science and research methodologies. For Interviewee 1, “was nice to learn techniques from other disciplines” and “nice to have a project to test your solutions”, though “could have helped to have intermediate homework/assignments as well”. Interviewee 2 finds doing research by practicing data science as “quite effective”, however, leaning data science by doing some research proves to be “quite time consuming”. Interviewee 4 confidently states that “if there wasn’t our project, I would not understand cluster-based approaches as I do so now” and supports that doing projects is “the best way to learn”. Interviewee 5 believes that this course should have “part of the lecture devoted to how to conduct research in general”, though practicing data science cannot obviously cover the whole broad spectrum of research methodology. In contrast, Interviewee 5 perceived the learning of data science by doing some research as “One of my best ETH experiences so far”.
Although this evaluation provides several insights about the course performance, other aspects can be evaluated as part of future work: success in job market, lecturers’ multi-disciplinarity in the learning outcome, comparison to web science curricula [13], applicability of this cross-disciplinary design other data science courses.
There is an ongoing interest on data science education. Research work mainly focuses on the design of large undergraduate and postgraduate programs [3,4,18,23]. Data science is usually an organizational frame of the curriculum in which well-established courses lie such as programming, data mining, big data and machine learning.
Nevertheless some limited earlier work illustrates experiences from recent courses tailored to data science. For instance, an inter-disciplinary approach to data science at Wright State University is earlier illustrated [6]. In contrast to the course illustrated in this paper, the inter-disciplinarity is limited to students studying computer science and management of information systems. Moreover, the content mainly focuses on statistics and programming skills without covering topics such as big data or a broader range of data mining algorithms. Furthermore, the integration of data science related courses in the statistics curricula of six universities is earlier reviewed and comparison is made on the topics covered [23]. From the six courses, only the one of the Smith College is entirely designed as an data science course. Moreover, the courses mainly focus on cultivating programming skills in R and other technologies. They do not involve research concepts and are not designed to function in a cross-disciplinary context. However the tutors of the courses identify challenges encountered in the course of ETH Zurich as well. For instance keeping students with varied computational skills and backgrounds on the same page and motivational level or assembling consistent material from different sources suggest space for improvement.
There are also educational programs that mainly focus on massive open online courses of data science. Issues such as standards for sharing data [49], technologies for these types of courses, e.g. OpenEdX are covered [18]. Gamification is a promising concept to engage students in a cross-disciplinary context. For instance, the Learn2Mine [5] platform uses notifications and badges as feedback and rewards. Earned badges mark progress that unlock the ability to earn “Learned” and “Mastery” status for lessons taught. Leaderboards promote the development of reputation and competition among learners. The potential exploration of these methods in the illustrated course is part of future work.
Lessons learnt and societal implications
The design and teaching of the course “Data Science in Techno-socio-economic Systems” in a cross-disciplinary audience of students results in several lessons learnt that can be summarized as follows:
The facilitation of cross-disciplinary data science education in university curricula qualifies a new generation of versatile professionals with the capability to communicate and work together with a broader range of experts. Moreover, making accessible data science to a wider range of domain experts can reduce business training costs. Similarly, academic education of data science with open-source and free software tools can reduce business costs on expensive commercial software suites.
Data science education using research methodologies cultivates to citizens a higher awareness about what data mean, a cognitive reasoning based on empirical evidence, critical thinking and constructive doubt. In other words, it cultivates these mental capacities to withstand the challenges of our nowadays digital societies [25] concerning the interpretation and wise use of information from (social) media [17], populism leading to ineffective voting [8,10], privacy and autonomy violations from big data profiling technologies or profit-oriented recommender systems [24,41], manipulative actions and means of propaganda in social networks and beyond [46].
Conclusion
This paper concludes that cross-disciplinary data science education is highly challenging and requires a very different approach in the design of study courses than data science education exclusively for computer scientists. However, this paper shows that cross-disciplinary data science education is feasible and highly rewarding for students. The perspective of constructivism and transformative learning theory proves effective for the design of a novel course with these challenging requirements. In contrast to related courses, the position of this paper is that learning data science in this cross-disciplinary context has a value by itself as the students’ diversity and the blend of skills in collaborative research projects create multifaceted learning opportunities that cannot unfold otherwise. This is empirically shown via the design, development and teaching of a new cross-disciplinary data science course at a top-class university and the experiences aggregated throughout the lifetime of the course.
This paper contributes lessons learnt such as how to make choices in regards to the content size and difficulty level, the diversity of students, students’ projects and project teams, the choice of software tools for different data science tasks, the use of research projects as a pedagogical artifact and how data requirements influence what a student can learn from data. Cross-disciplinary data science education qualifies more versatile data scientists in the job market, can reduce business costs for training and ultimately cultivate a more democratic and participatory citizen prepared to respond to the upcoming challenges of the digital society [25].
Footnotes
Acknowledgement
Special thanks go to Dr. Izabela Moise for her contribution and our collaboration to design and run the MSc course “Data Science in Techno-socio-economic Systems”. The author would also like to thank Prof. Dr. Dirk Helbing, the Computational Social Science (COSS) group and the department of Humanities, Social and Political Sciences (GESS) at ETH Zurich for hosting and supporting this course. I am grateful to the interviewees, as well as all students attending this course for making cross-disciplinary education of data science such an enriching and constructive teaching experience. Last but not least, I would like to thank Pia Scherrer and Benno Volk for their feedback on the paper and the invaluable experience I had in their course “Foundations of Teaching and Learning” at ETH Zurich.