
Abstract
BACKGROUND:
The range of software available to radiologists has increased enormously with the advancement of AI. A good example of this is software to determine ASPECTS in the treatment of potential stroke patients.
OBJECTIVE:
In this study, two software packages (eASPECTS from Brainomix and VIA_ASPECTS from Siemens) were tested and compared for their performance in the daily clinical routine of a maximum care provider with a 24/7 stroke unit.
METHODS:
A total of 637 noncontrast CT images were obtained from consecutive patients with suspected stroke, of whom 73 were finally diagnosed with MCA infarction. Differences in agreement and quantification of agreement were analysed, as well as the correlation and sensitivity, specificity and accuracy compared to raters.
RESULTS:
Compared to VIA_ASPECTS, eASPECTS shows good agreement and strong correlation with the raters. VIA_ASPECTS has lower accuracy and low specificity than eASPECTS but a higher sensitivity.
CONCLUSION:
Both software products have the potential to be decision support tools for radiologists. There are, however, differences between the two software products in terms of their intended use.
Introduction
In the field of radiology, there has been an increase in the availability of AI-based software tools over the past few years [1–3]. These tools are designed to assist radiologists in their work, to speed it up, to improve patient safety, and to provide added value to the patient [4]. As shown by van Leuween et al in their 2021 publication, the majority of the available software has been developed for neuroradiology [1]. In this field, numerous software programs have been developed over the past few years for the automatic calculation of the Alberta Stroke Program Early CT Score (ASPECTS). ASPECTS helps to assess early ischaemic changes in the middle cerebral artery (MCA) territory in patients with acute ischaemic stroke (AIS) and has become one of the standard evaluations in patients with suspected ischaemic stroke [5, 6]. This score is applied to noncontrast CT images (ncCT) and divides the MCA area into 10 regions, subtracting one point from the original 10 points for each segment affected by the infarct. Therefore, a smaller number represents a larger infarct. The ASPECTS score has become established as one of the measures used to assess infarcts and guide patient management and plays an important role in the guidelines, particularly in the management of patients with a large vessel occlusion and a small infarct core [7, 8]. Therefore, the ASPECTS score should not be less than 6 at the time of decision for mechanical thrombectomy [7]. In particular, ASPECTS can be determined automatically by the software. This is intended to assist the radiologist in making a decision, thus providing a second opinion. Such software support can be of particular benefit to inexperienced radiologists or enhance workflow efficiency. This has been shown using eASPECTS, where the automatically generated ASPECTS was more sensitive in detecting early infarct signs than the inexperienced radiologist [9]. However, previous studies have shown that visual assessment of ASPECTS requires clinical experience and can lead to high interrater variability [10]. Reliable software solutions are therefore essential to determine the score automatically and in a standardised way. In recent years, the number of available AI-based tools for radiology has grown by leaps and bounds. When deciding to use such software, it is important to validate how well it performs and achieves the goal, and in the case of ASPECTS-defining software, how well it assists the radiologist. Many of these tools lack independent scientific evidence of their effectiveness, even if they are approved for the European (CE) or American (FDA) markets [1].
In this study, we compare two AI-based tools that can automatically determine and visually display the ASPECTS score for their performance in the daily clinical routine of a maximum care provider with a 24/7 stroke unit. The aim is to test whether this software is suitable for everyday clinical use by comparing performance characteristics such as accuracy, sensitivity and specificity compared to human expert readings.
Methods
Study design, data acquisition and processing
This study is a retrospective observational study conducted in a single centre. It meets the ethical standards of the National and Institutional Research Committee and the Helsinki Convention of 1964. Due to the retrospective nature of the study, informed consent was not a requirement.
For this study, we analysed data from images acquired between 1 February and 31 March 2022. During this period, 1,431 noncontrast CT (ncCT) scans were performed in 1,140 consecutive patients, of whom 637 had suspected ischaemic stroke. Of these patients, a total of 72 had a final diagnosis of acute ischaemic stroke, and of these, 33 patients had an ASPECS≤9 according to the raters. The study design is depicted in Fig. 1.
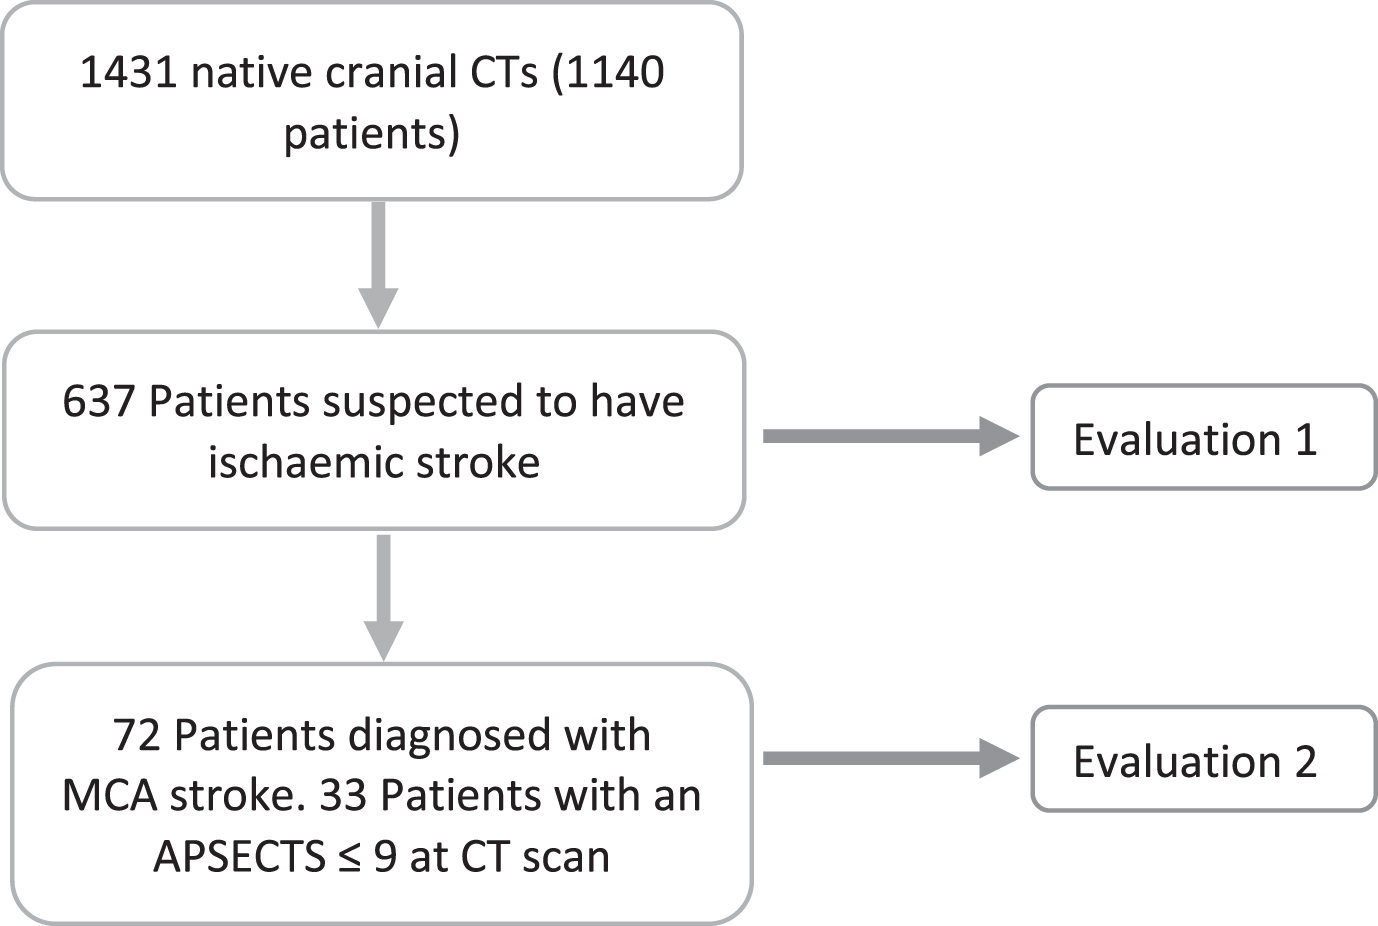
Study design.
All data were acquired using a 360-line CT (Aquilion One, Canon Medical Systems). For the automatic evaluation of the ASPECTS software, the CT reconstructions of the ncCT scans were transferred directly (inline) to the respective software. The e-ASPECTS software from Brainomix (version 8) and the automated inline CT ASPECTS (VIA_ASPECTS) evaluation from Siemens (SyngoVia VB60A, Siemens Healthineers) were used. Both programs were used according to the manufacturer’s instructions, and both programs received the same reconstructions of the scanner. The default settings of the software were used. Finally, the ASPECTS evaluation is displayed on the 3 mm layers as VIA_ASPECTS and on the 5 mm layers as eASPECTS.
In the case of VIA_ASPECTS, the software can detect acute hypodensity in both hemispheres at the same time in some cases and therefore gives an ASPECTS score for both hemispheres. If this was the case and the ASPECTS score was different on each side, the dataset was removed from the analysis; if the score was the same for both hemispheres, it was used. The reduced number of data is presented in the respective analysis.
The statistical analyses were all performed using GraphPad Prism for Windows, version 9.5.0 (GraphPad Software, San Diego, California USA, www.graphpad.com). Categorical variables are presented as absolute values with percentages, nonnormally distributed variables are presented as medians with interquartile ranges (IQRs), and normally distributed variables are presented as the means with standard deviations. Nonparametric tests were used in this study. Descriptive statistics and the Spearman correlation coefficient were used to analyse and compare the data. The correlation coefficient was interpreted as follows: up to 0,1 as weak, 0,3 as moderate and above 0,5 as strong. For pairwise comparisons, the Wilcoxon matched pairs signed rank test or the Friedman statistic was used. Agreement comparisons were performed using Bland–Altman plots. To quantify agreement, a kappa analysis was performed using the GraphPad web tool (accessed February 2023; https://www.graphpad.com/quickcalcs/kappa1/). The Kappa analysis was evaluated as follows:<0 as no agreement, between 0.00 and 0.20 as slight agreement, between 0.21 and 0.40 as fair agreement, between 0.41 and 0.60 as moderate agreement, between 0.61 and 0.80 as substantial agreement, and between 0.81 and 1.00 as almost perfect agreement [11]. In all analyses, a two-tailed p value below 0.05 was considered statistically significant.
Results
The present study used two approaches (Fig. 1). First, the performance of the two software solutions was tested on all images of patients with suspected acute ischaemic stroke who underwent native CT during the aforementioned period (n = 637). In a second approach, a subset (n = 72) of these data was examined to evaluate the performance of the software for patients with proven large vessel occlusion in the MCA territory.
Software performance in suspected acute ischaemic stroke
From 1 February to 31 March 2022, 637 patients were evaluated for suspected acute ischaemic stroke. The mean age of the patients was 67 (±19) years, and the gender distribution was almost even (Table 1).
Characteristics of patients with suspected acute ischaemic stroke
Characteristics of patients with suspected acute ischaemic stroke
+ = results from the Wilcoxon matched pairs signed rank test; n = 605.
The median eASPECTS was 10, and the median VIA_ASPECTS was 9. These two scores were statistically significantly different in the pairwise analysis. The Spearman correlation shows a moderate to high correlation between eASPECTS and VIA_ASPECTS (rs = 0,47 [95% CI = 0,40 to 0,53], p = <0,0001).
To evaluate the agreement between the two software programs, a Bland–Altman analysis was performed. The Bland–Altman analysis (Fig. 2) shows that VIA_ASPECTS produces slightly lower values than eASPECTS, with an unclear variability of the data. However, the mean difference is almost zero (bias = 0.924±1.244, CI 95% = -1.514 to 3.362).
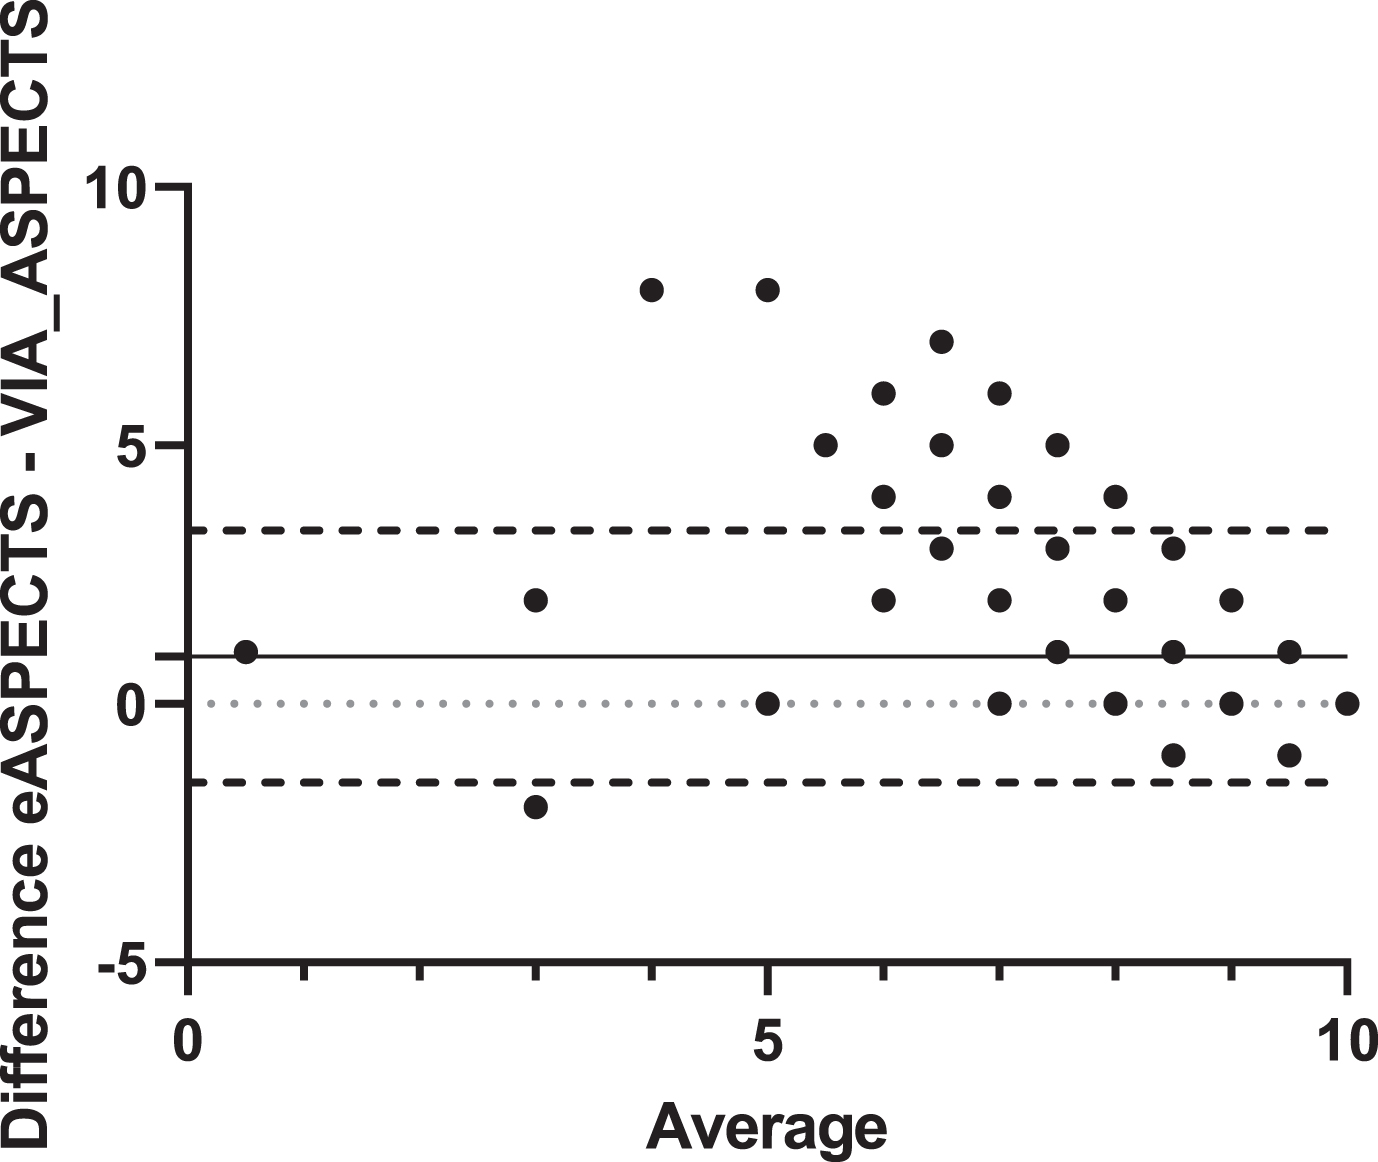
Bland–Altman analysis. Agreement comparison between eASPECTS and VIA_ASPECTS (n = 605). Dashed line = 95% limits of agreement; dotted line = zero line; solid line = mean (bias of agreement).
To quantify the reliability of the two programmes, we used the kappa method. The 72 cases diagnosed as acute ischaemic stroke were used as a reference. A distinction was made between whether the raters saw a demarcation (ASPECTS≤9) or no demarcation (ASPECTS 10) on the CT images. The contingency tables are shown in Table 2 A-B. The kappa analysis showed that there was agreement between eASPECTS and the raters in 545 (85.56%) of the observations and that the number of agreements expected by chance was 504.5 (79.20%) of the observations. This gives a kappa value of 0.306 (SE = 0.05; CI 95% = 0.207 to 0.404), which corresponds to fair agreement. VIA_ASPECTS software showed lower agreement with the raters (Kappa = 0.056 [SE = 0.011; CI 95% = 0.035 to 0.078]), agreeing with the raters in only 265 (41.6%) of the observations, and the number of agreements expected by chance was 242.8 (38.11%) of the observations. Both software programs have a high sensitivity (78,79% and 96,97%), but VIA_ASPECTS has a low specificity (38,58%; see Table 2C). The accuracy for eASPECTS is 85.56% and for VIA_ASPECTS, it is 41.60%.
Contingency tables of ASPECTS≤9 versus ASPECTS 10 between both the software and the raters. (A) Results for eASPECTS. (B) Results for VIA_ASPECTS. The percentage of the total number of patients is indicated. (C) The sensitivity and specificity of both software programs vs. the Raters are shown
TPR = true positive rate; TNR = true negative rate.
To see if the performance of the software improved when only true MCA strokes were included, we selected from the 637 patients who were diagnosed with MCA stroke. There were 72 patients with a mean age of 74 years (±11) and an almost even gender distribution (Table 3). The distribution of the brain hemisphere affected by stroke was also almost equal (52% vs. 47%). The median NIHSS on admission was 6. Intravenous lysis therapy was administered to 28% of the patients, and 14% of the patients underwent thrombectomy to mechanically open the occlusion. Overall, 14% of the patients died in the hospital as a result of stroke. These baseline characteristics are shown in Table 3.
Baseline data of patients diagnosed with MCA stroke
Baseline data of patients diagnosed with MCA stroke
MCA = middle cerebral artery; Ivt = intravenous thrombolysis.
The median of eASPECTS was 10, that of VIA_ASPECTS was 8 and that of the rater score was 10. Pairwise comparisons of the different ASPECTS scoring methods show that the VIA_ASPECTS scores are significantly different from the eASPECTS or rater scores, whereas the eASPECTS scores are not significantly different from the rater scores (Fig. 3). The Spearman correlation for all three is comparable and strong, although the correlation of the eASPECTS scores to the rater scores were higher than that of VIA_ASPECTS (0.72 vs. 0.67; see Table 4).
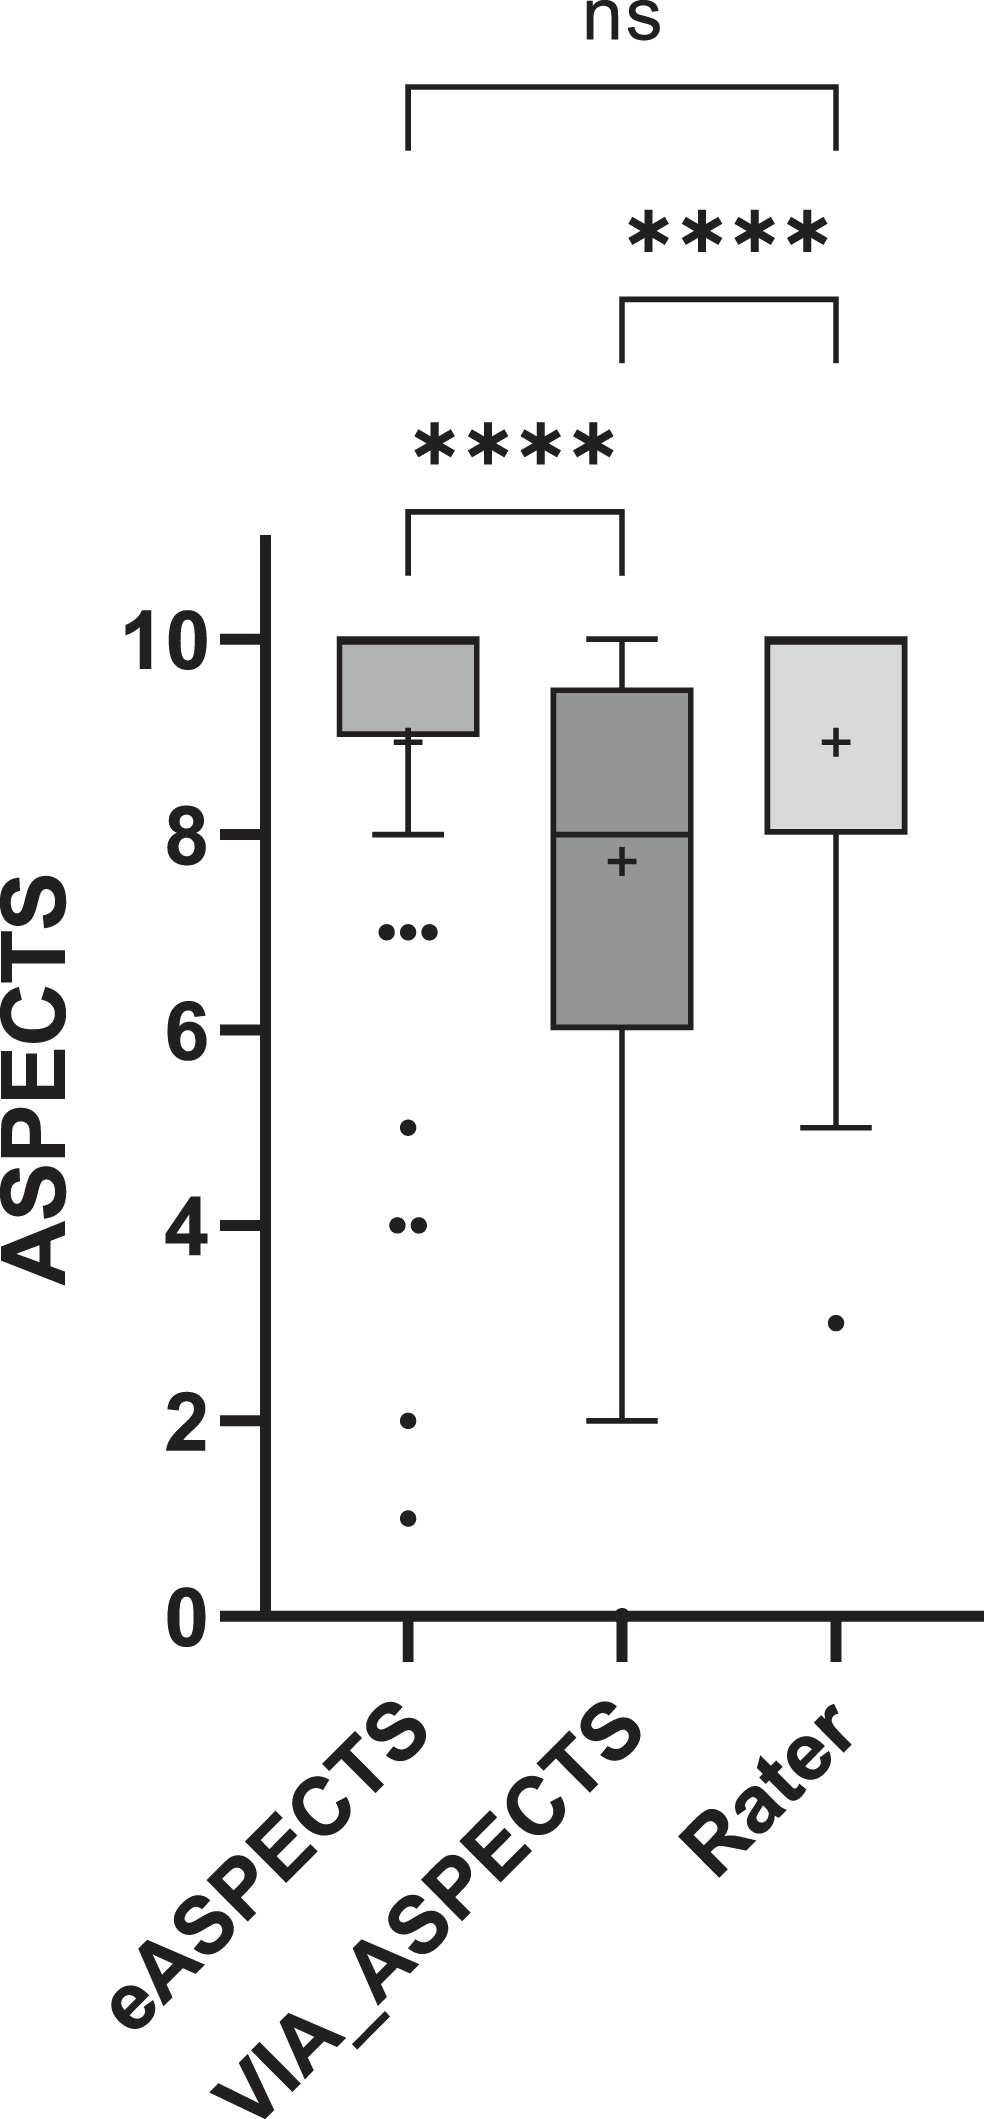
Pairwise comparison of the eASPECTS, VIA_ASPECTS and rater ASPECTS score. The boxplot is displayed according to Tukey’s test. Pairwise differences were calculated using the Friedman statistics test (n = 65). **** =≤0,0001 and + represent the mean value.
Spearman r Correlation (n = 65). The 95% confidence interval is given in brackets
* p = <0,0001.
The Bland–Altman analysis shows similar behaviour between eASPECTS and VIA_ASPECTS for this subset as in the overall analysis above, with a bias of 1.22. The Bland–Altman analysis is shown in Fig. 4. Here, we see that eASPECTS is in complete agreement with the raters (bias = 0.00) and VIA_ASPECTS has a bias of -1.22 with the raters. VIA_ASPECTS gives lower ASPECTS scores than eASPECTS or the raters. The frequency distribution of the scores between both the software and the raters can be seen in Table 5, which clearly shows that VIA_ASPECTS detects lower values. In other words, it detects acute infarction more often.
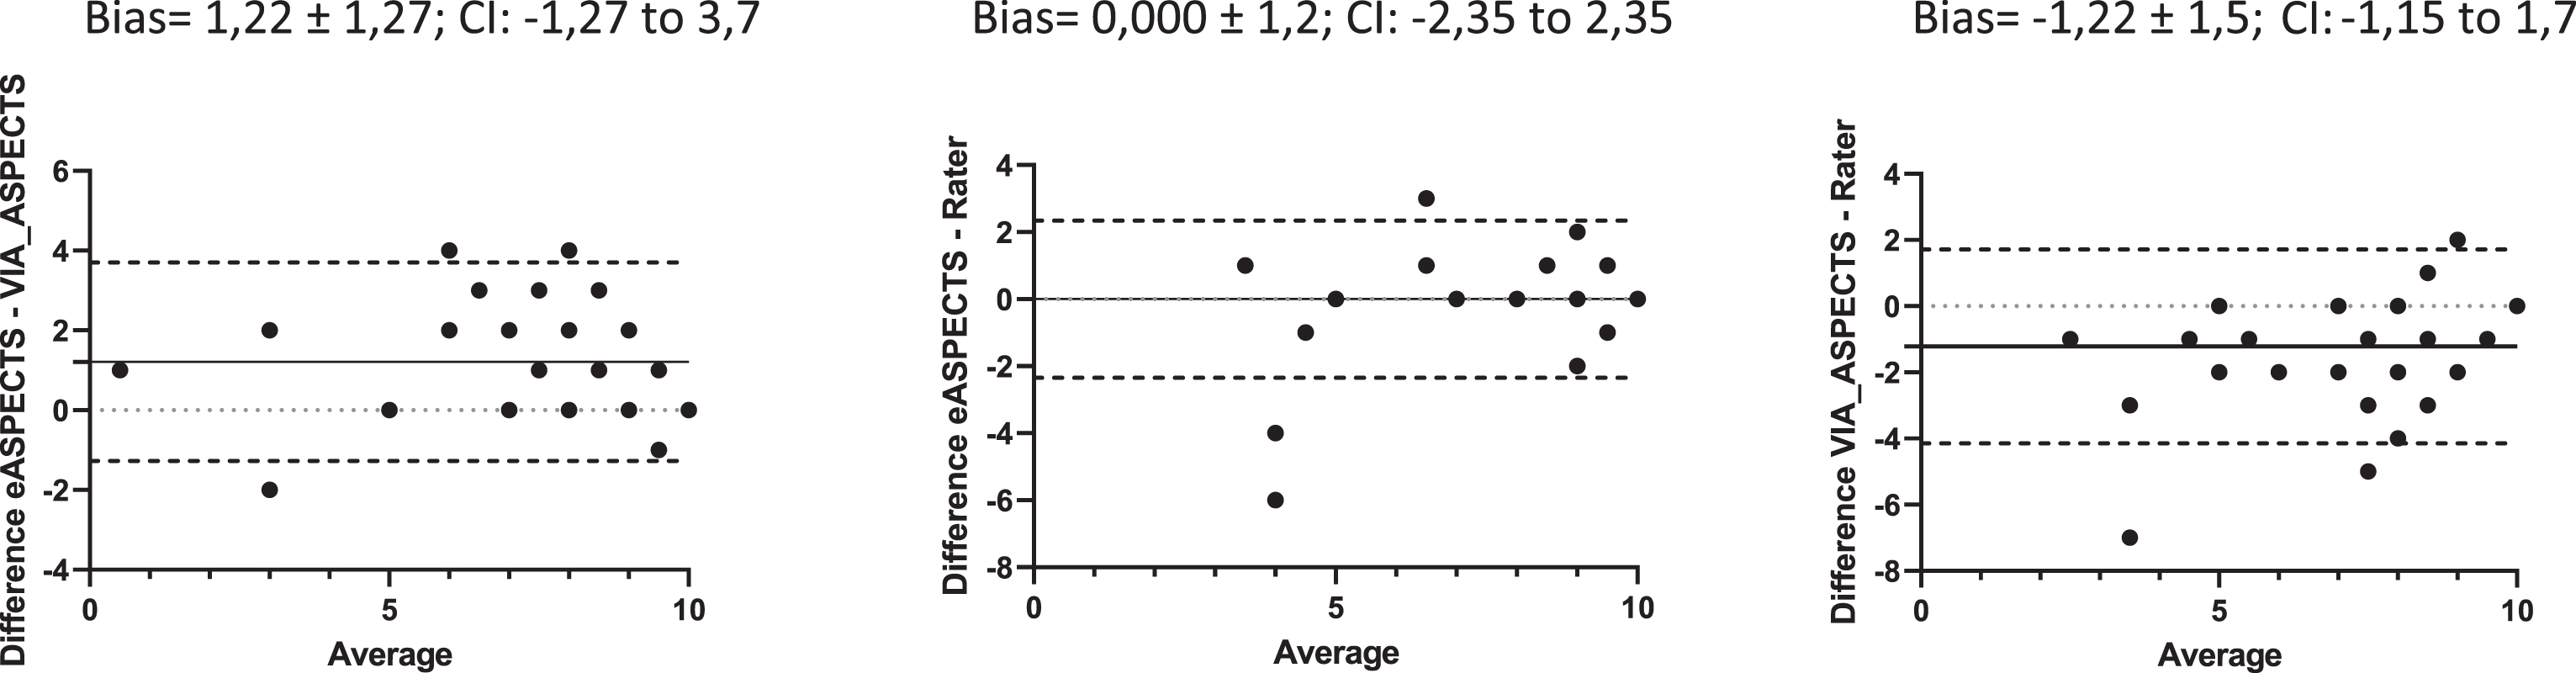
Bland–Altmann analysis of the patients diagnosed with MCA stroke (n = 65). CI = 95% confidence interval.
Frequency distribution of the ASPECTS score of the two software programs and the raters
Table 6 A-B shows the contingency tables. The kappa analysis shows that eASPECTS agrees with the raters in 57 (79.17%) of the observations, and the number of observations that are expected to agree by chance is 36.2 (50.23%). eASPECTS has a moderate agreement with the raters, as the kappa = 0.581 (SE = 0.096; CI 95% = 0.393 to 0.770). For VIA_ASPECTS, the number of observed agreements with the raters is 47 (65.28%), and the number of agreements expected by chance is 34.3 (47.69%), giving a fair agreement with a kappa of 0.336 (SE = 0.085; CI 95% = 0.169 to 0.503). The sensitivity and specificity of the two software products compared to the raters are shown in Table 6C, which shows that the sensitivity of both software products is high (78.79 and 96.97%), while the specificity is very different: eASPECTS 79.49% and VIA_ASPECTS 38.46%. The accuracy is 79.17% for eASPETCS and 65.28% for VIA_ASPECTS.
Contingency tables of ASPECTS≤9 versus ASPECTS 10 between both the software and the raters. Outcome presentation for the patients diagnosed with MCA stroke. (A) Results for eASPECTS. (B) Results for VIA_ASPECTS. The percentage of the total number of patients is indicated. (C) The sensitivity and specificity of both software programs versus the raters
TPR = true positive rate; TNR = true negative rate.
In the treatment of acute stroke, especially since the introduction of endovascular therapies in the guidelines for stroke management, image-based selection procedures have become an essential part of the decision-making process; one of these image-based decision scores is the ASPECTS. In a meta-analysis, AI-based ASPECTS software showed good reliability in detecting early stroke changes on ncCT scans compared to both automated ASPECTS software and expert assessment against the reference standard [12]. The performance of the ASPECTS software in routine clinical practice has only been tested in a few studies and was therefore the rationale for this study.
In this study, we compared two software programs and evaluated their performance in the daily practice of a CT department in a hospital with a 24/7 stroke unit, using patients with an acute MCA diagnosis as a reference. In a second approach, we looked only at how well these software programs could process the reference dataset. eASPECTS has comparable sensitivity, specificity and accuracy. VIA_ASPECTS has a high sensitivity but lower specificity and accuracy. With the smaller dataset of diagnosed MCA infarcts, the accuracy of VIA_ASPECTS increases. However, the specificity remains low. This is because VIA_ASPECTS tends to always detect a stroke, so an ASPECTS score of 10 is less likely to occur than with the raters or eASPECTS software. In other words, VIA_ASPECTS tended to overestimate the size of the infarct, resulting in more detected strokes. eASPECTS is closer to the raters and shows that both the sensitivity and specificity are usable in daily practice. VIA_ASPECTS may offer an advantage to inexperienced clinicians due to its high sensitivity. Notably, evaluating the results depends on the purpose for which the software is used. For example, to assist an inexperienced clinician, it is more important that the software has a high sensitivity, while specificity is less important. If the software is to be used as a prognostic tool as a replacement for expertise, high sensitivity, specificity and accuracy will be necessary. Further, the first dataset, namely, the patients with suspected stroke, shows that the use of these software programs as prognostic tools is possible to a certain extent, although it is fair to say that these software programs were not designed for prognostic use.
Furthermore, we can see that the eASPECTS are almost in agreement with the raters, as shown by the Bland–Altmann analyses, and this has already been shown in other publications [9, 13–15]. The correlation between eASPECTS and the raters was stronger (0.72) than that between VIA_ASPECTS and the raters (0.67) and is comparable to data in the literature [16, 17]. One of the aforementioned studies included patients with suspected or confirmed large vessel occlusion in the anterior circulation who underwent CT perfusion; their agreement analysis between the raters and eASPECTS yielded a kappa value of 0.448, which was lower than the value obtained in this study (0.581) [16]. In addition, the results were comparable in terms of accuracy and sensitivity, showing that our results are in line and consistent with those in the literature. For the VIA_ASPECTS software, it is difficult to draw comparisons from the literature, as most published data refer to a prototype that was probably incorporated into the final version of the software tested here. Nevertheless, the literature shows that the Siemens prototype behaves like the software tested here. Goebel et al. showed that the correlation between eASPECTS and the reader is higher than that between the prototype and the reader. Their Bland–Altmann analyses show similar results, with a mean of almost zero for the eASPECTS vs. reader comparison and a mean of 1.2 for the prototype vs. reader comparison, which corresponds to the values obtained in this study (mean of 0 for eASPECTS vs. reader and mean of -1.22 for VIA_ASPECTS vs. reader) [17]. They show that the prototype performed inferior to Brainomix, which is very similar to the data presented in this paper, using VIA_ASPECTS. Analogous results to those of Bland–Altmann have also been shown in another study [18]. However, all the mean values mentioned are very small and close to zero, indicating very good agreement. Here, we can show that despite good agreement, the accuracy and specificity of VIA_ASPECTS is inferior to that of eASPECTS and that the accuracy improves when only patients with MCA infarction are considered.
There are some limitations to this study, including the fact that it is a single-centre, retrospective study. However, this is also an advantage, as all images are from the same scanner, eliminating differences that could be due to hardware, different scanning protocols or image reconstruction. Another limitation is the lack of a valid reference dataset, such as the DWI ASPECTS dataset. Studies with reference datasets can be found in the literature and have been cited here, but they do not reflect everyday use of the software, as in most cases, routine clinical practice does not include a timely MRI scan in stroke management. The suspected stroke dataset, which is a realistic reflection of patients seen in hospitals, could not have been used. Additionally, this study did not consider regional agreement, i.e., whether the same compartments or the same side of the brain were detected, or the time dependency, e.g., the time of acquisition in relation to the time of onset. These should be investigated in future studies, as there is already evidence of differences [18, 19].
Conclusion
The use of software to reliably quantify ASPECTS scores is of high clinical relevance, and it is in this area that newer AI software products can provide a solution and standardise scoring to eliminate interobserver disagreement. Care should be taken when selecting these tools, and the limitations of these tools should be understood to decide which software is best suited to the desired clinical application and to integrate it seamlessly into the radiology workflow. Here, we were able to show that the two software programs show good agreement with each other and with the raters but do not perform equally well when quantifying agreement, as VIA_ASPECTS performed poorer than eASPECTS. Although both software programs had good sensitivity, VIA_ASPECTS had a poor specificity, and the accuracy of this software program was only acceptable when only cases including a diagnosis of stroke were presented. This study also shows that it is possible to use AI-based software to preselect patients, as suggested by the eASPECTS results, but larger studies are needed to confirm this. After all, such software should provide valid data and help the radiologist and clinician make decisions, not cause the radiologist to spend time deciding whether the software is correct or if the radiologist is right. Ideally, the software should help the radiologist make faster decisions and lead to better time management in cases of possible thrombectomy. The software should also guide young doctors with little neuroradiological experience to recognise early stroke changes on ncCT.