
Abstract
Introduction
Colorectal cancer (CRC) is a significant cause of cancer-related death worldwide, with over 576,000 new deaths in 2020. 1 Despite significant advances in CRC treatment, 20% of patients present with distant metastasis at diagnosis, and 25% develop metastases later, with a 5-year survival rate of less than 15% for metastatic CRC patients.2,3 Therefore, there is an urgent need for accurate and precise diagnostic and prognostic tools to recognize CRC patients with different outcomes and enable personalized treatment. The current American Joint Committee on Cancer (AJCC) criteria, based on tumor size (T), lymph node involvement (N), and presence of metastasis (M), remain the most widely used staging system for CRC prognosis assessment. However, patients with the same AJCC stage can exhibit diverse pathological characteristics and outcomes. As such, there is a pressing need for novel classification models to refine individualized diagnostic and therapeutic strategies for CRC in the future.
Although traditional treatments such as surgical resection, chemotherapy, and radiotherapy have prolonged the survival of CRC patients, they are often associated with adverse effects and unsuccessful cases, particularly at advanced stages of the disease. Recently, there has been increasing evidence highlighting the critical role of the tumor microenvironment (TME) involving in the genesis and progression of various malignancies, including breast cancer, gastric cancer, liver cancer, pancreatic cancer, and CRC.4,5 TME refers to a biological environment in a tumor, consisting of malignant cells, nonmalignant cells, non-parenchymal cells such as immune cells and stromal cells, as well as biological factors secreted or recruited by these cells. In CRC, essential components of the TME have been shown to have a remarkable impact on proliferation, progression, recurrence, metastasis and drug resistance feature.6,7 For example, regulatory T cells (Tregs) and myeloid-derived suppressors cells (MDSCs) are recruited in CRC to suppress antitumor response and promote tumor progression. Nonsteroidal anti-inflammatory drugs targeting the cyclooxygenase-2 (COX-2) pathway are commonly used to reduce the risk of CRC. 8 Despite the increasing awareness of the clinical significance of TME, the potential of TME-related genes to establish a molecular biomarker for CRC diagnosis remains largely unknown.
In this study, we conducted a comprehensive analysis of the clinical relevance of TME-associated genes in CRC by studying the immune landscape of CRC cohorts from the public databases. We divided the cohort via the diverse immune pattern into sub-clusters and subsequently identified candidate genes. Then TME based prognostic signature (TPS) was generated according to a machine learning algorithm. The cohort was further classified into different risk groups according to the TPS risk score, and we thoroughly explored the prognostic ability of TPS in all aspects. And finally, customized therapeutic drugs were proposed based on risk of TPS. To summarize, TPS holds a great potential as a robust model for assisting in the diagnosis and therapeutic decision-making for the CRC population.
Materials and methods
CRC data acquisition
The RNA transcriptome and the matched clinical information of CRC patients were accessed from the following public databases. The colorectal adenocarcinoma cohort of The Cancer Genome Atlas (TCGA-COAD) including 594 patients was obtained from the TCGA CDC data portal (http://portal.gdc.cacner.gov/repository) and Cbioportal (http://cbioportal.org). GSE103479 with 156 CRC patients were downloaded from the Gene Expression Omnibus and used for validation. For all data sets, fragments per million reads (FPKM) and transcripts per million mapped reads (TPM) normalized value was used for further analysis.
Immune landscape of CRC and TME based consensus clustering
The immune landscape of CRC was systematically assessed via CIBERSORT algorithm of 22 major immune cell phenotypes. CIBERSORT is a deconvolution algorithm using a set of representative gene expression values to estimate the proportions of specific cell types from tumor samples with multi-cluster of different cells. The expression profile of reference signature of 22 immune cells, LM22, was obtained from the CIBERSORT database (http://cibersort.stanford.edu/).
Subsequently, the CRC cohort was clustered based on Euclidean distance and Ward's linkage of differentiated TME patterns. According the expression pattern of infiltrating immune cells from CIBERSORT, the consensus clustering analysis was performed with the cumulative distribution function (CDF) from 2 to 9 via the R package “ConsensusClusterPlus”. As CIBERSORT is a versatile computational method quantifying tumor infiltrating leukocytes mainly consisting the TME, the clusters divided based on differentiated CIBERSORT score are likely with distinct expression pattern of TME associated genes. Therefore, the TME related genes were defined as the differentially expressed genes (DEGs) between different TME clusters. The calculation was performed with R package “limma” under the condition of adj. P value < 0.05.
Establishment of TME prognostic signature TPS for CRC
As 2336 TME related genes was screened out between the 2 TME clusters, potential prognostic genes were further searched via the univariate Cox regression under the condition of significant correlation to overall survival (OS) time (P < 0.05). As a result, 380 TME related genes were identified as prognostic candidates for the machine-learning algorithm. Next, a random survival forest (RSF) regression model was administrated to eventually generate TPS classifier with the prognostic candidates. The RSF underwent 1000 iterations and the element genes were selected with largest C-index value to eventually establish TPS followed by a multivariate COX analysis (P < 0.05). Eventually, 11 prognostic genes was picked to consist the TPS classifier.
Afterwards, an TPS risk score was calculated according to the following equation of the TME molecular signature:

Functional enrichment analysis between different risk groups
To explore potential difference of biological entities between TPS subgroups, functional enrichment analysis was performed with the R package “clusterProfiler”. The DEGs between different TPS risk groups were screened out with identical criterion of TME related genes with adjust P < 0.05. In detail, Gene sets were downloaded from the MSigDB database (http://gsea-msigdb.org/gsea/msigdb), and Gene set enrichment analysis (GSEA) was running to exhibit most dramatically changed signaling pathways, biological processes and gene hallmarks. Similarly, single sample gene set enrichment analysis (ssGSEA) was administrated to compare the immune characteristic between risk subgroups.
Estimation of tumor stromal and immune dysfunction between different risk groups
More immune character such as extent of tumor stromal content and immune dysfunction were subsequently studied to analyze the possible effect of immunotherapy. Stromal score was evaluated via the R package “ESTIMATE” with its algorithm. In specific, stromal score, immune score, ESTIMATE score and tumor purity were given. In addition, the Tumor Immune Dysfunction and Exclusion (TIDE) scoring was applied to assess the response to immunotherapy, extent of immune dysfunction, immune exclusion, and microsatellite instability (MSI).
Identification of potential therapeutic molecules personalized for TPS risk subgroups
Possible therapeutic agents for patient belongs to certain TPS risk group were screened via estimating the half-maximal inhibitory concentration (IC50) value of a bulk of drugs from open databases. Drug sensitivity data on human cancer cell lines (CCLs) were acquired from Cancer Therapeutics Response Portal, Board institute (CTRP, http://portals.broadinstitute.org/ctrp) and Genomics of Drug Sensitivity in Cancer, Sanger institute (GDSC, http://www.cancerRxgene.org). In specific, the differential drug sensitivity across various cancer cell lines using IC50 value was obtained from CTRP and GDSC database. A dataset of training group was formed after the alignment between TPS risk group and drug responses. Then a ridge regression was conducted to select the candidates with negative correlation of significance. R package “oncoPredict” was employed to predict drug sensitivity values among patients in different TPS subgroups.
Statistical analysis
All statistical analyses were conducted with the R software platform (v4.1.0, R Foundation for Statistical Computing, Vienna, Austria). Some major R packages included, “limma”, “survival”, “ROCR”, “ggplot2”, and “caret“. To compare variables in multiple groups, Student's t-test and ANOVA analysis were used for parametric factors, whereas Wilcoxon rank-sum test and Kruskal-Wallis test were applied for nonparametric factors. To measure the correlation of different variables, Spearman's rank-order correlation and Pearson's r correlation were set. Furthermore, Kaplan-Meier and the log-rank test were used for survival analysis. The area under the curve (AUC) was measured to judge the efficacy of the receiver operating characteristic curve. In all statistical analyses, a two-tailed P < 0.05 was considered significant.
Results
TME landscape of colorectal cancer
The primary goal of this study is to comprehensively investigate the clinical relevance of TME characterization in CRC and develop a TME derived prognostic signature to support diagnosis and personalized treatment. The scheme of this work was shown as following (Figure 1).

Work scheme of the study.
To achieve this, TCGA-COAD cohort was selected due to the large volume of CRC patients and complete clinical information. To illustrate the immune property of CRC, CIBERSORT scoring was applied to summarize the TME pattern of each patient followed by cluster analysis to test determine whether the cohort could be stratified based on similar immune background. Unsupervised hierarchical clustering was performed with CDF 2 to 9 to determine the optimal number of clusters, and the result revealed that the TCGA cohort could be optimally divided into two distinct clusters of TME cell infiltration (Figure 2(a)). Subsequently, we identified 2,336 TME-related genes between the two clusters, and a heatmap was generated to demonstrate the correlation between the TME clusters and major pathological factors, as well as the most significant TME-related genes (Figure 2(b)). Next, possible difference in biological activities between the two TME clusters was further investigated. The Geno Ontology (GO) functional analysis was conducted based on cluster-related DEGs described above (Figure 2(c)). Our results showed that extracellular matrix organization, extracellular structure organization, and external encapsulating structure organization were most enriched biological processes; collagen-containing extracellular matrix, collagen trimer and endoplasmic reticulum lumen were most aggregated cellular component; extracellular matrix structural constituent, collagen binding extracellular matrix and structural constituent were most enriched molecular function.

Changes in biological behaviors between TME clusters of CRC. (a) Unsupervised clustering based on TME characteristic in CRC cohort. (b) Representative DEGs between TME clusters combined with other clinical factors via heatmap. (c) Bar plot of biological changes between TME clusters. (d) CIBERSORT of changes in immune cells infiltration between TME clusters.
We also compared the activities of major immune cells between the two TME clusters, and observed most immune cell infiltration varied dramatically between the two TME clusters (Figure 2(d)). TME cluster A was characterized by increased T regulatory cells, Macrophages M0, activated Mast cells and Neutrophils. In contrast T cells CD8, T cells CD4 memory, and Macrophages M1 particularly elevated in cluster B patients.
Establishment of TME prognostic signature and risk scoring in colorectal cancer
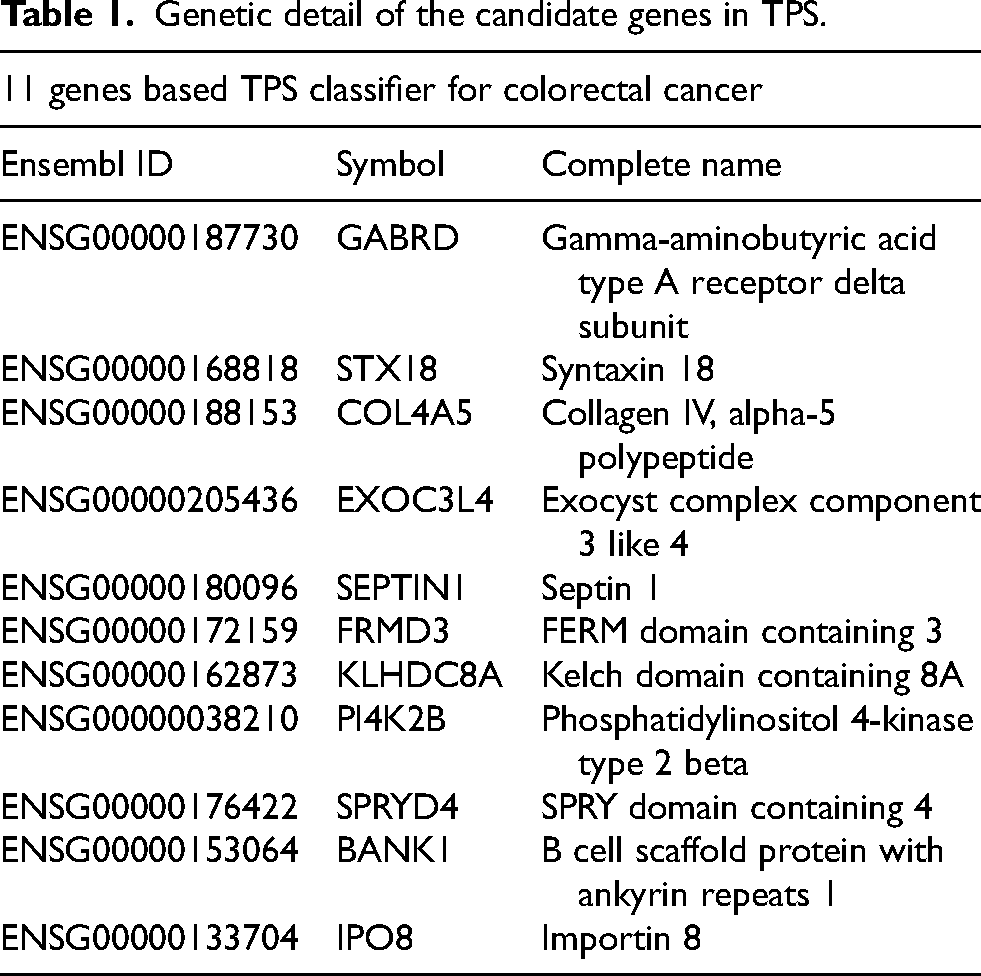
Altogether, 449 CRC patients from the TCGA-COAD cohort was separated into TME cluster A and B, consisting of 193 and 256 samples, respectively. Among the 15503 mRNAs, 2336 genes were identified as TME associated genes under the criterion described previously. To identify prognostic genes, a univariate Cox regression was performed, and 1,990 genes were selected for further analysis. Eventually, a RSF model was built, and a 40-mRNA panel was identified as the most relevant to the OS of CRC using the criterion of the largest C-index value after 1,000 iterations. A multivariate Cox regression confirmed 11 genes with independent prognostic ability, which were then used to establish the TPS of CRC. The genetic information on the component genes was listed in Table 1.
Genetic detail of the candidate genes in TPS.
Subsequently, a risk score of TPS was calculated based on the coefficient of the component genes. Each sample in the training and validation cohorts was endowed with a score and divided into a high-risk and a low-risk subgroup according to the median value of the risk score in each specific group. The distribution of risk scores in these groups as well as the expression of related TPS genes in risk subgroups were also shown in detail (Figure 3(a)–(c)).

The efficacy of TPS as a prognosis indicator. (a) Correlative distribution of TPS risk score and patient counts, vital status and elemental genes in the training group. (b) Correlative distribution of TPS risk score and patient counts, vital status and elemental genes in the testing group. (c) Correlative distribution of TPS risk score and patient counts, vital status and elemental genes in the whole group. (d) Kaplan-Meier survival compared OS in different risk subgroups of the training cohort. (e) Kaplan-Meier survival compared OS in different risk subgroups of the testing cohort. (f) Kaplan-Meier survival compared OS in different risk subgroups of the whole cohort. (g) The ROC of TPS in the training cohort. (h) The ROC of TPS in the testing cohort. (i) The ROC of TPS in the whole cohort.
Assessment of prognostic efficiency of TPS
As the TPS was first developed, its prognostic ability was thoroughly evaluated using a variety of methods. First, the Kaplan-Meier survival curve was employed to compare the OS of high-risk and low-risk groups in all training and validation cohorts. Consistently across all cohorts, patients in the high-risk group of TPS had significantly shorter OS than those in the low-risk group (P < 0.001, CI = 0.95), suggesting TPS is effective in distinguishing CRC patients with distinct outcomes (Figure 3(d)–(f)).
Next, time-dependent ROC and their areas under the ROC curve (AUCs) was performed to evaluate the efficacy of TPS in OS prediction. Encouragingly, the AUCs of TPS were high, indicating high sensitivity and specificity. Notably, the AUCs of TPS were 0.856, 0.879 and 0.866 for 1, 3 and 5 years OS prediction in the training group, respectively, while 0.910, 0.941 and 0.957 in testing cohort and 0.796, 0.786, and 0.819 in the entire group (Figure 3(g)–(i)).
To note, independent CRC cohort of GSE103479 and GSE106584 were employed for validation respectively (Figure 4(a)–(d)). Kaplan-Meier regression and ROC analysis both confirmed the high efficacy of TPS in the validation group (P < 0.001, CI = 0.95). Collectively, TPS and its risk score exhibited supreme effectiveness in predicting the prognosis of CRC, indicating significant potential as a novel method for diagnosing CRC and guiding clinical decision-making.

The validation of TPS. (a) Kaplan-Meier survival compared OS in different risk subgroups of the first validation cohort. (b) The ROC of TPS in the first validation cohort. (c) Kaplan-Meier survival compared OS in different risk subgroups of the second validation cohort. (b) The ROC of TPS in the second validation cohort.
Additionally, to further evaluate the prognostic capability of TPS, particularly in combination with other clinicopathologic factors, Cox regressions was subsequently performed to explore the independent ability of each factor as a prognosis indicator (Supplementary Figure 1(a) and (b)). TPS scoring was evaluated together with age, gender, TMN, and AJCC stage. After conducting univariate and multivariate Cox analyses only the patients’ age and the TPS risk score were identified as independent prognostic indicators. The risk score of TPS exhibited significantly correlation (P < 0.001). Next, a consensus prognostic model incorporated TPS and other clinical factors was established with a nomogram. In specific, each factor was assigned a prognostic score based on its clinical relevance to the outcome, and the sum was the reflection of the OS probability in 1, 3, and 5 years (Supplementary Figure 1(c)). Noticeably, the TPS possessed a predominant role in evaluating weights, suggesting its pivotal role in prognostic assessment of CRC patients.
Functional analysis of TPS risk derived subgroups
As TPS differed CRC patients with distinct OS time and prognosis, we hypothesized that significant biological changes might occur between the high-risk and low-risk groups. To investigate this, top enriched KEGG signaling pathways, GO biological processes (BP) and GO hallmarks were assessed via GSEA, and immune activities were measured using ssGSEA analysis. As the result, the high-risk group was associated with top enriched KEGG pathways of complement and coagulation cascades, dilated cardiomyopathy, ECM receptor interaction, while the low-risk group was enriched with citrate cycle, DNA replication, and glyoxylate and dicarboxylate metabolism (Figure 5(a) and (b)). Additionally, DNA heterochromatin assembly, DNA replication dependent nucleosome organization, and regulation of gene expression epigenetic were closely correlated with the high-risk group, while mitochondrial ATP synthesis coupled proton transport, DNA strand elongation, and regulation of telomerase RNA localization were strongly associated with the low-risk group based on BP of gene ontology analysis (Figure 5(c) and (d)). Genetic hallmarks related to epithelial mesenchymal transition, pancreas beta cells, and KRAS signaling were predominantly enriched in the high-risk group, whereas no specific hallmark cluster was enriched in the low-risk group of TPS (Figure 5(e)).

Gene set enrichment illustrates biological changes between risk subgroups. (a) Enrichment of KEGG signaling pathways in the high-risk subgroup of TPS. (b) Enrichment of KEGG signaling pathways in the low-risk subgroup of TPS. (c) Enrichment of biological process in the high-risk subgroup of TPS. (d) Enrichment of biological process in the low-risk subgroup of TPS. (e) Enrichment of hallmark gene set in the high-risk subgroup of TPS. (f) ssGSEA depicturing the immune landscape of TPS risk groups.
Since TPS was a molecular classifier based on TME characterization of CRC, we investigated major immune activities between different TPS risk subgroups were tested via ssGSEA. As expected, most immune infiltration including MDSCs, macrophages, mast cells, nature killer cells, regulatory T cells were found significantly elevated in the high-risk group, while the level of activated T cells and activated B cells remained unchanged or obscure (Figure 5(f)).
TME background in TPS risk subgroups
The TPS is a powerful prognostic tool for differentiating CRC patients with varying outcomes, but its potential for guiding clinical decisions in the treatment of CRC remains uncertain. Therefore, ESTIMATE and TIDE scoring were subsequently employed to evaluate the potential effect of immunotherapy in CRC patients. ESTIMATE scoring algorithm was developed to evaluate the level of immune and stromal entities in virous types of malignancies. In line with this, the high-risk TPS group had increased stromal score, immune score, ESTIMATE score, and decreased tumor purity, suggesting greater immune infiltration in this cohort of CRC patients (Figure 6(a)–(d)). Additionally, TIDE scoring was employed to predict the possible response to immunotherapy in both TPS risk subgroups. Notably, the TPS high-risk group exhibited higher level of immune dysfunction, immune exclusion and total TIDE score, while the degree of MSI remained unchanged between the risk subgroups (Figure 6(e)–(h)). Altogether, these findings suggest that CRC patients with TPS high-risk might underwent higher immune activity, making them more likely to benefit from immunotherapy.

TME characteristic between TPS risk subgroups. (a) ESTIMATE score between TPS risk subgroups. (b) Immune score between TPS risk subgroups. (c) Stromal score between TPS risk subgroups. (d) Tumor purity status between TPS risk subgroups. (e) Immune dysfunction status between TPS risk subgroups. (f) Immune exclusion status between TPS risk subgroups. (g) MSI status between TPS risk subgroups. (h) TIDE score between TPS risk subgroups.
Identification of possible therapeutic drugs for TPS high risk patients
The previous results have established that TPS could stratify patients based on their prognosis, biological pattern and TME feature. As a result, patients with different risk levels determined by TPS may benefit from personalized treatment instead of a uniform treatment protocol for all CRC patients to achieve better therapeutic outcomes. Therefore, we searched for potential drugs to specific TPS risk subgroup in the public databases CTRP and GDSC, which contains drug sensitivity data of a great number of drugs and novel molecules. The correlation between median IC50 of all drugs in these databases and TPS risk score were examined using Wilcoxon analysis, and the top 10 drugs for each risk subgroup were listed (Figure 7(a) and (b)). In the CTRP database, CAY10618, doxorubicin combined with navitoclax and SMER-3 were found to be the most effective agents for high-risk patients, whereas Methotrexate, Oligomycin A, and GSK461364 were specific tolow-risk patients. Similarly, in GDSC database, JAK_8517, AZD1332, and Foretinib were selected for high-risk patients, while Docetaxel, AZD5438 and AZD2014 were identified for low-risk patients in the TPS classification.

Potential drug candidates specialized for different TPS risk patients. (a) Candidate drugs identified in the CTRP database. (b) Candidate drugs identified in the GDSC database.
Discussion
CRC is a leading cause of cancer-related deaths worldwide. A significant number of patients diagnosed with CRC develop metastases in a short period, and the OS rate for 1 year, 3 years, and 5 years is approximately 70%, 30%, and below 20%, respectively. The development of systemic therapy such as chemotherapy, targeted therapy, and immunotherapy, either alone or in combination, has significantly improved the survival of unresectable CRC patients. Studies have revealed that personized treatment based on the molecular and pathologic features of the disease would assist the survival for 2 or 3 years, leading to substantial emphasis on extensive genomic profiling for CRC patients.
In recent years, the number of molecular signatures associated with the prognosis of CRC as well as other malignancies has grown significantly, aiming to specify tumor subtypes and identify potentially effective therapeutic drugs.9–12 For instance, Wang et al has developed a 4-gene related signature (DKC1, FLNA, CSE1L and NSUN5) to predict the overall survival and disease-free survival in CRC patients. 13 Other groups have also built classifiers based on genes related to diverse biological aspects of CRC including pyroptosis, methylation and metabolic changes.14–16 Moreover, accumulating evidence has revealed the importance of TME in all stages of CRC, including tumor growth, metastasis, angiogenesis, recurrence and response to therapy. 17 Hence prognostic classifiers based on TME pattern were also developed to predict the progression of disease using mRNA, microRNA, long non-coding RNA and other TME-associated genes.18–20 To note, the value of TME associated genes in assessing CRC has not been thoroughly explored, since most of these biomarkers focused on prognosis prediction rather than improving personalized treatment. Thus, novel biomarkers with high accuracy and specificity are still in great demand for CRC treatment. In comparison to prior studies, our research offers several unique insights to the field of CRC study. First, our study emphasizes on TME associated genes in CRC patients, revealing the clinical relevance of these genes in prognostic assessment. In addition, due to the machine learning algorithm of RSF, the TPS exhibits a superior efficacy as prognostic classifier, reflecting its considerable potential in future clinical application. Last but not least, despite numbers of published studies developed models for prognostic assessment, but most of them failed to carry out approaches assisting current treatment strategy of CRC. By stratifying patients into risk groups and recommending possibly valid drugs for each group, our study sheds light on personalized treatment.
In this study, the prognostic potentiality of TME related genes in CRC was comprehensively explored. The TCGA-COAD cohort was employed as the primary training dataset. Based on the activity of main immune cells obtained using CIBERSORT scoring, the cohort was divided into two main TME clusters, indicating that TME characterization plays an essential role in the development and conclusion of CRC DEGs between the two immune clusters were considered TME related genes and selected to build the prognostic classifier. Instead of commonly used methods such as LASSO regression, the study employed the random survival forest for superior efficacy, resulting an 11-gene based TPS classifier.
Subsequent tests were applied to evaluate the prognostic potential of TPS as a novel prognosis indicator for CRC. The TPS automatically split the CRC cohort into high-risk and low-risk subgroup via the median value of the score based on the expression of the component genes in each patient. Kaplan-Meier survival regression and ROC analysis were employed to evaluate the efficacy and effectiveness of the TPS. High-risk patients defined by TPS unanimously exhibited considerably shortened OS compared to their low-risk peers in both the training and validation cohorts. Additionally, the ROC test reflecting prognostic sensitivity and specificity was used. The TPS constructed via machine learning algorithm showed superb capacity of prognostic anticipation, where its AUCs reached 0.86, 0.88 and 0.87 in 1-, 3- and 5-year survival anticipation in the training cohort. Similarly, the AUCs achieved as high as 0.91, 0.94 and 0.96 for 1-, 3- and 5-year survival in the testing group and 0.80, 0.79 and 0.82 for 1-, 3- and 5-year survival in the whole group of COAD cohort. Interestingly, the AUC remained its superiority in the GEO validation cohort, indicating a consistent, robust characterization of TPS in CRC prognosis anticipation. Also, our result revealed that TPS were not only suffice to be an independent prognostic factor, but also can coordinate with other clinical factors to improved prognostic efficacy.
The significant correlation between TPS scoring and CRC prognosis implies that TME-related genes may play a crucial role in the occurrence and progression of CRC. One of the TPS component genes, gamma-aminobutyric acid A receptor delta (GABRD), has the highest coefficient value in the signature. GABRD is a subunit of gamma-aminobutyric acid A (GABAA) receptor, a ligand-gated ion channel that belongs to the Cys-loop family of pentameric transmembrane receptors. GABRD was initially linked to generalized epilepsy with febrile seizures plus due to mutations in this gene. 21 Additionally, more studies have suggested the potential role of GABRD in other psychological diseases including childhood-onset mood disorders and stress-related behaviors.22,23 Intriguingly, a series of recent studies unraveled the hidden link between GABRD and cancers, with a pan-cancer study has reported that GABRD was one of the most up-regulated genes in human tumors. 24 However, the prognostic ability of GABRD varies across different types of tumors, with increased expression being associated with advanced hepatocellular carcinoma, but negatively associated with outcomes in CRC patients. 25 To note, Liu and Fang have first reported the prognostic value of GABRD in CRC out of a co-expressed gene where increased expression was found to be positively correlated with poor prognosis in human CRC. The top regulated pathways including kinase networks and G2 checkpoint kinases, which mainly control the cell cycle. 26 Another TPS component gene, Gene Collagen Type IV Alpha 5 (COL4A5) encodes the α5 chains of Collagen IV protein is widely known to be involved in a series of kidney disorders, such as Alport syndrome and IgA glomerulonephritis. 27 Pathological variation of COL4A5 causes inherited kidney disease characterized by hematuria, segmental glomerulosclerosis and progressive kidney failure.28–30 In gastric cancer, those collagen family genes involved in the tumor enlargement by changing the structure and the composition of the ECM. 31 Moreover, some of the other TPS component genes, such as KLHDC8A, SEPTIN1 and SPRYD4, have been implicated in other human malignancies, including glioma, liver cancer, and oral cancer, indicating their potential role in tumor biology.32–34 Septin family of GTPase are required for cytokinesis and the maintenance of the cellular morphology.35,36 FRMD3 encoded a single pass membrane protein, and is prognostic for worse survival in rectal cancer patients treated with CCRT (concurrent chemoradiotherapy) NOTCH is one of the top FRMD3-inteacrting proteins, which significantly promotes cancer stemness. 37 KLHDC8A bound chaperonin-containing TCP1 (CCT) to promote the assembly of primary cilia to activate hedgehog signaling through master transcriptional regulator SOX2. 38 IPO8 encoded nuclear transporter protein binds to the nuclear pore complex and, along with RanGTP and RANBP1, inhibits the GAP stimulation of the Ran GTPase. 38 Altogether, while there is limited evidence, the TPS-genes involved in kinases regulations, composition changes in ECM and self-renewal features through stemness pathways, providing a valuable basis for gaining a deeper understanding of CRC in the future.
In order to elucidate the molecular mechanisms underlying TPS, we examined the biological changes between different risk subgroups. Our findings revealed that multiple biological features were significantly enhanced in the high-risk subgroup, many of which are strongly correlated with tumor progression. These features include DNA replication, ECM receptor interaction epithelial mesenchymal transition and KRAS signaling. Additionally, ssGSEA analysis showed that infiltration of immune cells including gamma-delta T cell, myeloid-derived suppressor cell (MDSCs), macrophage, mast cell, natural killer cell, regulatory T cell, helper T cell was substantially elevated in TPS high-risk group. Consistently, the result from ESTIMATE algorithm where immune score and stromal score were elevated in the high-risk group, further supports our findings. It is plausible to suggest that the TPS genes are implicated in driving changes in biological functions and pathways. For instance, in the high-risk group, enriched biological processes such as DNA replication and epithelial-mesenchymal transition may exhibit correlations with genes like PI4K2B and COL4A5. Conversely, pathways related to metabolic shifts in the low-risk group could potentially be associated with genes such as SEPTIN1 and KLHDC8A. These observations hint at a potential link between the TPS genes and the underlying biological mechanisms influencing distinct risk groups in CRC.
To sum up, our results provide valuable insights into the distinct biological patterns underlying TPS risk subgroups. Also, it is possible that immune blockade therapy may be more effective for the CRC population with TPS high risk due to generally enhanced immune infiltration. However, large scale clinical trials would be necessary in the future to confirm our conclusion.
In this study, we investigated potential therapeutic agents that could be targeted to specific risk subgroups of CRC patients, as defined by the TPS classifier. We utilized publicly available drug databases, CTRP and GDSC, to identify the top 10 drugs for each risk subgroup. According to our result, CAY10618, also known as GPP78 was the most effective agent for TPS high-risk patients from CTRP. CAY10618 is a Nicotinamide phosphoribosyltransferase (Nampt) inhibitor that depletes nicotinamide adenine dinucleotide (NAD). 39 Previous studies showed CAY10618 exhibited anti-cancer, anti-inflammation and pro-autophagy effects to neuroblastoma and coloreactal cancer cell lines.40,41 However, no in vivo data or clinical study have been conducted to investigate the effect of CAY10618 on human cancer. In contrast, the classical chemotherapy agent and immune suppressant Methotrexate (MTX) was identified as an effective drug for the low-risk CRC patient. Although MTX is widely used in malignancies including coloreactal cancer, leukemia, lung cancer and lymphoma, it is much less commonly used than the other anti-metabolic agent 5-Fluorouracil and its administration in CRC requires more high-level clinical evidence in the future.
From the GDSC database, we found that novel agent JAK-8517 was the most effective drug for TPS high-risk patients. while the rest drugs exhibited insignificant predicted effective. JAK-8517 is a tyrosine kinase inhibitor that targets both JAK1 and JAK2 and has been shown to effectively block the JAK/STAT signaling pathway in cancer cell lines.42–44 JAK-8517 is a JAK/STAT3 inhibitor and many studies have shown this could be good target for treating CRCs patients. 45 Also, many ongoing clinical trails targeting JAK/STAT in CRC patients including Itacitinib (NCT02646748), STAT inhibitors (NCT03647839, NCT02983578), Ruxolitinib (NCT03681561). Similarly, AZD1332 is a specific inhibitor of TrkA, B, and C (TRK/ NTRK family), have been experimentally shown great efficacy in pancreatic cancer. 46 Clinically FDA has recently approved larotrectinib (Vitrakvi) for the treatment of patients with solid tumors affected by NTRK gene fusions. 16% of samples from CRC patients present NTRK gene rearrangements along with high microsatellite instability, suggesting that these patients may benefit from AZD1332.47,48 However, the function and mechanism of this new chemicals on human cancer have not yet explored at the moment. For low-risk CRC patients, docetaxel was selected as effective agent. Docetaxel is a microtubule depolymerization and a classic antineoplastic drug that widely used as chemotherapy in coloreactal cancer, prostate cancer, and lung cancer. Disappointingly, docetaxel failed in treating colorectal carcinoma with only little activity but considerable toxicity in a series of early clinical studies.49,50 Despite this, the potentiality of docetaxel in CRC treatment has not been underestimated. In a phase 2 clinical study, docetaxel was combined with gemcitabine and applied in patients with metastatic colorectal. adenocarcinoma with a methylated checkpoint with fork-head and ring finger domain promoter and microsatellite instability phenotype. 51 Although the study did not achieve a positive conclusion due to poor enrollment and early termination, the attempt of using novel drug on specific subgroup of CRC patient might shed new light on the future.
Interestingly, this study illustrates that for target therapy, effective drugs are more likely to be specialized for low-risk patients defined by the TPS, while immunotherapy might be a promising method for high-risk patients due to their soaring immune activation.
Conclusion
In summary, the goal of this study was to establish a molecular signature for CRC that could predict the prognosis and aid in personized therapy. Publicly available CRC cohorts were utilized to partition patients into two clusters based on their TME environment, which led to the development of the TPS prognostic classifier using machine learning techniques. Multiple approaches were employed to validate the efficacy of the TPS classifier, both alone and in combination with other clinical factors. The study also examined the differences in biological and immune characteristics between high-risk and low-risk subgroups as identified by TPS. Finally, potential drugs were identified for each subgroup. The findings suggest that low-risk CRC patients may benefit more from chemotherapy or targeted therapy, while high-risk patients may be more responsive to immunotherapy. However, further laboratory research is needed before these findings can be translated into clinical practice.
Supplemental Material
sj-docx-1-cbm-10.3233_CBM-240110 - Supplemental material for Tumor immune microenvironment of colorectal cancer identifies novel prognostic signature and potential therapeutic drugs
Supplemental material, sj-docx-1-cbm-10.3233_CBM-240110 for Tumor immune microenvironment of colorectal cancer identifies novel prognostic signature and potential therapeutic drugs by Weijie Fu , Yunhan Gao, Zhenhai Chen and Song Hu in Cancer Biomarkers
Footnotes
Ethics approval and consent to participate
All human data used in the study was obtained from public databases.
Author contributions
Weijie Fu and Yunhan Gao performed collection and assembly of data. Song Hu and Zhenhai Chen performed conception and design. Weijie Fu performed data analysis and interpretation. Song Hu provided administrative support. All authors collectively performed manuscript writing and final approval of manuscript.
Conflicts of interest statement
The authors disclose no conflict of interests.
Availability of data and material
The data set used in the study was accessed from the TCGA CDC data portal (http://portal.gdc.cacner.gov/repository) and Cbioportal (http://cbioportal.org). Drug sensitivity data on human CCLs were acquired from Cancer Therapeutics Response Portal (http://portals.broadinstitute.org/ctrp) and Genomics of Drug Sensitivity in Cancer, Sanger institute (![]() ).
).
Supplemental material
Supplemental material for this article is available online.