
Abstract
BACKGROUND:
Prostate cancer (PCa) and benign prostatic hyperplasia (BPH) are common male diseases whose incidence rates gradually increase with age. They seriously affect men’s physical health and quality of life. This study aimed to identify new biomarkers for the diagnosis of BPH and PCa.
METHODS:
Two datasets, GSE28204 and GSE134051 (including human PCa and BPH), were downloaded from the GEO database. The batch effect was removed for merging, and then differential gene expression analysis was conducted to identify BPH and PCa cases. The diagnostic biomarkers of BPH and PCa were further screened using machine learning and bioinformatics. ROC curves were drawn to evaluate the diagnostic accuracy of the selected biomarkers. An online website and qPCR were used to preliminarily explore the expression levels of PCa biomarkers. The correlations between the expression of biomarkers and the tumor microenvironment, tumor mutation load and immunotherapy drugs were evaluated.
RESULTS:
We identified fifteen genes (CHRDL1, DES, FLNC, GSTP1, MYL9, TGFB3, NEFH, TAGLN, SPARCL1, SYNM, TRPM8, HPN, PLA2G7, ENTPD5 and GPR160) as critical diagnostic biomarkers. After reviewing the literature on all selected biomarkers, we found few studies on the four genes CHRDL1, NEFH, TAGLN and SYNM in BPH or PCa. We defined these four genes as new potential diagnostic biomarkers (NPDBs) of BPH and PCa. All NPDBs were downregulated in PCa patients and PCa cell lines and upregulated in BPH patients and cell lines. When the immune landscape and mutation frequencies were analyzed, the results showed that the tumor microenvironment (TME), immune landscape, tumor mutation burden, and drug response were significantly correlated with NPDB expressions.
CONCLUSIONS:
We found four new diagnostic markers of BPH and PCa, which may facilitate the early diagnosis, treatment, and immunotherapeutic responses assessment and may be of major value in guiding clinical practice.
Introduction
Prostate cancer is an epithelial malignant tumor that seriously affects men’s health and quality of life. The latest global cancer statistics report shows that the incidence of prostate cancer, including all tumors, ranks fourth (7.3%), and its mortality rate ranks seventh (4.7%) [1]. Among men only, the incidence rate of prostate tumors in men is second (14.1%) only to that of lung cancer (14.3%), and the mortality rate is fifth (6.8%) [1]. Early detection and treatment can significantly improve the survival rate of patients. Benign prostatic hyperplasia (BPH) is a widespread health problem that has affected almost half of men in recent decades. Clinical BPH can be defined as bladder outlet obstruction (BOO) caused by prostate adenoma/adenoma, which may cause damage to the bladder and kidney [2]. BPH has many similarities with PCa, and according to autopsy studies, both of their incidence rates increase with age, although BPH occurs on average 15–20 years later than PCa [3]. Both require androgens to promote their growth and development, and both respond to antiandrogen treatment regimens. However, at present, BPH and PCa are still regarded as two different diseases, for which different prevention and treatment strategies are adopted. The early screening of prostate cancer mainly refers to the results of serum total prostate specific antigen (tPSA) and digital rectal examination, but these tests usually lack sensitivity and specificity and may lead to overdiagnosis [4]. PSA has long been selected as an important marker for identifying PCa patients, but it is still very difficult for clinicians to distinguish between PCa and BPH. One of the reasons is that BPH can also have elevated PSA levels [5]. Therefore, there is an urgent clinical need for a diagnostic test based on more reliable markers that can distinguish benign conditions from early malignant diseases of the prostate.
At present, there are several methods to find markers of PCa and BPH. Blood-based biomarkers and urine-based biomarkers discovered by proteomics include dihydrotestosterone, alcohol dehydrogenase isoenzyme II (ADH II), Mac-2 binding protein (Mac-2BP), survivin, Engrailed-2 (EN2), and spermine (Spm) [6, 7, 8, 9, 10, 11]. Genomic techniques are also a widely used method to find biomarkers. For example, PCA3, cadherin 3, and miR-21 were found to diagnose PCa and BPH [12, 13, 14]. Although these are possible diagnostic biomarkers for PCa and BPH, their diagnostic value is still uncertain, and more new biomarkers are needed.
A big data analytical method, bioinformatics has been widely used to screen various disease biomarkers. However, due to the large number of differential genes that can be screened out, bioinformatic methods are not amenable to focusing on specific genes, so they need to be employed in combination with other statistical methods. Machine learning (ML), a subset of artificial intelligence, learns from data to make predictions or decisions without being explicitly programmed. Bioinformatics combined with ML is one of the common means for screening biomarkers. Sun et al. used bioinformatics methods in conjunction with machine learning to discover that CDK8 is a new biomarker for chronic obstructive pulmonary disease and atmospheric fibrosis [15]. Lu et al., through various bioinformatics analyses and machine learning algorithms, identified 11 immune- and metabolism-related potential diagnostic genes [16]. Therefore, the use of bioinformatics combined with machine learning is expected to find new diagnostic markers for PCa and BPH.
In this study, two algorithms, based on bioinformatics and machine learning, were applied together to screen for new diagnostic genes for BPH and PCa. Through a literature review, we found that the functions of the four genes that were found have been rarely reported on in prostate cancer and benign prostatic hyperplasia. We confirmed that these four genes were significantly expressed at low levels in prostate cancer, were significantly related to promoter methylation modification, and affected the tumor microenvironment, tumor mutation load, and a variety of immune cells. These four genes may be used as new diagnostic markers for prostate cancer.
Materials and methods
Cell culture
The cell lines we employed were RWPE-1, BPH-1, 22Rv1, PC3, and DU145. These were all procured from the reputable Cell Bank of Type Culture Collection, an organization under the Chinese Academy of Sciences renowned for its high-quality, well-characterized cell lines. RWPE-1 is a normal human prostate epithelial cell line. BPH-1, on the other hand, is a benign prostatic hyperplasia cell line, representing noncancerous prostate cell proliferation. These two cell lines offer us a reference for normal and benign cellular behavior. In contrast, the 22Rv1, PC3, and DU145 cell lines are all derived from human prostate cancer tissues and showcase different stages and features of prostate cancer. They were cultured in a laboratory incubator maintained at a constant temperature of 37
RT-PCR and immunohistochemistry
The expression of genes was detected by RT-PCR in 22Rv1, PC3, and DU145 prostate cancer cells, and BPH-1 and RWPE-1 cells were selected as the control group. Briefly, according to the protocol, total cellular RNA was extracted from tumor tissues by a Relia-Prep
Microarray data
To screen for biomarkers for the diagnosis of BPH and PCa, two datasets, GSE28204 and GSE134051, were downloaded from the GEO website (
Screening for differentially expressed genes (DEGs)
The two datasets were merged into a metadata cohort, and the combat functions were utilized to preprocess and eliminate the batch effect. DEGs between BPH and PCa were detected by using the Limma package in R. The threshold parameters for DEGs were
Functional enrichment analysis
The differentially expressed genes screened by BPH and PCa were analyzed for Kyoto Encyclopedia of Genes and Genomes (KEGG) and Gene Ontology (GO) signal pathway enrichment using the “clusterProfiler” R package. IF the p value of a GO term or KEGG signaling pathway was less than 0.05, it was considered statistically significant. KEGG and GO bars and bubble charts were drawn with the ggplot2 package.
Screening candidate biomarkers of BPH and PCa
To screen out potential biomarkers for BPH and PCa diagnosis, we utilized LASSO regressive arithmetic and support vector machine methods. LASSO regression is a kind of compressed estimation characterized by variable selection and complexity adjustment while fitting the generalized linear model, and it can also avoid overfitting [17]. We used the “glmnet” package to complete the LASSO regressive arithmetic to screen for diagnostic biomarkers associated with BPH and PCa patients. Support vector machine recursive feature elimination (SVM-RFE) is a sequential backward selection algorithm according to the maximum interval principle of SVM [18] SVM-RFE trains the samples through the model, sorts them according to the score of each feature, and deletes the feature with the lowest score. The remaining features of the model are trained in turn, and then the next iteration is carried out to obtain the minimum number of features required for selection. We used LASSO regression and SVM-RFE to narrow the range of target genes to study from the set of differentially expressed genes to find the most reliable diagnostic biomarkers.
Immune landscape and mutation analyses
According to the expression of immune-related genes, the immune phenotype score (IPS) was calculated and divided into four categories. The IPS of PCa patients was extracted from TCIA (
The workflow of this study.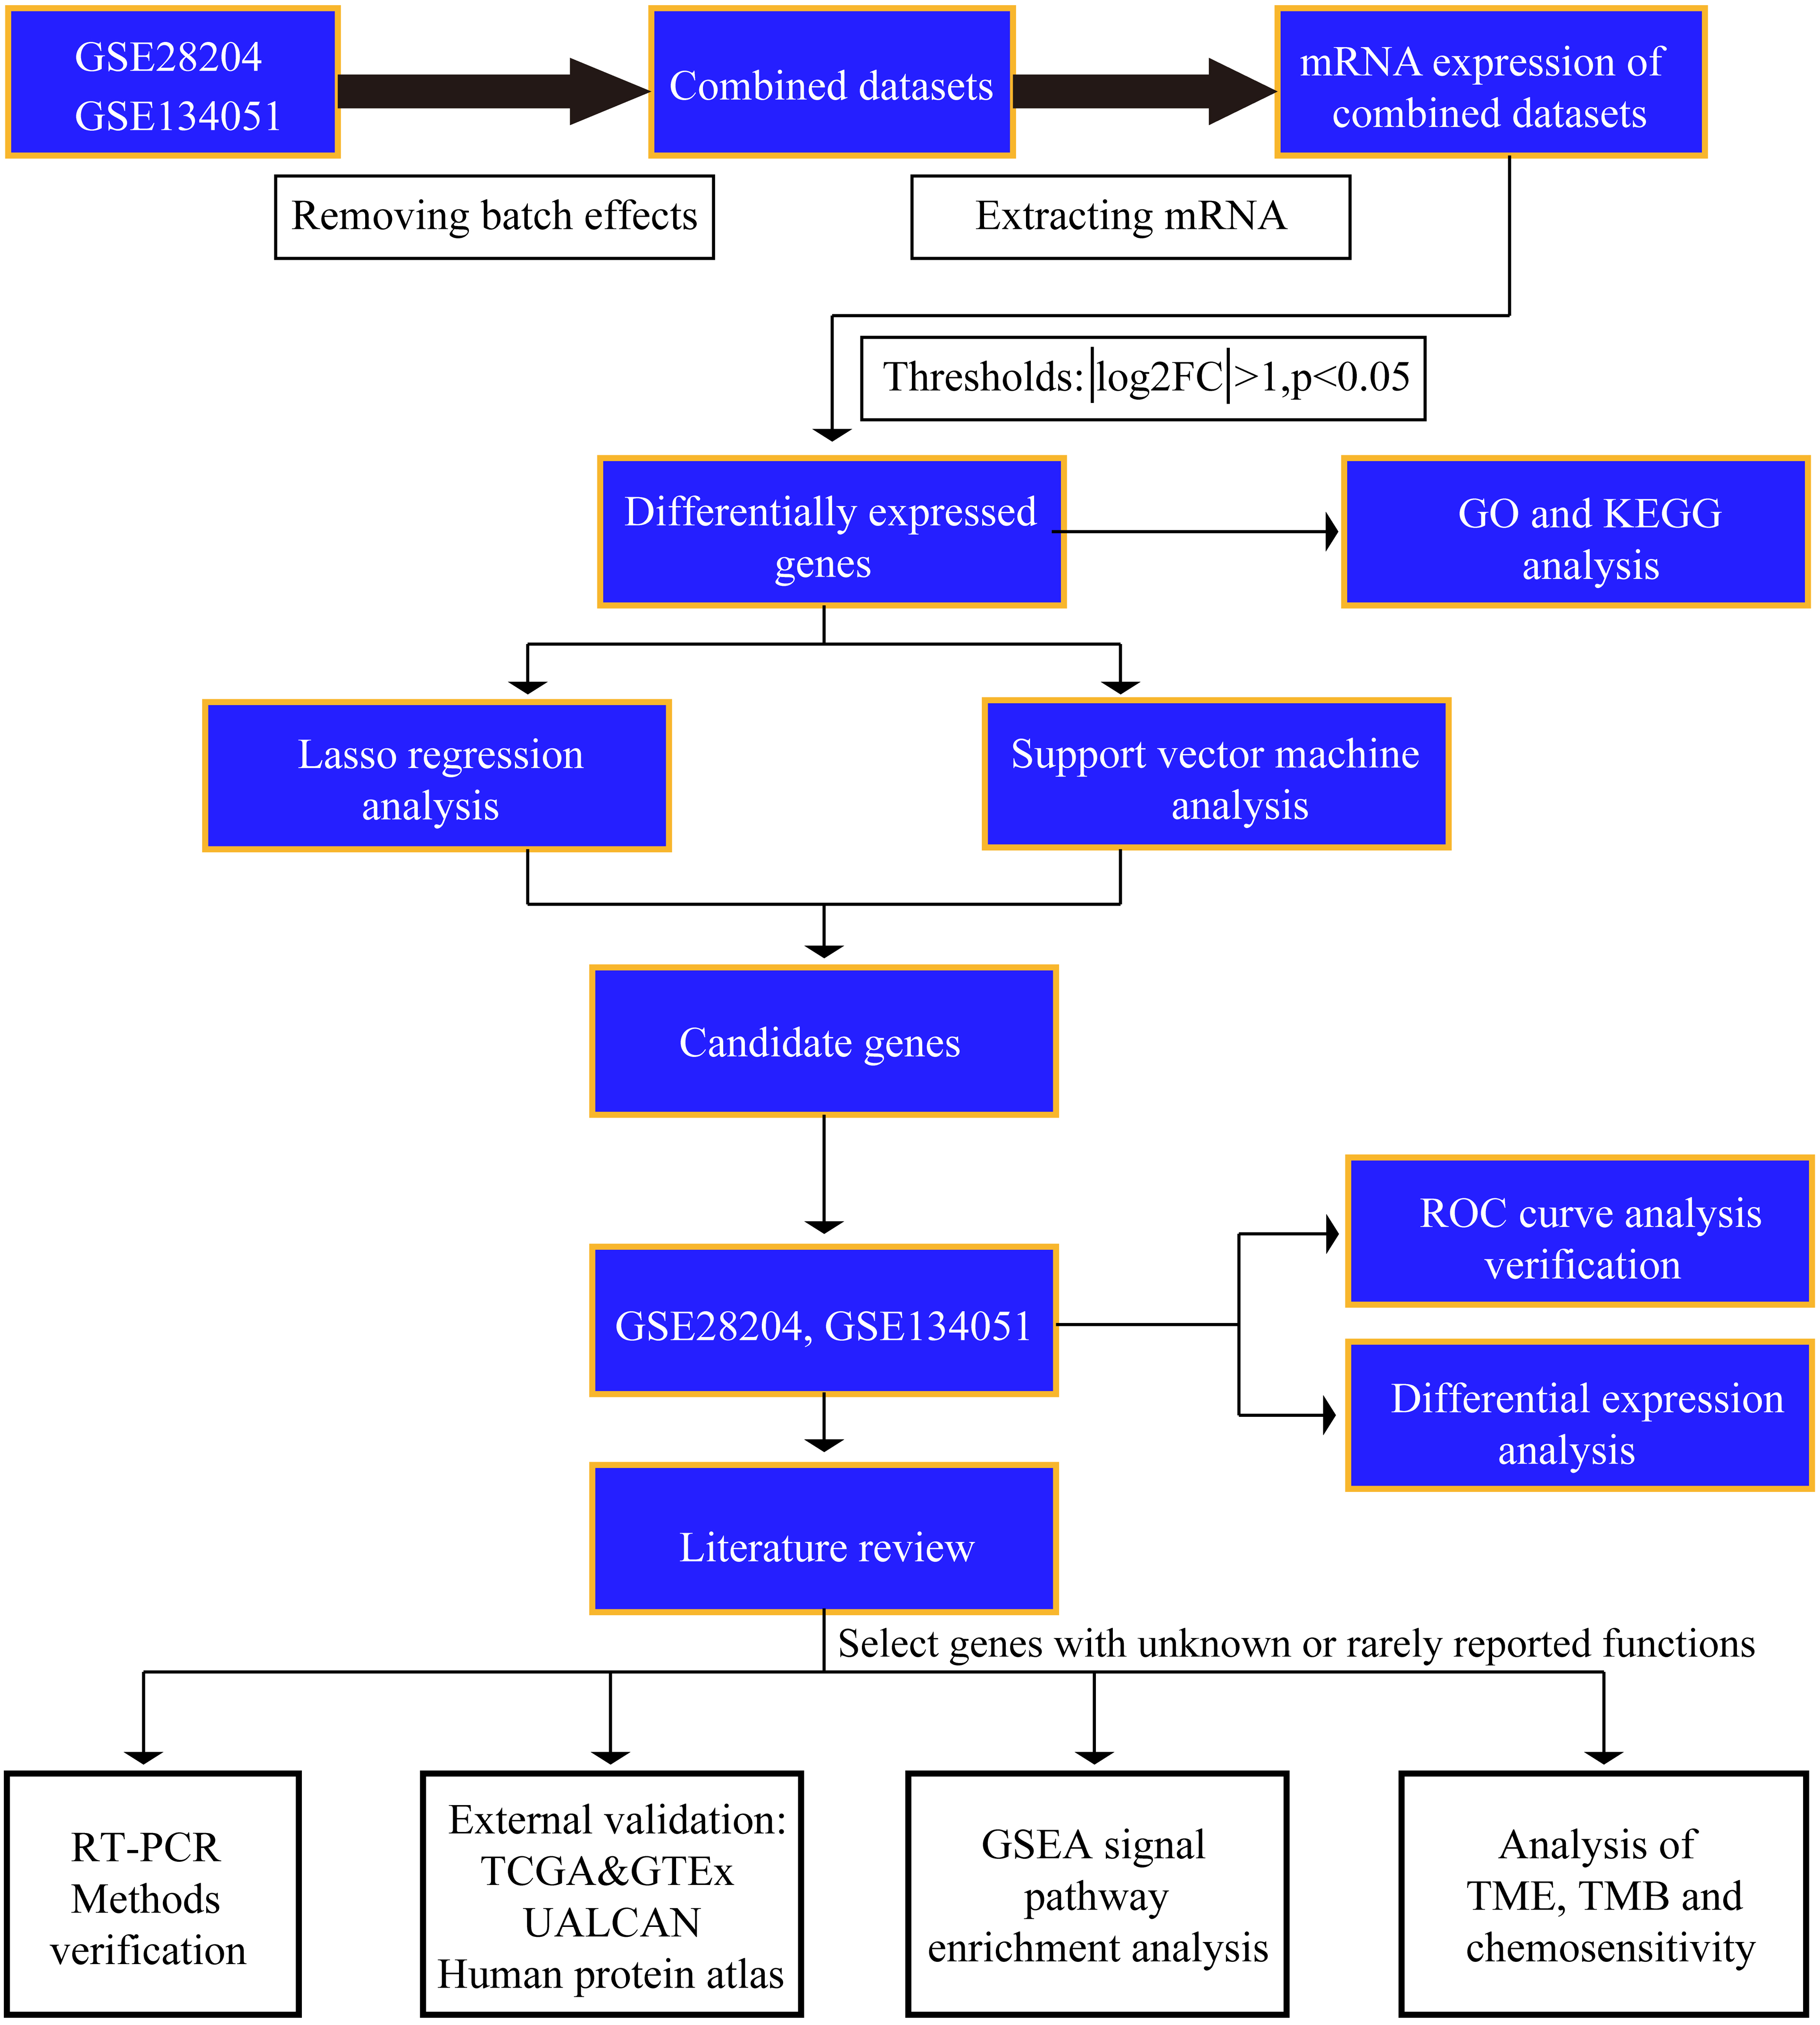
Student’s
DEGs were identified between BPH and PCa patients. (A) Heatmap of the differentially expressed genes. (B) Volcano map.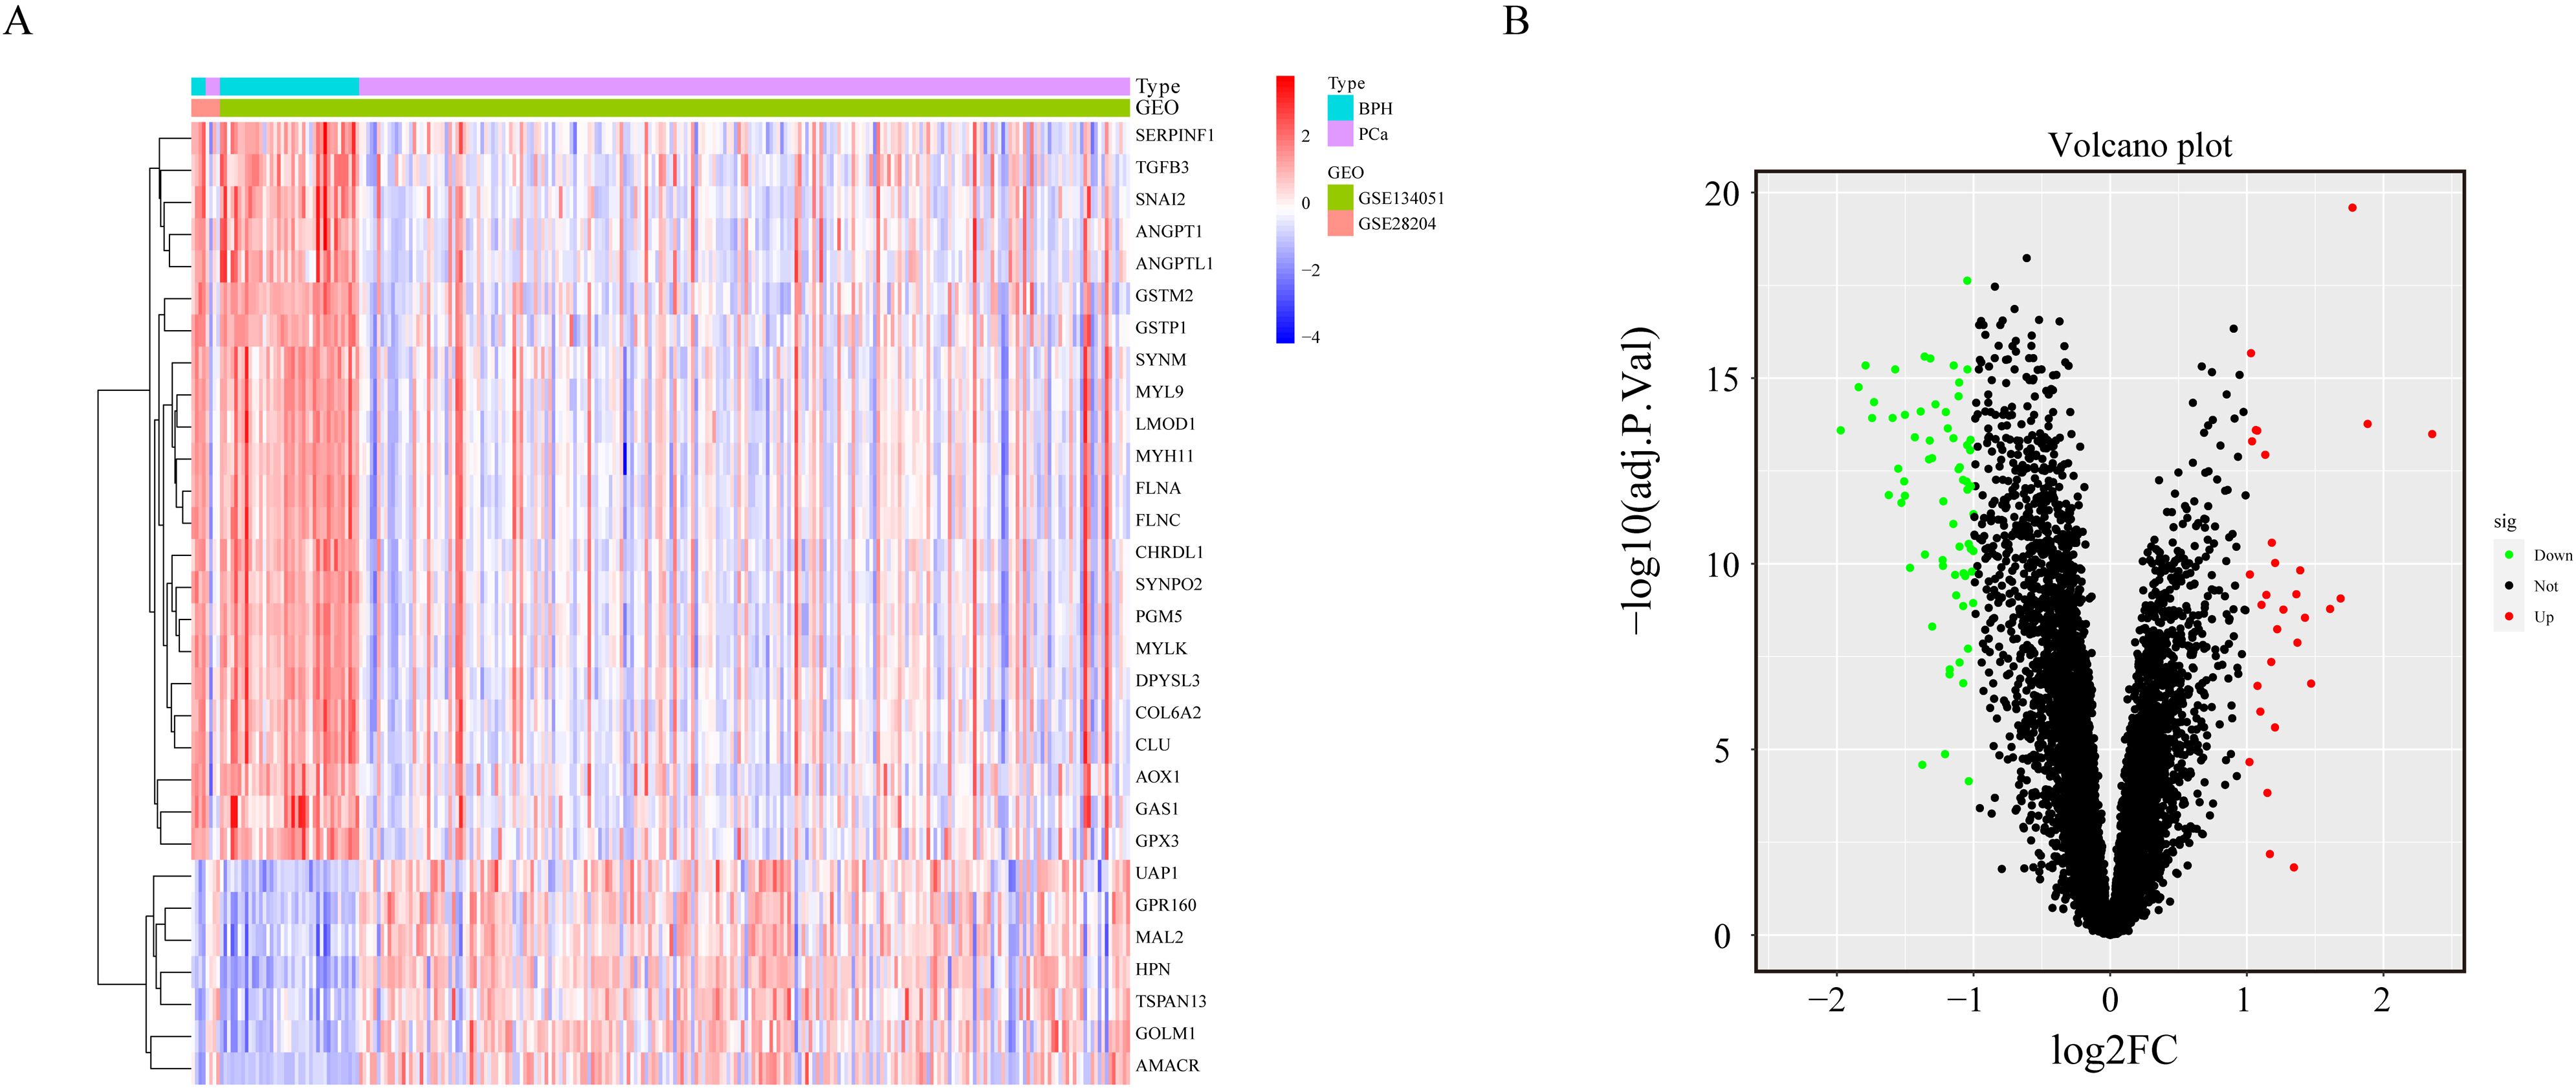
Study design and workflow overview
To make our investigation clearer, the study workflow is shown in Fig. 1. The GSE28204 and GSE134051 datasets were downloaded, and the two datasets were merged after removing the batch effect. The mRNA of the merged datasets was extracted, the threshold value (log
Determination of differentially expressed genes (DEGs)
Data from 220 PCa and 43 BPH samples from the 2 GEO datasets (GSE28204 and GSE134051) were studied in a retrospective manner. After removing the batch effect, we analyzed the DEGs of BPH and PCa samples through the SVA software package. Thirty genes were significantly upregulated in PCa patients, and 65 genes were significantly upregulated in BPH patients (Fig. 2A and B).
Functional enrichment analysis
The screen identified 95 DEGs in PCa and BPH samples, which were mainly involved in muscle system process, contractile fiber, actin binding, collagen-containing extracellular matrix, myofibrils, focal adhesion, gland development, carboxylic acid biosynthetic process, epithelial cell proliferation, reproductive structure development, receptor ligand activity, sulfur compound binding, growth factor activity, and glycosaminoglycan binding (Fig. 3A). The KEGG pathway enrichment showed that vascular smooth muscle contraction, drug metabolism-cytochrome P450, focal adhesion, complement and coagulation cascades, tryptophan metabolism, hypertrophic cardiomyopathy, the TGF-beta signaling pathway, MAPK signaling pathway, dilated cardiomyopathy and prostate cancer were significantly enriched (Fig. 3B).
Functional enrichment analysis. Signal pathway enrichment analysis based on 95 DEGs was conducted via clusterProfiler. (A) GO analysis. (B) KEGG analysis.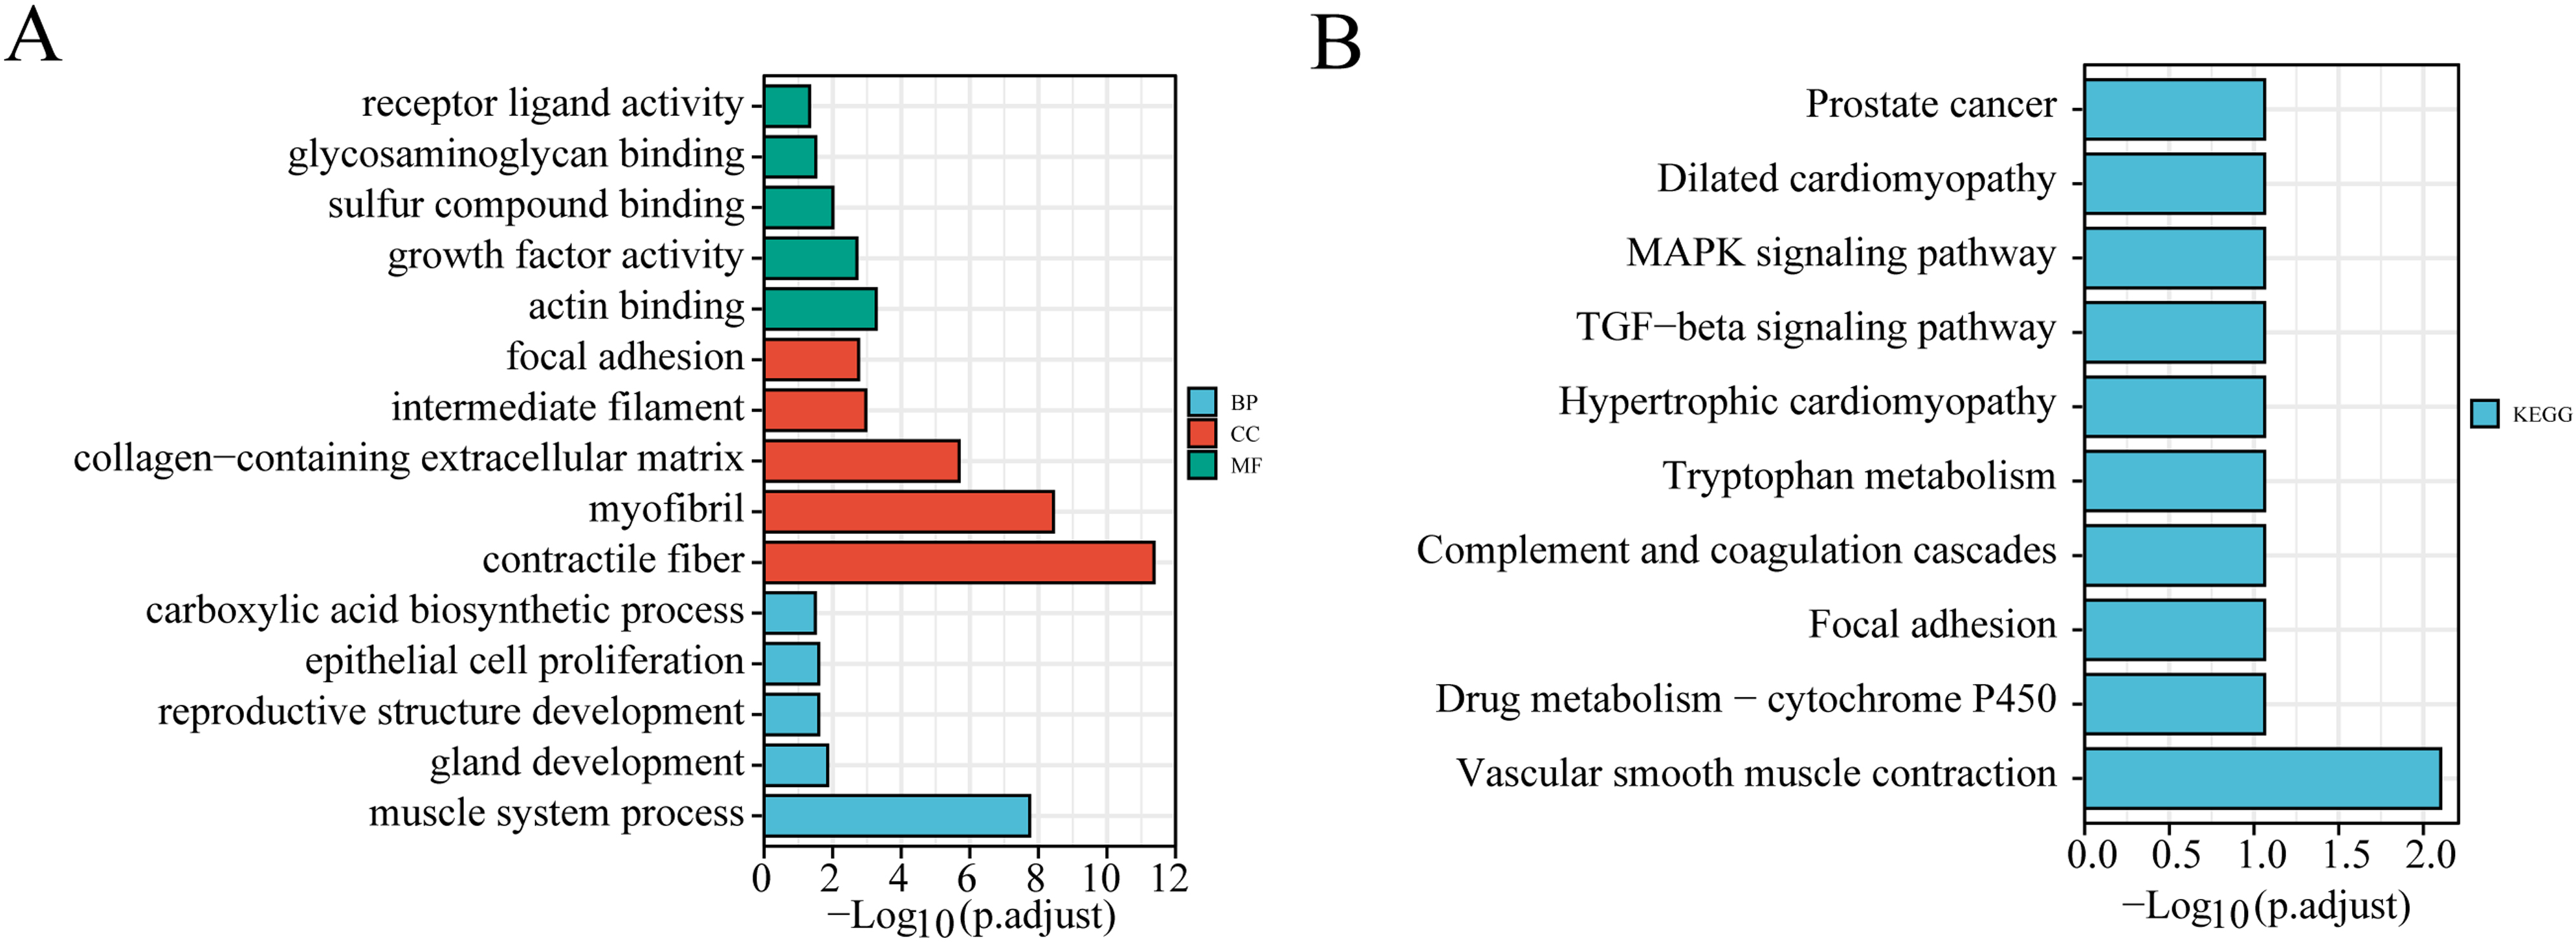
Selection of candidate genes for BPH and PCa. (A) Tenfold cross-validation results. The two vertical lines in the figure represent the minimum MSE 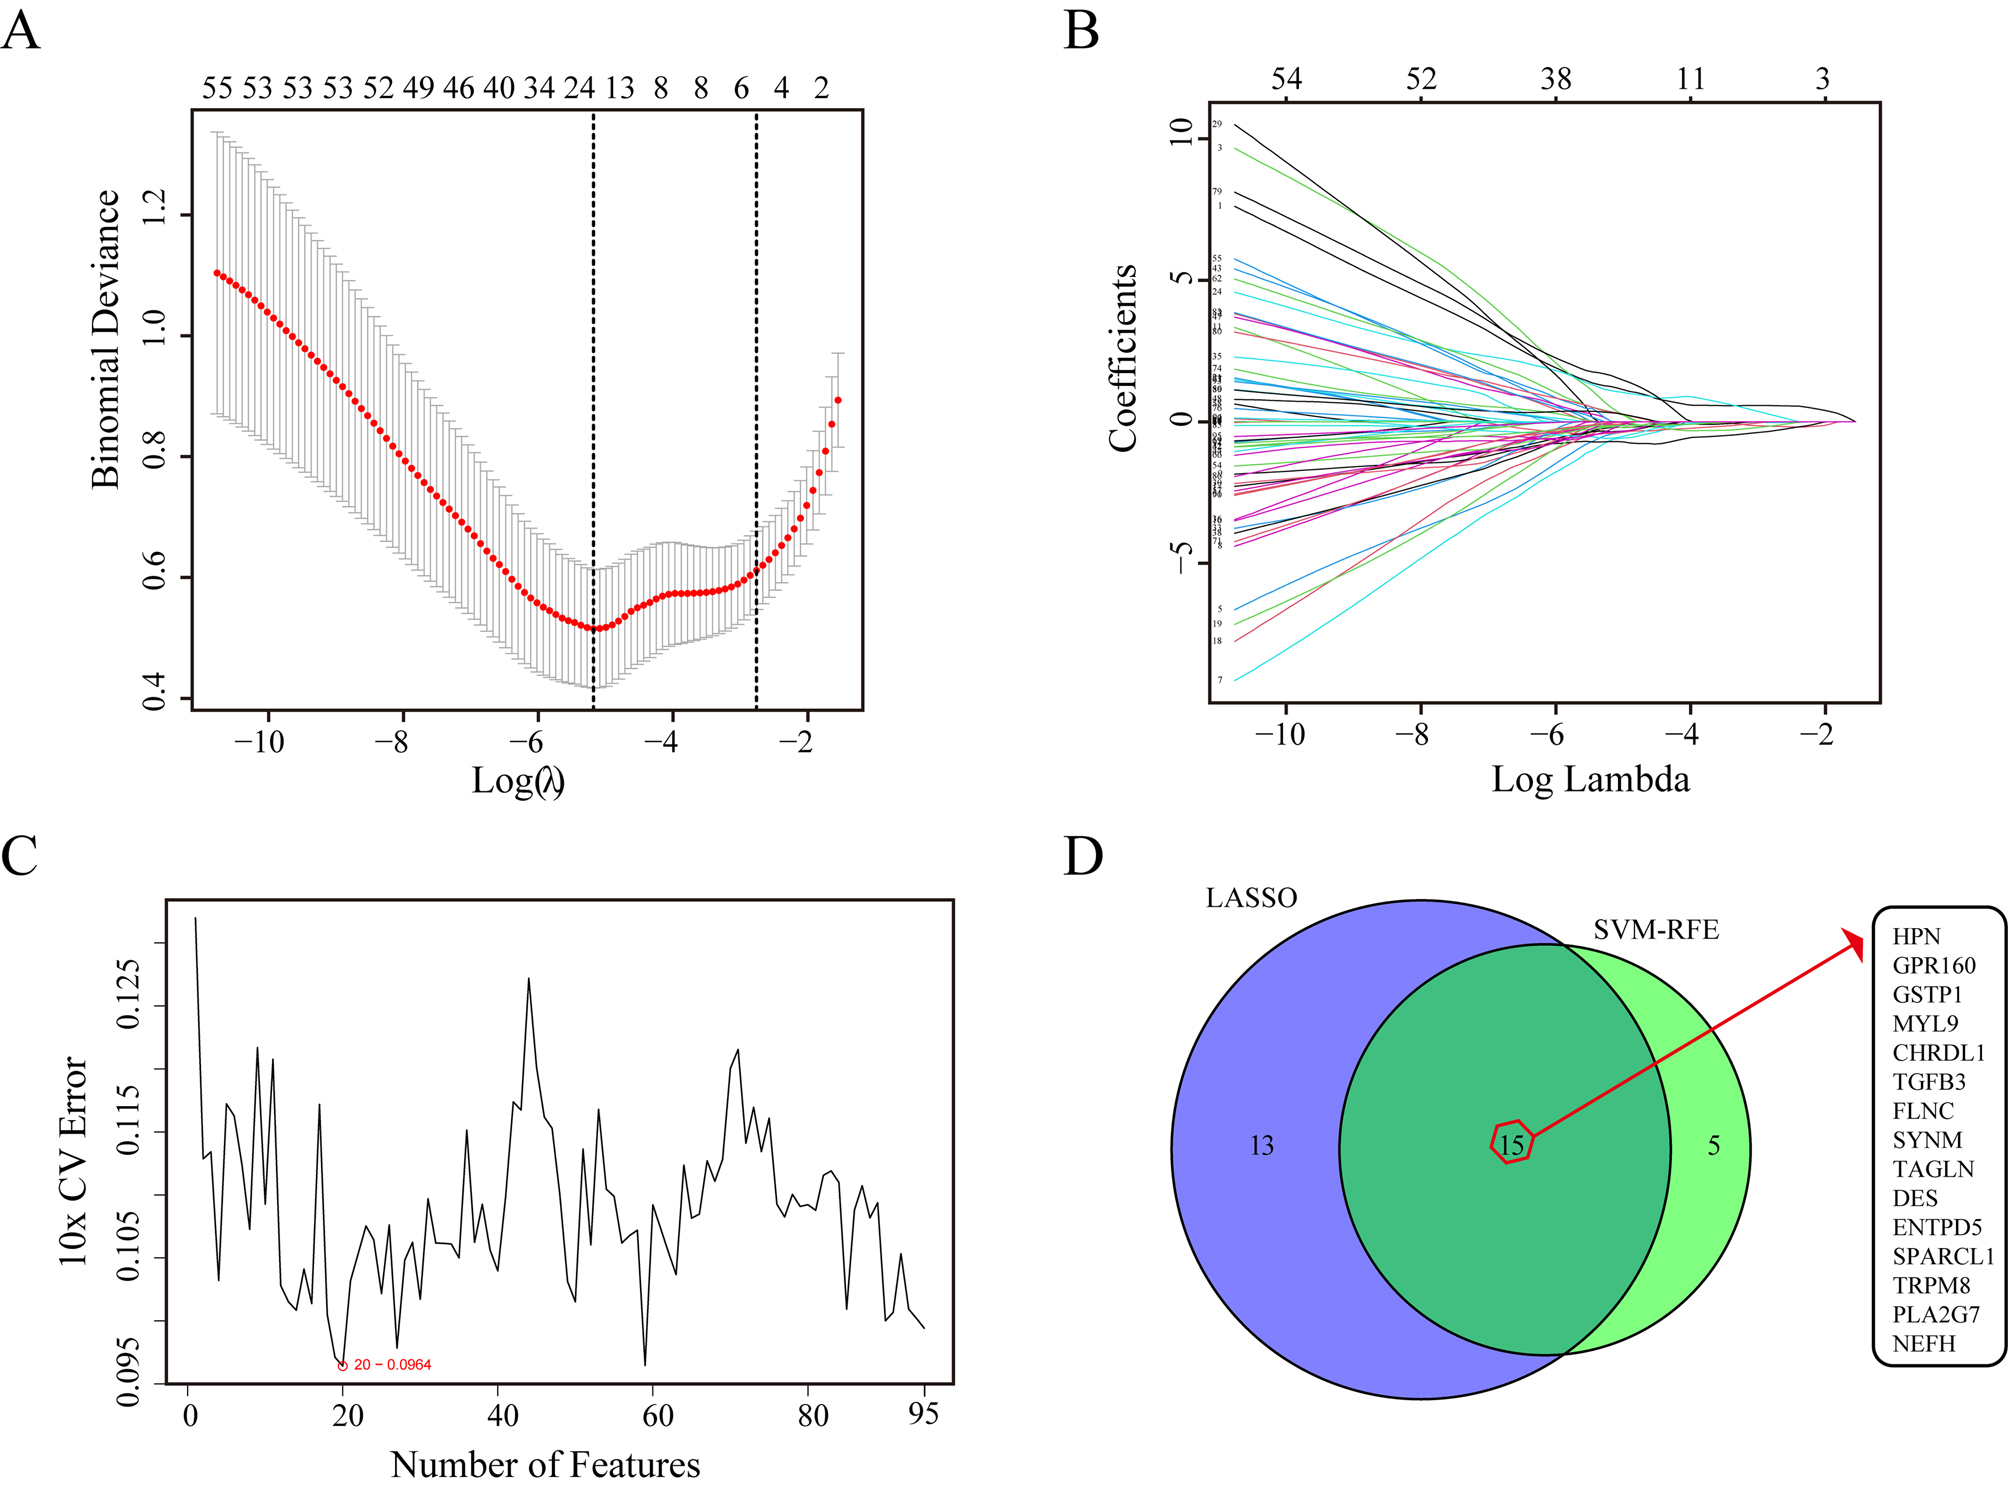
Gene expression of 15 candidate genes between BPH and PCa. (A–J) CHRDL1, DES, FLNC, GSTP1, MYL9, TGFB3, NEFH, TAGLN, SPARCL1 and SYNM were significantly upregulated in BPH samples; (K–O) TRPM8, HPN, PLA2G7, ENTPD5 and GPR160 were significantly upregulated in PCa samples.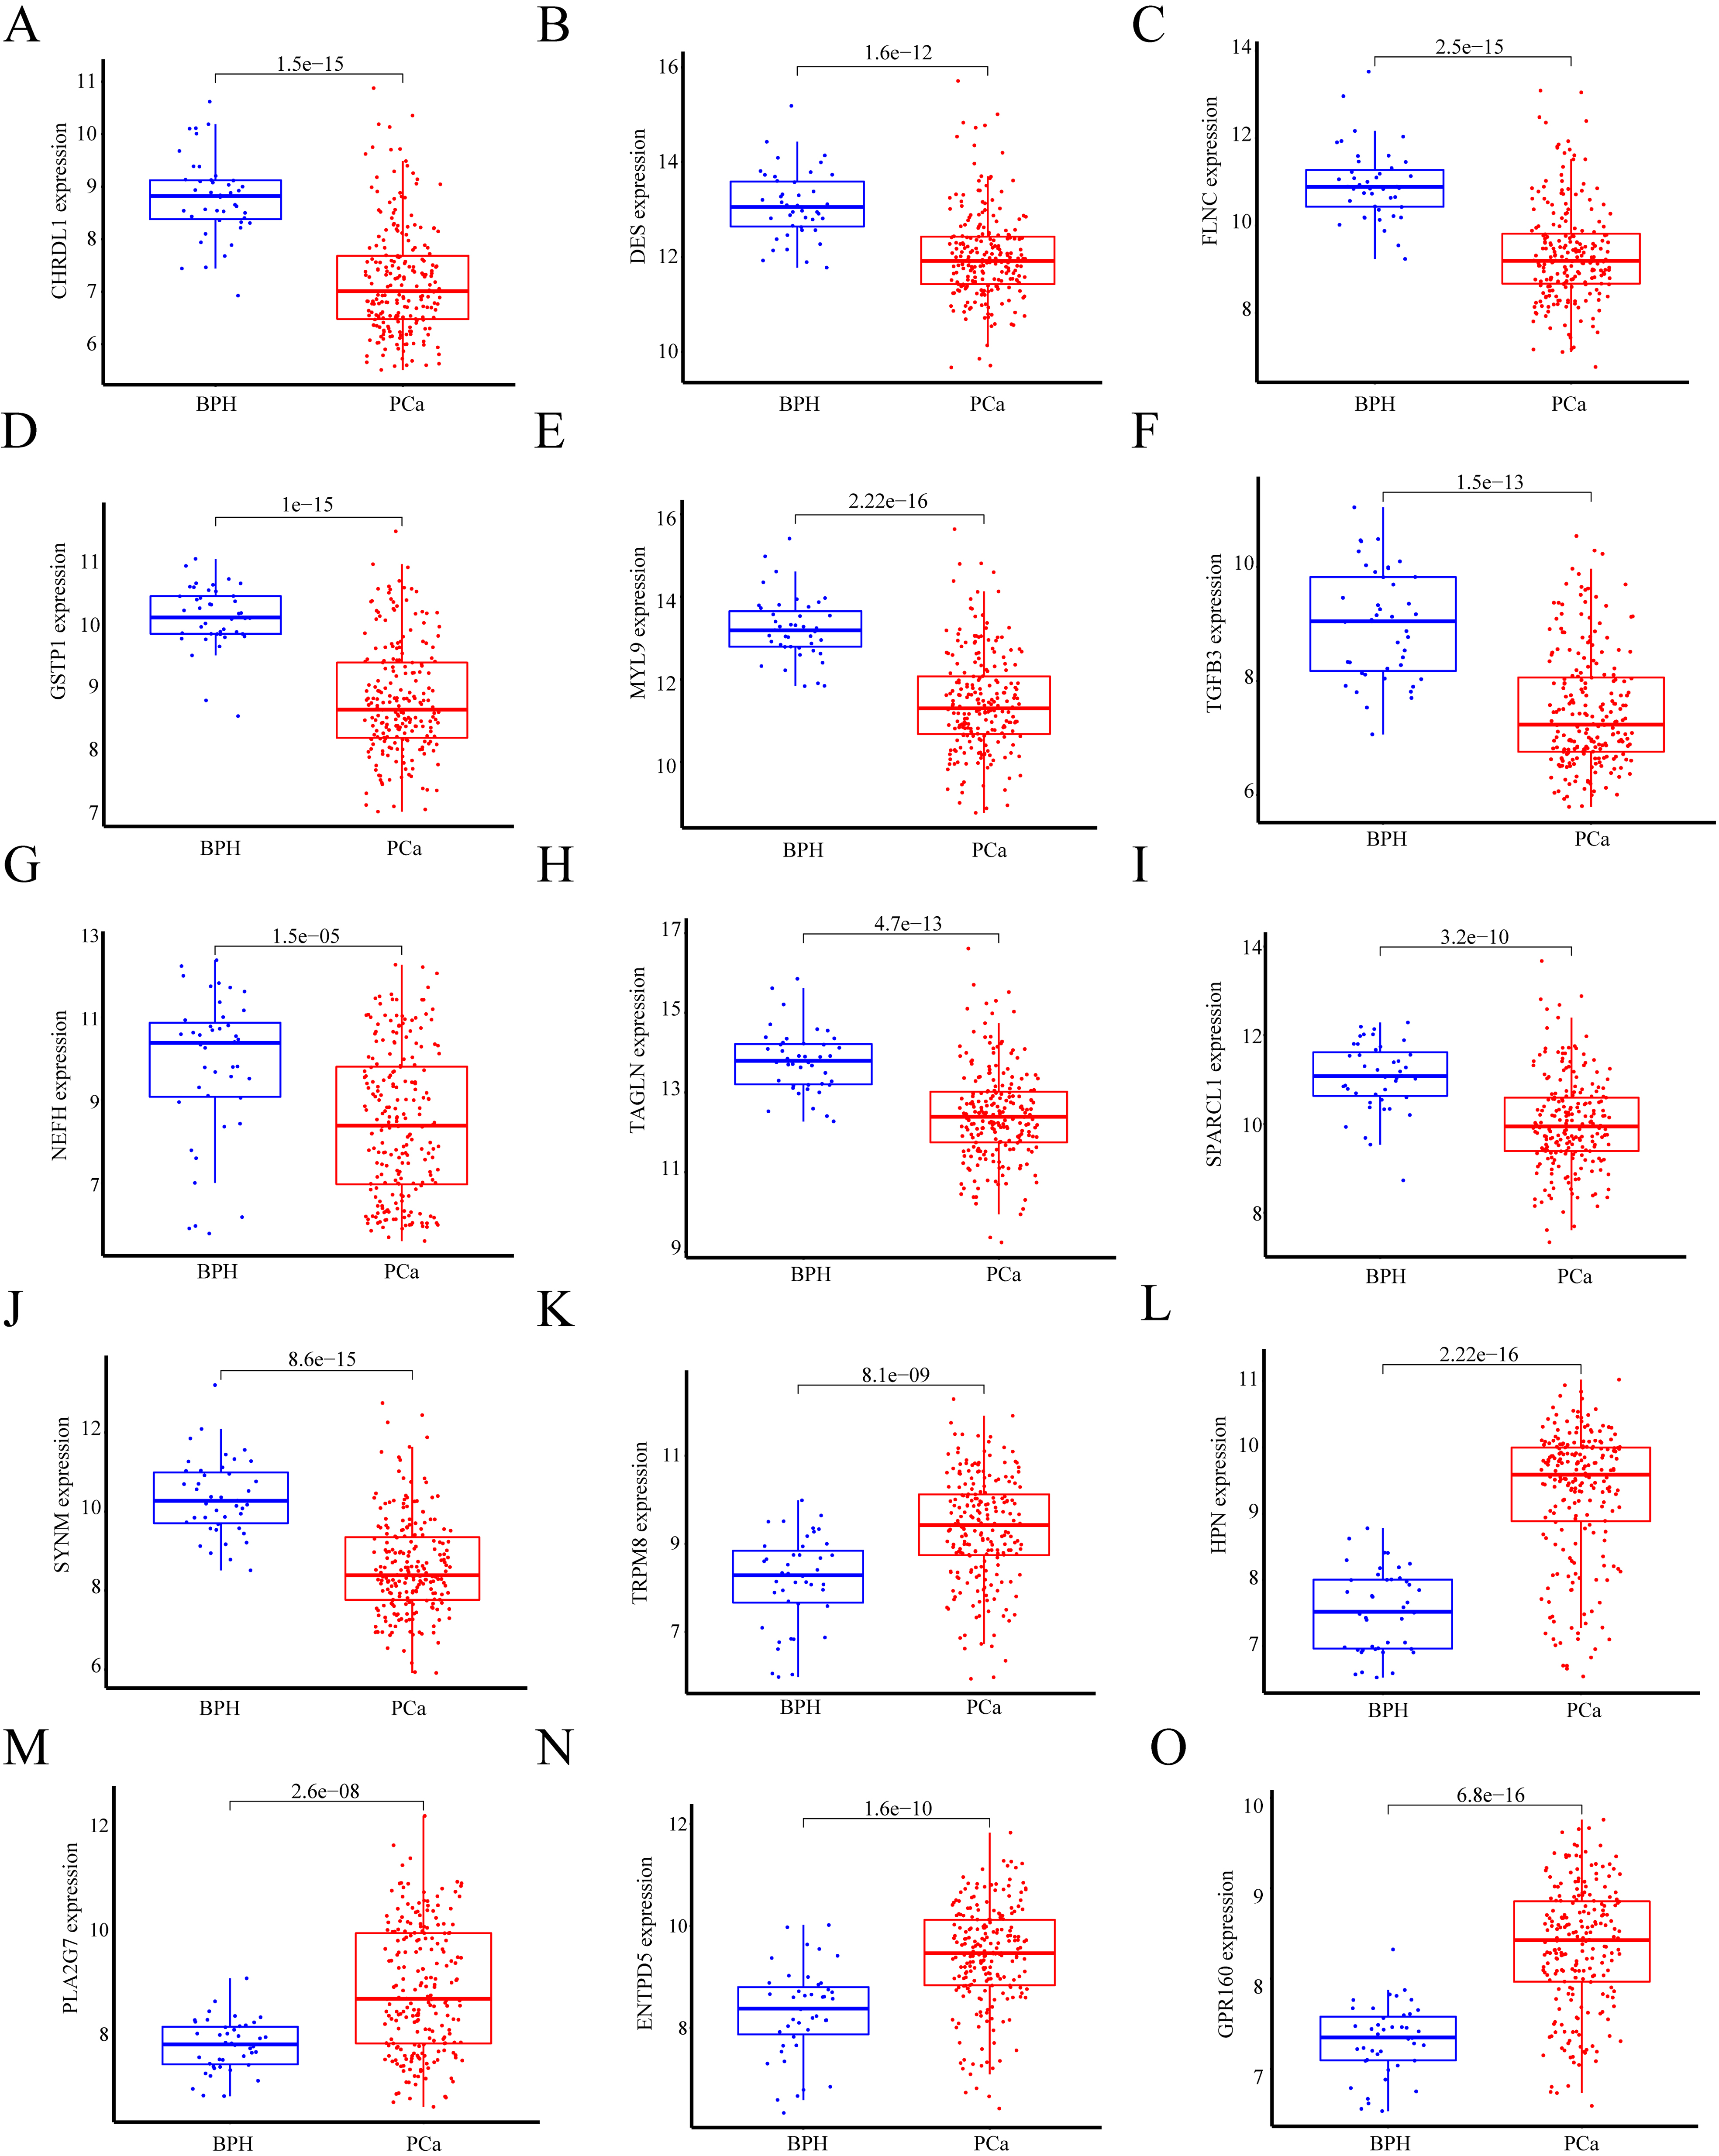
ROC assays for 15 candidate genes in BPH to PCa. (A–O) ROC curve analysis shows that all 15 diagnostic biomarkers have very high diagnostic value. The AUC and 95% CI values are displayed on each graph.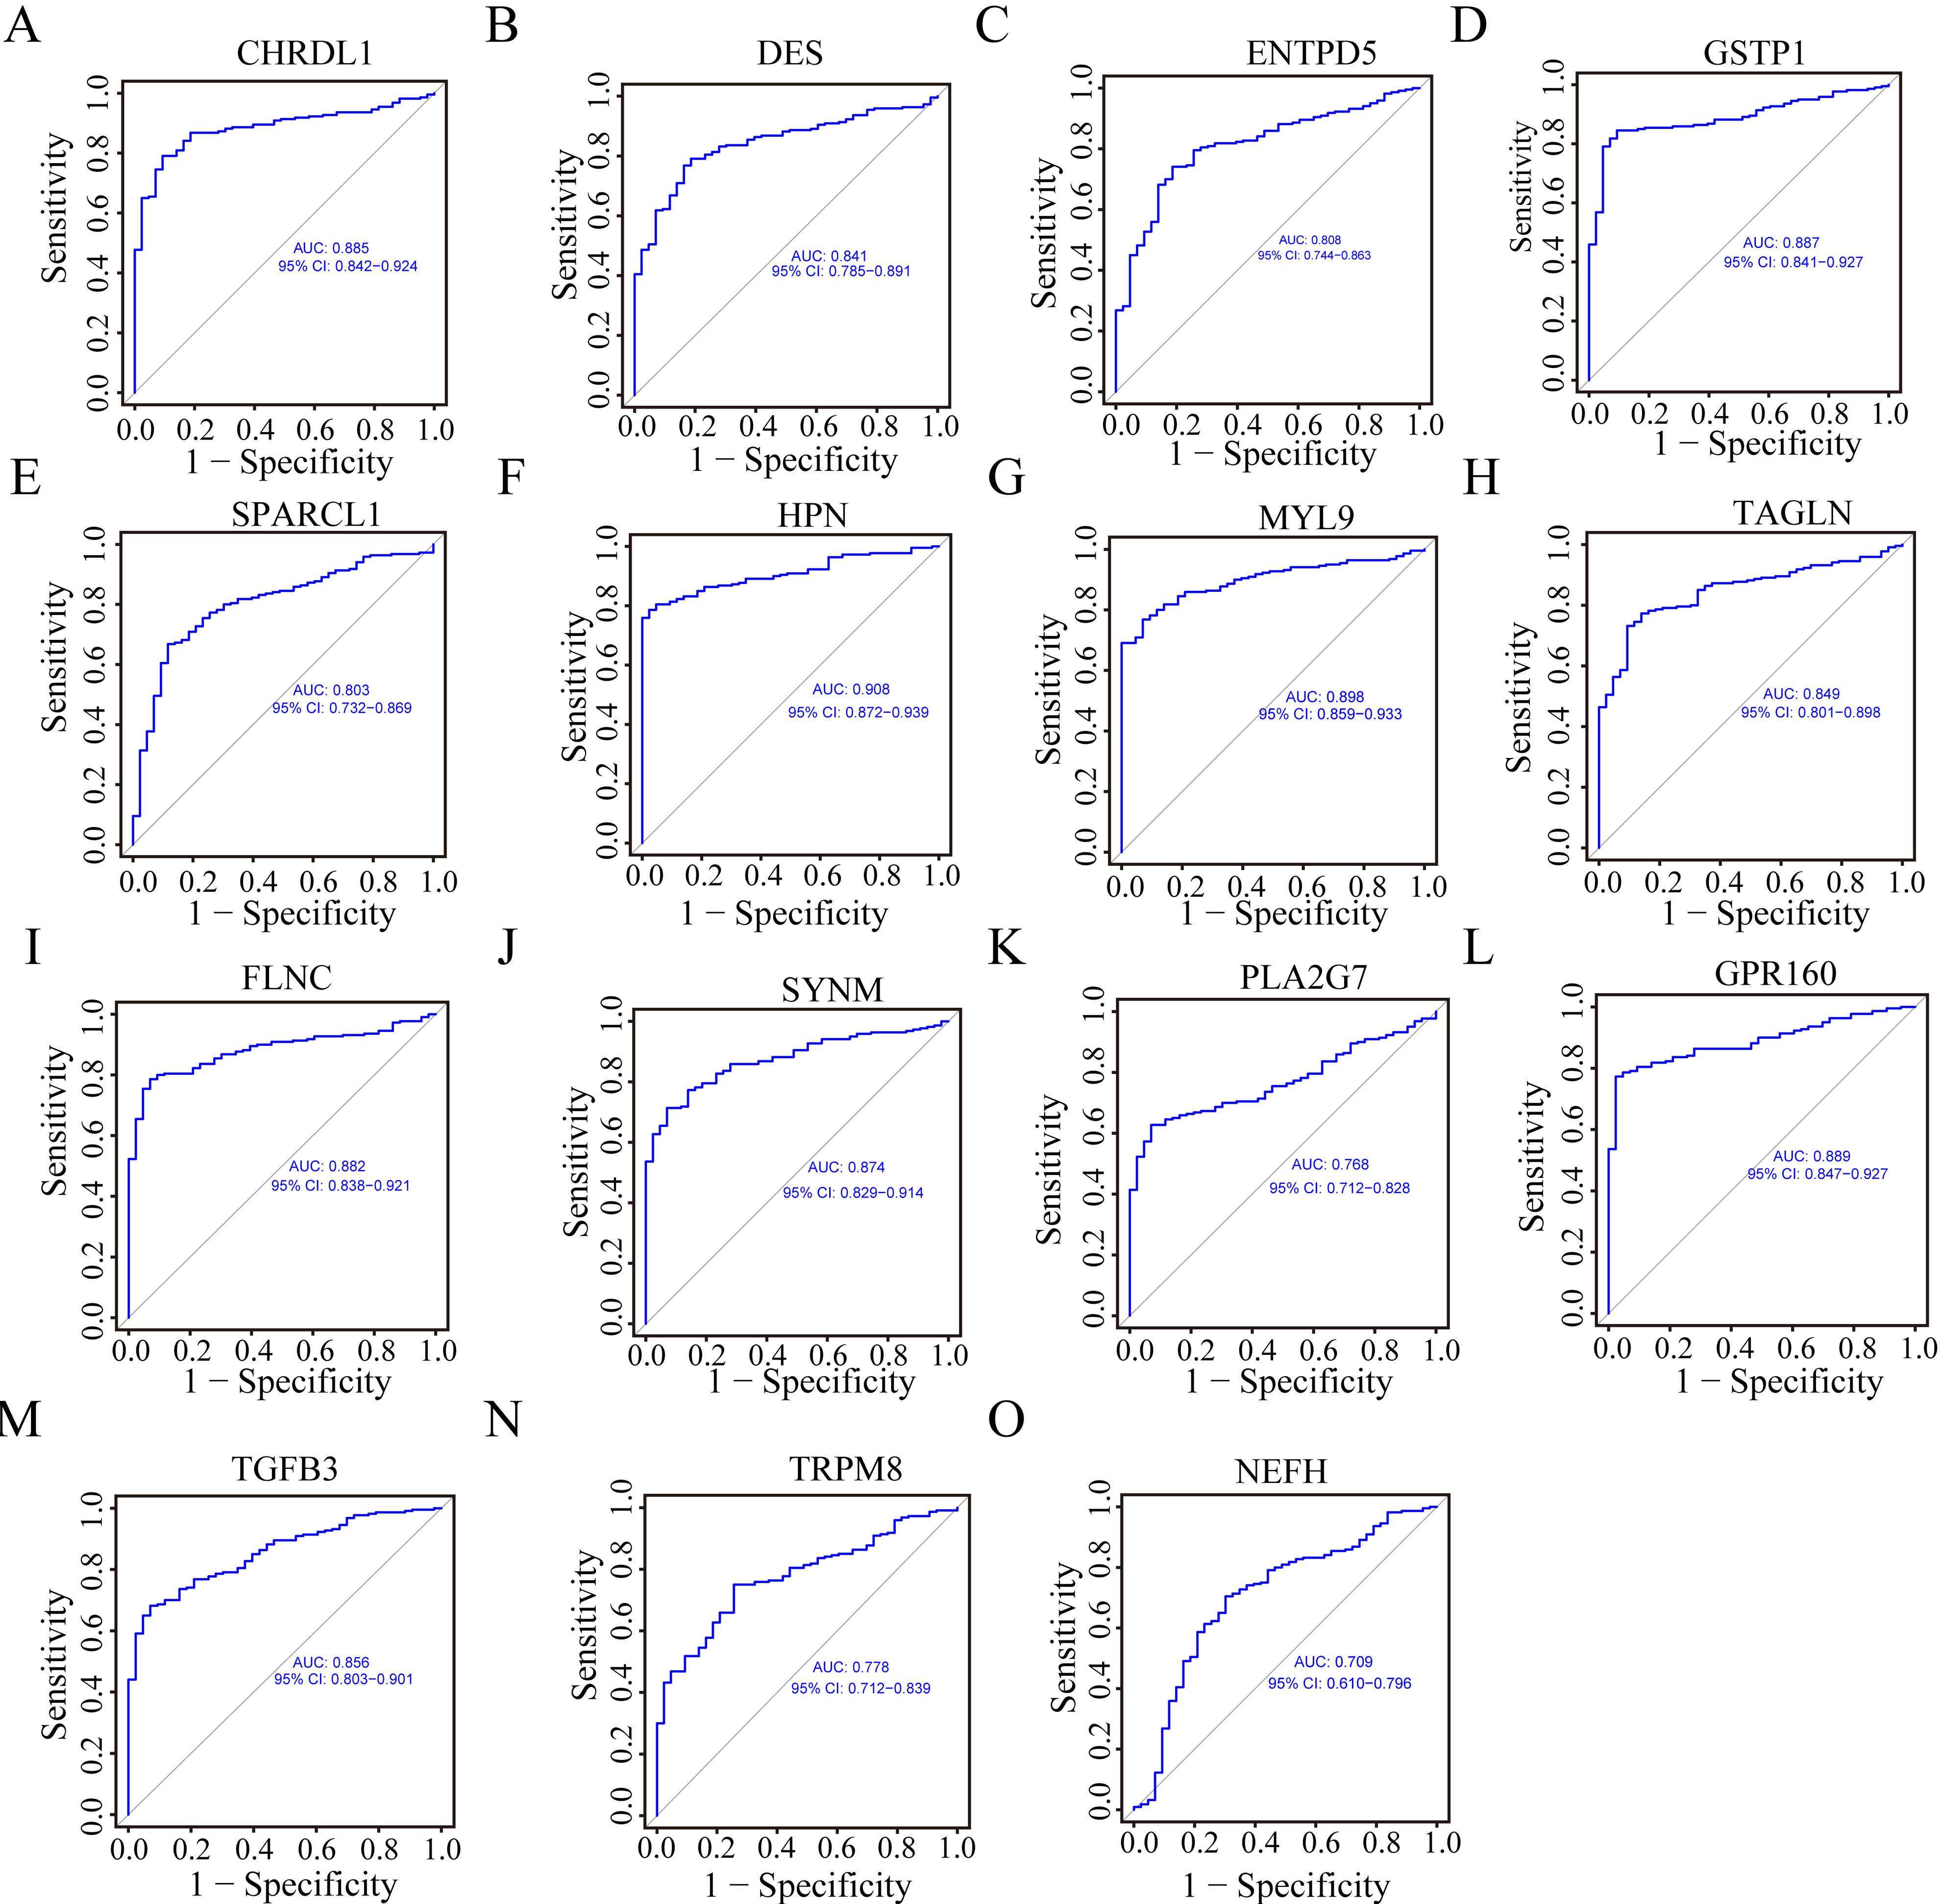
Two different algorithms were applied to the DEGs to identify the potential biomarkers of BPH and PCa. LASSO regression results showed that 28 genes may be diagnostic biomarkers of BPH and PCa (Fig. 4A and B). The SVM-RFE algorithm screened out 20 potential biomarkers of BPH and PCa (Fig. 4C). The 15 overlapping potential biomarkers between these two methods (HPN, GPR160, GSTP1, MYL9, CHRDL1, TGFB3, FLNC, SYNM, TAGLN, DES, ENTPD5, SPARCL1, TRPM8, PLA2G7 and NEFH) were chosen for study in BPH and PCa patients because they may be critical genes involved in BPH and PCa progression (Fig. 4D).
Expression and diagnostic value of 15 genes in BPH and PCa patients
We found that the expression levels of CHRDL1, DES, FLNC, GSTP1, MYL9, TGFB3, NEFH, TAGLN, SPARCL1 and SYNM were downregulated in PCa samples vs. BPH samples according to the expression data in the GEO dataset (Fig. 5A–J). TRPM8, HPN, PLA2G7, ENTPD5, and GPR160 were significantly upregulated in PCa patients and were named PCa biomarkers (Fig. 5K–O). To further explore the diagnostic value of the above 15 genes, we drew ROC curves. The ROC assays showed that all 15 genes exhibited robust diagnostic value (Fig. 6A–O, all AUCs
The roles of diagnostic biomarkers in BPH and PCa in previous literature
The roles of diagnostic biomarkers in BPH and PCa in previous literature
Through a literature review, we searched whether the diagnostic biomarkers screened out in this study have been reported and what their functions are. DES is also called diethylstilbestrol, and it is a therapeutic drug for progressive prostate cancer. The role of DES in BPH has rarely been reported in recent years. There are very few reports on the FLNC or MYL9 gene in PCa and or BPH, and only articles based on data analysis have indirectly reported the low expression of FLNC and MYL9 in PCa patients. GSTP1 CpG island hypermethylation is a molecular biomarker for PCa and clearly distinguishes BPH and limited PCa. TGFB3 has been shown to be highly expressed in BPH patients, but its role in prostate cancer has rarely been reported. SPARCL1 can inhibit PCa cell metastasis, but its role in BPH is still unclear. TRPM8, HPN, PLA2G7, ENTPD5, and GPR160 are highly expressed in prostate cancer and can be tested as antitumor targets. TRPM8 seems to be unrelated to the occurrence of BPH. HPN was found to be expressed at low levels in BPH. Other genes, such as PLA2G7, ENTPD5, and GPR160, have rarely been reported in BPH. Among the diagnostic markers screened out here, there were 4 genes, CHRDL1, NEFH, TAGLN and SYNM, whose roles in BPH and PCa have rarely been studied (Table 1).
NPDBs are significantly downregulated in PCa
After reviewing the literature on all selected biomarkers, we found few studies on the four genes CHRDL1, NEFH, TAGLN and SYNM in BPH or PCa, but they have a very high correlation with prostate disease, so they are likely to be potential new diagnostic markers of prostate cancer. We named these four genes new potential diagnostic biomarkers (NPDBs) of prostate cancer.
At the website (
All NPDBs are downregulated in prostate cancer. (A) Analysis based on the TCGA and GTEx databases shows that all NPDBs were expressed at low levels in tumor tissues. (B) Immunohistochemical results from the HPA website showed that all NPDBs were highly expressed in adjacent cancer tissues and normal tissues but had low or no expression in prostate cancer tissues. (C) RT-PCR results show that the mRNA level of each NPDB was significantly lower in prostate cancer cell lines (22Rv1, PC3, and DU145) and significantly higher in normal cells (RWPE-1) and a prostate hyperplasia cell line (BPH-1). The RT-PCR data come from at least three separate experiments.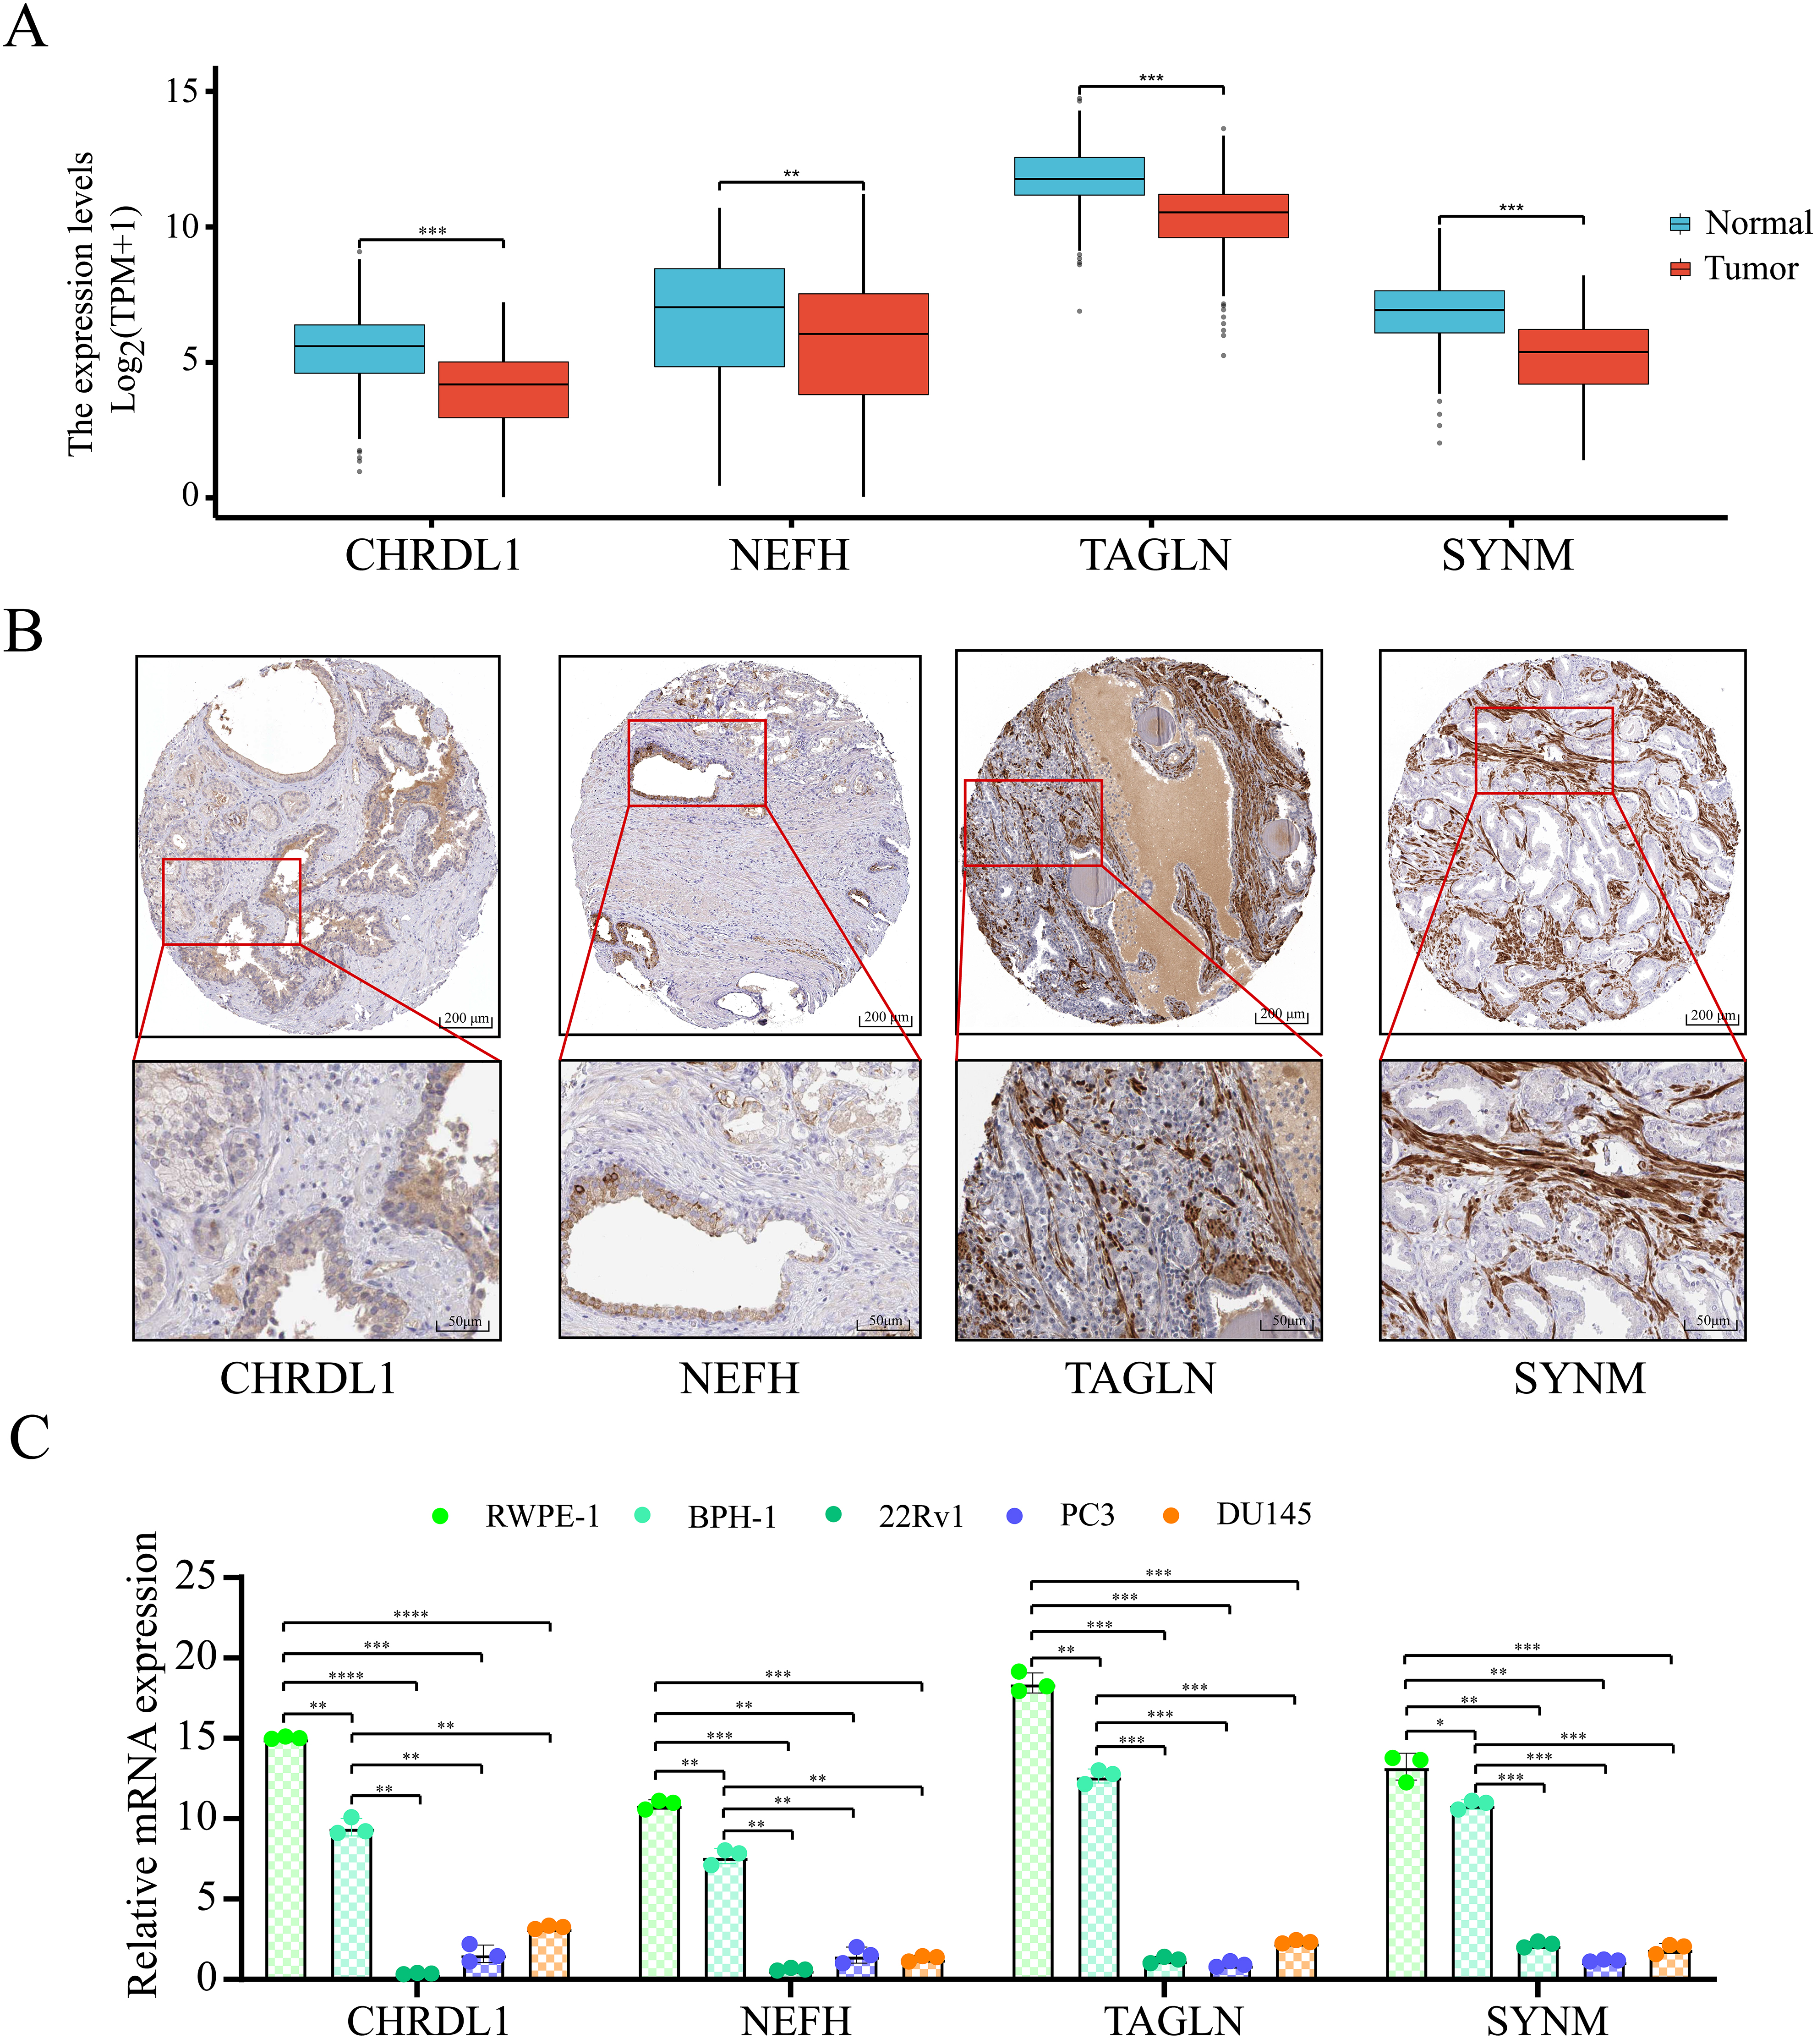
GSEA between high- and low-expression NPDBs. (A–D) Representative results of enriched hallmark terms in the two sets. (E–H) Comparing the tumor group with the normal group, we found that the promoter methylation of all NPDBs was significantly different.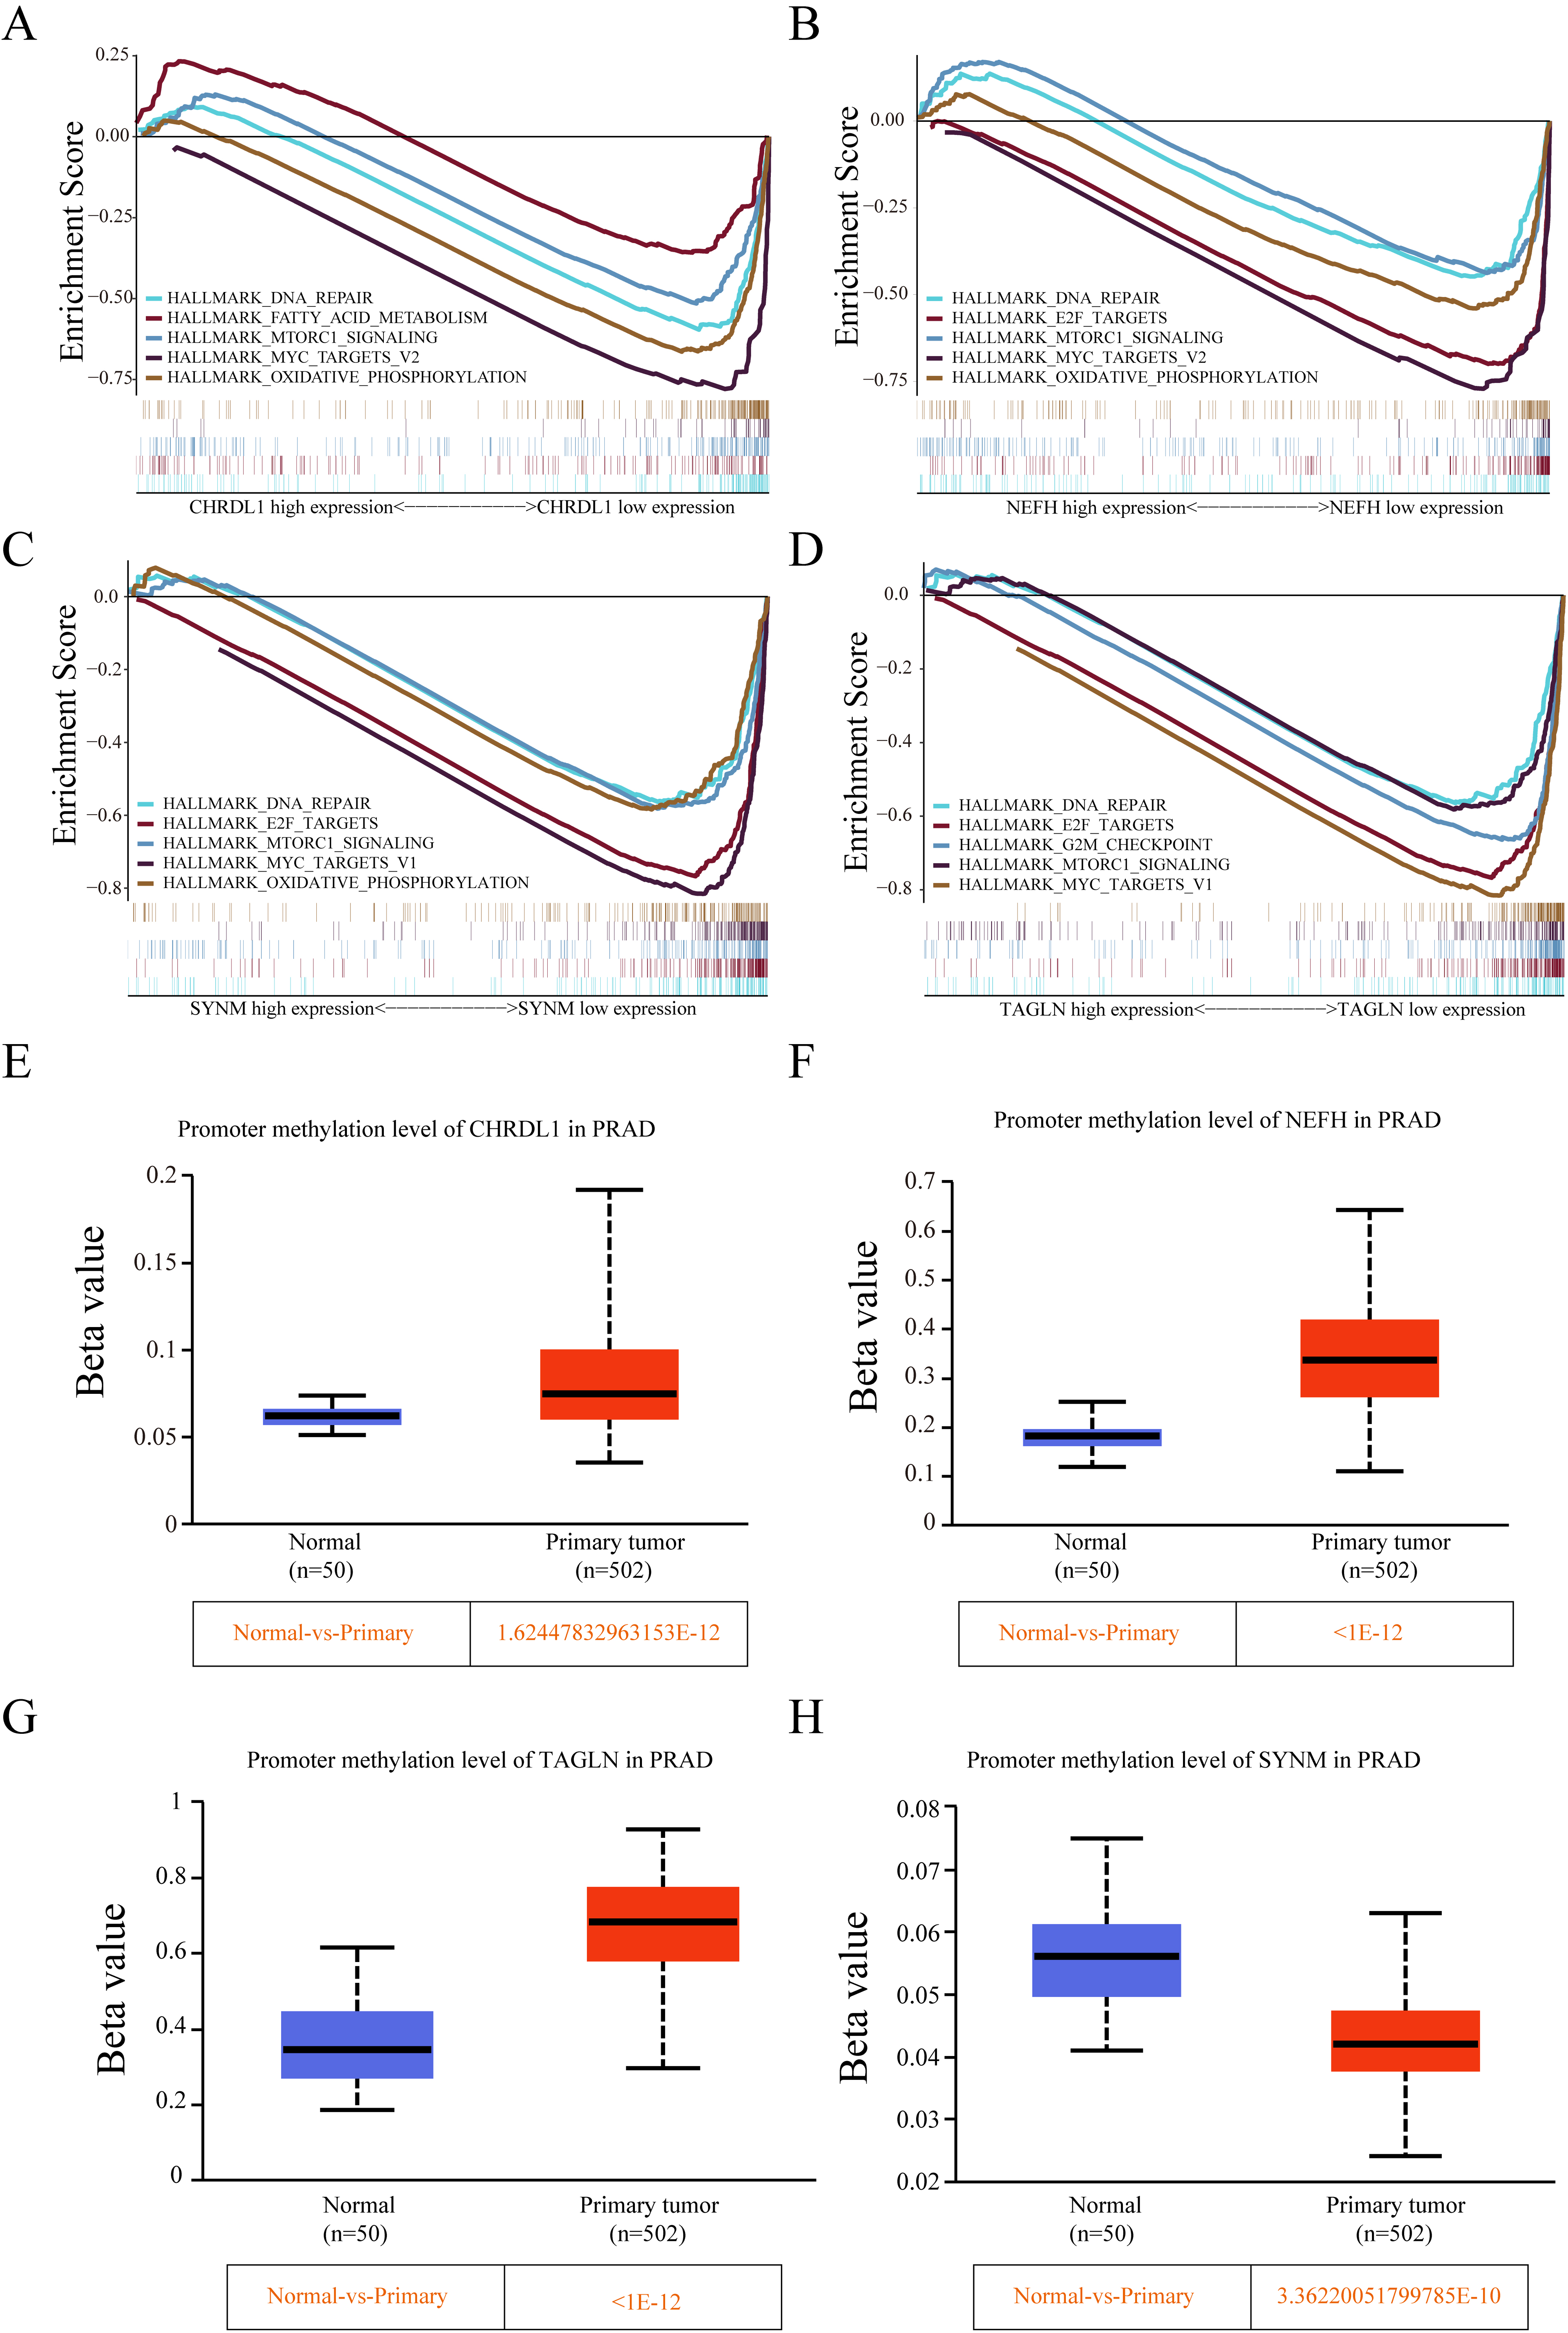
Immune landscape between high- and low-expression NPDBs. (A–D) The relationship between the gene signature and the TME score. (E–H) The relationship between tumor mutation burden and NPDB expression. (I–L) The relationship between immune cells and NPDB expression.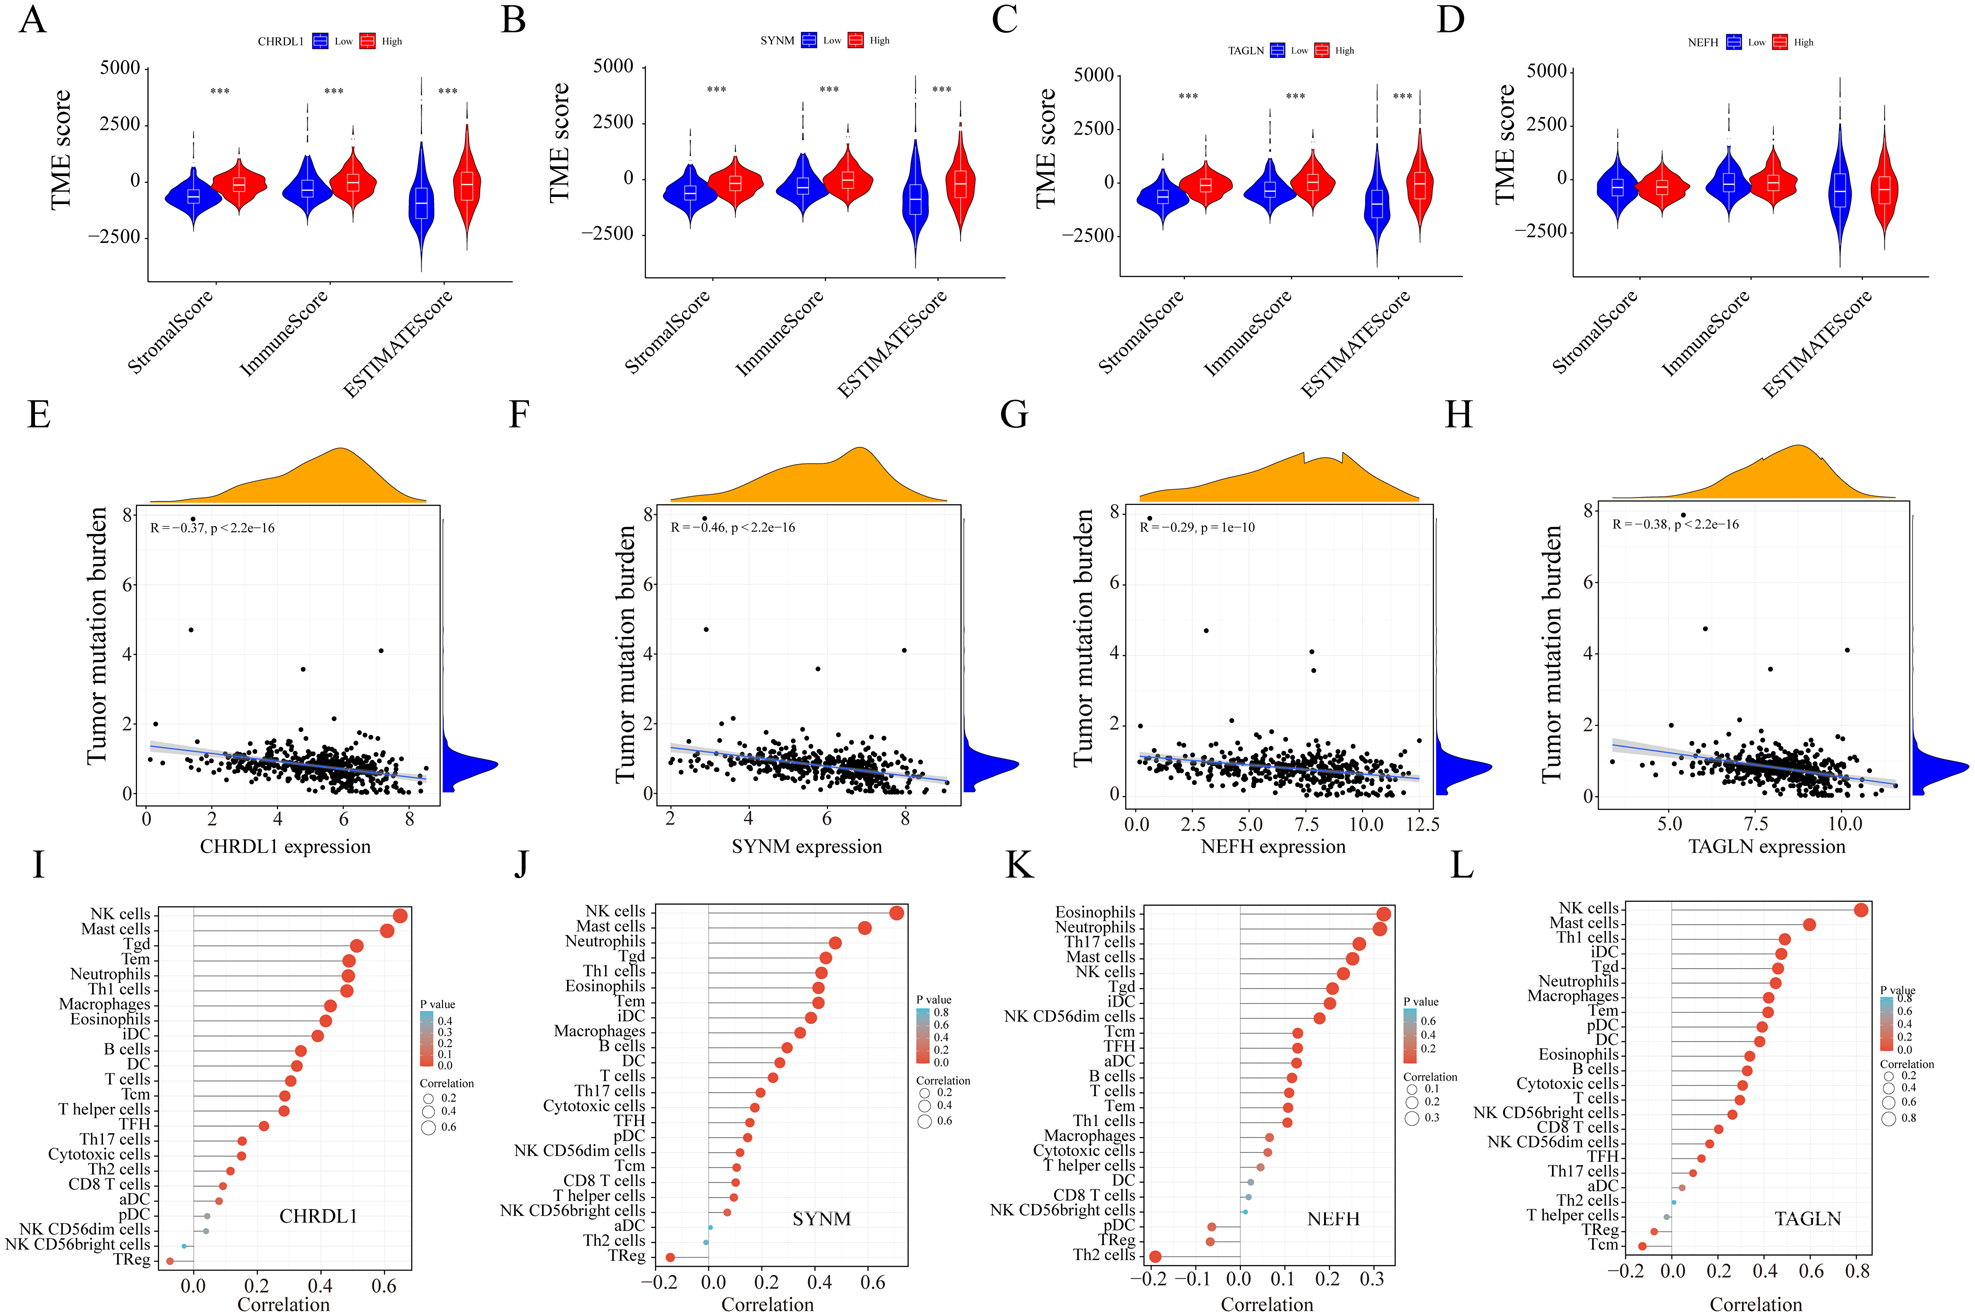
Relationships between the expression of NPDBs and immunogenicity. (A–P) Expression of NPDBs and sensitivity analysis of immunotherapy drugs.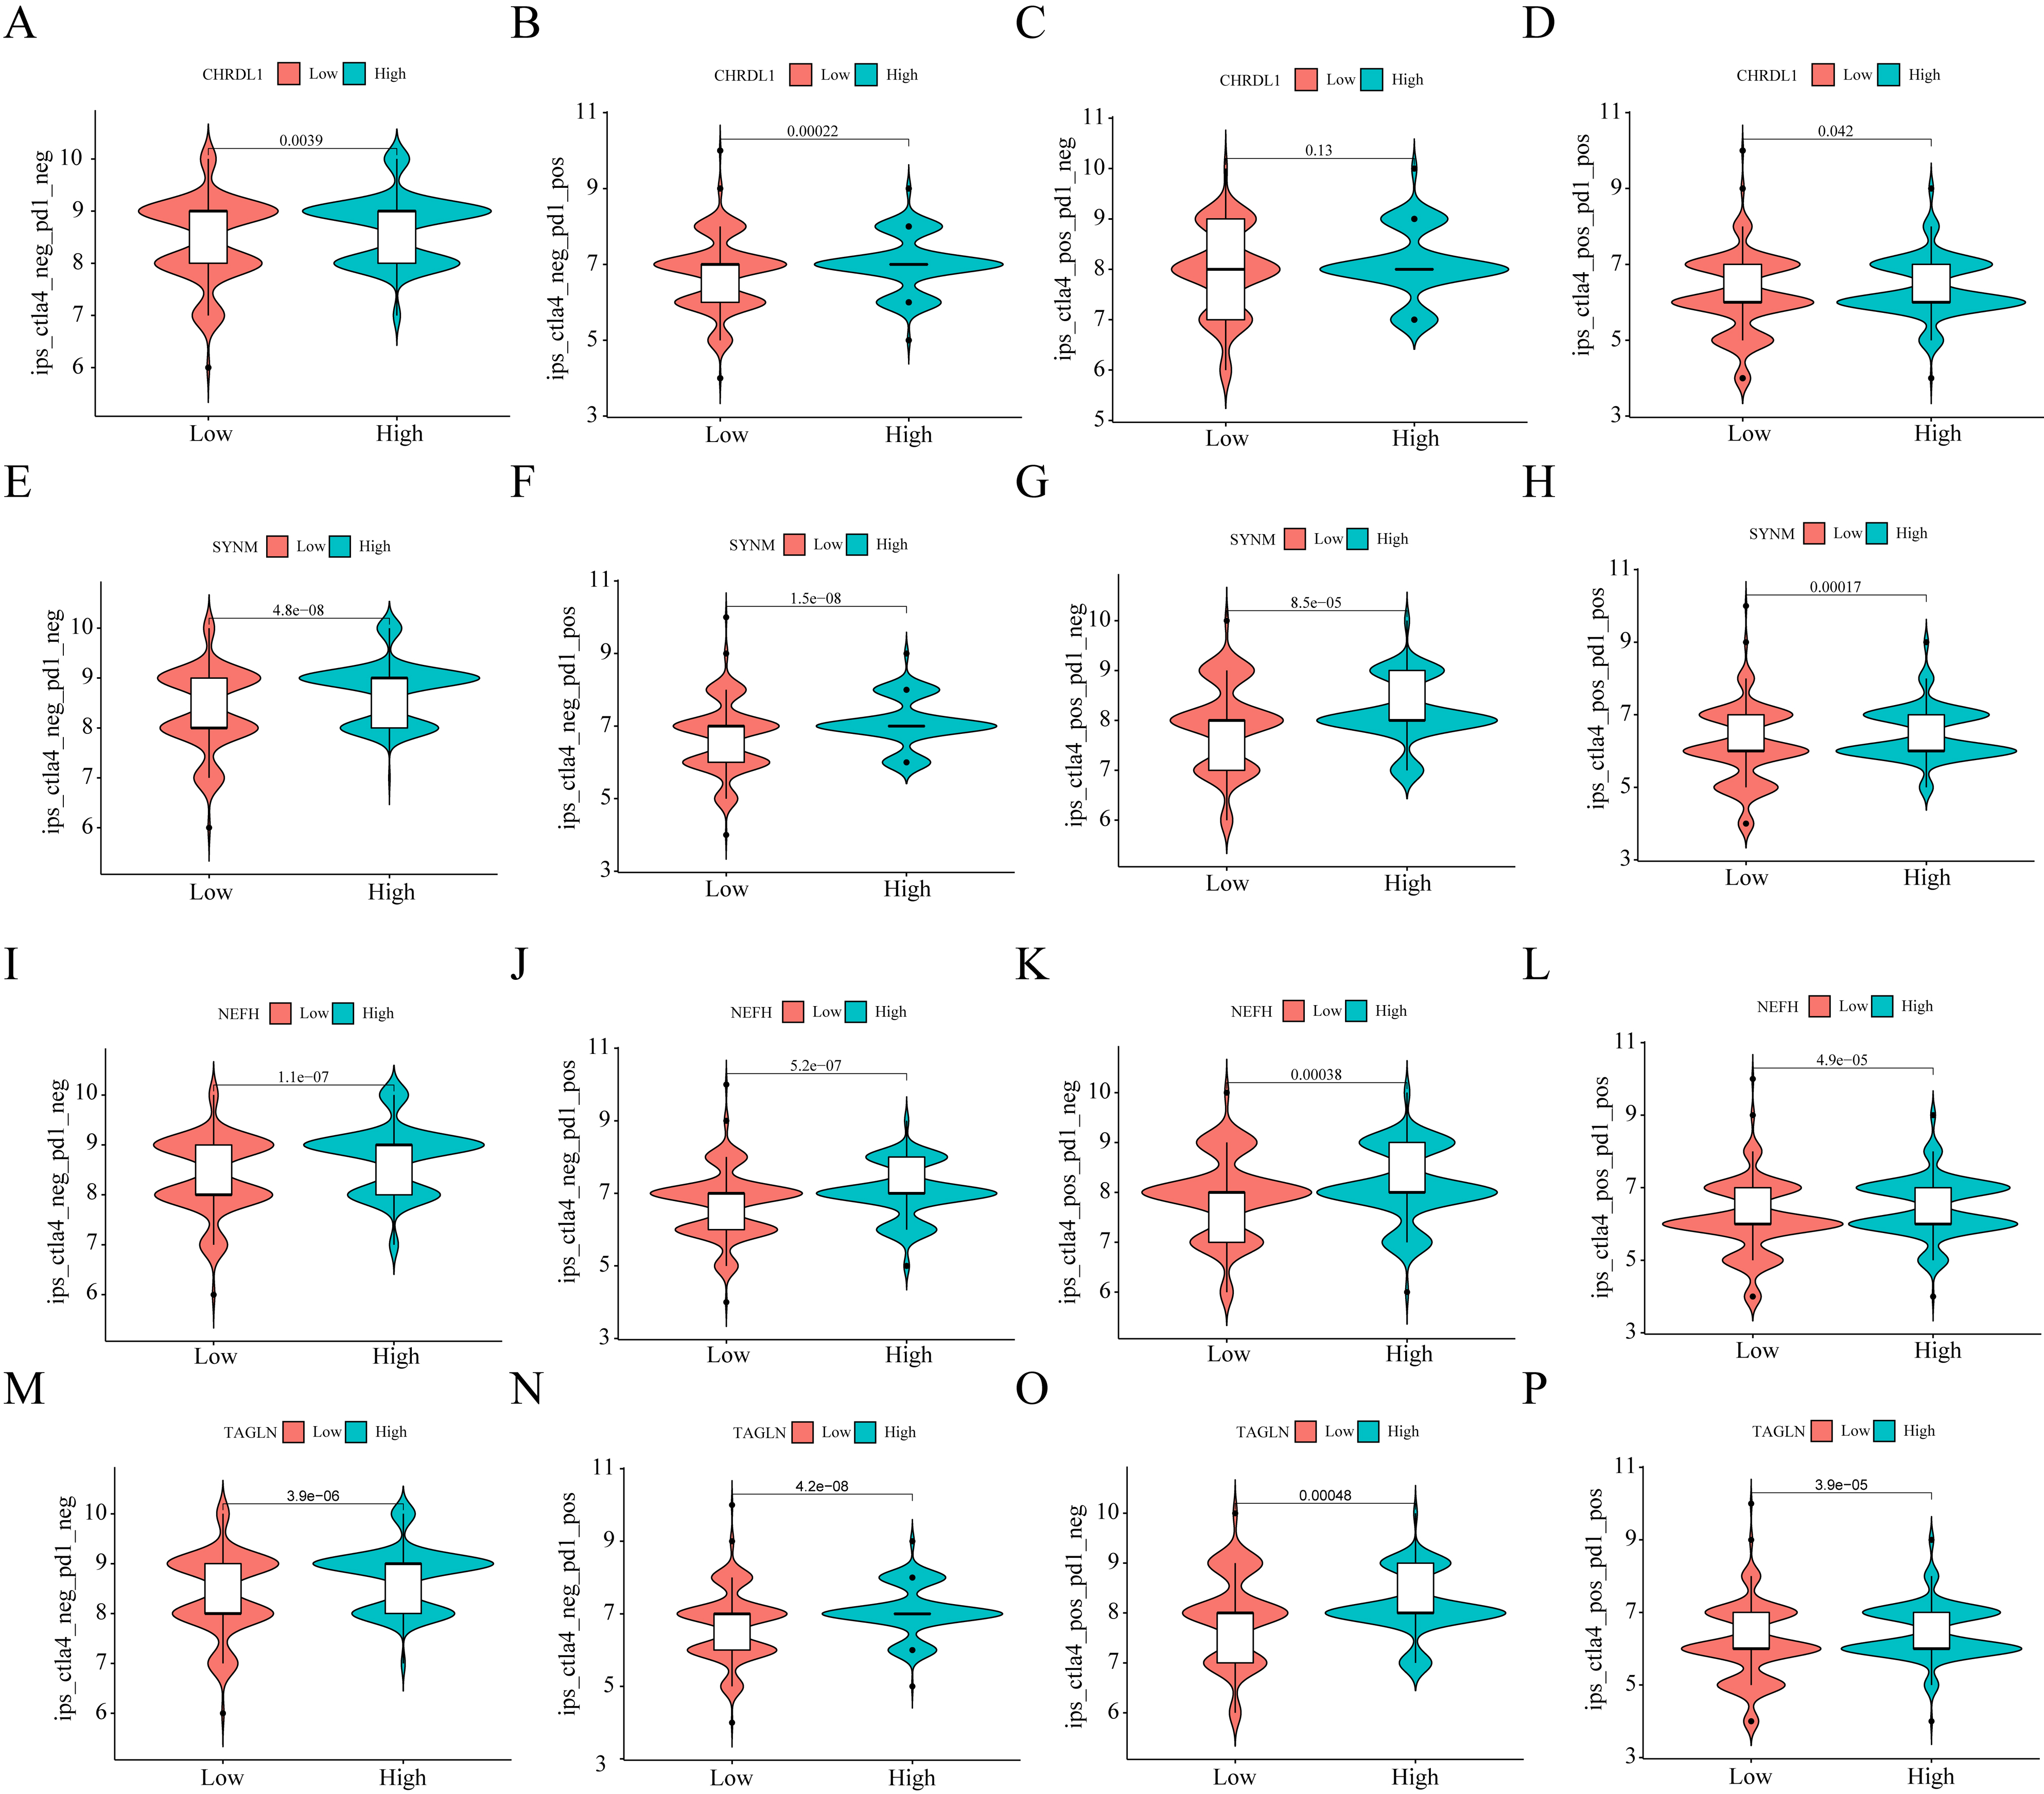
To explore which signaling pathways may be associated with the low expression of NPDBs, we grouped them according to the median expression of NPDBs in prostate cancer in the TCGA dataset and used GSEA software for enrichment analysis. Low CHRDL1 expression was mainly associated with DNA repair, fatty acid metabolism, MTORC1 signaling, myc target V2 and oxidative phosphorylation (Fig. 8A). Low NEFH expression was mainly associated with DNA repair, E2F targets, MTORC1 signaling, myc targets V2 and oxidative phosphorylation (Fig. 8B). Low SYNM expression was mainly associated with DNA repair, E2F targets, MTORC1 signaling, myc targets V1 and oxidative phosphorylation (Fig. 8C). Low TAGLN expression was mainly associated with DNA repair, E2F targets, the G2/M checkpoint, MTORC1 signaling and the myc target V1 (Fig. 8D). Since all NPDBs were related to DNA repair, we detected the relationship between NPDBs and methylation and found that there was a significant difference in methylation levels of all NPDBs between the tumor group. CHRDL1, NEFH and TAGLN had high promoter methylation in the tumor group, which may be one of the reasons for the low expression of these three genes (Fig. 8E–G). SYNM had lower promoter methylation in the tumor group (Fig. 8H).
Correlation analysis of NPDBs with the tumor microenvironment, tumor mutation burden, and immune cells
In studying the role of NPDBs within tumor environments, our initial investigations centered on their relationship with the tumor microenvironment (TME). The TME is a complex and dynamic entity consisting of various cell types, extracellular matrix components, signaling molecules, and blood vessels, all of which are known to significantly influence tumor growth, metastasis, and response to therapy. Within this context, our results highlighted a positive correlation between the expression of three NPDBs (CHRDL1, SYNM, and TAGLN) and the TME across several evaluation metrics: the StromalScore group, ImmunoScore group, and ESTIMATE score group (refer to Fig. 9A–C). This suggests that these genes may be involved in interactions with the surrounding stromal and immune cells within the TME, possibly influencing tumor behavior. Conversely, the expression of the other NPDB, NEFH, did not show a significant association with the TME (Fig. 9D). This implies that the role and behavior of NPDBs in the TME may vary between the specific genes, warranting further investigation into the mechanisms underlying these differences. Further exploration revealed an interesting inverse relationship between NPDB expression and tumor mutation burden (TMB). All NPDB expression demonstrated a significant negative correlation with TMB (Fig. 9E–H), suggesting that NPDBs may be involved in maintaining genomic stability within tumor cells or that high TMB could lead to decreased expression of these genes. In addition, we discovered a robust positive correlation between the expression of all NPDBs and the numbers of various immune cells, including NK cells, B cells, and T cells (Fig. 9I–L). This suggests that NPDBs may play a role in modulating immune responses within the TME, perhaps influencing immune cell recruitment or activation. Given that these NPDBs were expressed at significantly lower levels in tumors, these findings raise the possibility that their decreased expression may impair the ability of immune cells to effectively combat tumor cells. The possibility of these genes functioning as tumor suppressors warrants further validation. Finally, our analysis of NPDBs and their potential influence on the efficacy of immune checkpoint drugs, such as PD1 and CTLA4 inhibitors, offer some intriguing insights. We found that patients with low expression of CHRDL1 were not responsive to PD1 therapy but showed no significant trend in the response to CTLA4 therapy. In contrast, patients with low expression of SYNM, NEFH, and TAGLN were unresponsive to both PD1 and CTLA4 therapies (Fig. 10A–P). These findings suggest a potential role of NPDBs in predicting the response to immunotherapy, underscoring the importance of further research to elucidate the complex interplay between NPDBs, the TME, and the immune response in cancer.
Discussion
BPH and PCa pose a significant health risk to men worldwide. Although there is no direct evidence that BPH progresses into prostate cancer, it is imperative to discover biomarkers that can distinguish between BPH and PCa. Early diagnosis through the use of such biomarkers could prevent unnecessary biopsies and surgeries in many cases [37]. In our study, analysis of the GEO dataset revealed 95 differentially expressed genes (DEGs) between BPH and PCa patients. GO enrichment analysis suggested that DEGs are significantly associated with numerous signaling pathways, such as muscle system process, contractile fiber, actin binding, and others. Furthermore, KEGG pathway analyses linked these pathways to conditions such as vascular smooth muscle contraction, drug metabolism-cytochrome P450, and prostate cancer, among others.
To identify potential diagnostic biomarkers for PCa and BPH, we applied two machine learning algorithms to the dataset of 95 DEGs. Our computational analysis led to the identification of 15 potential biomarkers. Ten genes (CHRDL1, DES, FLNC, GSTP1, MYL9, TGFB3, NEFH, TAGLN, SPARCL1, and SYNM) were significantly upregulated in BPH patients, indicating their potential role in BPH pathophysiology. On the other hand, five genes (TRPM8, HPN, PLA2G7, ENTPD5, and GPR160) were overexpressed in PCa patients, suggesting their involvement in prostate cancer progression. We further assessed the diagnostic potential of these biomarkers through receiver operating characteristic (ROC) curves. The ROC analysis demonstrated the strong predictive performance of these 15 biomarkers, indicating their potential as robust diagnostic biomarkers for BPH and PCa. These findings highlight the effectiveness of machine learning in biomarker discovery, contributing to the rapidly evolving field of precision medicine in urologic oncology. These results are preliminary and require further validation in larger patient cohorts and mechanistic studies to fully ascertain their clinical applicability.
Upon reviewing the literature, we found that the four genes CHRDL1, SYNM, NEFH, and TAGLN, are rarely mentioned in relation to prostate cancer or benign prostatic hyperplasia. These genes have been associated with several other cancers, but their roles in prostate cancer are yet to be clarified. In light of their newly discovered potential in diagnosing BPH and PCa, we have named these four genes new potential diagnostic biomarkers (NPDBs) for prostate cancer.
Despite our focus on protein-coding genes, other studies have recognized the potential of noncoding RNAs such as microRNAs as biomarkers. For instance, a study by Cochetti et al. identified a set of microRNAs as potential biomarkers distinguishing between PCa and BPH. The use of machine learning algorithms in our study aligns with the growing trend of incorporating advanced computational methods in biomarker discovery. These techniques offer a powerful tool for analyzing large datasets and have been used in similar studies [38, 39].
Tumor mutation burden and tumor microenvironment have been established as key factors in the development of PCa [40, 41, 42, 43, 44, 45, 46]. In this study, we found that NPDBs with high expression in prostate cancer were associated with higher TME scores than those with low expression. Furthermore, we found a positive correlation between NPDBs and the number of various killer cells of the immune system, suggesting their potential tumor-inhibiting role in the prostate.
There are certain limitations to our study. First, the sample size was relatively small, warranting validation through large-scale clinical trials. Second, we relied solely on differences in the transcription levels of the NPDBs to draw conclusions about potential as diagnostic markers. Our conclusions need further validation at multiple omics levels, including genomics, proteomics, and metabolomics. Finally, the mechanisms through which NPDBs influence BPH and PCa processes remain unclear. Despite these limitations, our study provides potential new diagnostic biomarkers for BPH and PCa, setting the stage for further research that overcome these limitations given sufficient data.
Conclusion
We have identified four novel diagnostic markers for BPH and PCa patients. Our findings offer new potential targets for the early diagnosis of PCa and BPH and could provide a strategic reference for the selection of targeted therapies in the future. These would include chemotherapy and radiotherapy regimens tailored toward these newly identified targets. Further exploration and validation of these potential biomarkers may contribute significantly to advancing precision medicine in the management of BPH and PCa.
Abbreviations
Declaration of competing interest
The authors declare that there are no conflicts of interest.
Funding
This work was supported by grants from the National Natural Science Foundation of China Youth Project (81802479).
Ethics statement
Not applicable.
Data availability statement
The data that support the findings of this study are available on request from the corresponding author.
Author contributions
Conception: Zhiyong Su and Leilei Li.
Interpretation or analysis of data: Guanghui Wang.
Preparation of the manuscript: Zhiyong Su and Leilei Li.
Revision for important intellectual content: Zhiyong Su, Guanghui Wang and Leilei Li.
Supervision: Leilei Li.
Supplementary data
The supplementary files are available to download from http://dx.doi.org/10.3233/CBM-230028.
sj-tif-1-cbm-10.3233_CBM-230028.tif - Supplemental material
Supplemental material, sj-tif-1-cbm-10.3233_CBM-230028.tif
Footnotes
Acknowledgments
We thank American Journal Experts for editing this manuscript.
Conflict of interest
The author declares no conflicts of interests.