
Abstract
Background
Prostate-specific antigen (PSA) lacks specificity and sensitivity in discriminating prostate cancer (PCa) from benign prostatic hyperplasia (BPH) when the total PSA (tPSA) level is between 4 and 10 ng/mL. It remains to be investigated if additional tumor-associated molecules may improve the PCa diagnostic accuracy. The aim of the present study was to investigate whether serum levels of insulin-like growth factor 1 (IGF1), insulin-like growth factor binding protein 3 (IGFBP3) and their combinations with PSA may enhance the diagnosis of PCa.
Methods
Serum tPSA and free PSA (fPSA) levels were measured using an automated chemiluminescence-based method. IGF1 and IGFBP3 levels were evaluated by radioimmunoassays in a prospectively and consecutively enrolled subset of 149 patients with tPSA ≤10 ng/mL made up of patients with benign prostatic hyperplasia (BPH; n = 113) and PCa (n = 36).
Results
IGF1 and IGFBP3 serum levels did not significantly differ between the PCa and BPH groups. No important correlation was found between the IGF molecules and PSA isoforms in both groups. Statistical analysis of the combination of markers indicated that only the free/total PSA ratio (f/tPSA%) was informative and independent in predicting the presence of PCa, considering that for high values of this percentage (17%) the probability of finding PCa decreased. Receiver operating characteristics areas under the curve (AUC) for IGF1 and IGFBP3 were not informative (AUC ~0.5 in both cases) contrary to the AUC for f/tPSA% (AUC = 0.689, p = 0.0002).
Conclusions
The present study showed that neither IGF1 and IGFBP3 alone nor in combination with PSA enhance the diagnostic performance of PSA in PCa.
Introduction
Prostate cancer (PCa) is the second most common male cancer worldwide, with more than 1,111,000 new cases diagnosed in 2012. With an estimated 307,000 deaths/year, representing 6.6% of the total male cancer mortality, PCa is the fifth leading cause of death from cancer in men (1). PCa is the most common male cancer in Italy with about 36,300 new cases diagnosed in 2014, and the third cause of death from cancer in Italian men, representing 8% of the total male cancer mortality (7,520 deaths/year) (2).
The main diagnostic tool for PCa is prostate biopsy, which is generally performed in the presence of gland nodules and/or suspicious elevation of the prostate-specific antigen (PSA) level.
PSA exists in several molecular forms in blood, as a free non-complexed PSA form (fPSA) and complexed to α-1-antichymotrypsin (cPSA); the sum of fPSA and cPSA constitutes the total PSA (tPSA) (3). When tPSA is between 4 and 10 ng/mL it lacks specificity and sensitivity in distinguishing malignant from benign forms of prostate disease (4, 5). Therefore, to improve its diagnostic performance, several PSA derivatives have been proposed including (i) PSA velocity and PSA doubling time, used to evaluate changes in PSA levels with time (6, 7); (ii) PSA density, which compares the tPSA value to the volume of the prostate gland (8); (iii) free/total PSA ratio (f/tPSA%), which is lower in PCa patients and has been most used to discriminate between patients with PCa and benign prostatic hyperplasia (BPH) (9, 10). Moreover, the use of additional tumor-associated molecules that are not necessarily produced by tumor tissue is becoming of interest in PCa diagnostic research (11).
The insulin-like growth factor (IGF) system has been suggested to play a role in this clinical scenario, as it has been associated with different types of cancer such as colon (12-13-14), lung (15, 16), breast (17, 18) and prostate cancer (19-20-21), where it is involved in cell growth, proliferation, differentiation, migration, and survival.
The IGF system includes peptide hormones (IGF1 and IGF2), cell surface receptors (IGF1R and IGF2R), 6 high-affinity circulating binding proteins (IGFBP), and other low-affinity IGFBP-related proteins. IGFBPs suppress or enhance the activity of IGFs by regulating their binding to receptors in the target tissues. In particular the IGFBP subtype 3 (IGFBP3), the most abundant of the 6 IGFBPs, binds up to 90% of circulating IGF1 (22, 23). A large group of IGFBP proteases is able to hydrolyze IGFBPs and degrade the IGF/IGFBP complex, resulting in the production of IGFBP fragments and the release of bioactive IGF, which is then free to interact with its receptors (4, 24, 25). PSA is a serine protease capable of cleaving IGFBP3, reducing its binding affinity to IGF1 and restoring the hormone mitogenic activity (26-27-28).
Evidence has suggested that high IGF1 and low IGFBP3 circulating levels are associated with the presence or development of PCa. Moreover, their combination with PSA can improve its diagnostic performance for PCa (29-30-31-32). However, other studies have not confirmed these findings or have provided contrasting evidence regarding the possible association of IGFs with PCa (33-34-35).
Considering that the role of the IGF system in PCa detection is still an open issue given the conflicting findings reported so far, the aim of the present study was to investigate whether serum levels of IGF1, IGFBP3 and their combinations with PSA enhance the discriminatory diagnosis of PCa.
Methods
Patients
A total of 274 patients with tPSA levels ranging from 0.07 to 1,375 ng/mL were prospectively and consecutively enrolled at the departments of urology in 3 Italian hospitals (Regional Hospital Azienda ULSS12 Veneziana, Venice; Casa di Cura Giovanni XXIII, Monastier, Treviso; San Raffaele Hospital, Milan). The inclusion criteria for the study were (i) males aged 18 to 75 years; (ii) patients referred to an urologist with a clinical suspicion of PCa; (iii) the ability to understand and sign an informed consent form. The exclusion criteria were (i) acute or chronic prostatitis; (ii) digital rectal examination or any other prostatic manipulation <4 days prior to blood sampling; (iii) prior or current therapy with 5-α-reductase inhibitors (finasteride or dutasteride); (iv) previous or current malignancies at other sites (with the exception of basal or squamous cell carcinoma of the skin); (v) evidence of severe chronic renal or liver disease. The study protocol was approved by the local ethics committees and written informed consent was obtained from each patient.
Serum tPSA, fPSA, IGF1 and IGFBP3 levels were measured in 207 patients with tPSA ranging between 0 and 40 ng/mL. The analysis of the present study was focused on a subset of patients with tPSA ≤10 ng/mL, where tPSA lacks specificity and sensitivity in detecting early PCa. This cohort consisted of 113 patients with BPH (median age 66 years; 10-90 percentile: 56-74 years) and 36 patients with PCa (median age 65.5 years; 10-90 percentile: 52-71 years).
All patients provided blood samples before undergoing transrectal ultrasound-guided systematic prostate needle biopsy.
Sample Collection, Processing and Storage
Blood samples were drawn by forearm venipuncture in SST Vacutainer tubes (Becton Dickinson). The tube was allowed to stand at room temperature for at least 30 minutes and within 2 hours of collection was centrifuged at 1,500 g for 10 minutes. Serum aliquots were stored at -80°C until analysis.
IGF1, IGFBP3 and PSA Assays
Serum IGF1 levels were assessed using a commercially available radioimmunoassay kit (Biosource Europe SA). Serum IGFBP3 levels were determined using an immunoradiometric assay kit (Diagnostic Systems Laboratories Inc.). IGF1 and IGFBP3 were measured by means of a 1470 WIZARD gamma counter (PerkinElmer). The analytical sensitivity of the IGF1 assay was 9 µg/mL; the intra-assay and interassay coefficients of variation were less than 6% and 10%, respectively. The analytical sensitivity of the IGFBP3 IRMA assay was 0.5 ng/mL; the intra-assay and interassay coefficients of variation were both less than 5%.
tPSA and fPSA levels were measured using an automated chemiluminescence-based method (ADVIA Centaur Immunoassay System, Siemens Healthcare Diagnostics). The analytical sensitivity of the tPSA and fPSA assays was 0.01 ng/mL; the intra-assay and interassay coefficients of variation for both PSA isoforms were less than 5%.
All assays were performed centrally at Mestre and Venice laboratories.
Statistical Analysis
None of the continuous variables presented a normal distribution as assessed by the Kolmogorov-Smirnov test. IGF1, IGFBP3, tPSA and fPSA levels in the 2 groups (PCa vs. BPH) as well as ratios and combinations of biomarkers were then compared using the Mann-Whitney U-test. Correlations between variables were evaluated with Spearman's rank correlation coefficient (r) test.
The ability of the parameters to predict the presence of PCa was evaluated using univariate and bivariate logistic regression analysis, incorporating as explanatory variables all the variables from the univariate model with p values <0.05 as well as those we evaluated as being clinically important. The goodness of fit of the logistic regression models was assessed using the Hosmer-Lemeshow test. The ability of single variables and their logistic combinations in discriminating patients with PCa and those with BPH was evaluated by the area under the curve (AUC) in receiver operating characteristic (ROC) analysis. ROC curves were constructed for all measured and calculated parameters by plotting the true positive rate (sensitivity %) versus the false positive rate (100-specificity %). Comparison of ROC curves was performed with the DeLong method using the MedCalc 14.0 software. The Stata/IC 13.1 software (StataCorp LP) was used for the other analyses. All tests were 2-tailed and results were considered statistically significant at a p value <0.05.
Results
Table I shows descriptive data regarding the distribution of age, markers and their ratios (f/tPSA%, IGF1/IGFPB3, IGF1/fPSA, IGFBP3/fPSA, IGF1/tPSA, IGFBP3/tPSA) in the 2 patient categories (BPH and PCa). IGF1 and IGFBP3 serum levels did not differ significantly between the PCa and BPH groups, whereas the ratios of these isoforms with tPSA (IGF1/tPSA and IGFBP3/tPSA) were significantly lower in PCa patients. This result appears to be related to higher tPSA values in the group of PCa patients, as a significant difference was found between the 2 groups for serum levels of tPSA and f/tPSA%.
Biomarkers and age description in BPH (n = 113) and PCa (n = 36) patients
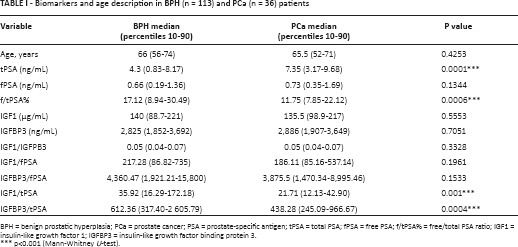
BPH = benign prostatic hyperplasia; PCa = prostate cancer; PSA = prostate-specific antigen; tPSA = total PSA; fPSA = free PSA; f/tPSA% = free/total PSA ratio; IGF1 = insulin-like growth factor 1; IGFBP3 = insulin-like growth factor binding protein 3.
p<0.001 (Mann-Whitney U-test).
Table II presents the Spearman correlations between variables in all patients (PCa plus BPH) and in the PCa and BPH subgroups.
Spearman's correlation coefficients between examined variables in patients with tPSA ≤10 ng/mL
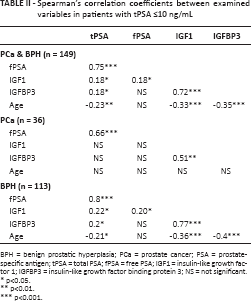
BPH = benign prostatic hyperplasia; PCa = prostate cancer; PSA = prostate-specific antigen; tPSA = total PSA; fPSA = free PSA; IGF1 = insulin-like growth factor 1; IGFBP3 = insulin-like growth factor binding protein 3; NS = not significant.
p<0.05.
p<0.01.
p<0.001.
When all patients were taken together, a significant and highly positive correlation was found between tPSA and fPSA (r = 0.75, p<0.001) and between IGF1 and IGFBP3 (r = 0.72, p<0.001). A significant but weak positive correlation was found between IGF1 with tPSA or fPSA and between IGFBP3 and tPSA (r = 0.18, p<0.05 in all cases). Significant negative correlations were found between tPSA and age (r = -0.23, p<0.01); IGF1 and age (r = -0.34, p<0.001); and IGFBP3 and age (r = -0.35, p<0.001). No significant correlation was found between IGFBP3 and fPSA or between fPSA and age.
When the PCa group was analyzed separately, a significant and moderately positive correlation was found between tPSA and fPSA (r = 0.66, p<0.001) and between IGF1 and IGFBP3 (r = 0.51, p<0.01). The results obtained for the subgroup of BPH patients were similar to those obtained for all patients.
Univariate logistic regression was performed to evaluate associations between PCa and testing variables. The analysis showed that only tPSA, f/tPSA%, IGF1/tPSA and IGFBP3/tPSA ratios were significant predictors of the presence of malignant disease.
Variables shown to be significant in this set of analyses and considered to be clinically important were subsequently evaluated with a bivariate logistic regression to determine the diagnostic performance of combining markers compared with the markers in isolation. Moreover, the absence of important correlations between the IGFs and PSA justifies their association in mathematical models.
In Tables III and IV the results of single and bivariate regression models are reported. In univariate analysis only tPSA and f/tPSA% were informative, with an odds ratio (OR) of 1.35 (p<0.001) and 0.90 (p = 0.002), respectively; for IGF1/tPSA and IGFBP3/tPSA the ORs, even though statistically significant, were close to 1, indicating that these 2 markers are not good predictors of PCa. This can be confirmed considering that no goodness of fit was found for these 2 logistic models (Hosmer-Lemeshow test, p<0.05; data not shown).
Univariate logistic regression analysis to predict the presence of prostate cancer
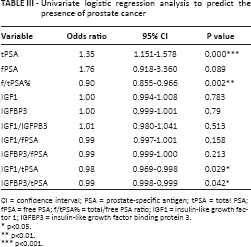
CI = confidence interval; PSA = prostate-specific antigen; tPSA = total PSA; fPSA = free PSA; f/tPSA% = total/free PSA ratio; IGF1 = insulin-like growth factor 1; IGFBP3 = insulin-like growth factor binding protein 3.
p<0.05.
p<0.01.
p<0.001.
Bivariate logistic regression analysis to predict the presence of prostate cancer
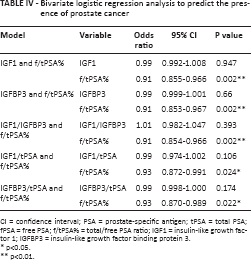
CI = confidence interval; PSA = prostate-specific antigen; tPSA = total PSA; fPSA = free PSA; f/tPSA% = total/free PSA ratio; IGF1 = insulin-like growth factor 1; IGFBP3 = insulin-like growth factor binding protein 3.
p<0.05.
p<0.01.
In bivariate regression analysis, models included the IGF system and f/tPSA% (IGF1 and f/tPSA%; IGFBP3 and f/tPSA%; IGF1/IGFBP3 and f/tPSA%; IGF1/tPSA and f/tPSA%; IGFBP3/tPSA and f/tPSA%). As a result, only f/tPSA% was identified as an independent factor in predicting malignant disease with a significant OR ~0.90 in all cases (Tab. IV).
ROC analysis was done to evaluate the diagnostic performance of the measured and calculated parameters. The AUC values obtained from these variables are summarized in Table V. The AUCs for the combinations of molecules of the IGF axis with f/tPSA% (IGF1 and f/tPSA%, IGFBP3 and f/tPSA%, IGF1/IGFBP3 and f/tPSA%, IGF1/tPSA and f/tPSA%, and IGFBP3/tPSA and f/tPSA%) were not different from the AUC for f/tPSA% in isolation (data not reported).
AUC, 95% CI and p value for measured and calculated parameters (tPSA ≤10 ng/mL)
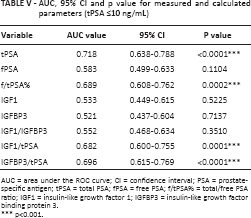
AUC = area under the ROC curve; CI = confidence interval; PSA = prostate-specific antigen; tPSA = total PSA; fPSA = free PSA; f/tPSA% = total/free PSA ratio; IGF1 = insulin-like growth factor 1; IGFBP3 = insulin-like growth factor binding protein 3.
p<0.001.
The parameters tPSA, f/tPSA%, IGF1/tPSA and IGFBP3/tPSA ratios were found to be significant in discriminating PCa and BPH in men with tPSA ≤10 ng/mL. For the sake of completeness it should be mentioned that the same parameters were able to discriminate PCa and BPH groups among patients with tPSA between 10 and 40 ng/mL. In patients with tPSA ≤10 ng/mL, the highest AUC value was found for tPSA (AUC = 0.718). Nevertheless, when significant ROC curves were compared by means of the DeLong method, no significant differences in diagnostic performance were found (Fig. 1). The AUCs obtained from tPSA were similar to those obtained from f/tPSA% also when tPSA was evaluated at another 2 ranges of values: 2.5≤tPSA≤10 ng/mL (AUC tPSA 0.633 vs. AUC f/tPSA% 0.622) and 4≤tPSA≤10 ng/mL (AUC tPSA 0.642 vs. AUC f/tPSA% 0.618).
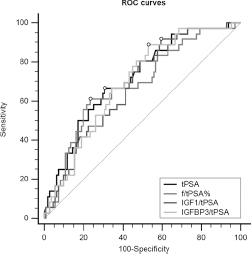
ROC curves for tPSA, f/tPSA%, IGF1/tPSA and IGFBP3/tPSA ratios in patients with benign prostatic hyperplasia versus prostate cancer (tPSA ≤10 ng/mL). PSA = prostate-specific antigen; tPSA = total PSA; f/tPSA% = total/free PSA ratio; IGF1 = insulin-like growth factor 1; IGFBP3 = insulin-like growth factor binding protein 3.
Discussion
The current study was performed in a cohort of PCa and BPH patients with tPSA values ≤10 ng/mL. Considering that the PSA axis regulates the IGF system by its proteolytic activity, we investigated if the IGF1 and IGFBP3 molecules in combination with tPSA, fPSA and f/tPSA% levels could be used to enhance the discriminatory diagnosis of PCa. The results showed that neither IGF1 and IGFBP3 alone nor the 2 molecules in combination with PSA enhanced the diagnostic performance of PSA in PCa.
As previously reported, PCa has been associated with higher tPSA and lower fPSA levels than those of patients with benign disease (36). In the cohort examined in this study, tPSA levels were significantly more elevated in PCa patients, although fPSA levels were similar in the 2 subgroups. It is necessary to keep in mind that only ∼3% of fPSA in the circulation is enzymatically active PSA (37), which is able to act as an IGFBP3 protease. Thus, the lack of a difference in fPSA levels between PCa and BPH could be an explanation for the similar IGF1 and IGFBP3 levels between the 2 groups of patients, in contrast to previous observations by others (29, 38). Moreover, even though prostate cancer cells can also produce IGF1 and IGFBP3, the fraction produced by this organ may not substantially influence their total systemic pool, as a larger amount of these isoforms is released by liver and other tissues under the stimulation of pituitary growth hormone (39).
Correlation analysis identified weak positive correlations between the IGF and PSA systems only in BPH patients, and tPSA correlated significantly with IGF1 and IGFBP3 whereas fPSA correlated only with IGF1. A negative correlation between IGF molecules and fPSA was reported by Khosravi et al. only in BPH but not in PCa patients (40). Also in the present study we did not find any significant correlation between the IGF and PSA systems in PCa patients. Logistic regression analysis was performed to evaluate the association of tPSA, fPSA, IGF1, IGFBP3 and their combinations with disease status. Our data show that there is no association between serum IGF1 and IGFBP3 levels with PCa. The present results confirm the absence of an association of IGFBP3 with PCa, as previously observed (38). However, the present findings are in contrast with results obtained in earlier prospective studies showing that IGF1 is associated with the risk of the presence of PCa (30).
Concerning the validity of IGF1 and IGFBP3 in discriminating PCa patients from benign controls, our study confirms that in isolation they cannot discriminate PCa from benign conditions (36). The AUCs found with ROC analysis for IGF1 and IGFBP3 in patients with tPSA ≤10 ng/mL were in both cases ~0.5 (p>0.05). Moreover, as in other studies, the discriminatory potential of IGF1 or IGFBP3 in combination with PSA molecules was evaluated (31, 41). The AUCs for IGF1/tPSA and IGFBP3/tPSA were not significantly different from those for tPSA and f/tPSA%, indicating that these ratios do not improve the accuracy of traditional PCa markers alone for distinguishing cancer. The present data do not support previous findings that a higher IGF1/tPSA ratio significantly improves PCa detection compared with tPSA (in the range of 2.5 to 15 ng/mL) (31). This discrepancy may be due to the different ranges of tPSA analyzed in the 2 studies (0.07-10 ng/mL vs. 2.5-15 ng/mL) and also to the higher diagnostic performance of tPSA with respect to that calculated by Djavan et al (31) (AUC = 0.718 vs. 0.610). It could be interesting to explore if this discrepancy could be due to the differences in tumor stages analyzed in the 2 studies. However, both Djavan et al (31) and the present study did not have access to the clinical information about tumor stage.
Similar results have been obtained considering multiple models. These models were constructed between IGF molecules and PSA isoforms considering only f/tPSA%, as it has better diagnostic performance than tPSA when its level is within the range 0.01-10 ng/mL (31). Only f/tPSA% was found to be informative, indicating that, as previously reported (42), with high values of this percentage (17%) the probability of finding PCa decreased.
In conclusion, our results suggest that neither IGF1 and IGFBP3 alone nor the 2 molecules in combination with PSA are clinically useful in PCa detection and, moreover, that they do not enhance the diagnostic performance of PSA in patients with tPSA lower than 10 ng/mL. Considering the present negative results obtained in the diagnostic framework, IGF-related molecules still remain to be investigated as PCa biomarkers in other clinical scenarios such as prognosis and prediction of response to therapy.
Footnotes
Abbreviations
Acknowledgment
The authors thank Dr. Antonette Leon for editorial assistance.
Conflict of interest: The authors declare no conflict of interest.
Financial support: No grants or funding have been received for this study.