
Abstract
BACKGROUND:
Pyroptosis could regulate tumor cell trafficking, invasion, and metastasis, as well as the tumor microenvironment (TME). However, prognostic characteristics of pyroptosis-related genes (PRGs) and their effect on the progression of glioma remain insufficient.
METHODS:
The genetic, transcriptional, and survival data of patients with glioma used for bioinformatic analysis were obtained from the Chinese Glioma Genome Atlas (CGGA) and The Cancer Genome Atlas (TCGA) databases.
RESULTS:
Screening of two different molecular subtypes revealed that PRG variations were associated with characteristics of TME cell infiltration, clinicopathological characteristics, and prognosis of patients with glioma. After Cox regression of differentially expressed genes, a risk score for predicting overall survival (OS) and progression-free survival (PFS) were calculated. Its predictive accuracy in patients with glioma was validated. The high-risk group of PRG signature had a poorer OS than the low-risk group (training cohort,
CONCLUSION:
Our findings may provide the basis for future research targeting pyroptosis in glioma and evaluation of prognosis and development of more effective immunotherapy strategies.
Abbreviations
Introduction
Glioma is the leading malignant tumor, accounting for about 30% of tumors and 81% of aggressive malignancy in the central nervous system [1]. According to the molecular markers and histological characteristics of gliomas, the World Health Organization classifies gliomas into low-grade glioma (LGG, grade II–III) and glioblastoma multiforme (GBM, grade IV). Most LGGs progress to GBM, with a five-year survival rate of only 5% [2, 3]. In recent decades, survival rates have improved significantly with advanced equipment, multidisciplinary therapeutic regimen, and the improvement of early screening systems [4]. However, the prognosis of glioma remains unsatisfactory; potential therapeutic targets and independent prognostic biomarkers must be identified.
Pyroptosis, referred to as programmed cell death, is a novel form of cellular inflammatory necrosis [5]. Triggered by certain inflammasomes, pyroptotic cells rely on the activation of inactive cytokines and cleavage of the gasdermin (GSDM) protein superfamily (GSDM A-E and DFNB59) [6]. In terms of mechanism, canonical, non-canonical, caspase-3/8-mediated, and granzyme-mediated inflammasomes were all involved in pyroptosis [7]. Pyroptosis was originally characterized and identified to be a crucial component of immunity against infection [8]; however, emerging evidence suggests that it is involved in the process of tumors [5, 7, 9]. GSDM proteins, proinflammatory cytokines, and vesicles, which are the main bioactive components of pyroptosis, have been described to be related to tumorigenesis, metastatic progression, and inflammatory tumor microenvironment [10]. More recently, further progress has been made in research on pyroptosis. Hou et al. reported that accumulated p-STAT3 stimulated PD-L1 nuclear translocation under hypoxic conditions, thereby enhancing the expression of GSDMC [11]. The activation of caspase-8 by macrophage-derived TNF-
Tumor microenvironment (TME) refers to the non-cancerous cells and non-cellular components that exist around the tumor, including the bioactive molecules produced and released by them [14]. The continuous interactions between the TME and tumor cells play crucial roles in tumor initiation, progression, relapse, metastasis, and resistance to therapies [15]. Apart from invading tumor cells, the TME also contains lymphatic endothelial cells, fibroblasts, extracellular matrix (ECM), immune and inflammatory cells, diffusible chemokines and cytokines secreted from neighboring tumor, and stromal cells [14, 16]. An increasing number of studies have demonstrated the complex crosstalk between the TME and pyroptosis [17, 18]. Currently, most studies only evaluate one or two PRGs due to technical limitations, while the antitumor activity is characterized by highly coordinated interactions of multiple genes [19, 20, 21]. Jiang et al. demonstrated that can promote the proliferation and migration of glioma cells by directly targeting the caspase-1 to induce pyroptosis [22]. A study by Zhou et al. found that the inhibition of NLRP3 can be rescued by the NLRP3 antagonist CY-09 both in vivo and in vitro, and regulate the glioblastoma immune microenvironment via pyroptosis [23]. In addition, the pyroptosis inflammasome of NAIP-NLRC4 has been implicated in the pathogenesis of glioma. However, no clear consensus on its function in the development of glioma has yet been reached [24]. Therefore, a comprehensive analysis of the features of multiple PRG-mediated cells infiltrates may provide significant insights into the underlying mechanisms of glioma tumorigenesis and the prediction of immunotherapy responses.
Given the current findings, we know that pyroptosis is involved in tumor development and the anti-tumor process, but few studies on its specific prognostic characteristics in glioma have been conducted. Therefore, we comprehensively explored the genetic and transcriptional profiles of PRGs and presented a systematic overview of the glioma immune microenvironment, coupled with computational analysis. First, we divided 667 patients with gliomas into two distinct subtypes based on the expression level of PRG. All the samples in training (TCGA) and validation (CGGA) cohorts were classified into two discrete groups, based on the three survival-related PRGs identified by Lasso-penalized Cox regression. Thereafter, we identified the immune landscape of gliomas and developed a scoring model for predicting overall survival, which accurately predicted patient prognosis and guided optimal treatment choices for glioma.
Materials and methods
Datasets
The workflow diagram of this study is illustrated in Fig. S1. We obtained the transcriptional landscape of 1,431 normal brain samples from the Genotype-Tissue Expression (GTEx) Data Portal (
Identification of differentially expressed PRGs and consensus clustering
In this study, 40 PRGs were downloaded from the human gene database (GeneCards) (
Correlations between two subtypes and TME and PD-1/PD-L1 blockade in glioma
We assessed the stromal/immune cells of each glioma sample using the ESTIMATE algorithm. Furthermore, the CIBERSORT algorithm was used to calculate the fraction of 22 immune cell subsets of each patient with glioma [31]. The infiltration levels of immune cell subsets in glioma TME were explored using a single-sample GSEA algorithm [32]. Additionally, the expression of PD-1/PD-L1 blockade between the two subtypes was analyzed.
Development and validation of a pyroptosis-related prognostic model
Univariate and multivariate Cox proportional hazard regression models were used to evaluate the prognostic factors, including age, gender, grade, and risk-score. For Kaplan-Meier curves, the survival rates among two groups were compared using the log-rank test. Hazard ratios (HR) and 95% confidence intervals (CI) were calculated using the “forestplot” R package. Based on prognostic DEGs, the Lasso-penalized Cox regression algorithm (R package “glmnet”) was used to construct a prognostic model. The cut-off value was set at as 0.05, and three PRGs were selected for further analysis.
The risk-score was calculated using the following equation:
Where Exp and Coef represent the expression and risk coefficient of each PRG, respectively. The risk score of the gene was calculated after centralized standardization of the mRNA expression data (using the “scale” function in R). By applying the median filter on the risk score, patients with glioma were divided into high/low-risk subgroups. The OS of the two subgroups was compared using the Kaplan-Meier method. Principal component analysis (PCA) was performed based on a three-gene signature using the “prcomp” function in R. The predictive capability of the risk scores was assessed by time-dependent receiver operating characteristic (ROC) curve analysis. The “timeROC” and “survminer” R packages were used to perform the 1-, 3-, and 5-year sensitivity curve analyses.
Independent prognostic values of pyroptosis-related genes
The phenotypic data (age, gender, and grade) of patients with glioma were obtained from the TCGA and CGGA cohorts. These clinical variables were analyzed in conjunction with the risk score in a Cox proportional hazards regression model. Based on the median risk score of the TCGA cohort, patients with glioma in the CGGA-mRNAseq693 cohort were classified into two groups. Thereafter, these subgroups were compared to validate the prognostic model.
Tissue samples collection
Five pairs of glioma tissues and normal tissues were obtained from glioma patients in the Second Xiangya Hospital and all samples were frozen at
Immunohistochemical (IHC) staining
To assess differences in DEGs expression at the protein level, IHC staining images of CASP4, CASP6, and GZMB protein expression in glioma tissues and normal brain tissues were analyzed from the HPA database (
RNA isolation and quantitative real-time PCR (RT-qPCR) analysis
Total RNA was collected from glioma specimens by using Trizol reagent (Invitrogen, Carlsbad, CA, USA). Following the principle of complementary base pairing, complementary DNA (cDNA) was then synthesized by using the PrimeScript RT Reagent Kit (Takara Bio). After this, SYBRGreen assays (Takara) were adopted in RT-qPCR on a CFX-96 Real-Time PCR Detection System (Bio-Rad Laboratories, Inc, USA). And results were computed through the threshold cycle (
Immune infiltration and functional enrichment analysis for DEGs
Based on these DEGs, the R package “clusterProfiler” was used for Gene Ontology (GO) and Kyoto Encyclopedia of Genes and Genomes (KEGG) analyses. In addition, ssGSEA was performed using the “GSVA” R package to calculate the scores of tumor-infiltrating immune cells and immune-related pathways.
Mutation, drug susceptibility, and cancer stem cell (CSC) index analysis
To identify somatic mutations in patients with glioma between the two groups, the “maftools” R package was used to generate mutation annotation format (MAF) profiles (derived from VarScan2). Additionally, the tumor mutation burden (TMB) scores for each sample in the high- and low-risk groups were calculated. To investigate the difference in the therapeutic efficacy of chemotherapy drugs between the two risk groups, we used the “pRRophetic” R package to calculate the half-inhibitory concentration (IC
Establishment of the nomogram scoring model
Based on the results of the independent prognostic analysis, the risk score and clinical parameters were used to construct a predictive nomogram model using the “rms” package. Each clinicopathologic variable was computed with a score in the nomogram scoring model, and the scores of all variables in each sample were added up to obtain the final score. Clinical ROC and decision curve analyses (DCA) were performed to assess the effectiveness of the nomogram model. Calibration curves of the model were used to describe the predictive power for the probability of survival events at 3- and 5 years.
Statistical analysis
Wilcoxon matched-pairs signed rank test was used to compare the transcriptional variations between the normal brain and glioma tissues. The Mann-Whitney test was used to compare the infiltration of immune cells and activation of immune pathways between the two subgroups. The paired log-rank test was applied to compare the overall survival between the subgroups. The Pearson correlation test was used to evaluate the correlation coefficient.
Characteristics and differences of PRGs in glioma. (A–C) Heatmap (red: high expression; blue: low expression) of 33 DEGs in glioma tissues and normal brain tissues (red, tumor; blue, normal). 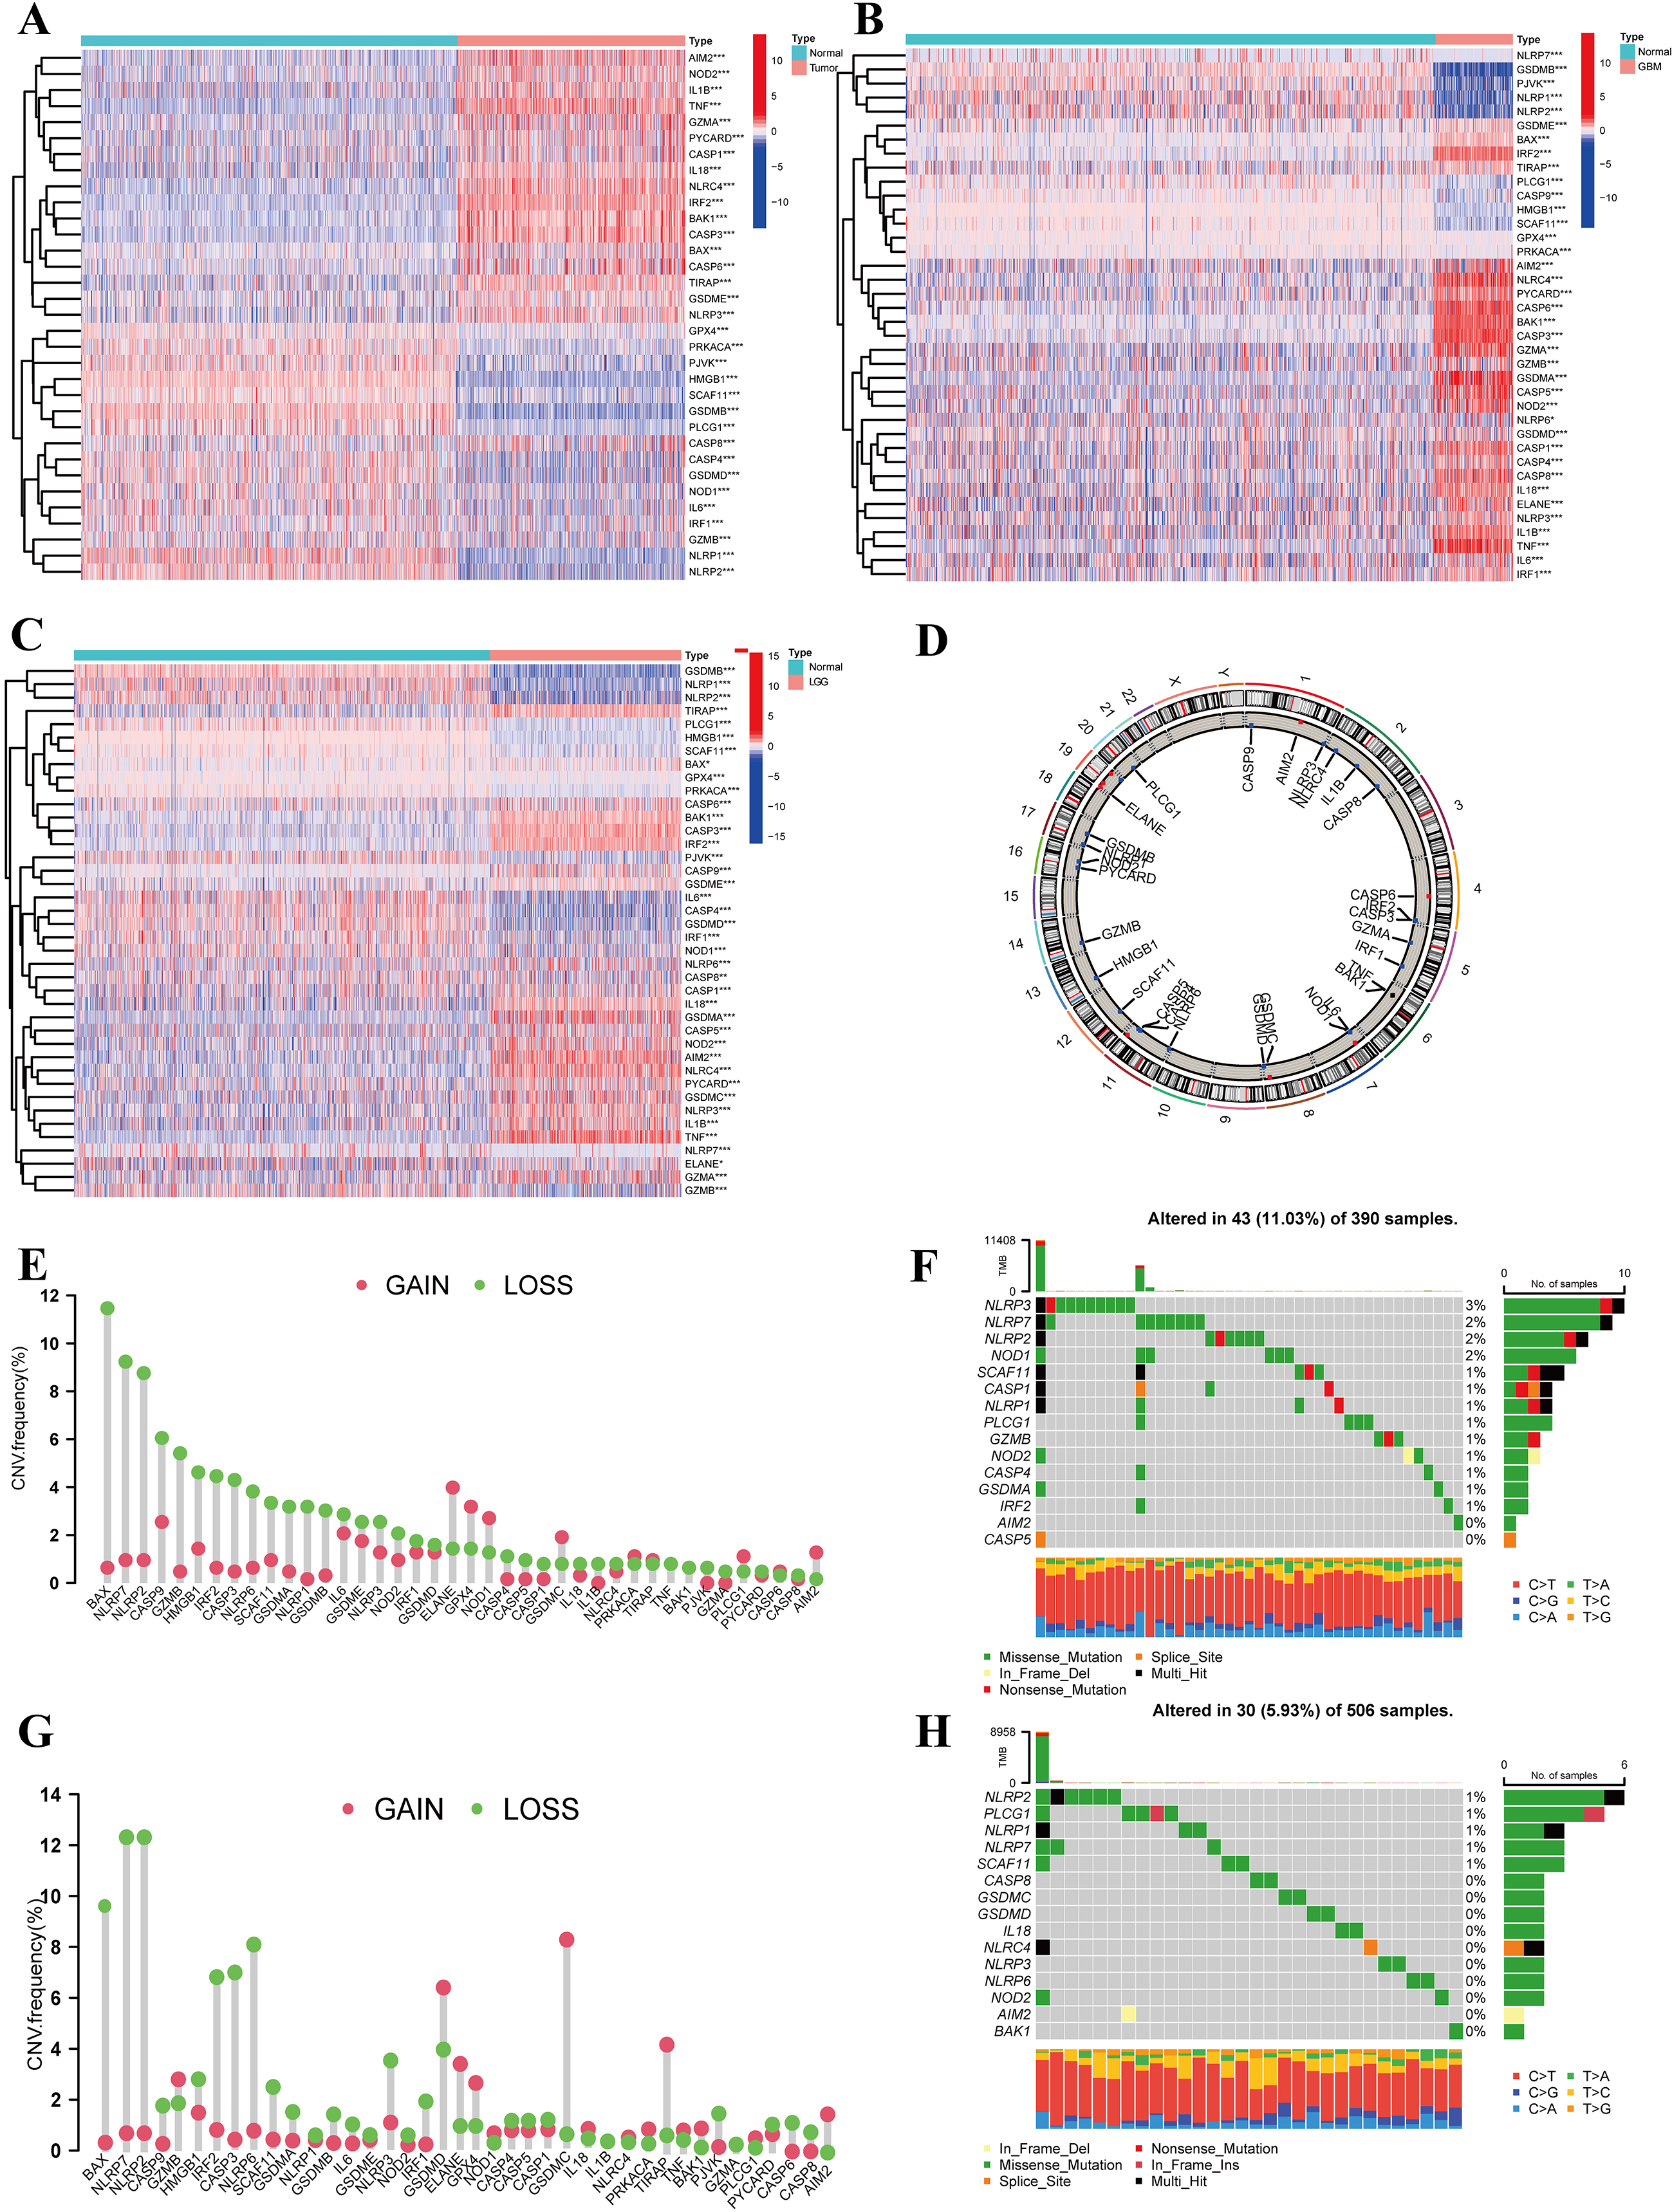
Identification of genetic alterations and transcriptional variations of PRGs in glioma
The gene expression levels of 40 PRGs were measured between 667 tumor and 1431 normal tissues from TCGA-GBM/LGG and GTEx-Brain data. Thirty-three PRGs were either downregulated or upregulated in glioma (all FDR
In addition, we identified the location of alterations of the PRGs featuring copy number variation (CNV) on chromosomes (Fig. 1D). Additionally, the CNV alteration frequency was investigated, which revealed that more than half of the 40 PRGs were widespread with a copy number deletion (Fig. 1E and G). Thereafter, we explored the incidence of somatic mutations and copy number variations of 40 PRGs in GBM and LGG. At the genetic level, 43 of 390 (11.03%) GBM samples and 30 of 506 (5.93%) LGG samples confirmed genetic mutations. Figure 1F demonstrates that NLRP3 had the highest frequency of variants in GBM, followed by NLRP7, NLRP2, and NOD1. Compared with the LGG cohort, NLRP2 showed the highest mutation frequency among the 40 PRGs (Fig. 1H). The correlation network containing all PRGs and DEGs are presented in Fig. S2A and C, respectively. We further found that some PRGs with downregulated mRNA expression, such as NLRP2 and HMGB1, showed CNV loss, indicating that CNV alteration might regulate the transcriptional activity of PRGs.
To further explore the potential interactions among these PRGs, a PPI analysis was performed to detect these PRG interactions with a minimum interaction score of 0.9 (the highest confidence), which revealed that NLRP1, CASP5, GSDMD, NLRC4, PYCARD, CASP1, and NLRP3 were hub genes (Fig. S2B). Our analysis revealed significant differences in both the landscape of genetic alterations and transcriptional variations of PRGs between control and glioma samples, suggesting the potential function of PRGs in glioma oncogenesis.
Identification of pyroptosis subtypes in glioma and their TME characteristics
The comprehensive landscape of 33 DEG interactions, connections, and their prognostic significance in patients with glioma was presented in a pyroptosis network (Fig. 2A and Table S5). To explore the relationship between the expression of the 33 differentially expressed pyroptosis genes and glioma subtypes, we performed the consensus cluster analysis to classify patients with glioma. By applying the K-means clustering algorithm, the intra-group correlation was the highest and the inter-group correlation was lowest, when
Additionally, we assessed the TME scores (StromalScore, ImmuneScore, and ESTIMATEScore) of the two clusters using the ESTIMATE package. A higher StromalScore or ImmuneScore indicated a higher relative content of stromal or immune components in the immune microenvironment, whereas the ESTIMATEScore represented the accumulation of stromal or immune cells. We observed that patients with subtype C2 had a higher TME score (Fig. 2C). Correspondingly, analysis of the immune checkpoints indicated that PD-1 and PD-L1 were highly expressed in subtype C2 (Fig. 2D and E). Thereafter, a significant difference was found in PFS and OS between the two clusters (Fig. 2F and G,
To investigate the effect of PRGs on the tumor immune microenvironment of glioma, we evaluated the tumor-infiltrating immune levels of every glioma sample between the two subtypes using the CIBERSORT algorithm (Table S6). Our study indicated that cluster C1 showed higher infiltration fractions of resting memory CD4 T cells, activated NK cells, monocytes, and activated mast cells activated. Whereas cluster C2 was more associated with CD8 T cells, resting mast cells, M1 macrophages, and M2 macrophages (Fig. 2I).
Clinicopathological and TME characteristics of PRG subtypes based on DEGs. (A) Interactions among 33 DEGs in glioma. The thickness of the lines represents the strength of the correlation among the PRGS. Pink and blue represent positive and negative correlations, respectively. (B) The consensus clustering matrix of 667 samples in the TCGA cohort (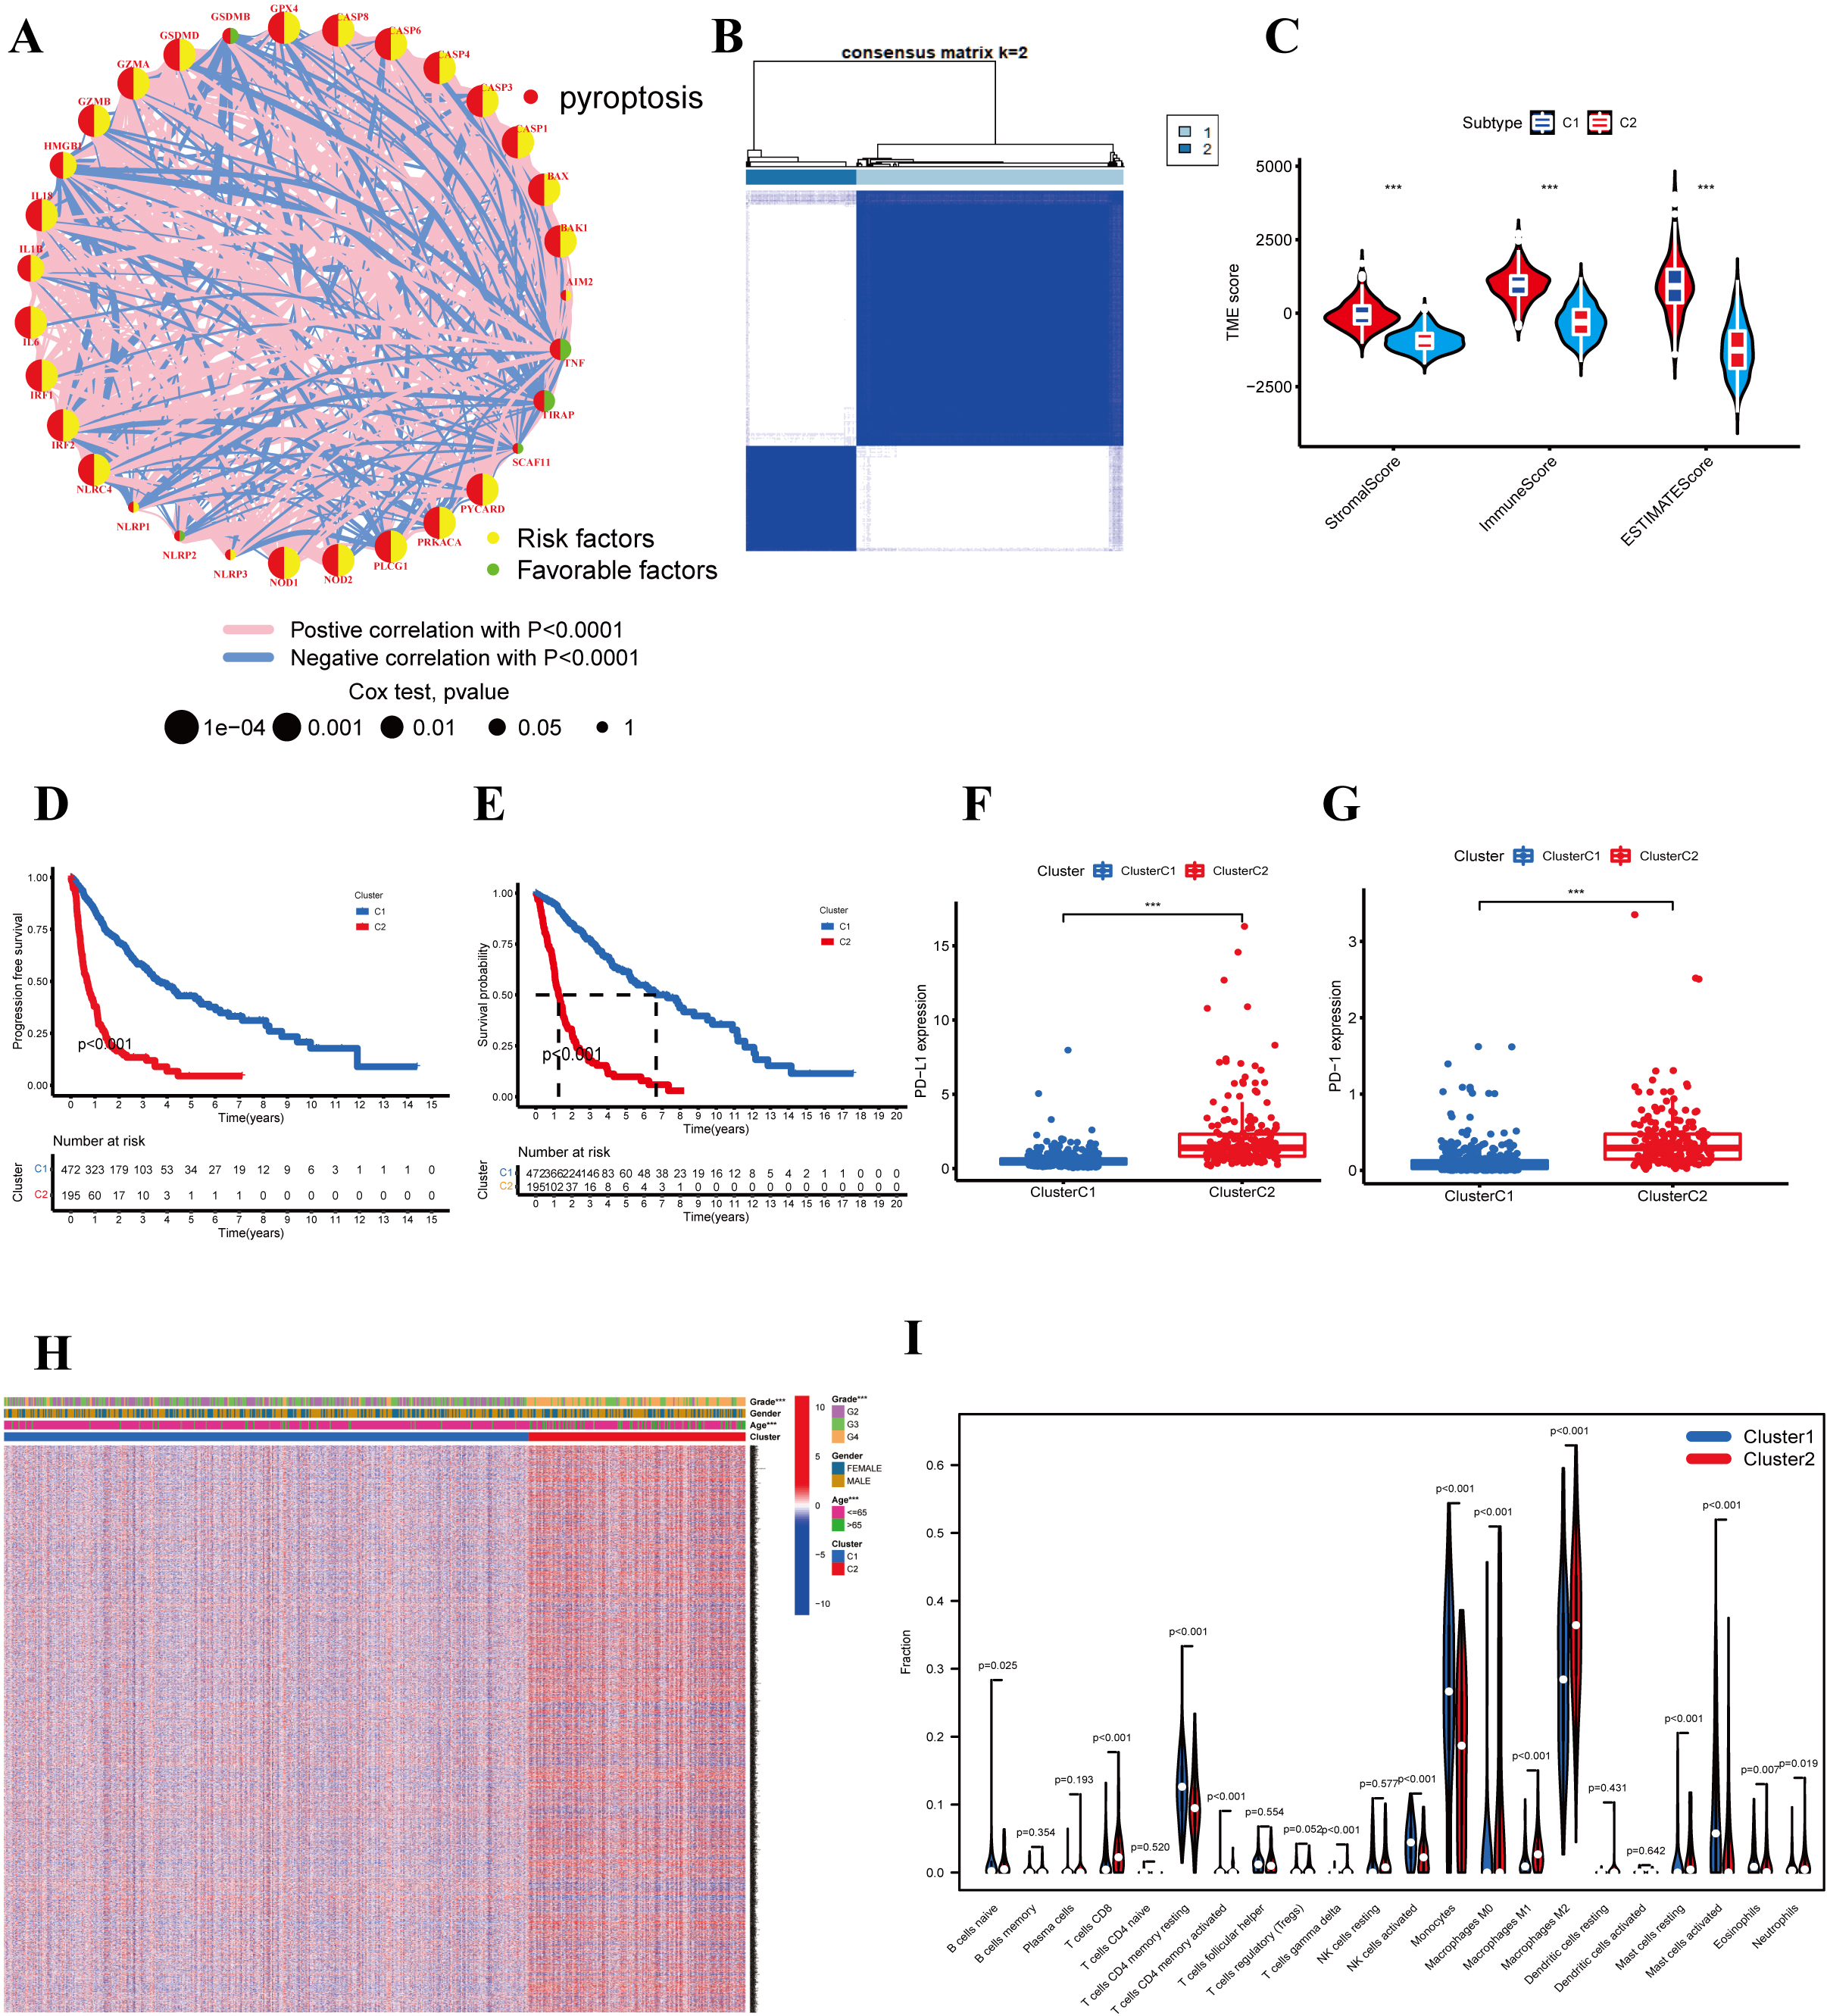
Prognostic analysis of the risk signature model. Forest plot of survival-related PRGs using univariate (A) and multivariable (B) Cox proportional hazards regression analyses. (C) Lasso regression of the three survival-related PRGs. (D) Plots of the 10-fold cross-validation in Lasso regression. (E) The risk score distribution of patients in the TCGA dataset. (F) Kaplan-Meier analysis for the OS of patients in the high-(red) and low-(blue) risk groups. (G) ROC curves for survival model predictive accuracy. (H) PCA plot of the TCGA cohort. (I) t-distributed Stochastic Neighbor Embedding (t-SNE) plot for patients. (J) Distribution of risk score, survival status, and survival time.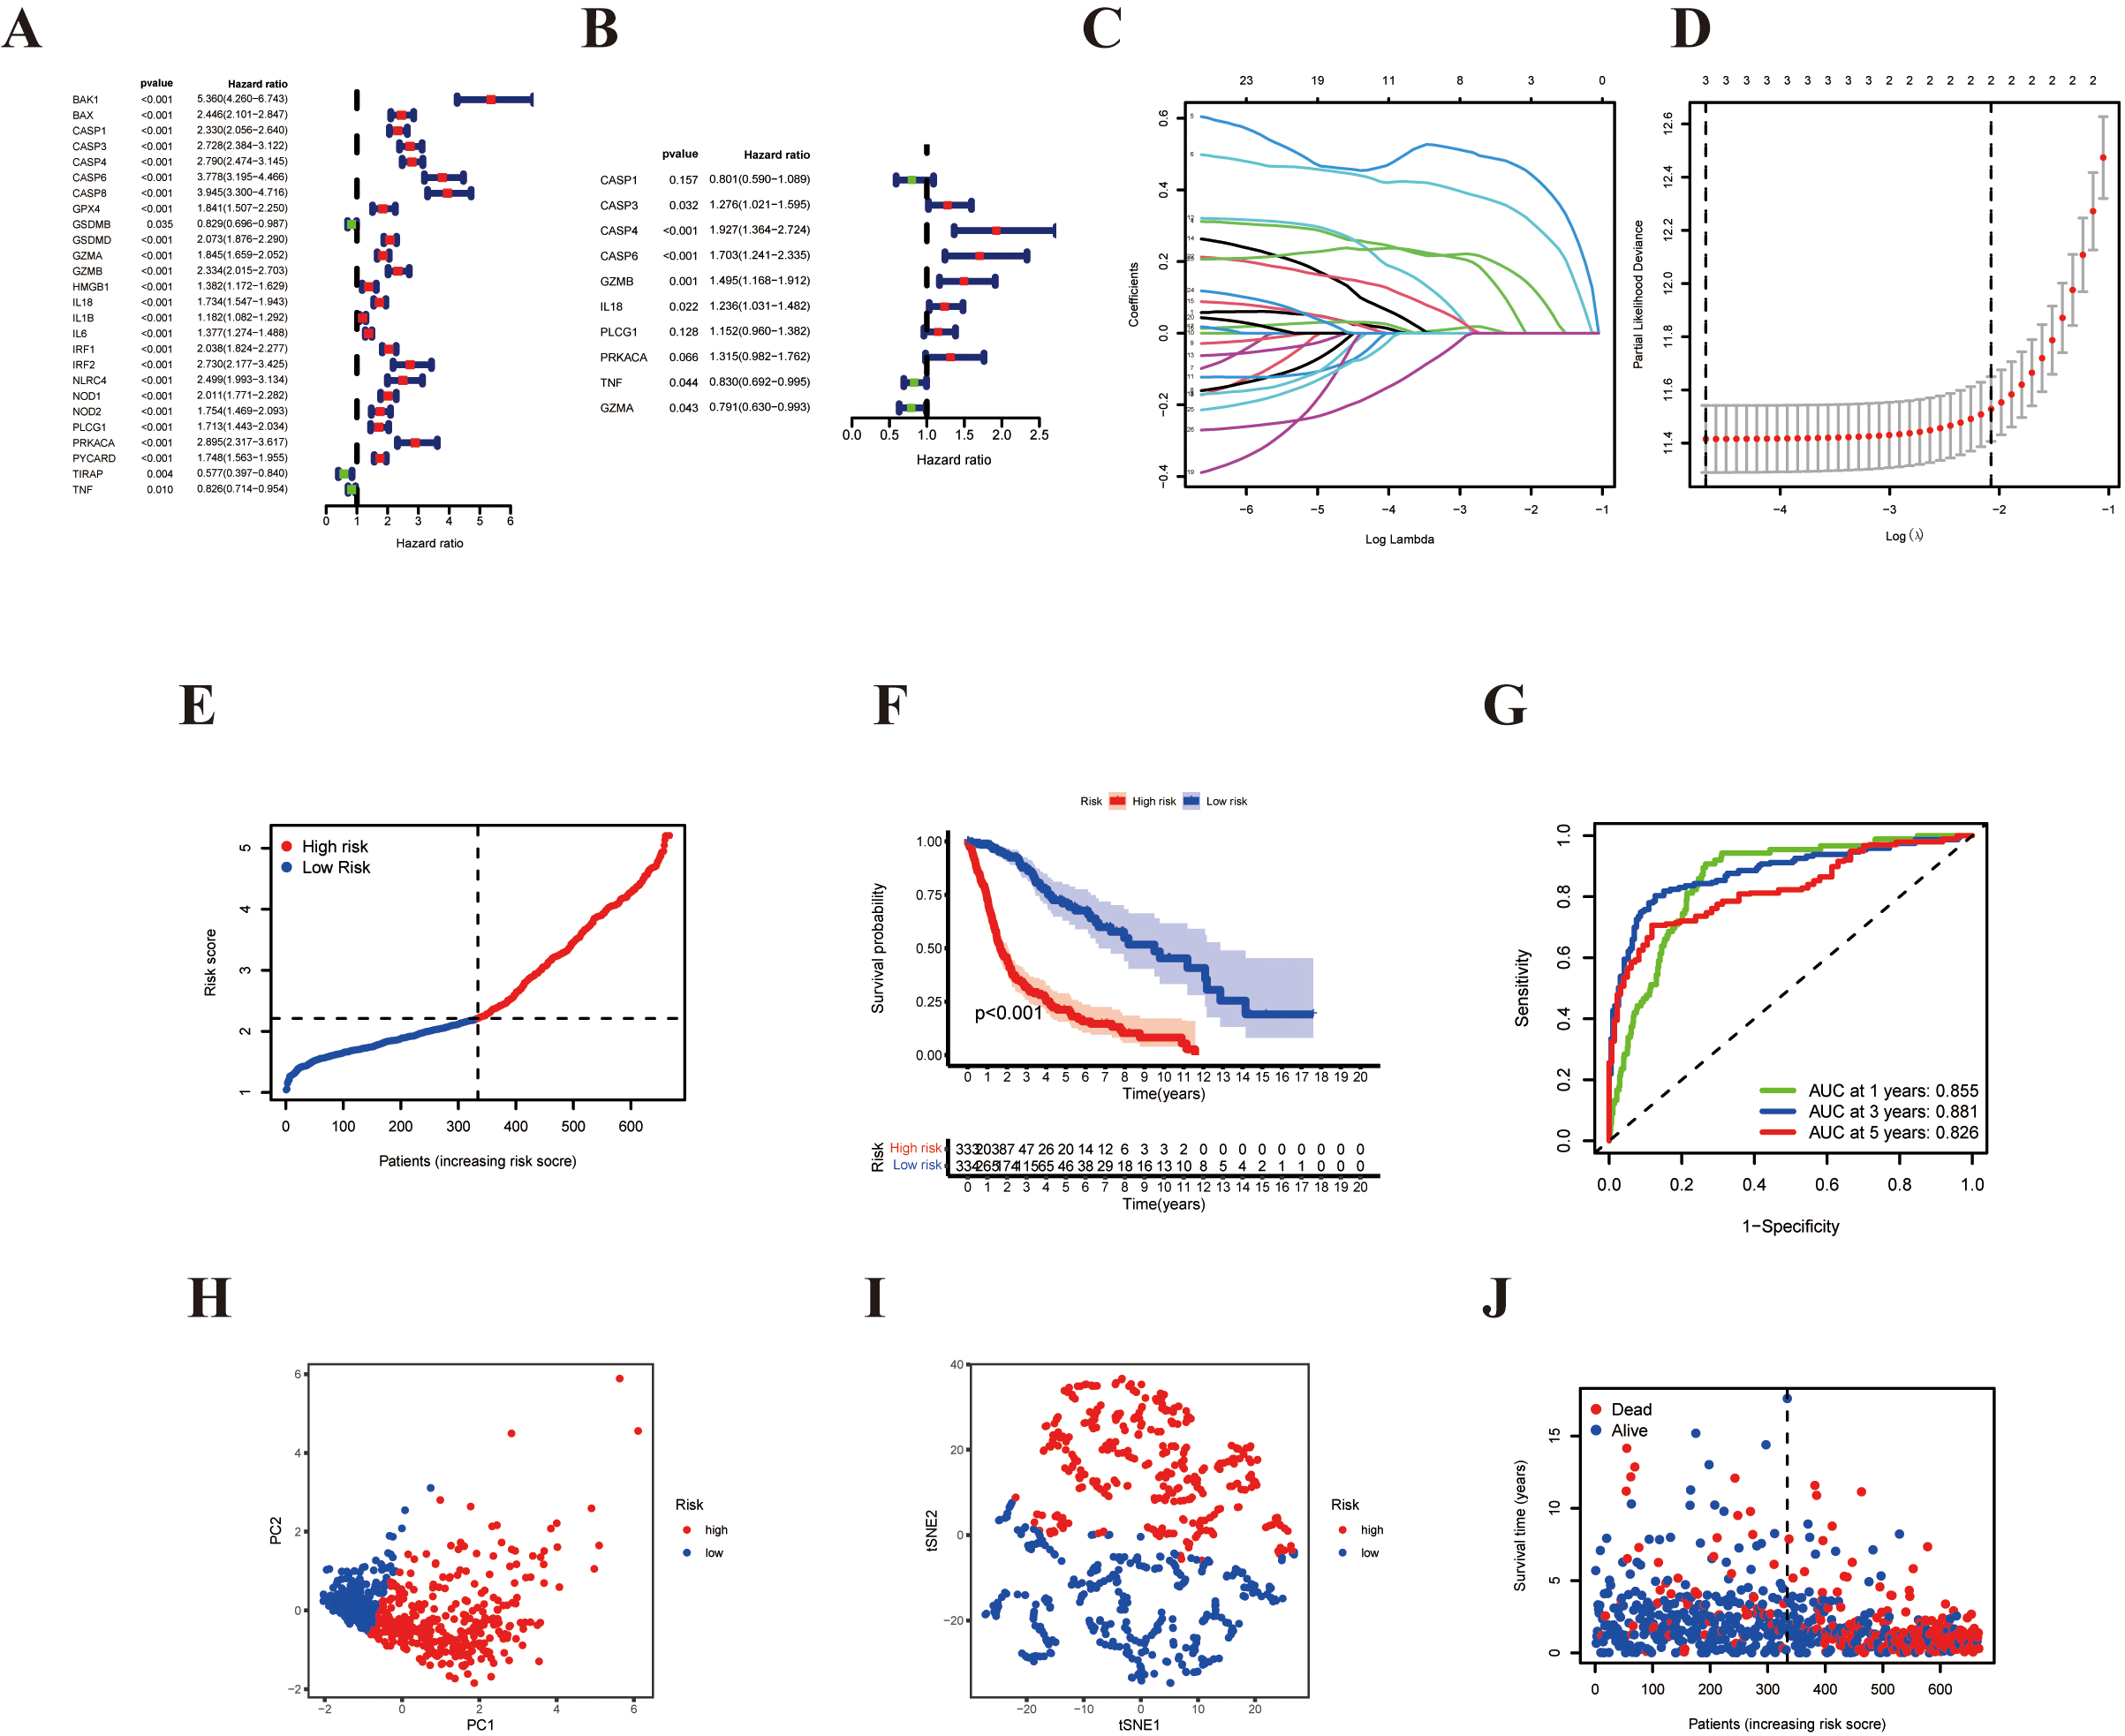
External validation of the risk signature model. (A) The risk score distribution of patients in the CGGA dataset. (B) Distribution of risk score, survival status, and survival time for each patient. (C) PCA plot of the CGGA cohort. (D) t-SNE plot for patients based on the risk score. (E) Kaplan-Meier survival analysis for the OS of glioma patients. (F) Time-dependent ROC curves.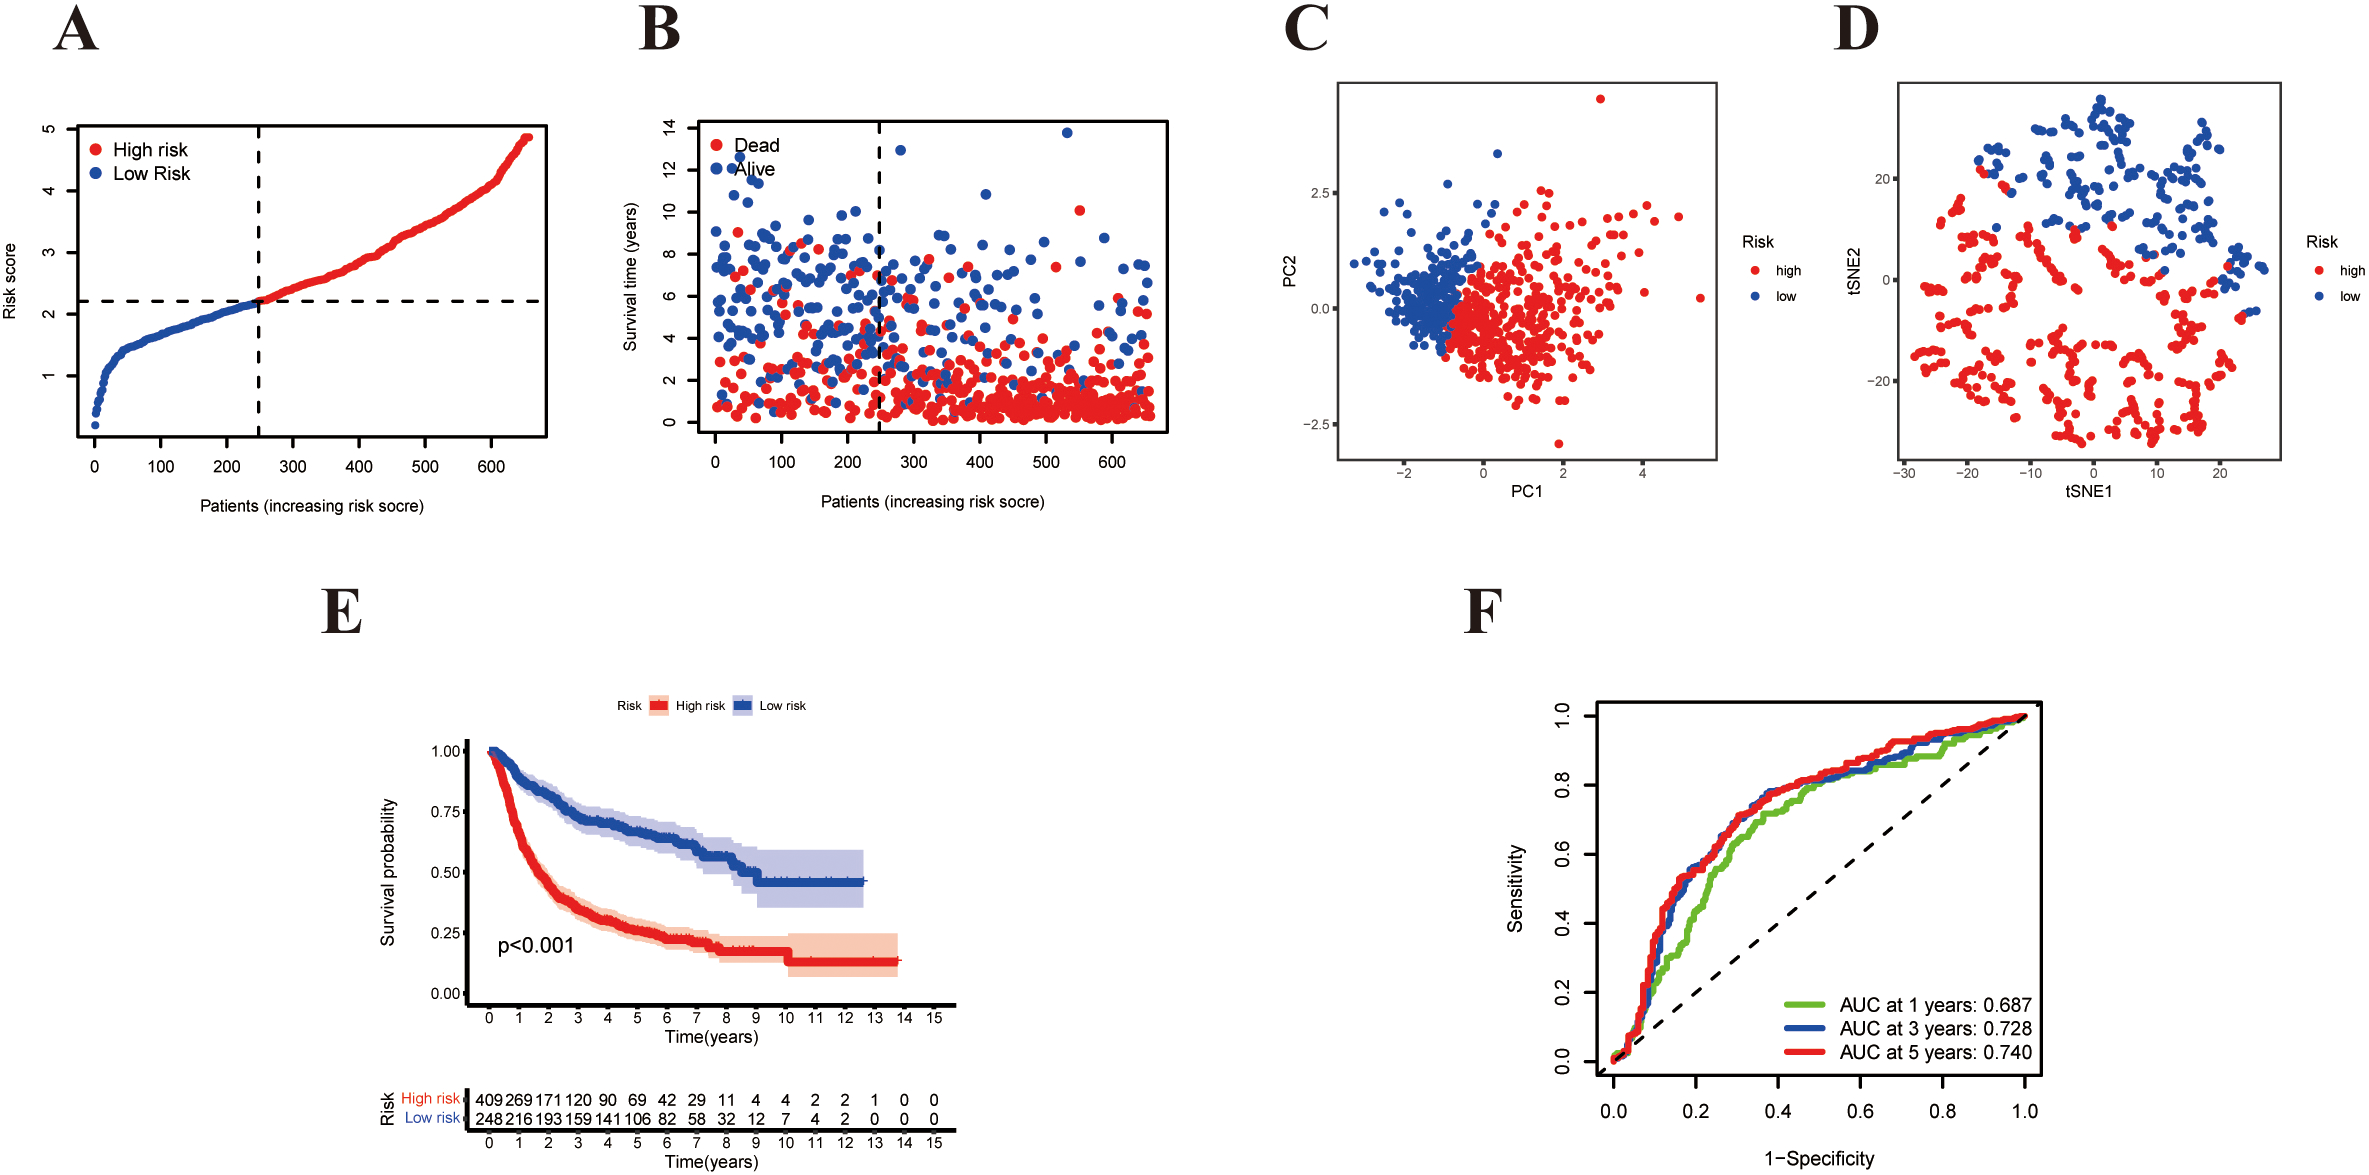
Independent prognostic analysis of clinicopathological features, risk scores, and immunohistochemical images in normal and tumor tissues. (A, Green) Univariate and (B, Red) multivariate Cox regression analysis of the correlation between clinicopathological features and pyroptosis-based risk signature in the TCGA cohort. (C) Univariate and (D) multivariate Cox regression analyses in the CGGA cohort. (E) Heatmap (red: high expression; blue: low expression) for the correlation between the risk scores and clinicopathologic characteristics. Comparison of three genes expression between tumor and normal tissues (middle) and immunohistochemistry images in tumor and normal tissues (right). (F) CASP4 (G) CASP6 (H) GZMB. (I–K) Expression levels of 3 pyroptosis-related genes of prognostic signature in glioma tissues and corresponding normal tissues by RT-PCR.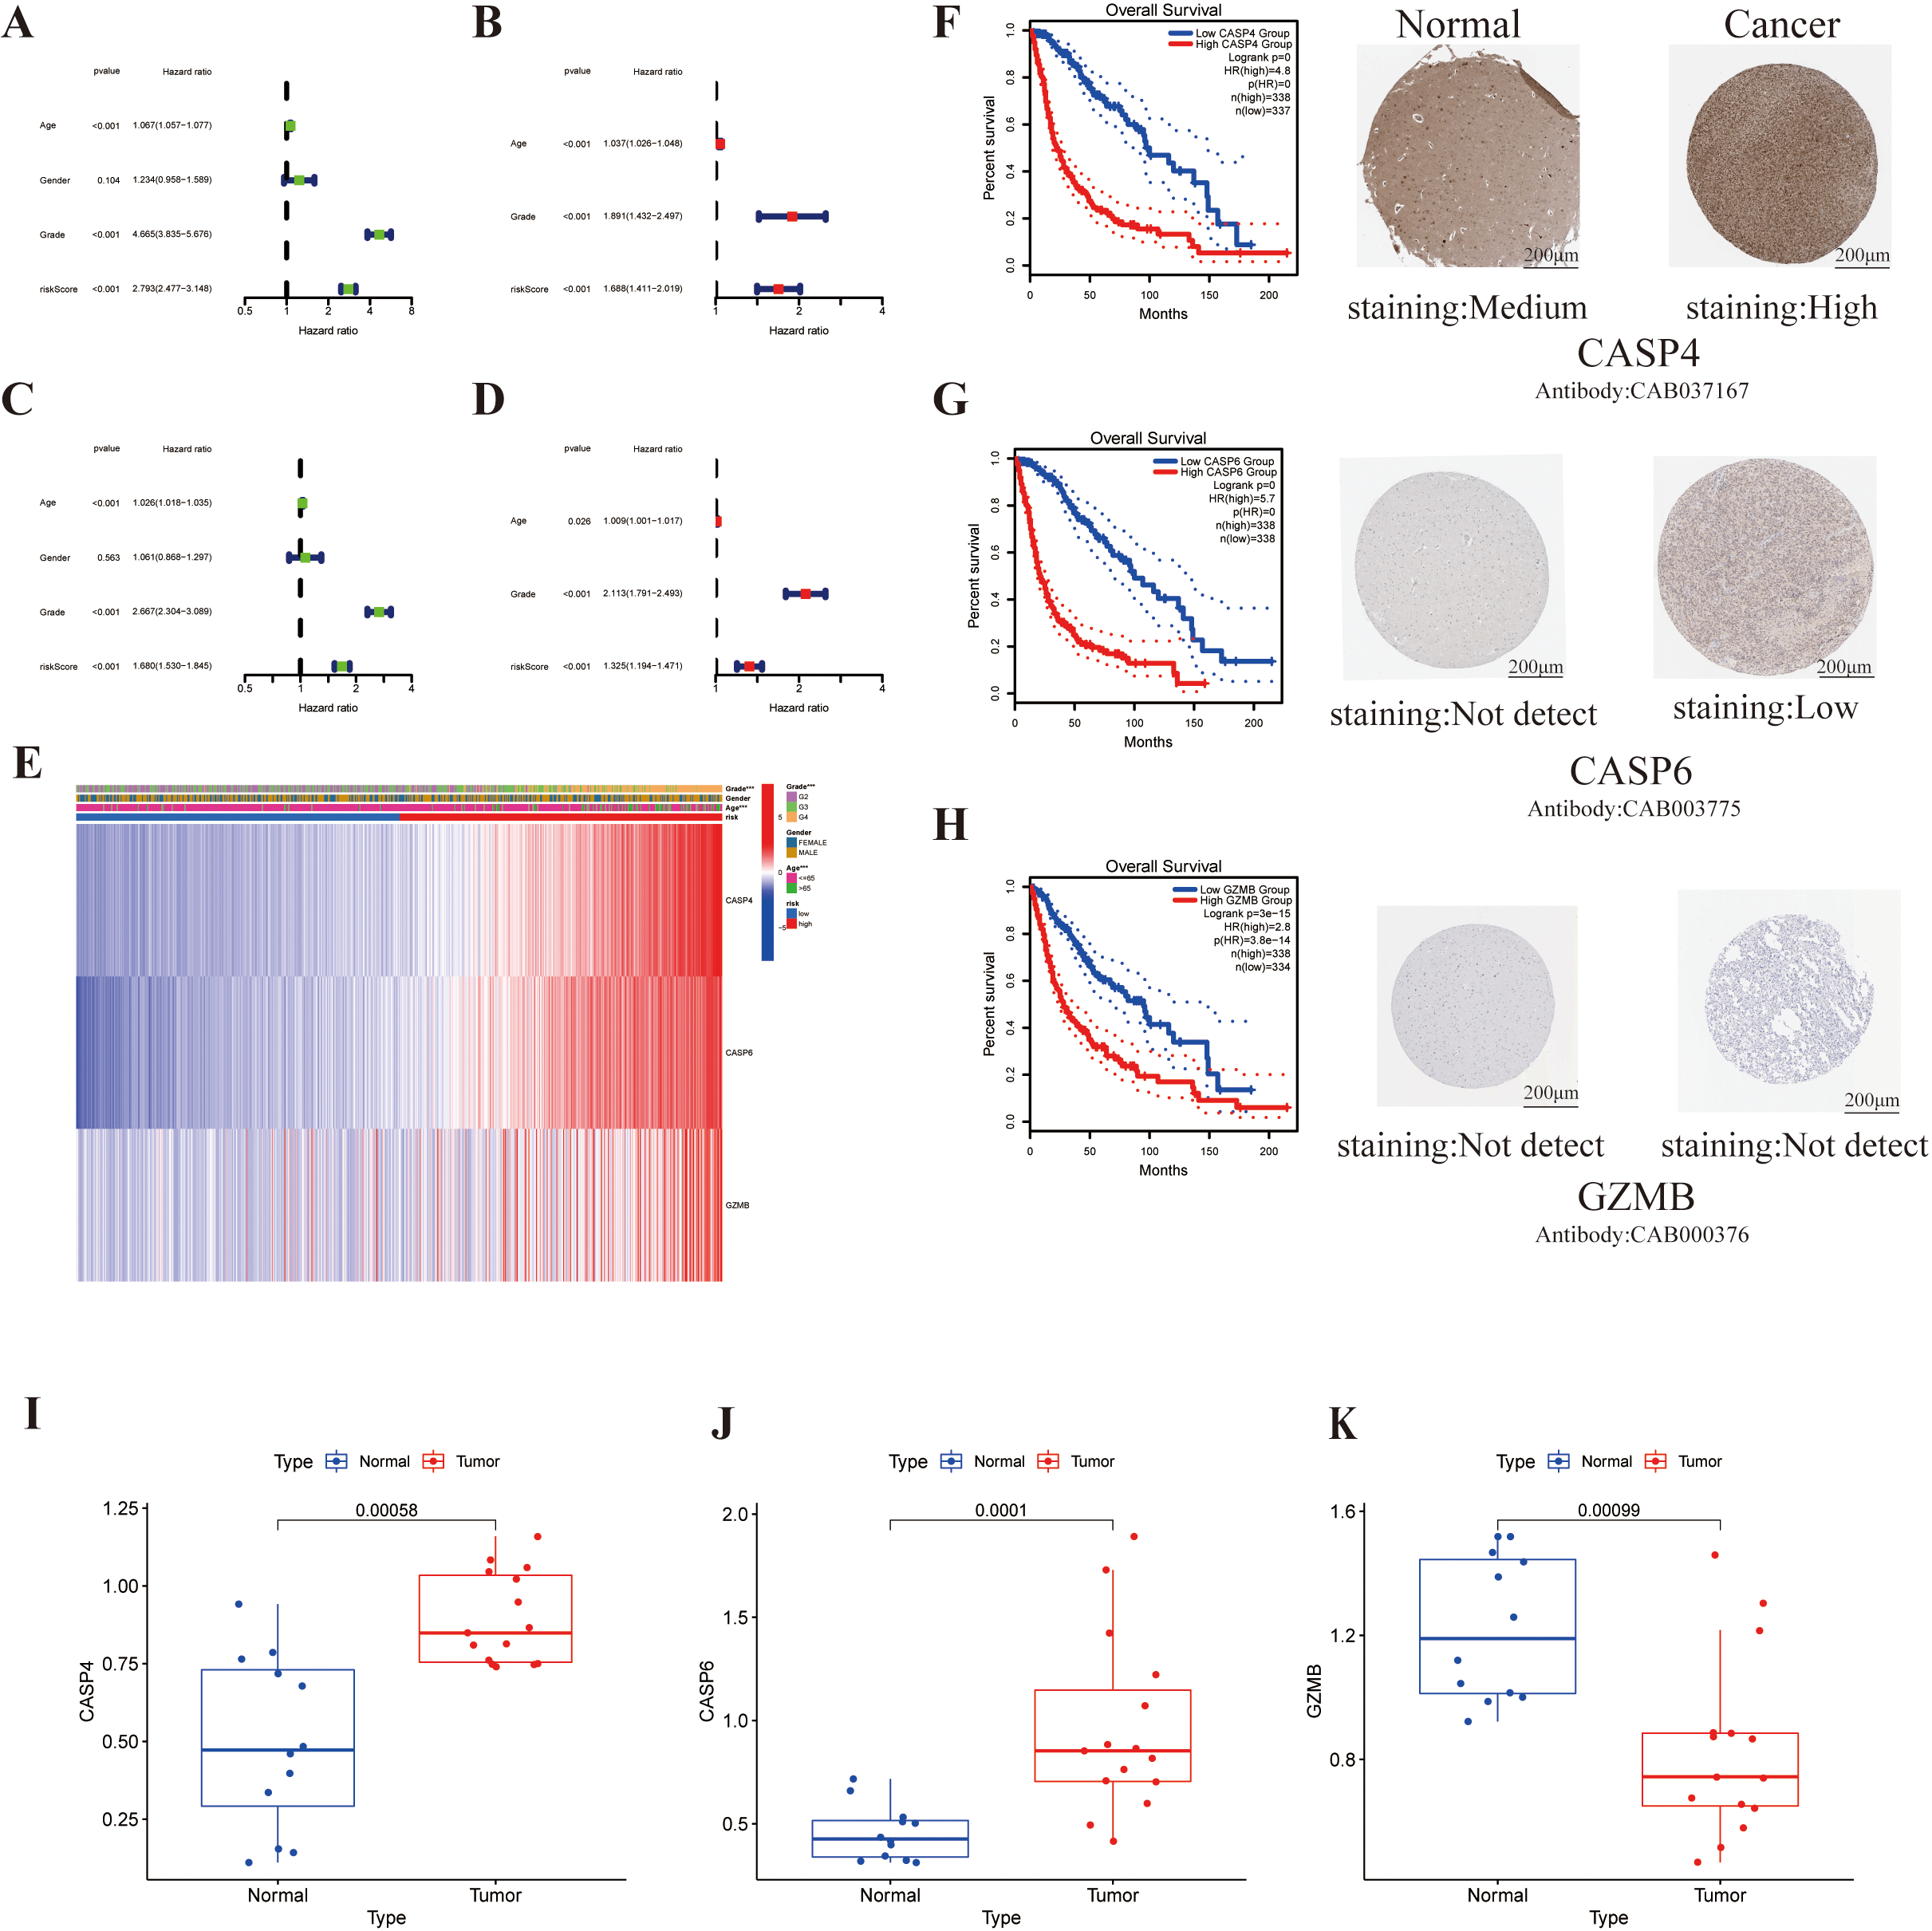
Functional enrichment analysis and comparison of the immune response between two subgroups. (A) The enriched item in GO analysis. (B) The enriched item in KEGG analysis. The larger the bubble, the more genes enriched. Box plots of the ssGSEA scores of 16 immune cells and (C) 13 immune-related pathways (D) in the TCGA cohort (red, high-risk group; green, low-risk group). (E and F) Comparison of the enrichment scores between high-risk (red box) and low- (blue box) groups in the CGGA cohort.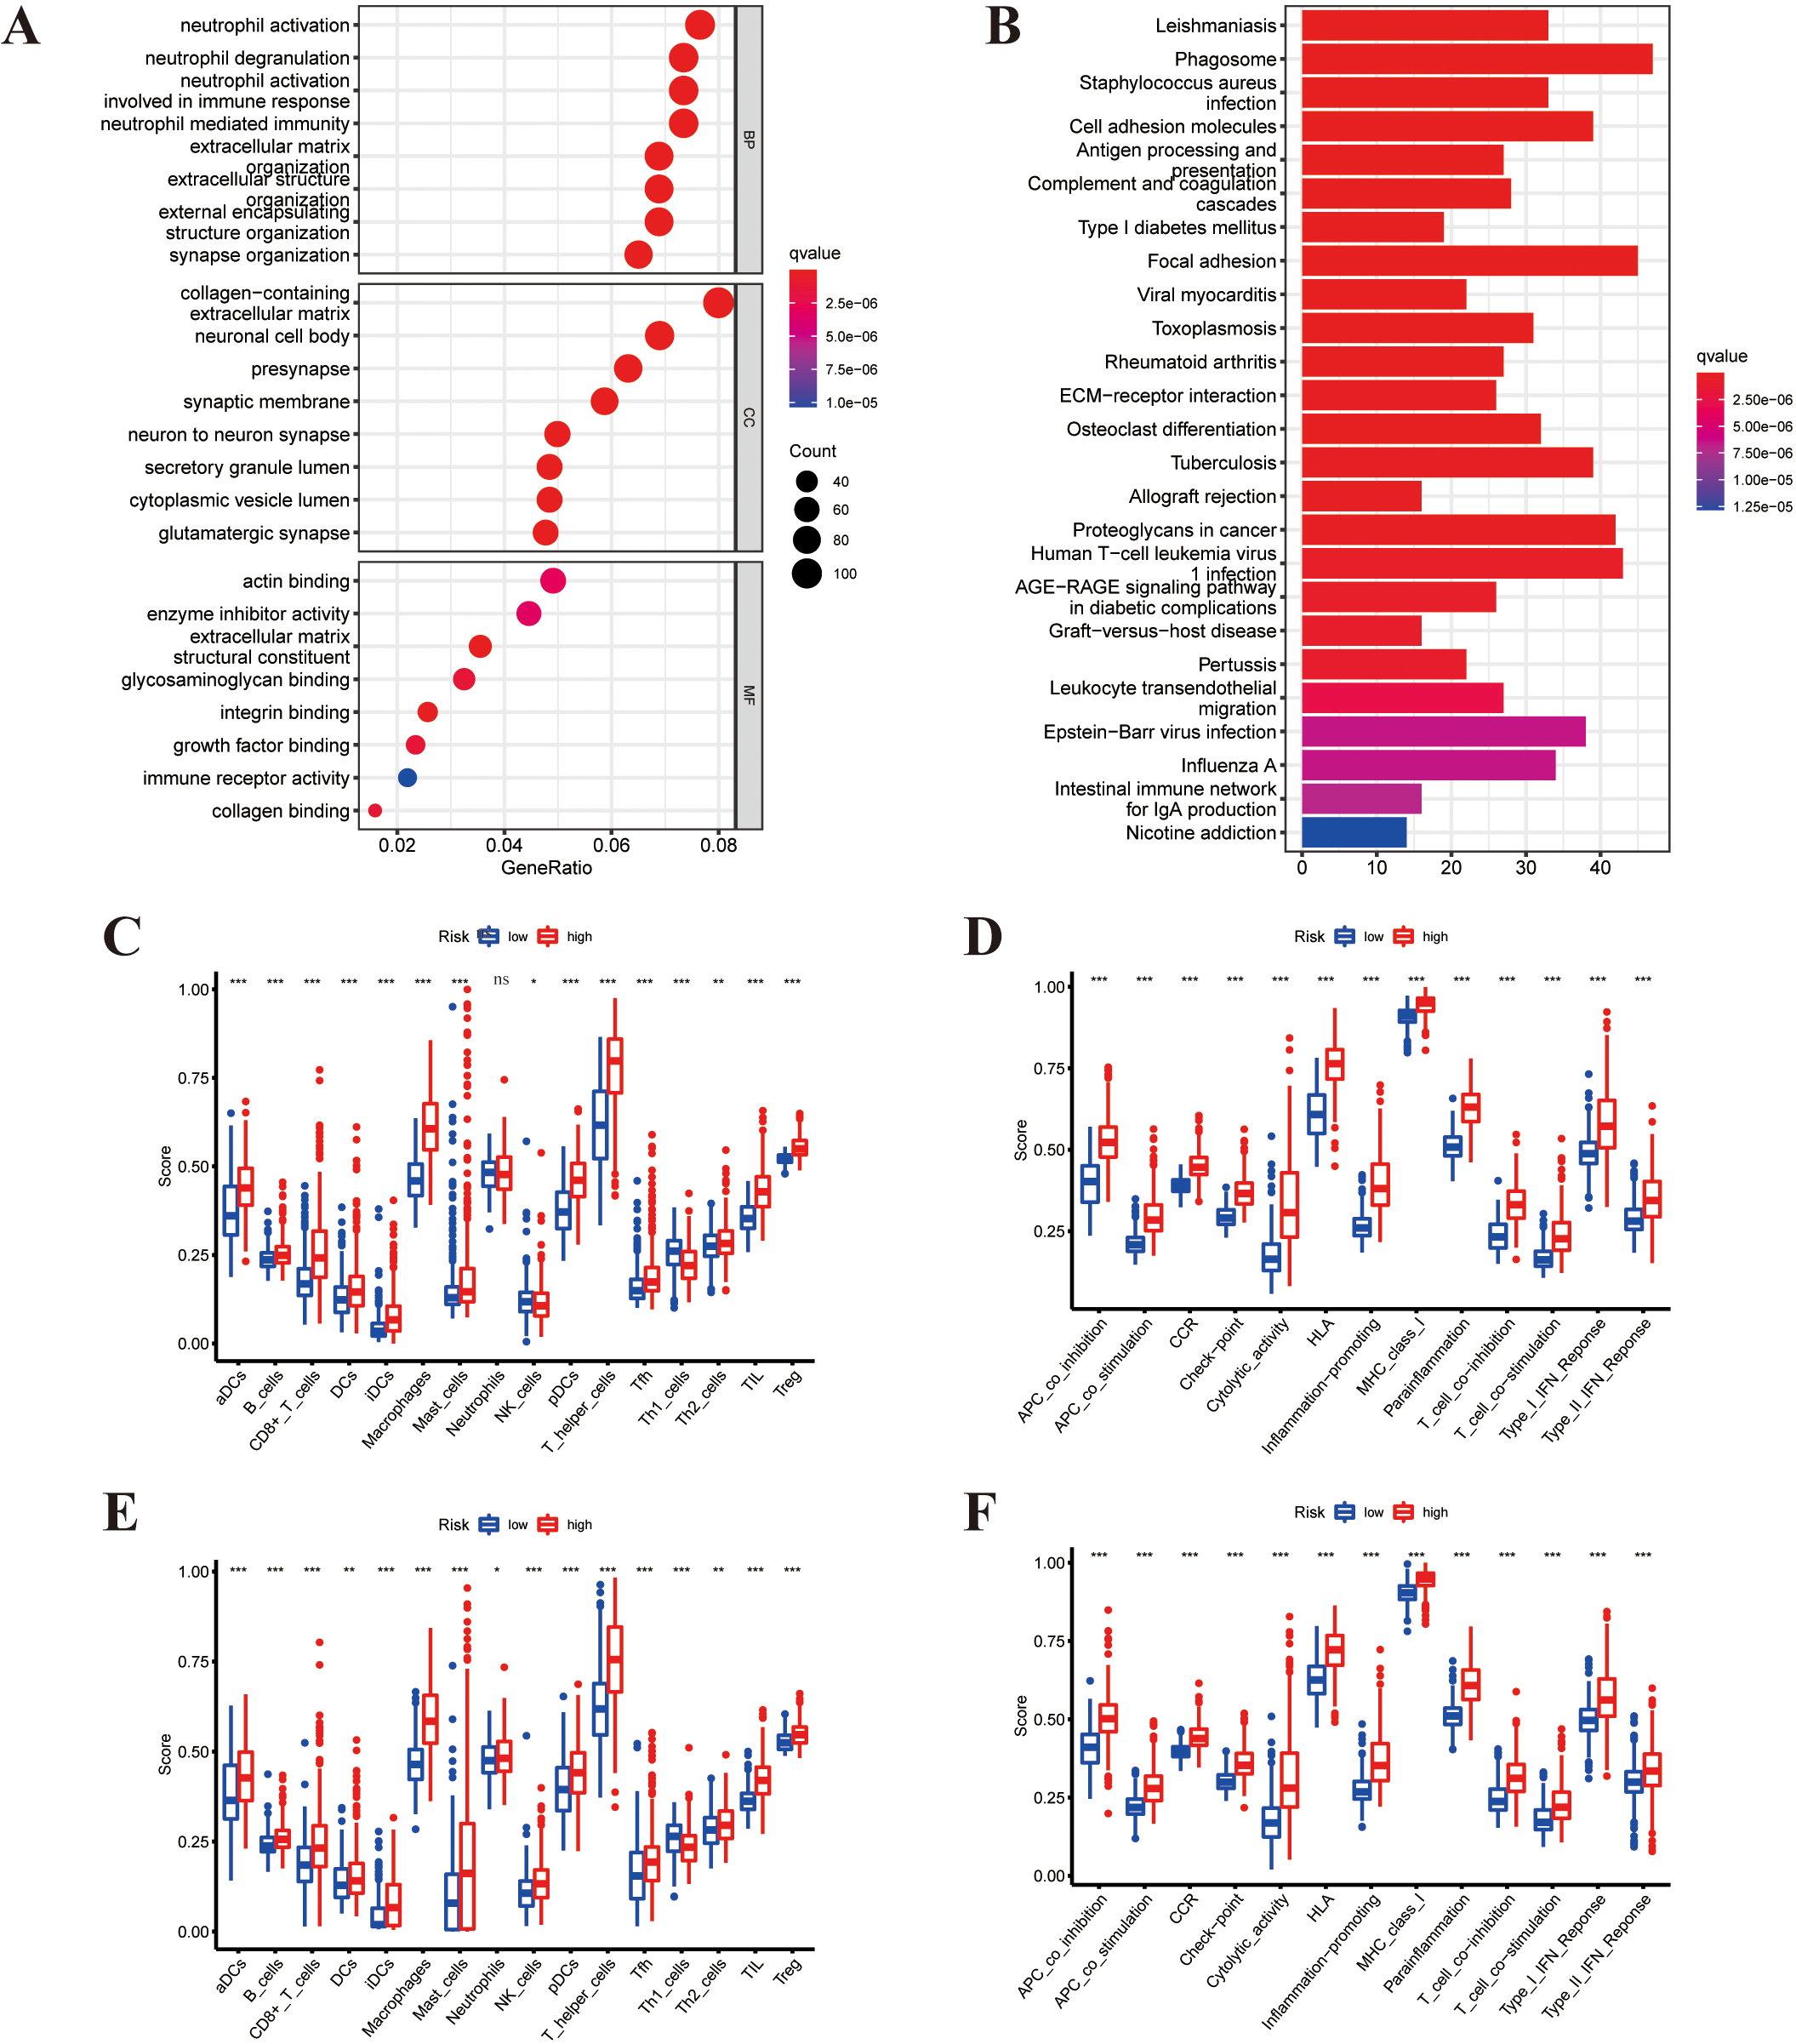
Relationship between risk score and TME, CSC index, checkpoints, mutation, and drug susceptibility. (A) Heatmap of TME based on ESTIMATE algorithms between the two groups. (B) The correlation between six types of immune checkpoint-related genes and risk score. The size of the circle indicated a relevant correlation coefficient. (C) Correlations between TIIC levels, TMB, and risk score. (D) Correlations between the abundance of 22 immune infiltrating cells and the expression of three genes. (E) Differential expression of immune checkpoint-related genes. 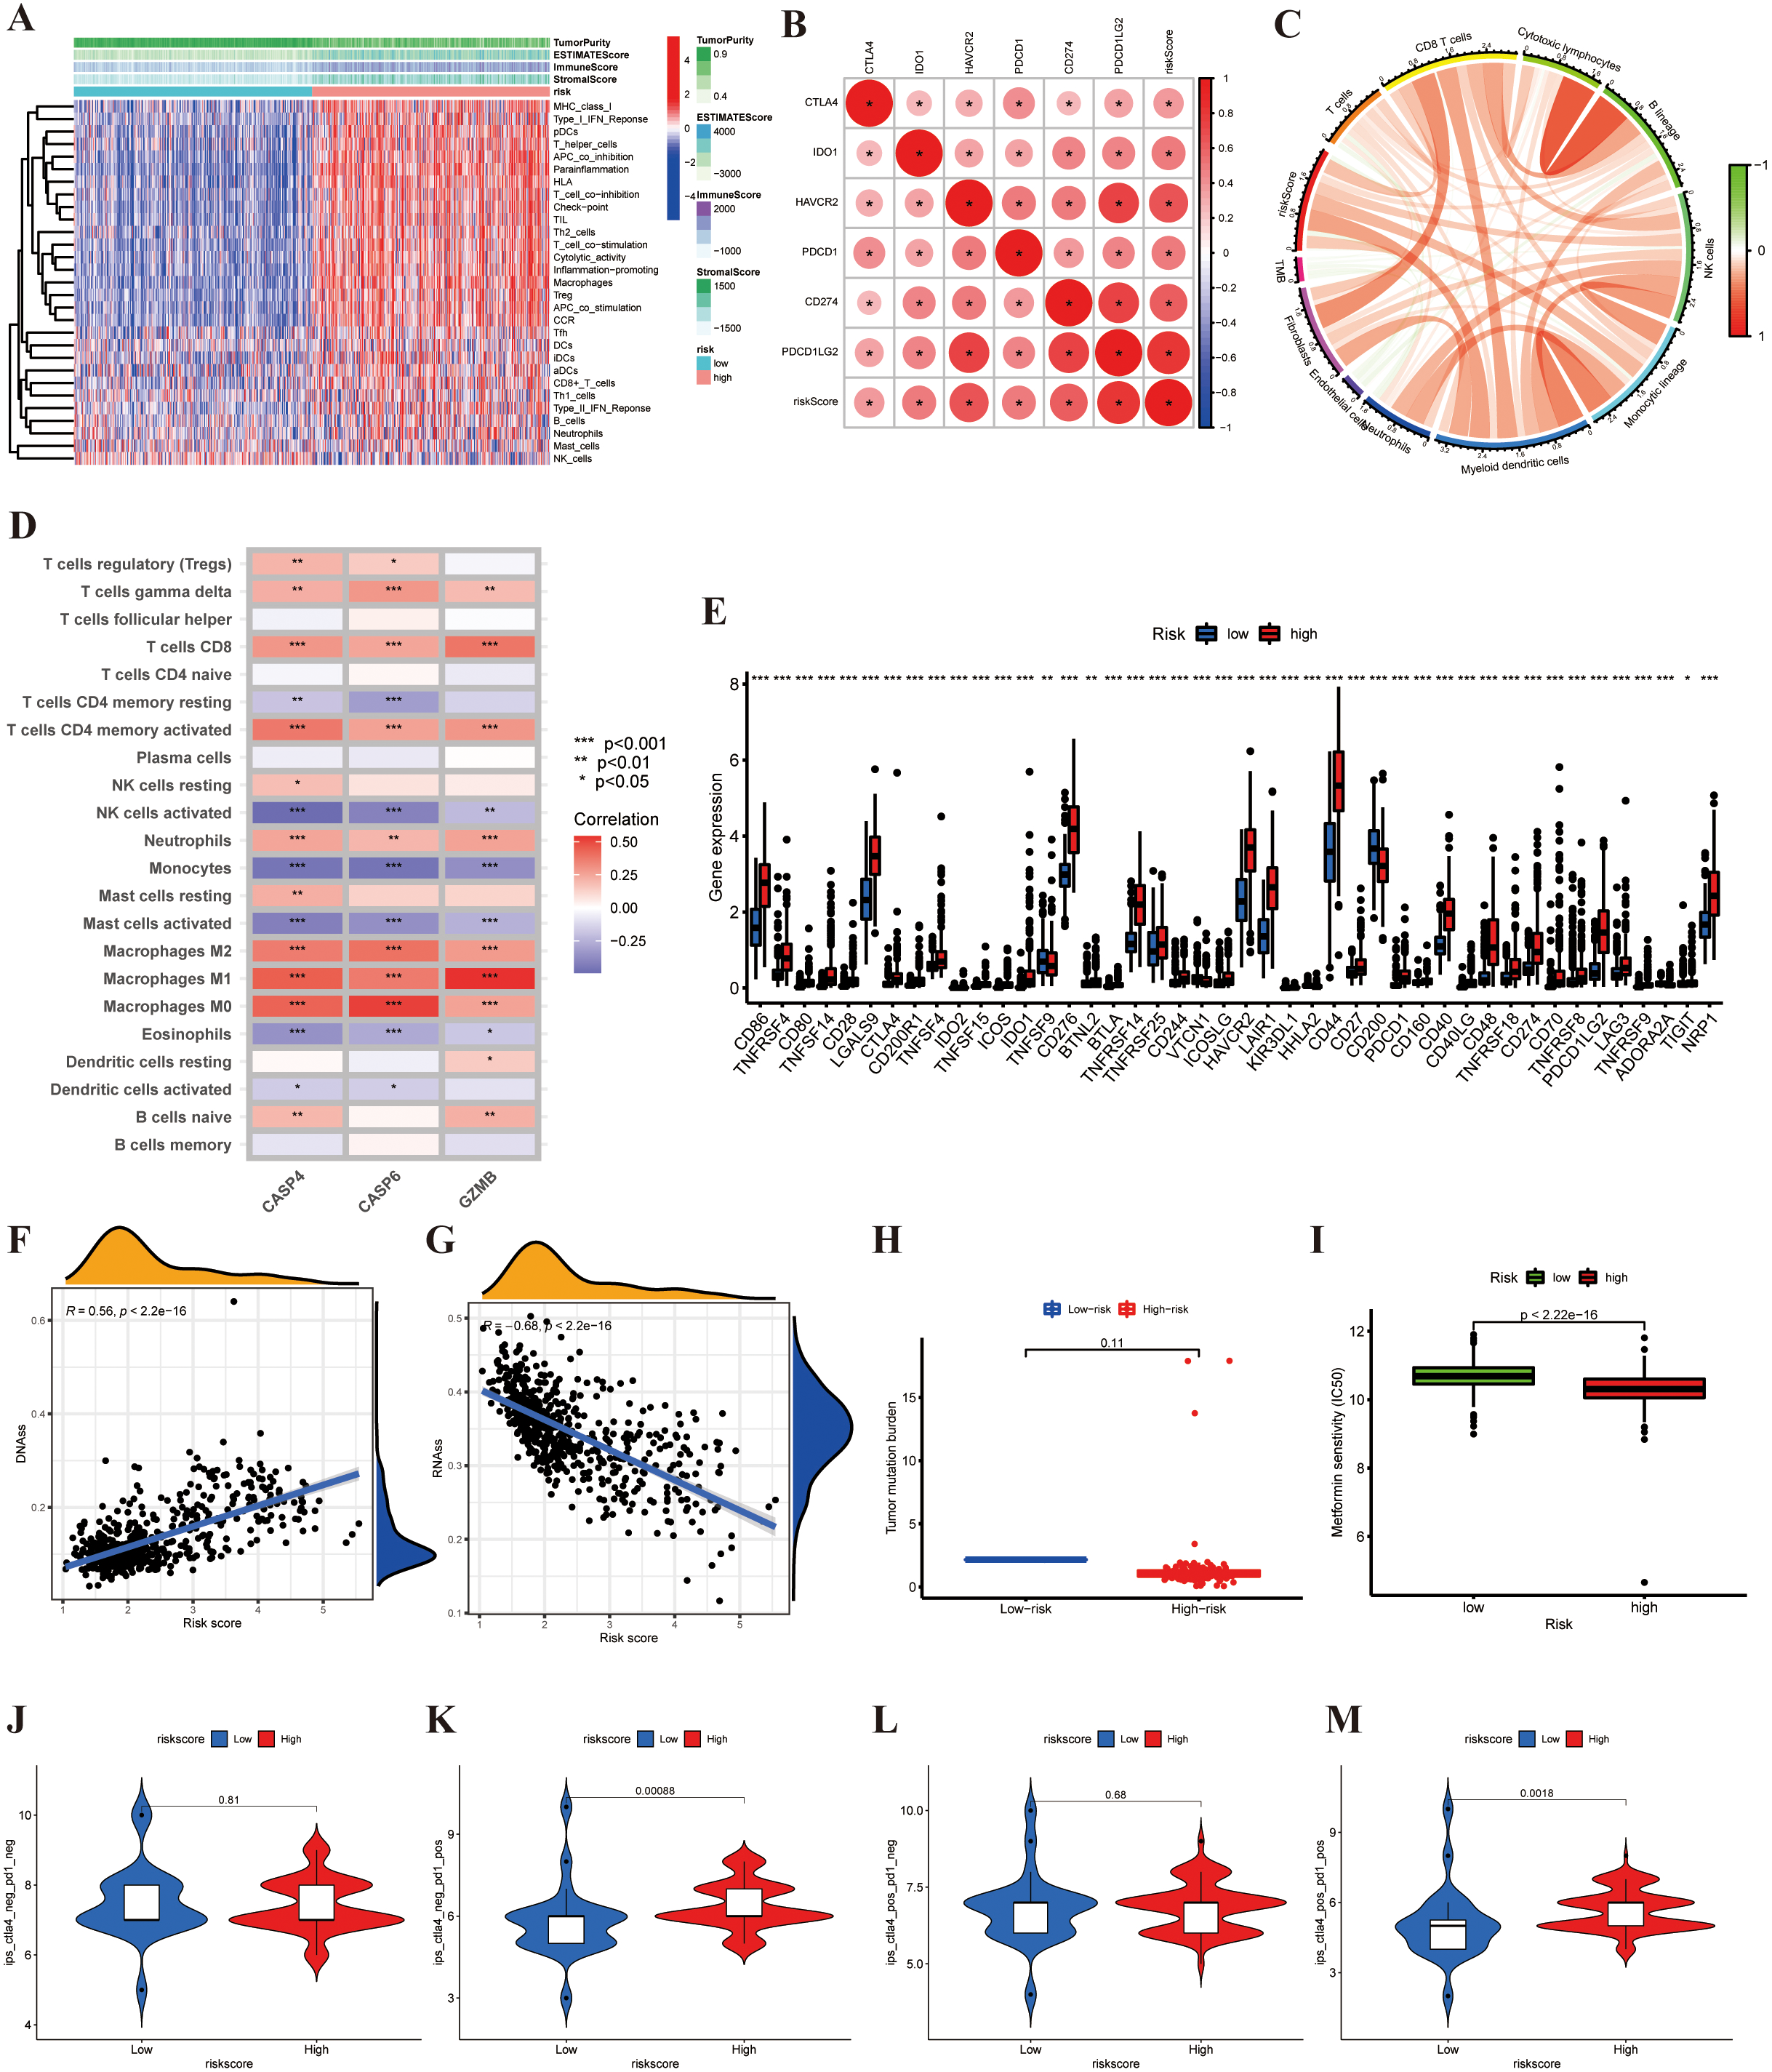
Establishment and application of the risk scoring model in CGGA cohort. (A) Prognostic nomogram for predicting the probability of 1-, 3-, and 5-year OS for patients with glioma in the CGGA cohort. (B and C) The calibration curves for the probabilities of 3- and 5- year OS. (D) The clinical ROC curves for the 5-year OS (E) Decision curve analysis for the 5-year OS.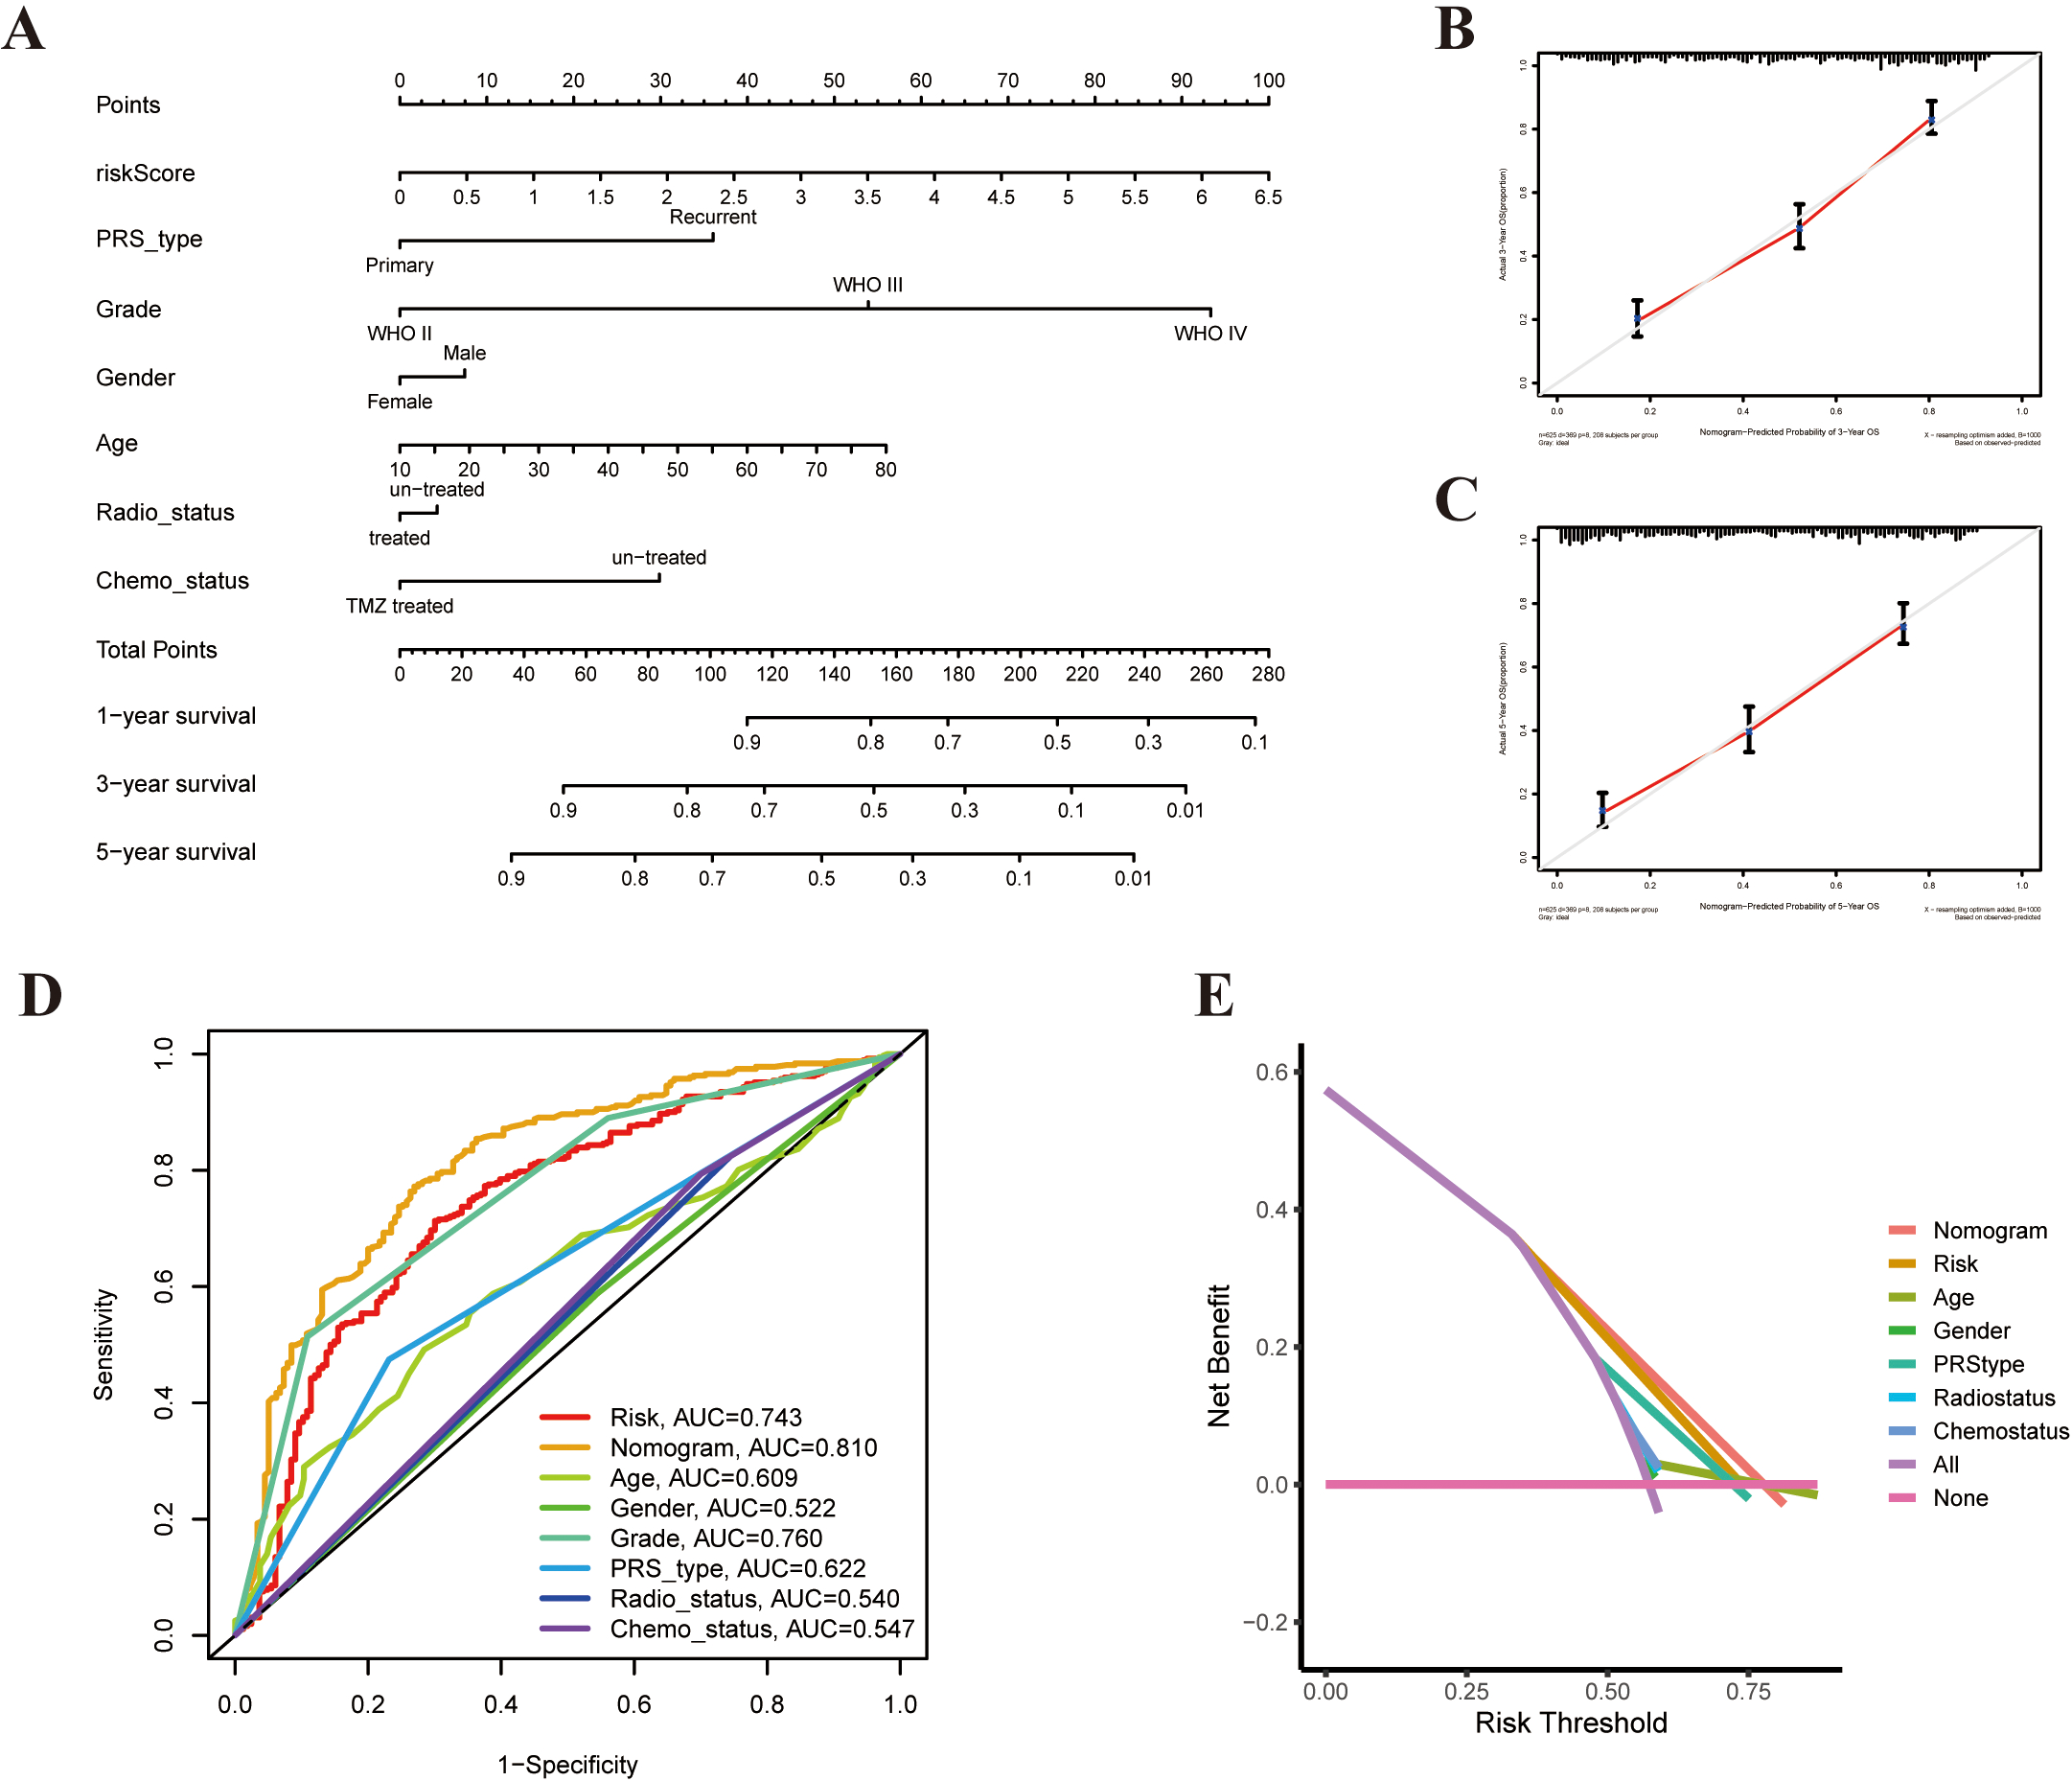
To construct a PRG-based prognostic model, we used univariate and multivariable Cox regression analyses to screen for survival-related genes. Univariate Cox regression showed the prognostic value of 26 PRGs for patients with glioma (
Lasso-penalized Cox regression analysis was applied to construct a three pyroptosis-based prognostic signature based on the optimum
Risk score
Validation of the three-gene signature in the CGGA cohort
In this study, 693 glioma samples from the CGGA cohort (CGGA-mRNAseq693-clinical) were used as the test set. Before proceeding, we normalized RNA-sequencing expression data using the same formula. Based on the median cut-off value from the TCGA cohort, patients were divided into high-risk groups (
Independent prognostic value of the PRGs
We performed univariate and multivariable Cox proportional hazard regression to assess whether the pyroptosis risk model could be an independent prognostic factor for patients with glioma. Univariate Cox regression analysis showed that age, grade, and risk score had correlations with prognosis. A higher pyroptosis risk score resulted in a worse prognosis (HR: 2.793, 95% CI: 2.477–3.148,
Furthermore, we used immunohistochemistry to test CASP4, CASP6, and GZMB protein expression in glioma tissues and their counterparts, and the results were compared with the three DEG expression data from TCGA. We found that CASP4 proteins were highly expressed in glioma tissues than in normal brain tissues. Conversely, there was no CASP6 or GBMB staining in the glioma (Fig. 5F–H).
The expression levels of three prognostic genes were measured by RT-qPCR in five glioma tissues and five adjacent normal tissues. By comparing the expression levels of the corresponding genes in glioma tissue and normal tissue (Fig. 5I–K), it can be concluded that the expression of CASP4 and CASP6 genes were up-regulated, whereas that of the GZMB gene was down-regulated.
Functional enrichment and immune characteristics analyses
To clarify the function of PRGs between the two subgroups derived from the risk model, we used the “limma” R package with
To investigate the relationship between immune cell infiltration and risk score in the prognostic risk model, the scores of 16 immune cell subsets and 13 immune-related pathways or functions were quantified between immune status and risk scores using the ssGSEA method in R package GSVA. Remarkably, the enrichment scores of distinct immune cell types (aDCs, B_cells, CD8
Comprehensive analysis of the risk-score in glioma
Thereafter, we examined whether risk-score had any guiding value for clinical prevention and treatment, especially promising immunotherapy. Tumor microenvironment analysis revealed that the ImmuneScore and StromalScore from the ESTIMATE algorithm increased as the risk score increased, whereas the TumorPurity exhibited the opposite trend (Fig. 7A). These results revealed that the high-score group induced a stronger cellular immune response. The correlation between six types of immune checkpoint-related genes and risk score was analyzed using the CIBERSORTx. Among them, CD274, PDCD1LG2, and HAVCR2 were significantly positively correlated with risk score (Fig. 7B). Figure 7C shows that the risk score had a positive correlation with tumor-infiltrating immune cells (TIICs). We investigated the relationship between the abundance of 22 immune infiltrating cells and the expression of three genes in the proposed model. We observed that CD8 T cells, activated CD4 memory T cells, monocytes, and macrophages were significantly associated with three genes (Fig. 7D). Additionally, we discovered that immune checkpoint-related genes, including PD-1, PD-L1, and CTLA-4, were overexpressed in high-risk patients, compared with low-risk patients (Fig. 7E).
Additionally, we synthesized the CSC index values and risk scores to evaluate the potential correlation between risk score and CSC in glioma. A linear correlation analysis between the CSC index and risk score was performed (Fig. 7F and G). We discovered that risk score was positively associated with DNAss index (
Building a prognostic nomogram model for glioma
Considering the inconvenience of risk scores in the clinical application of patients with glioma, a nomogram clinical model was established to predict survival probability (Fig. 8A). The predictors included risk-score, PRS type, radio status, chemo status, grade, patient age, and gender. The predictive model indicated that the 3-year and 5-year OS rates could be predicted comparatively well in the CGGA cohort (Fig. 8B and C). Subsequently, clinical ROC and DCA analysis were performed to evaluate the effectiveness of the nomogram model. The AUC of the nomogram was 0.810 for 5-year survival, indicating potential nomogram clinical model values of PRGs (Fig. 8D and E).
Discussion
This study revealed the overall alterations in PRGs at both genetic and transcriptional levels in glioma. Two distinct molecular subtypes of glioma were identified based on 33 DEGs. Patients with subtype C2 had worse OS and PFS and more advanced clinicopathological features than patients with subtype C1. Significant differences in TME characteristics were observed between the two subtypes. Moreover, differences in mRNA transcriptome among different subtypes of pyroptosis were significantly correlated with PRGs. To further evaluate the prognostic characteristics of these PRGs, a three-PRG signature was constructed through Lasso Cox regression analysis. An external dataset was used to verify its performance. We extracted the DEGs between the different risk groups and found that these DEGs were mainly associated with immune responses. Pyroptosis may possibly modulate the function of TME based on the results of the functional enrichment analysis. In this study, a lower risk score was associated with immune activation, whereas a higher risk score was associated with immune inhibition. We compared the activities of immune cell infiltration and immune-related pathways in the two groups and found that the immune cell infiltration levels and activation pathways of the low risk group were generally lower than those of the high-risk group. Thereafter, we found that the characteristics of the abundance of the TIICs and the tumor microenvironment differed significantly between the different risk groups. These findings indicate the key role of PRGs in the development and progression of glioma.
Recent studies have proven that B cells are involved in immune activity [33, 34]. Petitprez et al. [35] reported that B cell enrichment was associated with resistance to anti-PD-1 checkpoint blockade in soft-tissue sarcomas and was an independent predictor for prolonged survival. Moreover, Helmink et al. [34] showed that the expression of B cell-related genes MZB1 and IGLL5 in patients sensitive to ICB was significantly higher than those in non-responders. However, the infiltration of B cells was correlated to a poor response to chemotherapeutics in patients with glioma [36]. In medulloblastoma and pediatric glioblastoma, small molecule B-cell inhibitors combined with targeted chemotherapeutic agents can enhance tumor cell killing [37]. These studies indicated that B cells may provide a new strategy for anti-tumor immunotherapy. In this study, a significant difference was observed in B cell infiltration among the two molecular subtypes and different risk score groups. The lower relative proportion of B cells in subtype C1 and low risk score with the favorable OS compared with subtype C2. Consequently, tumor-infiltrating B cells promoted tumor progression in glioma, which is consistent with the results of previous studies. Tanaka et al. [38] reported that Treg infiltration can inhibit the anti-tumor immune response, which was correlated with an unsatisfied prognosis. This finding is consistent with our findings that patients with high risk scores have more Tregs in TME than patients with low-risk scores. These findings suggest that PRGs may be used as predictors of immunotherapy response and clinical outcome in glioma. Therefore, we established the effective and robust prognostic risk score, and regression analysis demonstrated its predictive power. The transcription levels of three PRGs included in the risk score in glioma samples were explored. Patients in the high- and low-risk groups showed significantly different clinical parameters, prognosis, immune checkpoints, TME, CSC index, and drug susceptibility. In the end, we constructed a quantitative nomogram model by integrating the clinicopathological characteristics and risk scores, which further facilitated the clinical application of the risk score and improved the performance. This model can be used to stratify the prognosis of patients with glioma, understand the molecular and functional mechanism of glioma, and provide extensive new insights for targeted therapy.
Currently, although pyroptosis and apoptosis have certain similarities and crossover mechanisms, they have not been fully studied yet. Multiple modes of cell death comprise numerous complex systems of order that both frequently coexist and interact with one another during tumor development [39]. For example, caspase-6 (CASP6) in our model is considered to be a key regulator in apoptotic signaling pathways. Apoptosis usually features a complete plasma membrane with no content release and no direct inflammatory response, whereas pyroptosis possess the opposite characteristics [40]. Apoptosis can be transformed into pyroptosis under the stimulation of pathogens. Pyroptosis plays several roles in tumors. It can reduce tumor growth and angiogenesis in liver cancer, skin carcinoma, and colorectal cancer [41, 42], but it has a double-way effect mechanism in breast cancer [43]. Previous studies revealed that CASP6 is the regulator of apoptosis. CASP6 is a critical regulator of innate immunity, host defense, and inflammasome activation. Besides, Zheng et al. showed that the pyroptosis phenomenon of macrophages infected with seasonal influenza A virus (IAV) was reduced by conditional knockout of CASP6, including the lysis of caspase-1 and reduction of IL-1
The comprehensive analysis of pyroptosis revealed a wide range of regulatory mechanisms, which affect the clinicopathological characteristics, prognosis, and tumor immune microenvironment. We also determined the therapeutic potential of PRGs in cancer-stem-cell-targeted immunotherapy. Our study highlights the clinical implications of pyroptosis and provides a novel insight for guiding precise immunotherapy strategies in patients with glioma. Pyroptosis blockers are being developed; however, the evidence supporting their use are insufficient. Therefore, our signature identifies potential new therapeutic targets for immunotherapy, which may be an effective complementary treatment direction to improve the clinical outcome and prognosis of patients with glioma.
Our study had some limitations. All data management and statistical analyses were performed based on data from online databases solely, and all glioma samples used in this study were retrospectively collected. Therefore, large-scale prospective cohort studies and further in-depth experimental studies are needed to extend and confirm these findings.
Author contributions
Conception: Jiarong He.
Interpretation or analysis of data: Jiarong He.
Preparation of the manuscript: Wen Zhou and Mingming Zhang.
Revision for important intellectual content: Mingming Zhang.
Supervision: Mingming Zhang.
Funding
This work was funded by the Fundamental Research Funds for the Central Universities of Central South University (Grant No. 2022ZZTS0952), and the Natural Science Foundation of Hunan Province (Grant No. 2022JJ70059).
Supplementary data
The supplementary files are available to download from http://dx.doi.org/10.3233/CBM-220362.
sj-docx-1-cbm-10.3233_CBM-220362.docx - Supplemental material
Supplemental material, sj-docx-1-cbm-10.3233_CBM-220362.docx
sj-xlsx-1-cbm-10.3233_CBM-220362.xlsx - Supplemental material
Supplemental material, sj-xlsx-1-cbm-10.3233_CBM-220362.xlsx
Footnotes
Acknowledgments
The authors would like to thank all members of the Laboratory of Neurosurgery at the Second Xiangya Hospital for technical assistance.
Conflict of interest
All authors declare no conflicts of interest.