
Abstract
BACKGROUND:
MicroRNAs regulating mRNA expression by targeting at mRNAs is known constructive in tumor occurrence, immune escape, and metastasis.
OBJECTIVE:
This research aims at finding negatively regulatory miRNA-mRNA pairs in esophageal squamous cell carcinoma (ESCC).
METHODS:
GENE expression data of The Cancer Genome Atlas (TCGA) and GEO database were employed in differently expressed RNA and miRNA (DE-miRNAs/DE-mRNAs) screening. Function analysis was conducted with DAVID-mirPath. MiRNA-mRNA axes were identified by MiRTarBase and TarBase and verified in esophageal specimen by real-time reverse transcription polymerase chain reaction (RT-qPCR). Receiver operation characteristic (ROC) curve and Decision Curve Analysis (DCA) were applied in miRNA-mRNA pairs predictive value estimation. Interactions between miRNA-mRNA regulatory pairs and immune features were analyzed using CIBERSORT.
RESULTS:
Combining TCGA database, 4 miRNA and 10 mRNA GEO datasets, totally 26 DE-miRNAs (13 up and 13 down) and 114 DE-mRNAs (64 up and 50 down) were considered significant. MiRTarBase and TarBase identified 37 reverse regulation miRNA-mRNA pairs, 14 of which had been observed in esophageal tissue or cell line. Through analysis of RT-qPCR outcome, miR-106b-5p/KIAA0232 signature was chosen as characteristic pair of ESCC. ROC and DCA verified the predictive value of model containing miRNA-mRNA axis in ESCC. Via affecting mast cells, miR-106b-5p/KIAA0232 may contribute to tumor microenvironment.
CONCLUSIONS:
The diagnostic model of miRNA-mRNA pair in ESCC was established. Their complex role in ESCC pathogenesis especially tumor immunity was partly disclosed.
Introduction
As is estimated by World Health Organization, esophageal cancer became the seventh most common cancer and the sixth leading cause of cancer-associated deaths globally in 2020, making esophagus cancer a worldwide health problem [1]. Esophagus tumors are mainly divided into esophageal adenocarcinoma (EA) and esophageal squamous cell carcinoma (ESCC) according to histological origin [2]. Esophageal squamous cell carcinoma accounts for the majority of newly diagnosed esophageal cancer in the world [3]. Despite the swift development in diagnosis and treatment of ESCC, the overall 5-year survival rate ranged from 20% to 35% [4]. Thus, it is of significance to define novel biomarker for better diagnosis and prognosis prediction.
MicroRNAs (MiRNAs) are a serious of small non-coding RNAs involved in tumor occurrence, progression, metastasis and immune escape [5]. By incompletely binding with 3’-untranslated regions of message RNA (mRNA), miRNAs usually act as suppresser in mRNA translation and stability [6]. Dysregulation of miRNAs exert profound effects on expression of proto-oncogene and anti-oncogene, which is generally accepted as the cause of cancer [7]. Besides, miRNAs can serve as biomarkers in prognosis prediction. For instance, a risk model including miR-4521, miR-3682-3p, miR-1269a, and 7 target mRNAs were established to estimate prognosis in esophagus cancer patients [8]. Therefore, biomarkers such as miRNA/mRNA signature and miRNA targeting therapies are promising in future cancer research.
Contemporarily, databases obtaining gene expression patterns and non-coding RNA profiling from both high throughput sequencing and microarrays provide an overview of mRNA and miRNA abundance in tumor. Bioinformatic analysis based on large sample points out the direction for further experimental research. Previous studies absorbed a few Gene Expression Omnibus (GEO) datasets to define differently expressed miRNAs (DE-miRNAs) and miRNA-mRNA axes for ESCC. Regulatory networks such as miR-139-5p targeting at RAP1B and miR-1 targeting at FN1 were identified as crucial axes in ESCC [9, 10]. However, few studies contained both large amount of GEO datasets and The Cancer Genome Atlas (TCGA) database. In present study, we collected miRNA and mRNA expression profile of esophageal carcinoma and normal esophagus tissue from 14 Gene Expression Omnibus (GEO) datasets (
Materials and methods
Data acquisition from databases
Information pertaining to the selected GEO datasets for esophagus cancer
Information pertaining to the selected GEO datasets for esophagus cancer
The flow chart showed the steps for identifying the negatively miRNA-mRNA regulatory pairs and conducting extensive analysis of pairs in esophageal squamous cell carcinoma cancer.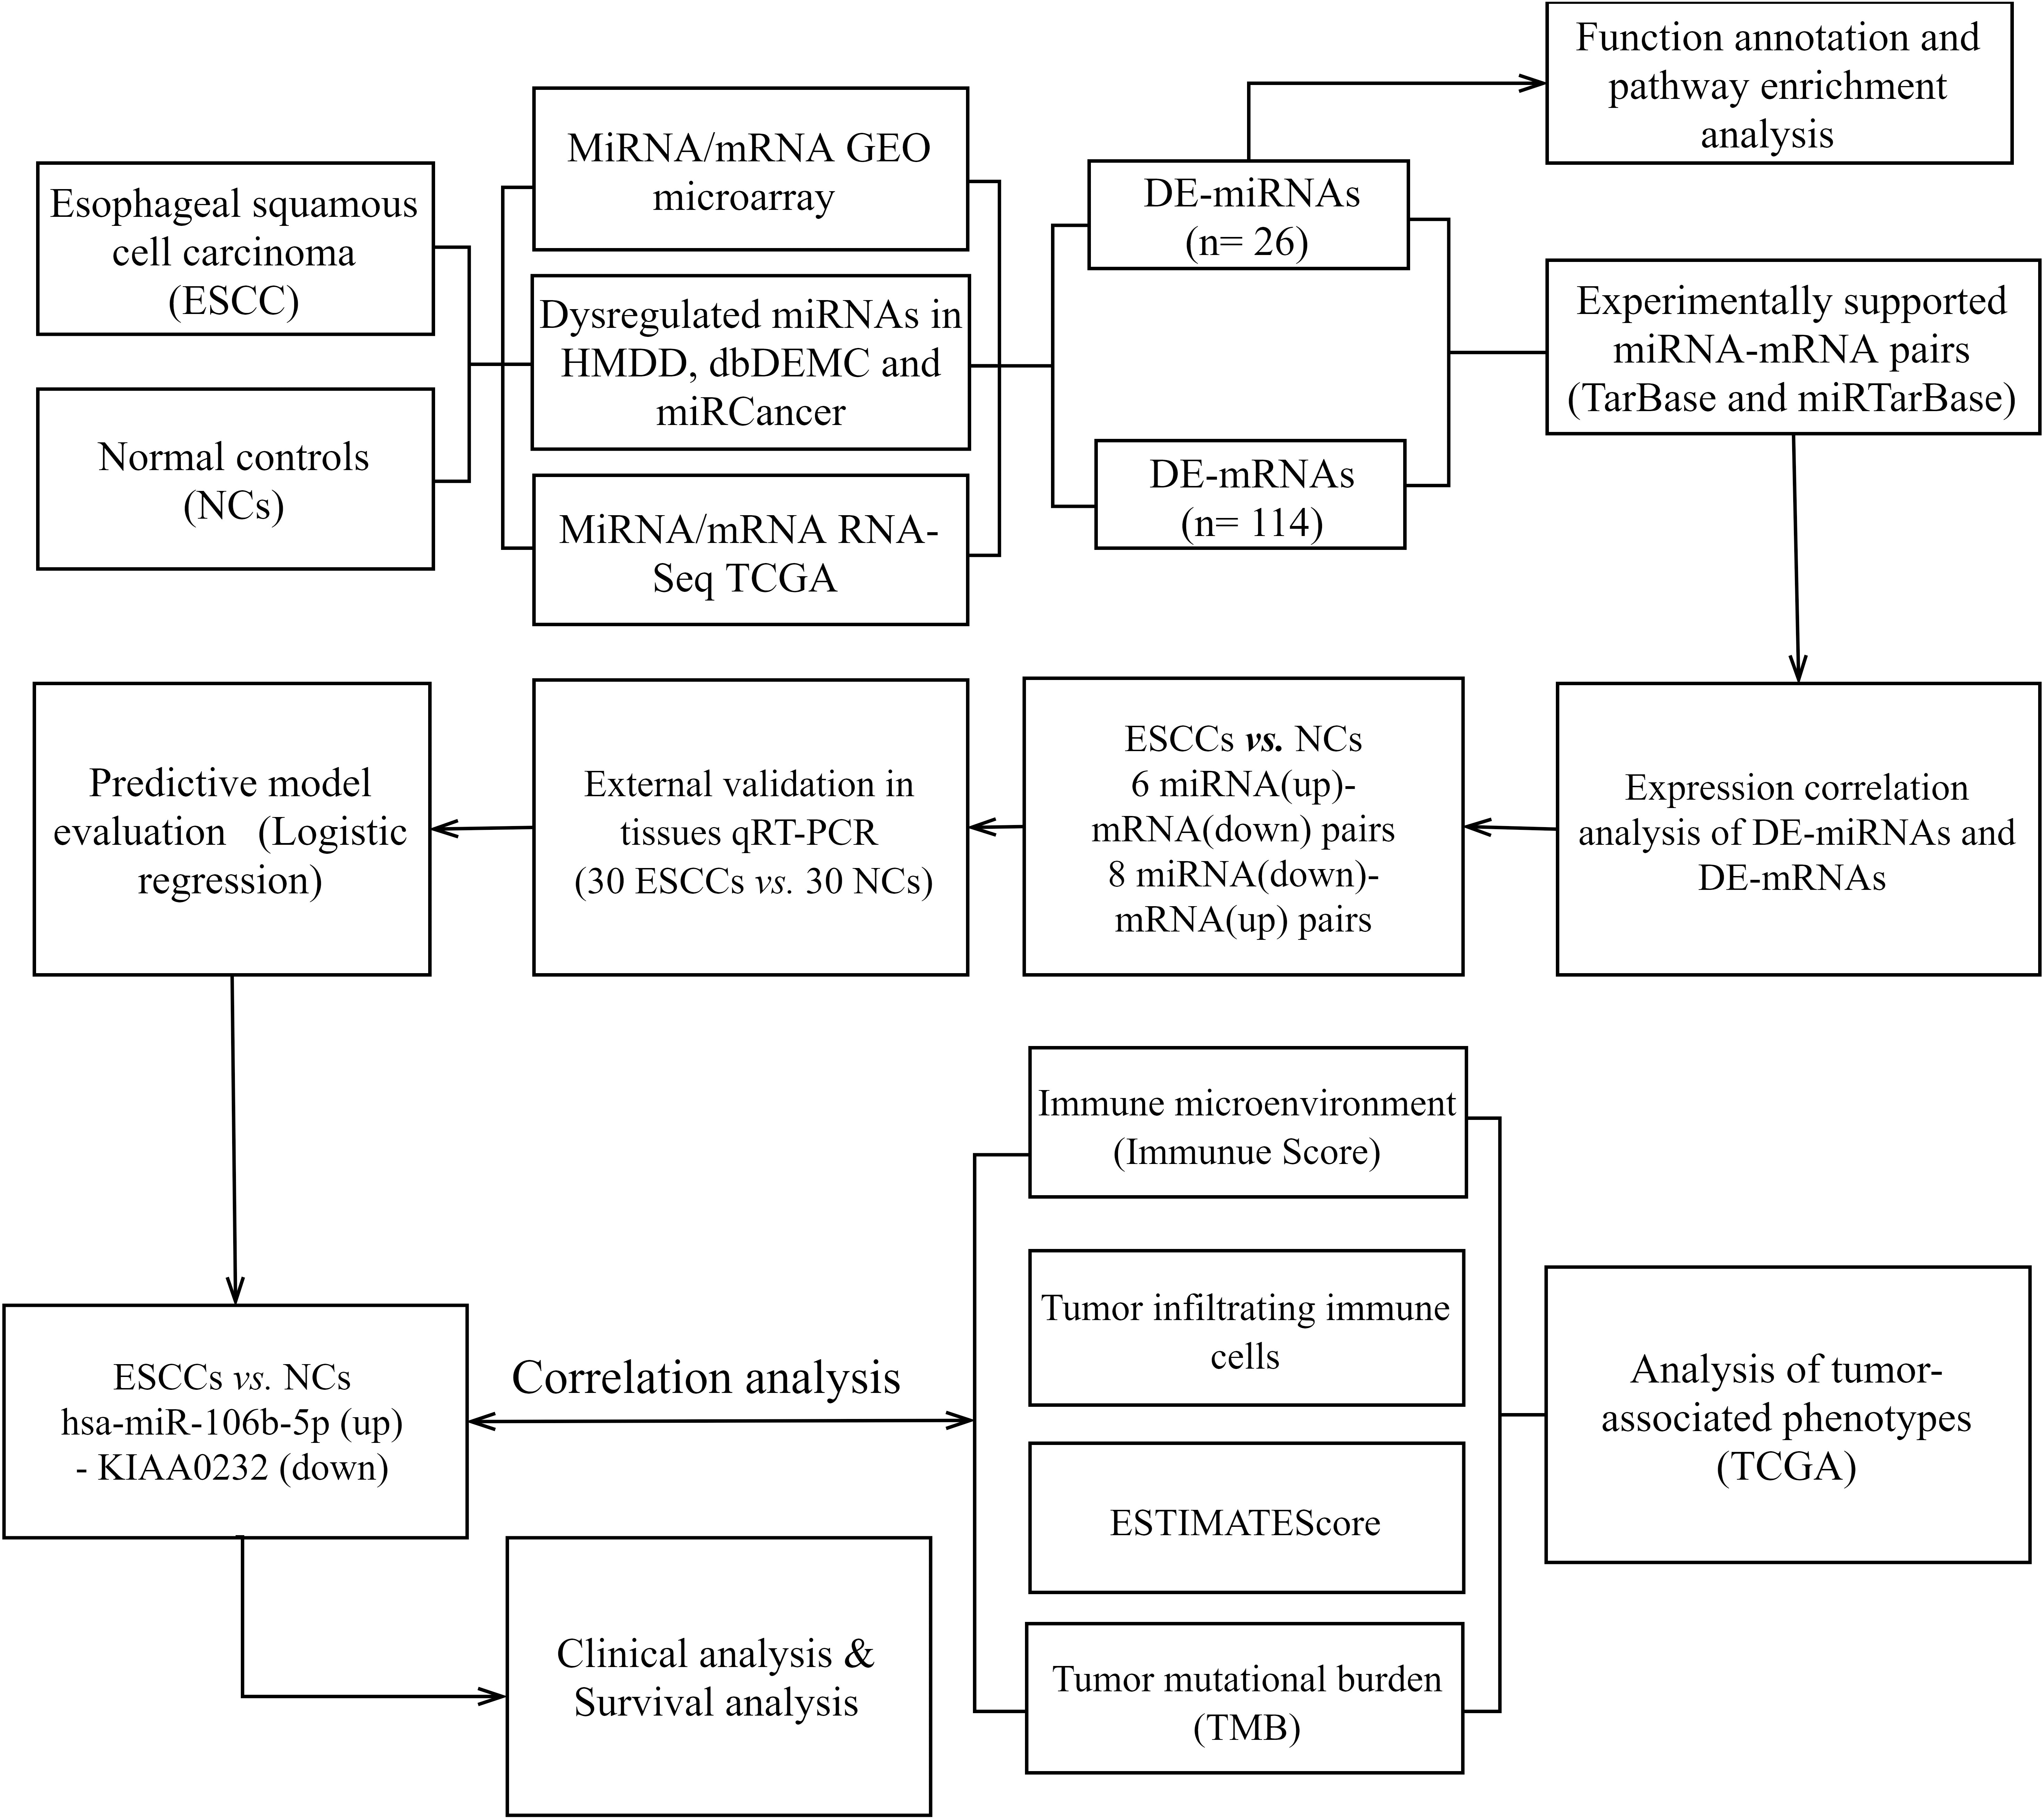
The whole process of this study is displayed in Fig. 1. Esophageal carcinoma RNA-Sequencing data and clinical information of The Cancer Genome Atlas (TCGA) were obtained from the Genomic Data Commons portal in the National Cancer Institute (
MRNA-sequencing and miRNA-sequencing profile gained from TCGA were processed with psych, an R-based package. Wilcoxon rank-sum test were performed between ESCC and normal tissue to calculate fold change (FC) of differently expressed mRNAs (DE-mRNA) and miRNAs (DE-miRNA). GEO2R (
Gene oncology (GO) and Kyoto Encyclopedia of Genes and Genomes (KEGG) pathway enrichment analyses
The sequences of primers for candidate miRNAs and targeted mRNAs
The sequences of primers for candidate miRNAs and targeted mRNAs
GO and Kyoto Encyclopedia of Genes and Genomes (KEGG) pathway enrichment analyses of DE-mRNA was carried out with the cluster Profiler tool on Hiplot (
MiRTarBase v.8 (
Sample collection, RNA isolation and reverse transcription quantitative polymerase chain reaction (RT-qPCR)
Totally 30 paired ESCC and normal esophagus Formalin-Fixed and Paraffin-Embedded (FFPE) tissue were collected. All patients underwent esophageal surgery at First Affiliated Hospital of Nanjing Medical University before receiving any chemotherapy or radiation therapy. This study was approved by the Institutional Review Boards of the First Affiliated Hospital of Nanjing Medical University (ID: 2016-SRFA-148). All patients were informed about this research and signed a consent statement before starting the study.
All FFPE specimen were stored at 20
Estimation of miRNA-mRNA axes’ predictive value in ESCC and survival analysis
SPSS Statistics 26.0 (IBM, New York, USA) was employed to perform binary logistic regression with expression data of selected miRNA-mRNA pairs. Receiver operating characteristic (ROC) curves and decision curve analysis (DCA) were respectively drawn by GraphPad Prism and rmda, an R-based package to estimate the prognostic value of miRNA-mRNA pairs. Owing to the lack of GEO survival data, survival information including survival data were downloaded from TCGA. High expression group and low expression group were distinguished by median. Survival analysis curves were protracted with Hiplot (
Prediction of pertinence between miRNA-mRNA pairs and Tumor phenotypes
We used CIBERSORT (
Statistically analysis
The expression data of miRNA and mRNA gained by RT-PCR were calculated by the
Results
Identification of DE-mRNA and DE-miRNA via GEO and TCGA database
(A) The circular bar-plot exhibited the information of 14 GEO datasets. All 10 miRNA datasets and 4 mRNA datasets were drawn from ESCC tissues. (B) The negative regulatory relationship screened by TarBase and MiRTarBase between 26 microRNAs (miRNAs) and 114 mRNAs were plotted by Cytoscape. 10 miRNA (up)-mRNA (down) pairs and 27 miRNA (down)-mRNA (up) pairs were selected. Orange nodes represent the upregulated miRNAs/mRNAs in ESCCs versus NCs, while blue nodes represent the downregulated miRNAs/mRNAs in ESCCs versus NCs. (C) Totally 14 negatively miRNA-mRNA regulatory axes were validated by RT-qPCR in 30 paired FFPE samples.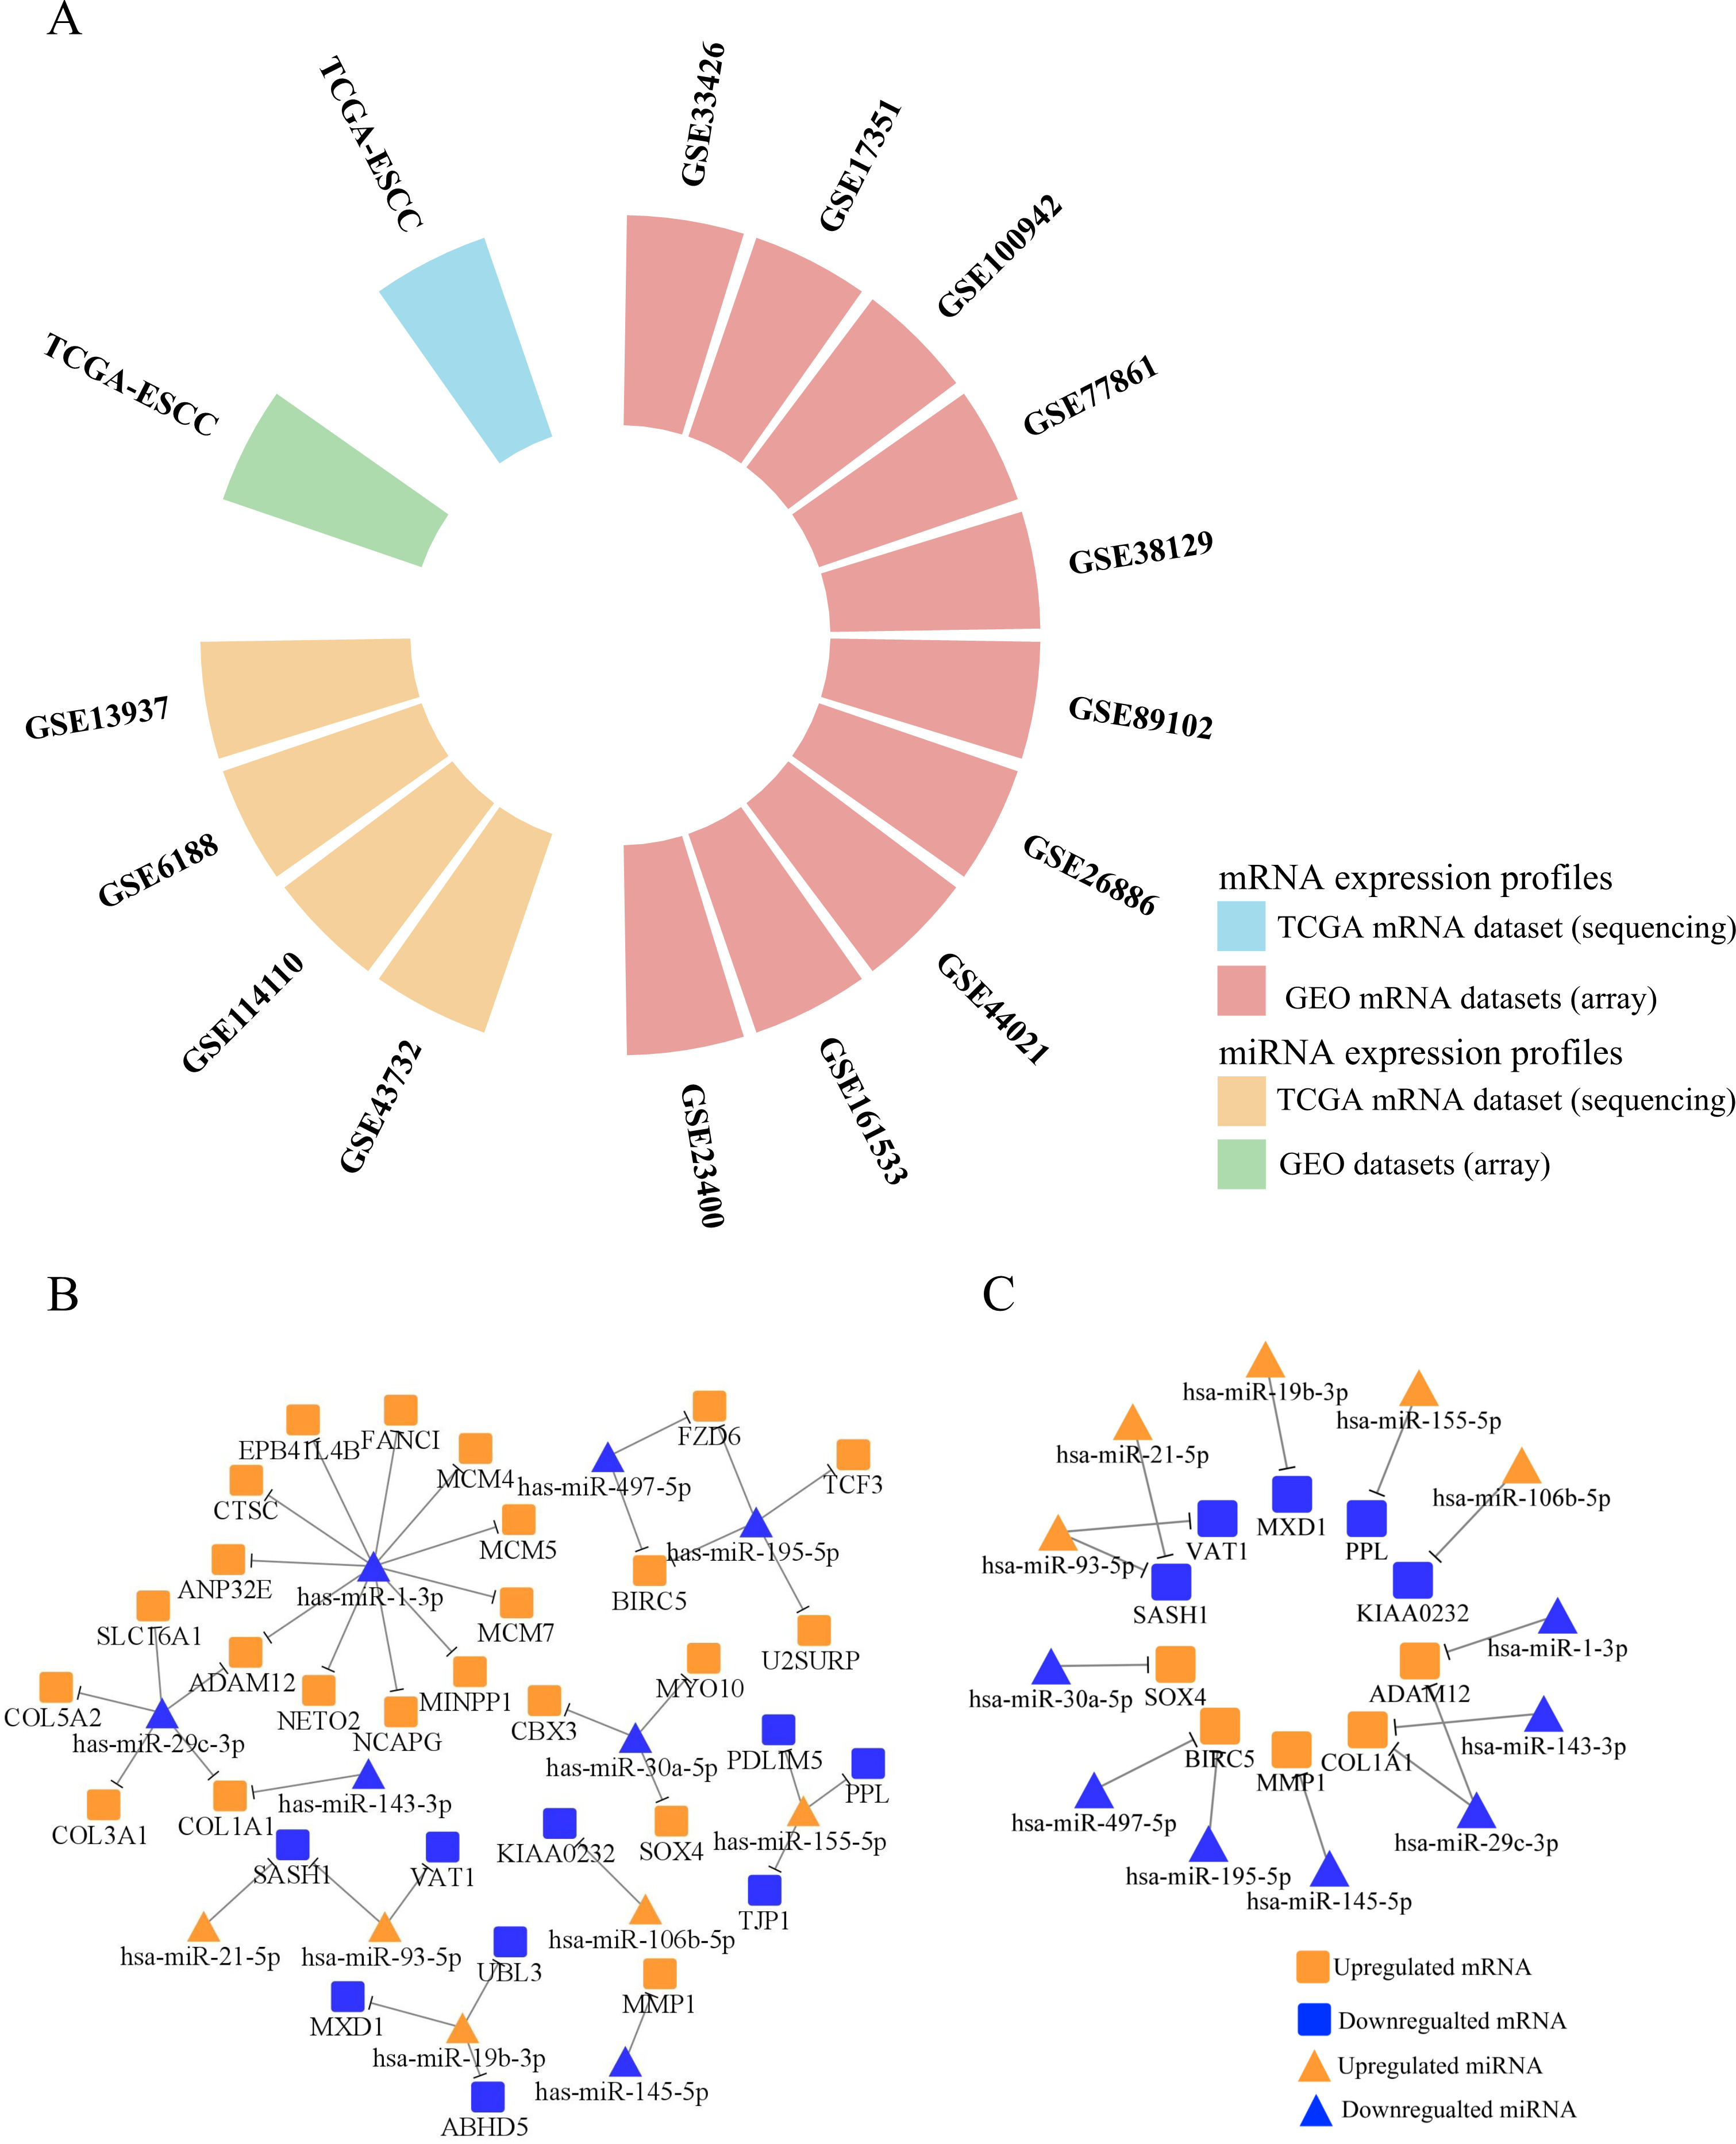
Pearson’s correlation analysis of miRNA-mRNA pairs in paired FFPE ESCC samples
(A) The miRNA expression levels of miR-93-5p and miR-106b-5p climbed while miR-30a-5p declined in ESCCs. (B) The mRNA expression levels of KIAA0232, SASH1, VAT1 and PPL were downregulated, while the expression levels of COL1A1 were upregulated. (C–D) Pearson’s correlation analysis of miRNA-mRNA regulatory pairs in 30 paired samples. MiR-106b-5p/KIAA0232 were the two negatively regulated pairs displayed in figure. Data were presented as mean 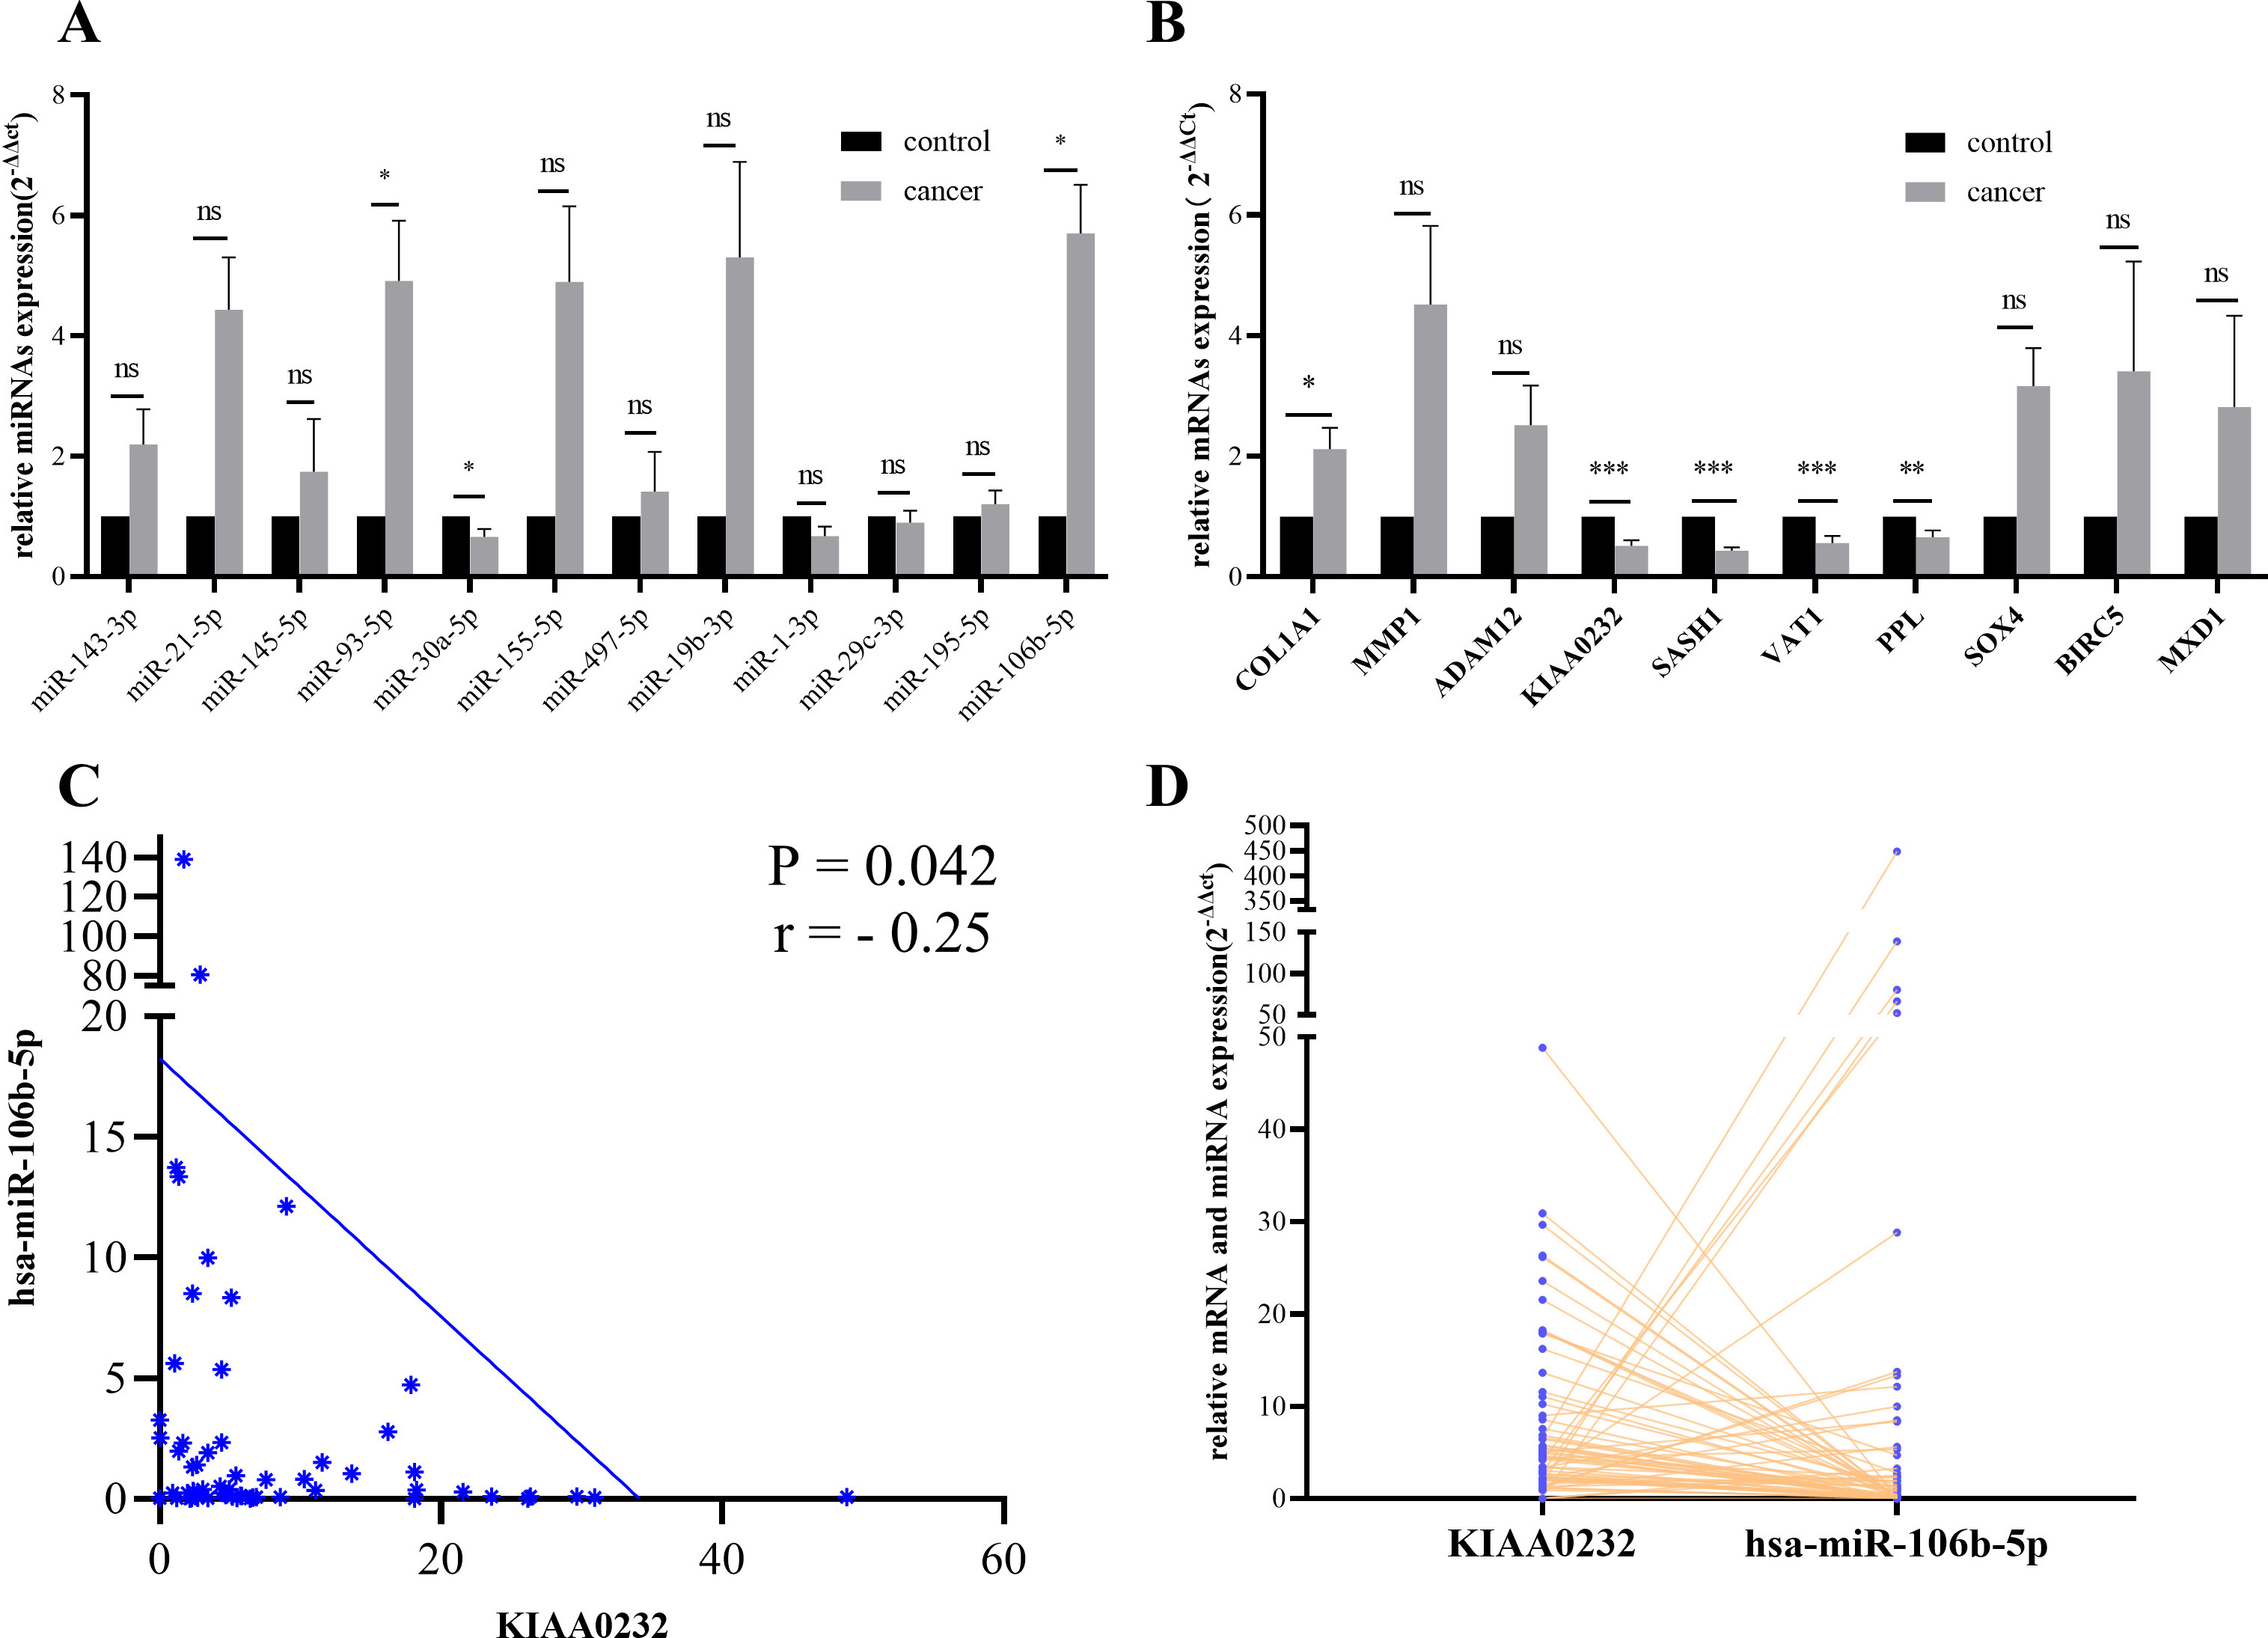
Receiver operating characteristic (ROC) curves of external validation and TCGA database was separately presented in Fig. 4A and B. (A) The areas under the curve of complex model, miR-106b-5p and KIAA0232 were 0.771, 0.681 and 0.763 respectively in external validation. (B) The areas under the curve of complex model, miR106b-5p and KIAA0232 were 0.914, 0.908 and 0.733 respectively. (C–D) DCA presented satisfied diagnostic performance of miRNA-mRNA network in external validation and TCGA database.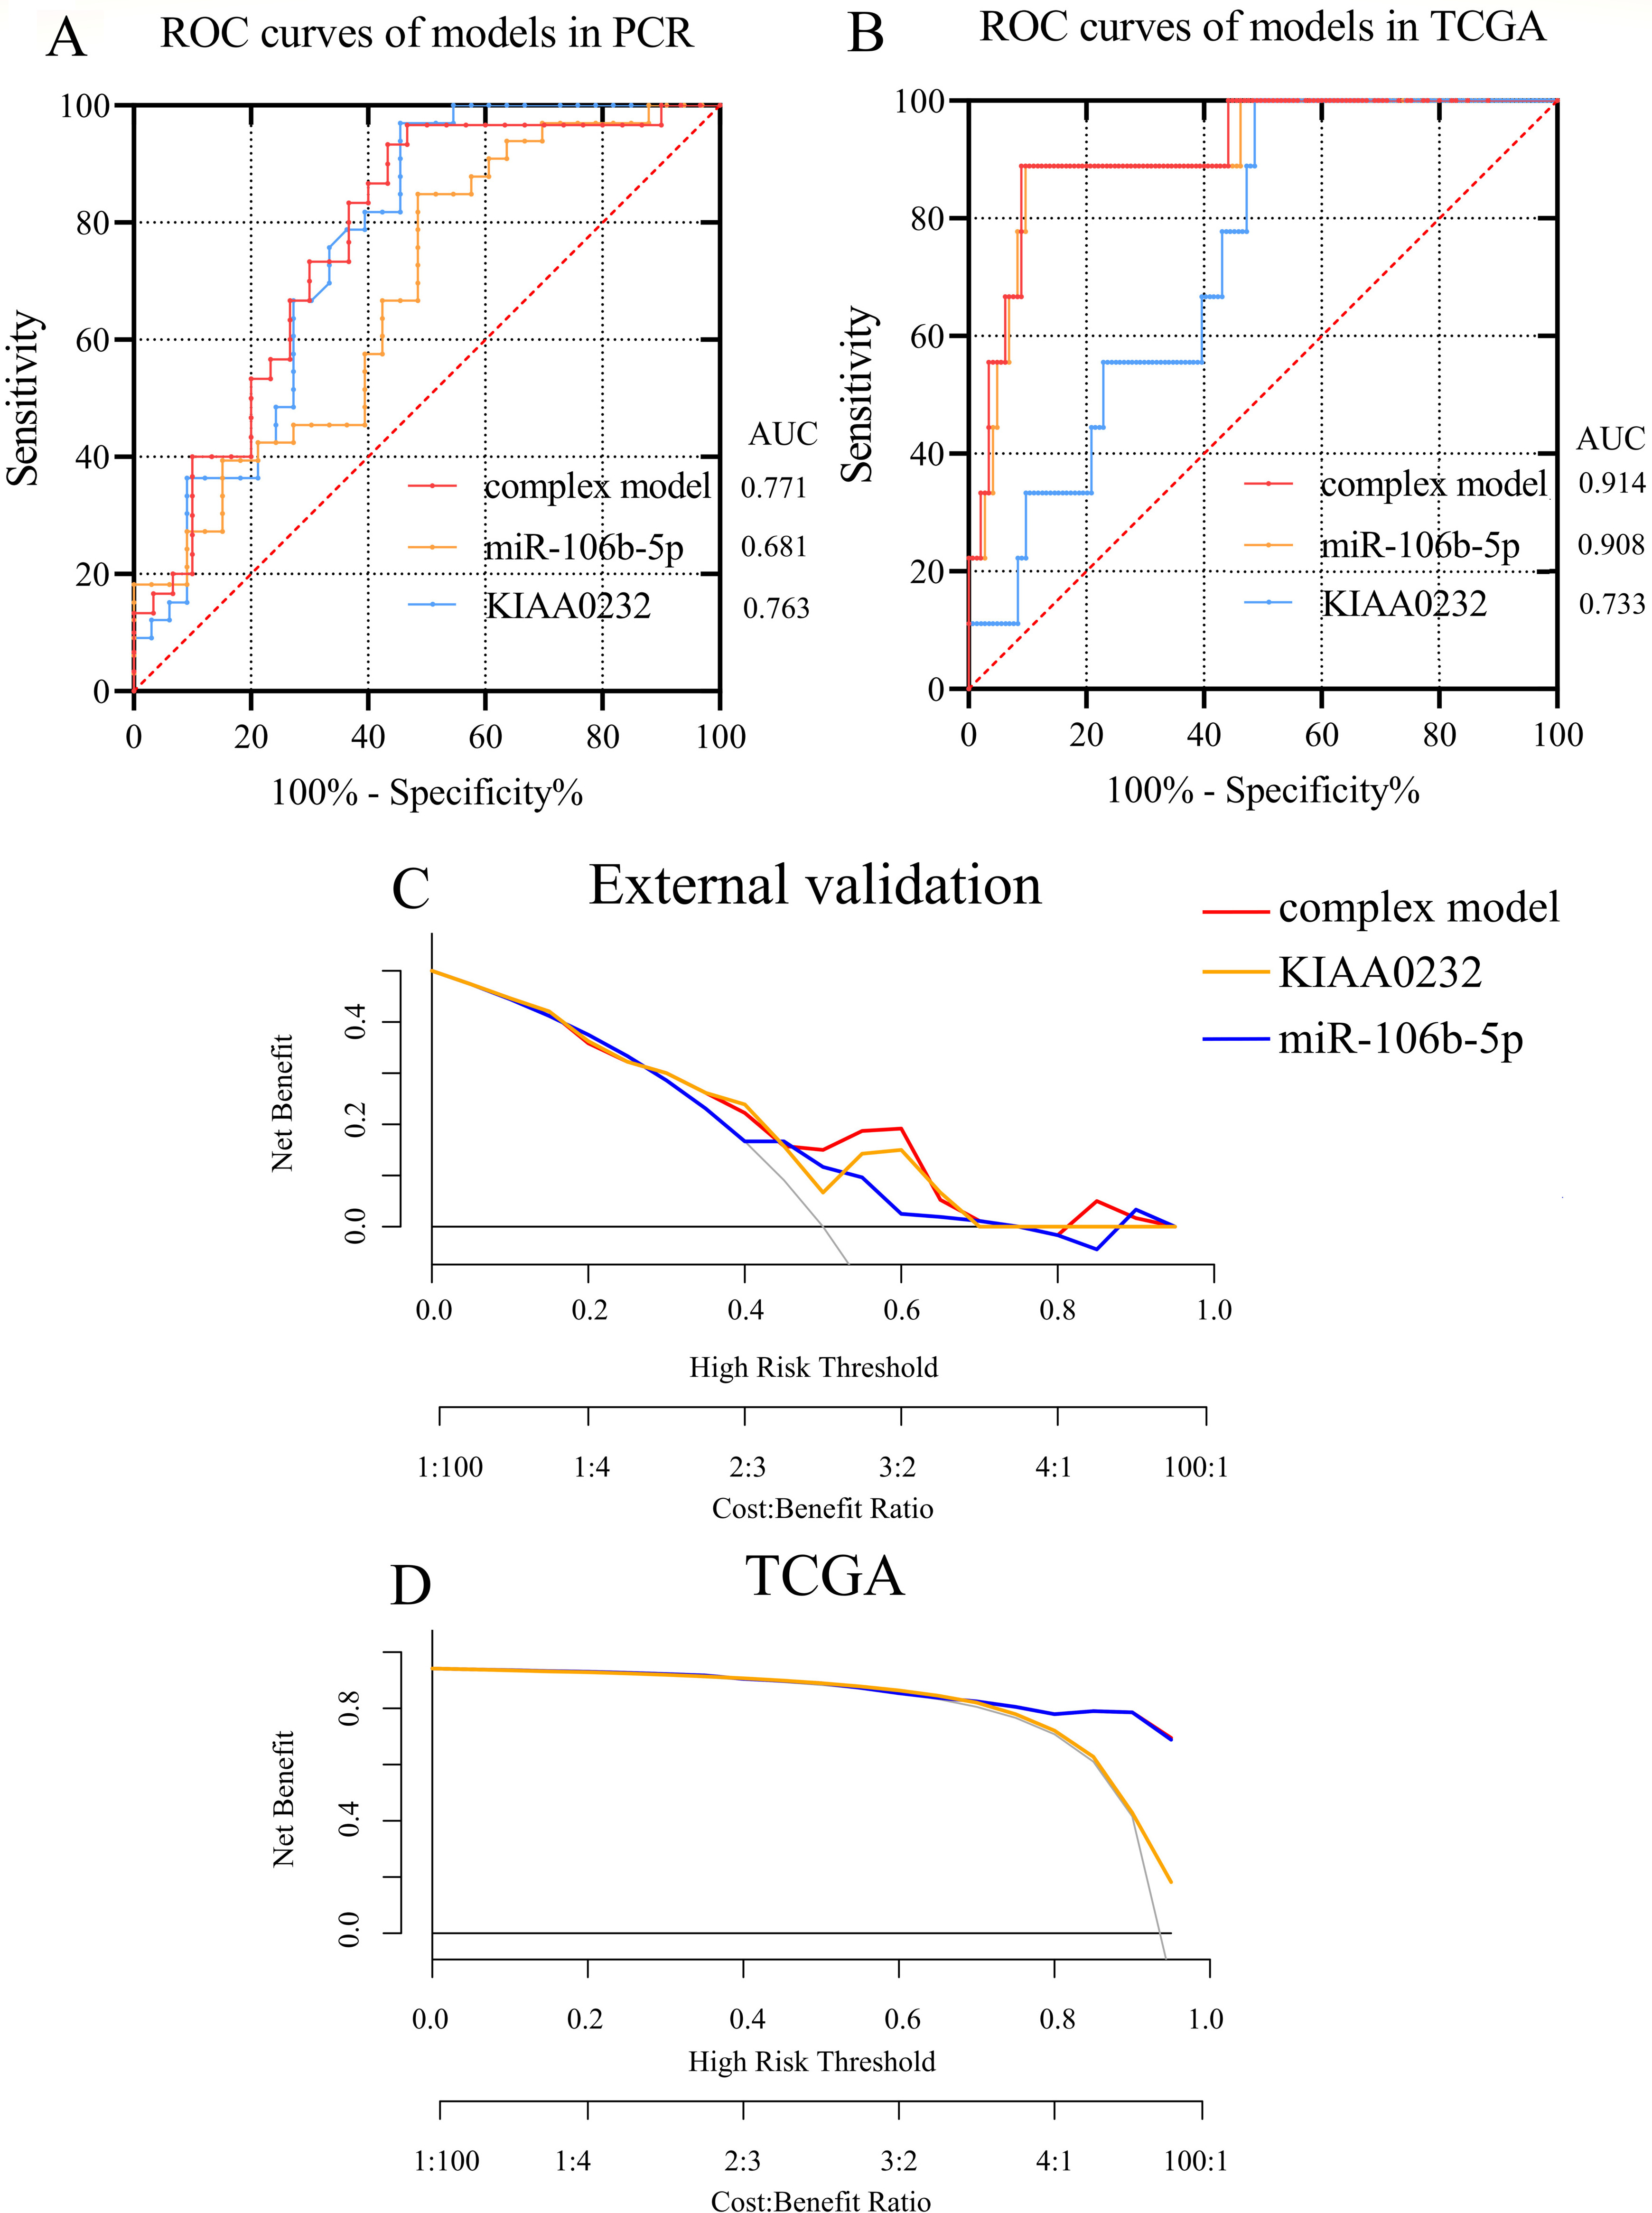
Wilcoxon rank test conducted in TCGA-ESCC database determines the primary set of DE-mRNAs and DE-miRNAs. As is presented in Fig. 2A, totally 10 mRNA and 4 miRNA expression datasets measured by microarray met our requirements. The detailed information of 14 GEO datasets was exhibited in Table 1 After calculating with GEO2R, 64 upregulated mRNAs and 50 downregulated mRNAs appeared in all 10 datasets. After comparing to normal samples, 38 upregulated miRNAs were mentioned in 3 more GEO datasets and 31 down-regulated genes appeared in 2 or more datasets. Taking GEO datasets, TCGA, dbDEMC, HMDD and miRCancer into consideration, 13 upregulated miRNAs and 13 downregulated miRNAs were also screened out.
Results of GO/KEGG analysis based on DE-miRNAs are revealed in Fig. S1A and S1B. For downregulated miRNAs, Proteoglycans in cancer, Pathways in cancer, ECM-receptor interaction were the most significant KEGG pathways. For upregulated miRNAs, Endocytosis, Melanoma and Hepatitis C are the enriched pathways with smallest
Determination of reverse regulation miRNA-mRNA interactions in ESCC
Via consulting MiRTarBase and TarBase, we identified 37 reverse regulation miRNA-mRNA pairs(Fig. 2B). After searching each miRNA-mRNA axis in PubMed, 14 pairs, including 6 miRNA (up)-mRNA (down) pairs and 8 miRNA (down)-mRNA (up) pairs, were verified in esophageal tissue or cell line (Fig. 2C).
Validating expression of mRNAs and miRNAs in ESCC FFPE tissue
Expression data of 14 miRNA-mRNA axes, including 10 mRNAs and 12 miRNAs, were measured in 30 paired ESCC tissues and adjacent normal tissues via RT-qPCR. Specific outcome of all miRNAs and mRNAs was listed in Table 3. Figure 3A and B separately presented miRNA and mRNA expression data. Hsa-miR-93-5p (
Estimating diagnostic value of miRNA-mRNA pairs in ESCC
For lack of GEO datasets containing both miRNA and mRNA expression pattern, we measured predictive value of the miRNA-mRNA pair with expression profile gained from FFPE tissue by PCR and TCGA database. As is displayed in Fig. 4A–B, we drew receiver operating characteristic (ROC) curves and decision curve analysis (DCA) of hsa-miR-106b-5p, KIAA0232 and a model containing miR-106b-5p/KIAA0232 axis separately. The areas under the curve (AUC) of complex model were 0.7711 (95% CI: 0.6498 to 0.8924) in PCR and 0.9142 (95% CI: 0.8252 to 1.000) in TCGA, maximum among all 3 curves. DCA suggested satisfactory diagnosis value of miRNA-mRNA axis in TCGA-ESCC database (Fig. 4D).
Clinical subgroup analysis and survival analysis with miRNA/mRNA expression
Analysis of CIBERSORT scores of 22 types of immune cells in esophagus cancers versus controls
Analysis of CIBERSORT scores of 22 types of immune cells in esophagus cancers versus controls
Expression level of miRNA-mRNA pairs were compared in subgroups divided by clinical features of ESCC patients acquired from TCGA database. Alcohol exposure, gender, age of diagnosis and tumor status had no relationship with miR-106b-5p expression. KIAA0232 expression level was higher in female patients.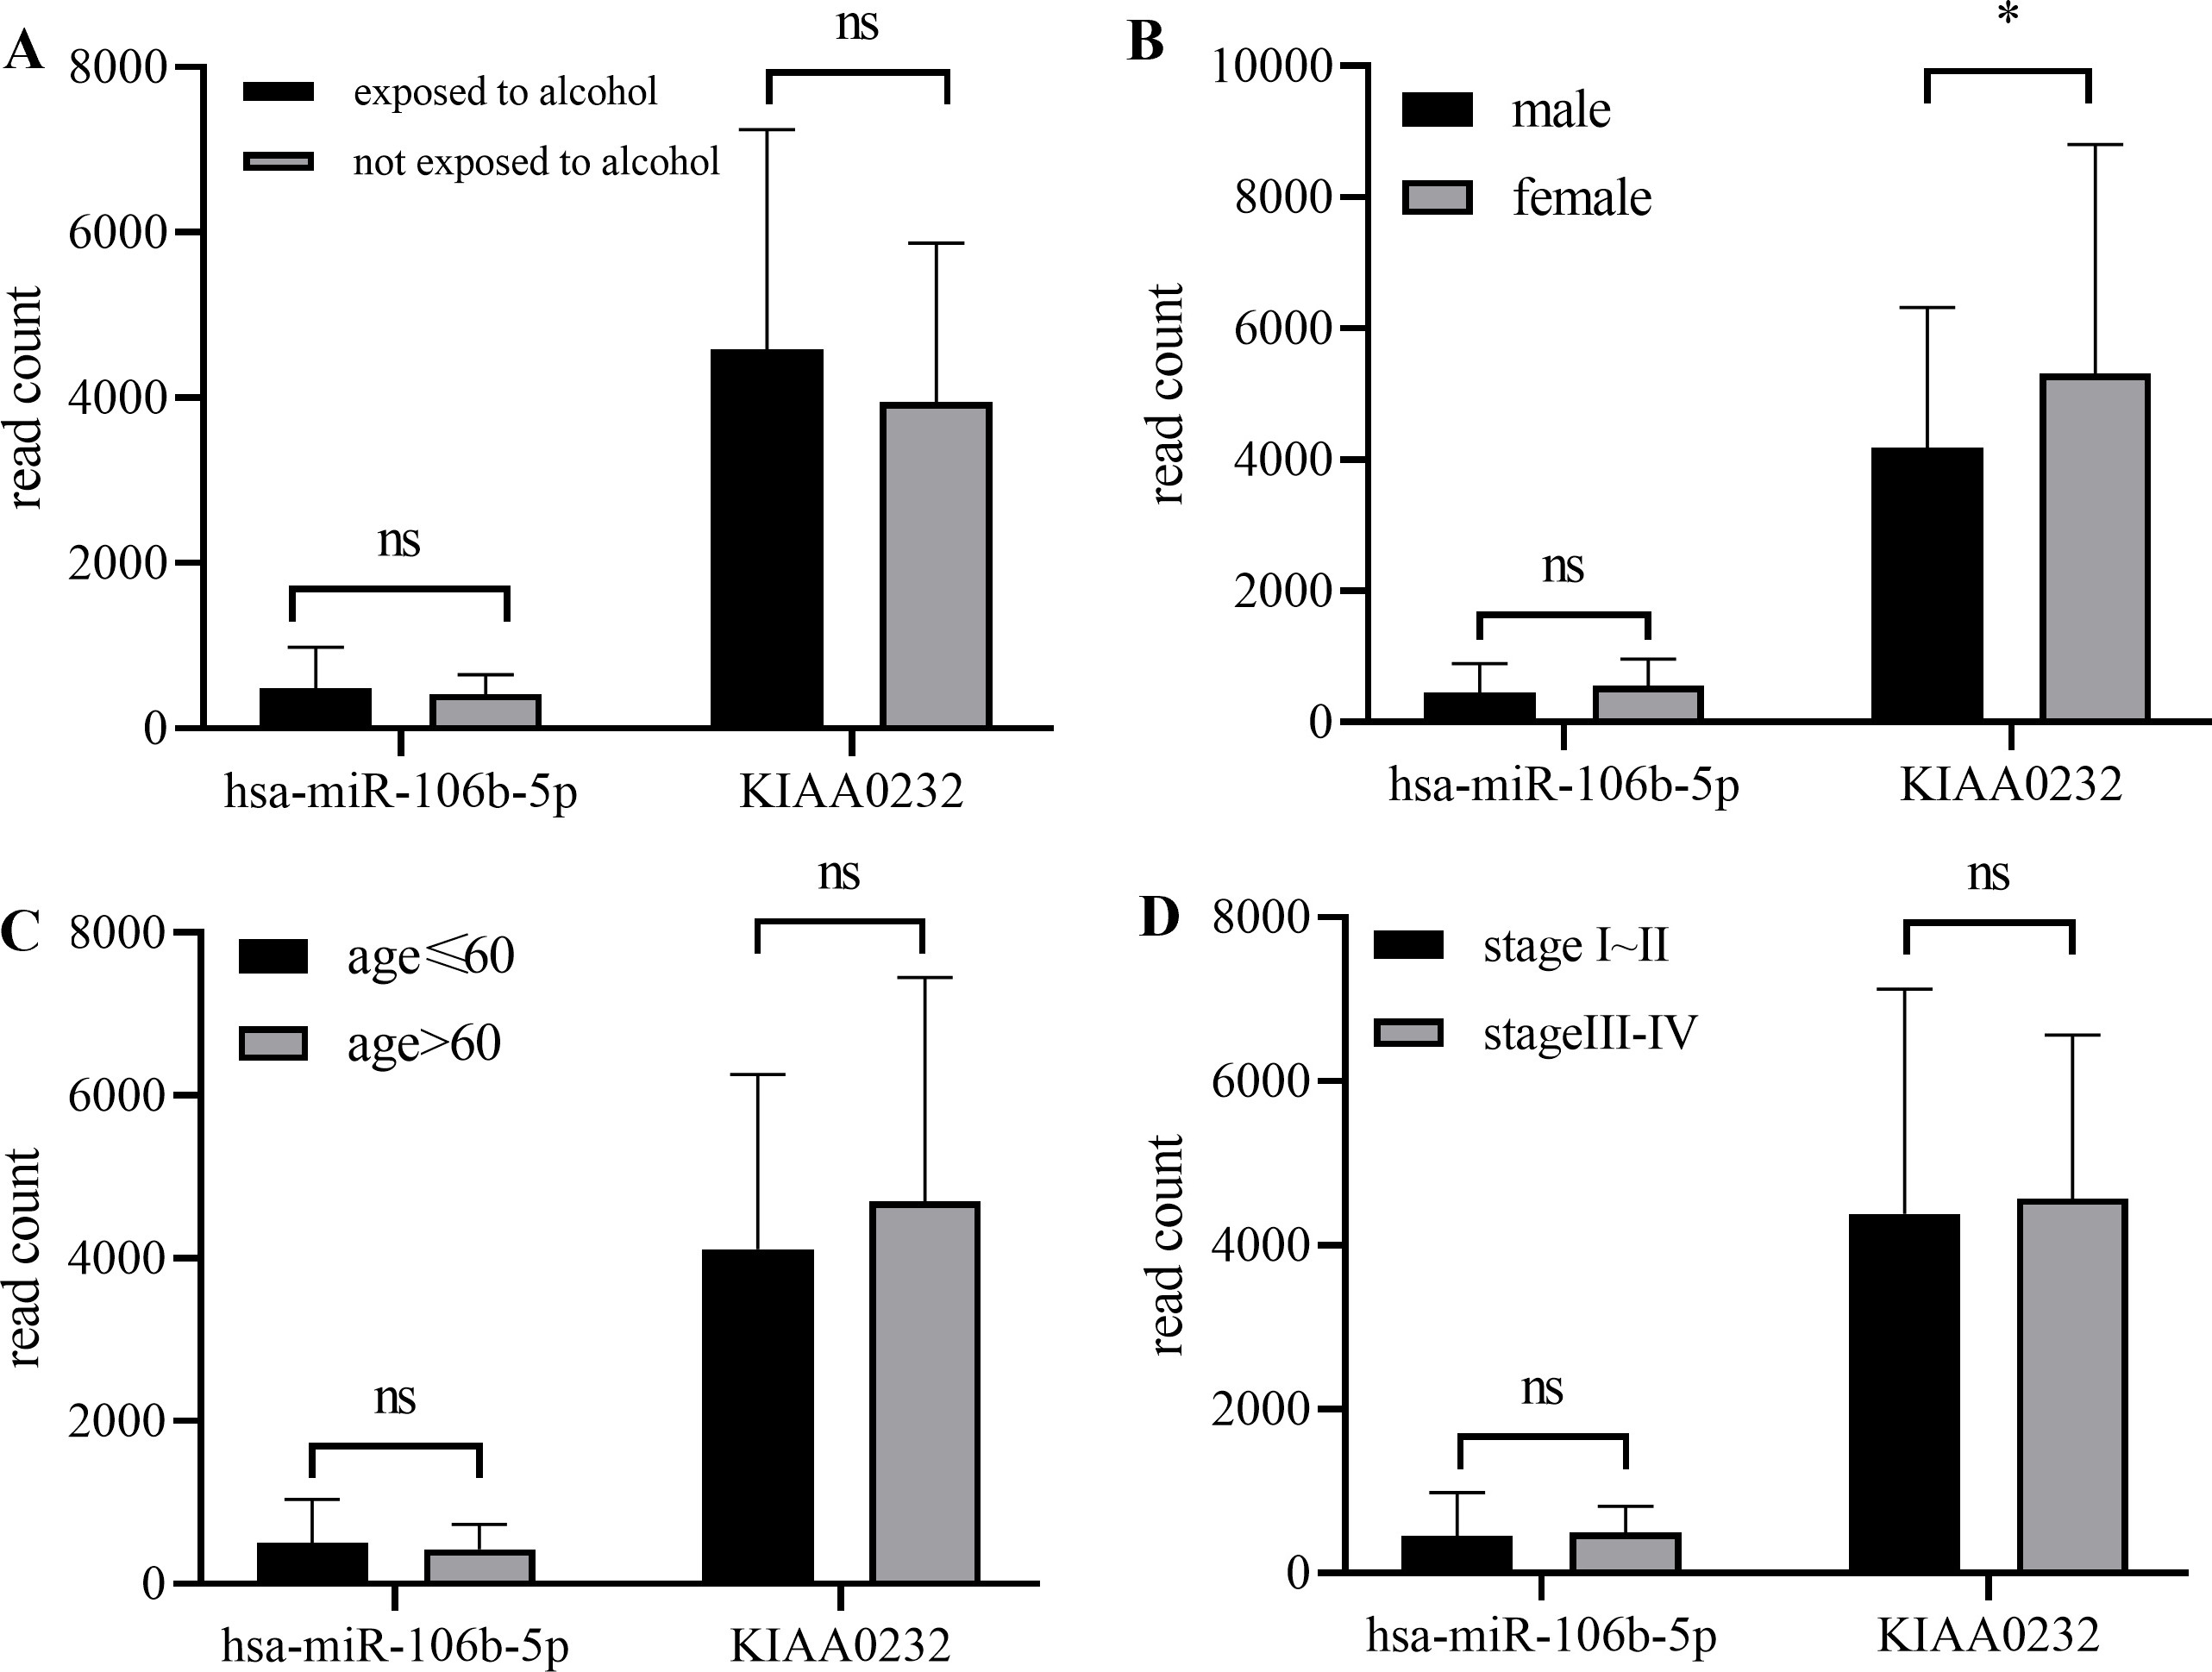
(A) The bar graph of 22 immune cells differentially infiltrated fraction in ESCC versus NCs were displayed. (B) The correlation heatmap between cell fraction of 9 differently infiltrated immune cells and expression level of miRNA-mRNA pairs was constructed by Pearson’s correlation. (C) The relevance between expression level of miRNAs and targeting mRNAs and 5tumor microenvironment factors (TMB, ESTIMATE score, immune score, stromal score, and tumor).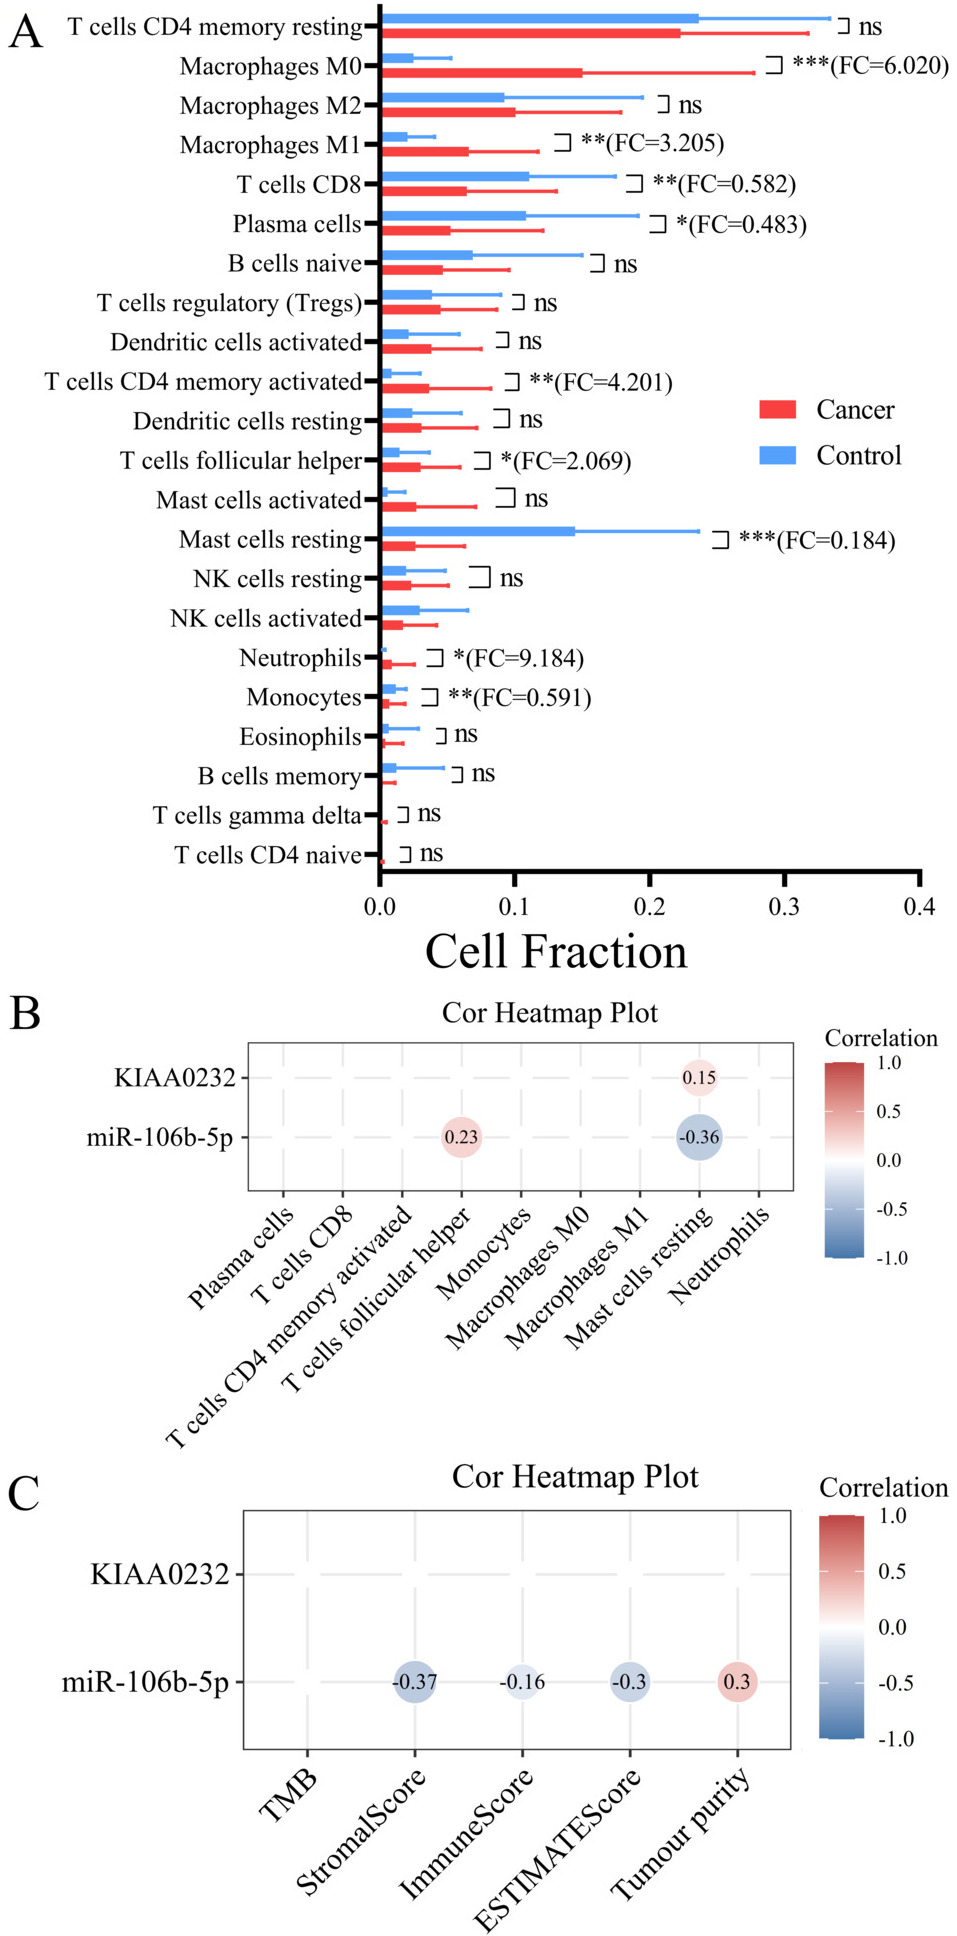
All the clinical cases collected in TCGA-ESCC database were grouped by alcohol exposure, gender, age, and tumor stage respectively. As is shown in Fig. 5, no expression difference of miR-106b-5p was observed between all four groups. KIAA0232 expression was higher in female patients than in male (
There was statistically significant difference in the proportion of 9 types of immune cells between ESCC tissue and normal esophageal tissue (Fig. 6A and Table 4). Correlation heatmap between miRNA/mRNA expression and immune cell proportion was plotted in Fig. 6B. Percentage of resting mast cells was positively correlated with KIAA0232 expression (
Discussion
In past few decades, the essential role of miRNA dysregulation in tumor occurrence, and immune microenvironment has been gradually recognized by scholars [19, 20]. MiRNAs post-transcriptionally inhibit expression of target genes A number of miRNAs such as miR-196a-5p and miR-1-3p has been identified as candidates for ESCC diagnosis and therapy targets [21] However, miRNA-mRNA interactions and their roles in ESCC have not been fully disclosed. Firstly, we collected expression pattern in normal and esophageal squamous cell carcinoma tissue from 4 miRNA GEO datasets, 10mRNA GEO datasets and TCGA databases Expression from GEO database and TCGA-ESCC database were analyzed by GEO2R and Wilcoxon signed-rank test respectively. Taking several miRNA differential expression libraries including HMDD, miRCancer and dbDEMC into consideration, we ultimately defined 26 DE-miRNAs (13 upregulated and 13 downregulated miRNAs) and 114 DE-mRNAs (64 upregulated and 50 downregulated mRNAs). Totally 37 miRNA-mRNA pairs were confirmed using MiRTarBase and TarBase, databases collecting experimentally supported miRNA-mRNA networks, 14 of which were observed in esophagus tissue or cell line. We further detected the expression of candidate DE-miRNAs and DE-mRNAs in 30 paired FFPE esophagus samples by poly(A) RT-qPCR. After the processing of experimental outcomes, the miR-106b-5p/KIAA0232 emerged as specific miRNA/mRNA signature of ESCC ultimately.
GO/KEGG analysis based on 26 DE-miRNAs and 114 DE-mRNAs emphasized the role of DNA replication, virus infection and energy metabolism. Notably, a few well-known tumor-associated cell signaling pathways, such as WNT signaling pathway, MAPK signaling pathway, ErbB signaling pathway, are involved in ESCC progression, which is in accordance with previous studies [22, 23, 24].
In present study, has-miR-106b-5p was observed upregulated in ESCC. Previous study has disclosed that miR-106b-5p is overexpressed in ESCC tissues and cell lines and that silencing of miR-106b-5p inhibits tumor growth and pulmonary metastasis of ESCC [25]. MiR-106b-5p was covered in a disease progression risk estimation model of stage II colon cancer [26]. In addition, miR-106b-5p was reported overexpressed in esophagus adenocarcinoma [27]. MiR-106b belongs to the miR-106b-25 cluster (miR-106b, miR-25 and miR-93), which is involved in a variety of cancers such as brain cancer, breast cancer and hepatocellular carcinoma [28, 29, 30]. However, no correspondences were found between miR-106b-5p and patients’ clinical features including alcohol exposure, gender, age and tumor status. Through correlation analysis, we identified KIAA0232 as the downregulated target mRNA of miR-106b-5p. KIAA genes are uncharacterized protein-coding human genes by identified Kazusa cDNA project [31]. KIAA0232 expression was reported median in esophagus squamous epithelial cells according to The Human Protein Atlas database (
The diagnosis value of KIAA0232, miR-106b-5p and complex panel combining miRNA/mRNA signature were estimated by ROC and DCA curve This study indicated that the AUC of complex panel was 0.9142 (95% CI: 0.8252 to 1.000) and 0.7711 (95% CI: 0.6498 to 0.8924) in TCGA-ESCC and the external validation respectively. Previous studies recommended miR-106b as a member of 8-miRNA signature diagnosis panel in serum specimens [33]. The diagnostic value of miRNA-mRNA signature was affirmed by the decision curve analysis in TCGA-ESCC database.
The expression level of miR-106b-5p and KIAA0232 separately had negative and positive correlation with resting mast cells proportion. It is revealed in previous research that high mast cell density is associated with ESCC progression and reduce postoperative survival [34]. Mast cell expressing interleukin 17 in tumor tissues could function as prognostic marker and therapeutic target for ESCC [35]. Thus, it is reasonable to conclude that miR-106b-5p targeting at KIAA0232 may have influence on tumor immune microenvironment.
Unfortunately, the Kaplan-Meier (K-M) survival curves based on overall survival data of TCGA demonstrated that neither miR-106b-5p nor KIAA0232 could serve as prognosis predictor of ESCC. Similarly, the serum levels of miR-106b showed no correspondence with ESCC prognosis in research conducted by Isamu Hoshino et al. [36]. No previous research investigated the association between KIAA0232 and prognosis in ESCC. Due to lack of sufficient clinical survival data, detailed study on prognostic biomarkers were thwarted. Establishing novel survival prognostic model based on miRNA/mRNA axes needs to be further acknowledged in the future.
To sum up, this study investigated DE-mRNA, DE-miRNA, and their interactions in ESCC. The role of miRNA-mRNA interacting axes in tumor progression were emphasized in massive studies due to well-developed bioinformatics approaches. However, molecular mechanisms of how DE-mRNAs and DE-miRNAs affect tumor growth and immune escape deserve deeper dig into details.
Conclusions
In summary, this research aimed at finding the key miRNA-mRNA axes for ESCC by bioinformatic methods and verifying them in PCR. Our study may provide novel biomarkers for diagnosis and prognosis of ESCC in future.
Author contributions
Conception: Yulin Yue, Tongshan Wang, and Wei Zhu.
Interpretation or analysis of data: Shuang Peng and Shiyu Zhang.
Preparation of the manuscript: Shuang Peng, Shiyu Zhang and Xingchen Fan.
Revision for important intellectual content: Shuang Peng, Jingfeng Zhu and Cheng Liu.
Supervision: Wei Zhu.
Supplementary data
The supplementary files are available to download from http://dx.doi.org/10.3233/CBM-220309.
sj-pdf-1-cbm-10.3233_CBM-220309.pdf - Supplemental material
Supplemental material, sj-pdf-1-cbm-10.3233_CBM-220309.pdf
Footnotes
Acknowledgments
We thank openbiox community and Hiplot team (