
Abstract
Background:
In recent studies, microRNAs have been demonstrated as stable detectable biomarkers in blood for cancer. In addition, computer-aided biomarker discovery has now become an attractive paradigm for precision diagnosis.
Methods:
In this study, we identified and evaluated miR-139-3p as a biomarker for screening of esophageal squamous cell carcinoma using the Cancer Genome Atlas and Gene Expression Omnibus database analyses. We identified possible miR-139-3p target genes through the predicted database and esophageal squamous cell carcinoma upregulated genes from the Cancer Genome Atlas and Gene. Bioinformatics analysis was performed to determine key miR-139-3p targets and pathways associated with esophageal carcinoma. Finally, the expression and expected significance of hub genes were evaluated via the Genotype-Tissue Expression project.
Results:
MiR-139-3p was significantly downregulated in patients with esophageal squamous cell carcinoma/esophageal carcinoma. In GSE 122497, the area under the curve-receiver operating characteristic value, sensitivity, and specificity for serum miR-139-3p were 0.754, 67.49%, and 80.00%, respectively. The pattern specification process, skeletal system development, and regionalization process were the most enriched interactions in esophageal carcinoma. In addition, Epstein-Barr virus infection, human T-cell leukemia virus 1 infection, and human cytomegalovirus infection were identified as crucial pathways. Six hub genes (CD1A, FCGR2A, ANPEP, CD1B, membrane metalloendopeptidase, and TWIST1) were found, and FCGR2A and membrane metalloendopeptidase were further confirmed by genotype-tissue expression. High expression of membrane metalloendopeptidase correlated with a better overall survival but not with disease-free survival of patients with esophageal carcinoma.
Conclusions:
MiR-139-3p was identified as a candidate biomarker for predicting esophageal squamous cell carcinoma based on network analysis. MiR-139-3p acted as a tumor suppressor by targeting membrane metalloendopeptidase in esophageal carcinoma, and low expression of membrane metalloendopeptidase may indicate a better prognosis of patients with esophageal carcinoma.
Background
Esophageal squamous cell carcinoma (ESCC) is one of the worst cancer prognoses with an overall 5-year survival rate of about 25% to 30%. 1,2 Treatments using a combination of surgery, radiation, and/or chemotherapy have improved the prognosis of patients with ESCC. Improvement in techniques including endoscopic ultrasonography, positron emission tomography-computed tomography, and minimally invasive staging has been used for the diagnosis of ESCC. 3 Unfortunately, due to the absence of typical symptoms and the lack of a specific biomarker, ESCC is often diagnosed at an advanced stage. Therefore, novel biomarkers with high sensitivity and specificity for ESCC screening, as well as for response metastasis and recurrence, are of utmost importance to reduce the morbidity and mortality associated with ESCC.
MicroRNAs (miRNAs) are a group of small noncoding RNAs of approximately 22 to 24 nucleotides in length that play important roles in several cellular processes by regulating gene expression through base paring with target messenger RNAs (mRNAs) at the posttranscriptional level. 4 Furthermore, miRNAs are remarkably stable and are specifically detected in various tissues and blood. 5,6 Currently, various serum miRNAs, including miR-25, -100, -193-3p, -194, -223,-337-5p, -483-5p, -1246, and -18a, have been reported as novel potential diagnostic and prognostic biomarkers of ESCC. 7
In recent years, miR-139-3p has received much attention in multiple cancers. 8 -10 Moreover, an increasing number of target genes and pathways regulated by miR-139-3p have gradually been unveiled. For example, the matrix metalloproteinase 11 gene (MMP11) was directly regulated by miR-139-3p. Downregulation of MMP11 enhanced bladder cancer cell migration and invasion in BC cells, indicating it might be a good prognostic marker for the survival of patients with bladder cancer. 11 Additionally, miR-139-3p suppressed the growth and metastasis of glioblastoma via inhibition of NIN1/RPNI2 binding protein 1 homolog. 12 Moreover, in previous studies, it was shown that miR-139-3p is a prognostic marker of hepatocellular carcinoma 13 and colon cancer. 14 However, to our knowledge, a specific role of miR-139-3p in ESCC has not yet been elucidated. Therefore, this study was conducted to assess the value of miR-139-3p as a screening marker in ESCC using the Gene Expression Omnibus (GEO) and the Cancer Genome Atlas (TCGA) database and to establish an miRNA-target gene regulatory network in patients with ESCC using web-based bioinformatics platforms (Figure 1).

Overall flow chart.
In our study, we investigated the role of miR-139-3p in the serum of patients with ESCC and evaluated part of the underlying molecular mechanism in ESCC, which might have potential for the clinical therapy of patients with ESCC.
Materials and Methods
Evaluation of the Expression of MiR-139-3p via TCGA and GEO MiRNA-Sequencing Data
MicroRNA-sequencing data concerning esophageal carcinoma (ESCA) and normal tissue (control group) were downloaded from the TCGA database (https://cancergenome.nih.gov/), and the expression of miR-139-3p was determined. Then, log2 transformation was performed to normalize the expression value of miR-139-3p.
The GEO database was used to screen the ESCC/ESCA data sets using the following key terms: “miRNA” and “esophageal squamous cell carcinoma/esophageal carcinoma.” The inclusion criteria were as follows: (1) more than 30 ESCC and control samples in the data sets; (2) detected and calculable expression of miR-139-3p; and (3) data obtained from Homo sapiens. Unpaired Student t test was used to compare the miR-139-3p expression between the ESCA group and the control group in tissues or serum samples. For comparison, the mean values of the 2 groups were calculated.
Finally, 5 databases are filtered out. GSE114110: miRNA expression analyses were performed on 30 ESCC and 10 normal esophageal (NE) samples without any anticancer treatment using Agilent human miRNA microarrays. 15 GSE112264: serum miRNA profiles of 1591 male samples, including 809 prostate cancers, 241 patients with negative prostate cancer, 41 noncancer controls, and 500 other solid cancers. 16 GSE113486: serum miRNA profiles of 972 samples, including 392 bladder cancers, 100 noncancer controls, and 480 other types of cancer. 17 GSE112840: human miRNA array analysis of 104 serum samples from preoperative patients with ESCC (n = 52) and healthy controls (n = 52). 18 GSE122497: serum miRNA profiles of 5531 samples, including 566 ESCCs and 4965 noncancer controls. 19
Performance Evaluation
Database 19 GSE122497 was used to validate and evaluate the diagnostic performance of serum levels of miR-139-3p. Receiver-operating characteristic (ROC) was performed to evaluate the performance of miR-139-3p as a biomarker for classifying patients with ESCC. The ROC curve and the area under curve (AUC) were drawn and calculated using the SPSS19.0 software. GraphPad Prism 6.0 (GraphPad Software, Inc., La Jolla, California) was used to construct box plots to visually present the mean value of each group.
Collection and Screening of Target Genes
Possible miR-139-3p target genes as predicted by TargetScan Human 7.2 and miRDB and miRanda programs were identified for further analysis.
The differentially expressed mRNA-sequencing genes associated with ESCA and normal tissues were downloaded through the official TCGA database web site, and data were normalized using log2 transformation. The R package “limma” 20 was used to analyze the differential expression. Based on the standard log2FC > 1, a list of upregulated genes in TCGA ESCA samples was collected.
To more specifically identify the miR-139-3p target genes, upregulated genes in TCGA ESCA samples were intersected, and miR-139-3p target genes were predicted using 3 prediction databases. Overlapping genes were used for bioinformatics analyses to explore the underlying molecular mechanism of miR-139-3p in ESCA.
Bioinformatics Analysis of Overlapping Genes
Gene Ontology and KEGG Clustering Analysis
Enrichment of Gene Ontology (GO) and Kyoto Encyclopedia of Genes and Genomes (KEGG) was performed using R version 3.4.0 by the package (“colorspace,””stringi,” “ggplot2,” “BiocManager,” “enrichplot”) and library (org, Hs, eg, and db); P < .05 and Q < .05 were adopted to screen statistically significant GO and KEGG terms.
Construction of PPI Network and Module Analysis
The online analysis tool of the Search Tool for the Retrieval of Interacting Genes (STRING version 10.0; http://string-db.org/) was used to assess the protein–protein interaction (PPI) network of differentially expressed genes, with the required confidence (combined score) >0.4. Visualization of the network and module analysis were performed using Cytoscape software (version 3.6.0; http://www.cytoscape.org/) and the MCODE plugin (version 1.5.1). 20 Hub genes for miR-139-3p was identified by the MCODE plugin and may help to find the most densely connected region in the PPI based on topology.
Validation of Hub Genes
The expression level of hub genes in ESCA and paracancerous tissue (PCT) were verified and compared by the online Gene Expression Profiling Interactive Analysis (GEPIA) tool (http://gepia.cancer-pku.cn/). 21 The difference in expression of hub genes is shown as a box plot; P < .05 was considered statistically significant.
Evaluation of Prognostic Value of Hub Genes
The clinical prognostic significance of the validated hub genes was assessed by the TCGA and genotype-tissue expression survival data of patients with ESCA using the GEPIA online tool. Kaplan-Meier survival curves were plotted to estimate the overall survival (OS) and disease-free survival (DFS) of patients with ESCA. Moreover, the log-rank test was performed to calculate the hazard ratio (HR) and evaluate the influence of hub gene expression on the survival of patients with ESCA; P <.05 was considered statistically significant.
Results
Expression Difference of MiR-139-3p in TCGA and GEO Databases
In total, 187 ESCA and 13 normal tissue samples from the TCGA database were downloaded and analyzed. As shown in Figure 2, the expression of miR-139-3p in ESCA tissue was significantly reduced when compared to that of normal tissue (P = .0039). The mean ± standard deviation of ESCA and normal tissue was 44.72 ± 4.192 and 94.23± 22.73, respectively.

Expression of miR-139-3p based on TCGA data. The expression level of miR-139-3p in ESCA (esophageal carcinoma) tissues was significantly lower than that in normal tissues (P = .0039). ESCA indicates esophageal carcinoma; TCGA, The Cancer Genome Atlas.
Furthermore, 1 tissue GEO data set and 3 serum GEO data sets were included in this study to validate miR-139-3p expression in ESCA and control groups (Figure 3). The expression of miR-139-3p in ESCA/ESCC was significantly upregulated in GSE114110, GSE112264, and GSE113486, whereas no statistical significance was observed in the GSE112840 data set (Figure 3D).

Expression of miR-139-3p in patients with ESCA based on GEO data sets. A, GSE114110; B, GSE112264; C, GSE113486; D, GSE112840. ESCA indicates esophageal carcinoma; ESCC, esophageal squamous cell carcinoma; GEO, Gene Expression Omnibus; NE, normal esophageal epithelia biological; noncancer: noncancer controls.
Evaluating the Diagnostic Efficacy of Serum Levels of MiR-139-3p in Patients With ESCC
We next analyzed the serum levels of miR-139-3p in a total of 566 patients with ESCC and 5531 noncancer controls from the GEO database (GSE122497). The expression level of miR-139-3p in the serum of patients with ESCC was significantly lower compared to that of controls (P < .0001; Figure 4A). Furthermore, the expression of miR-139-3p in stage 0 to I was significantly higher compared to that in stage III to IV (Figure 4B). No statistical differences were observed between the other groups, and no differences in miR-139-3p expression levels were observed between males and females in control and ESCC groups (Figure 4C).
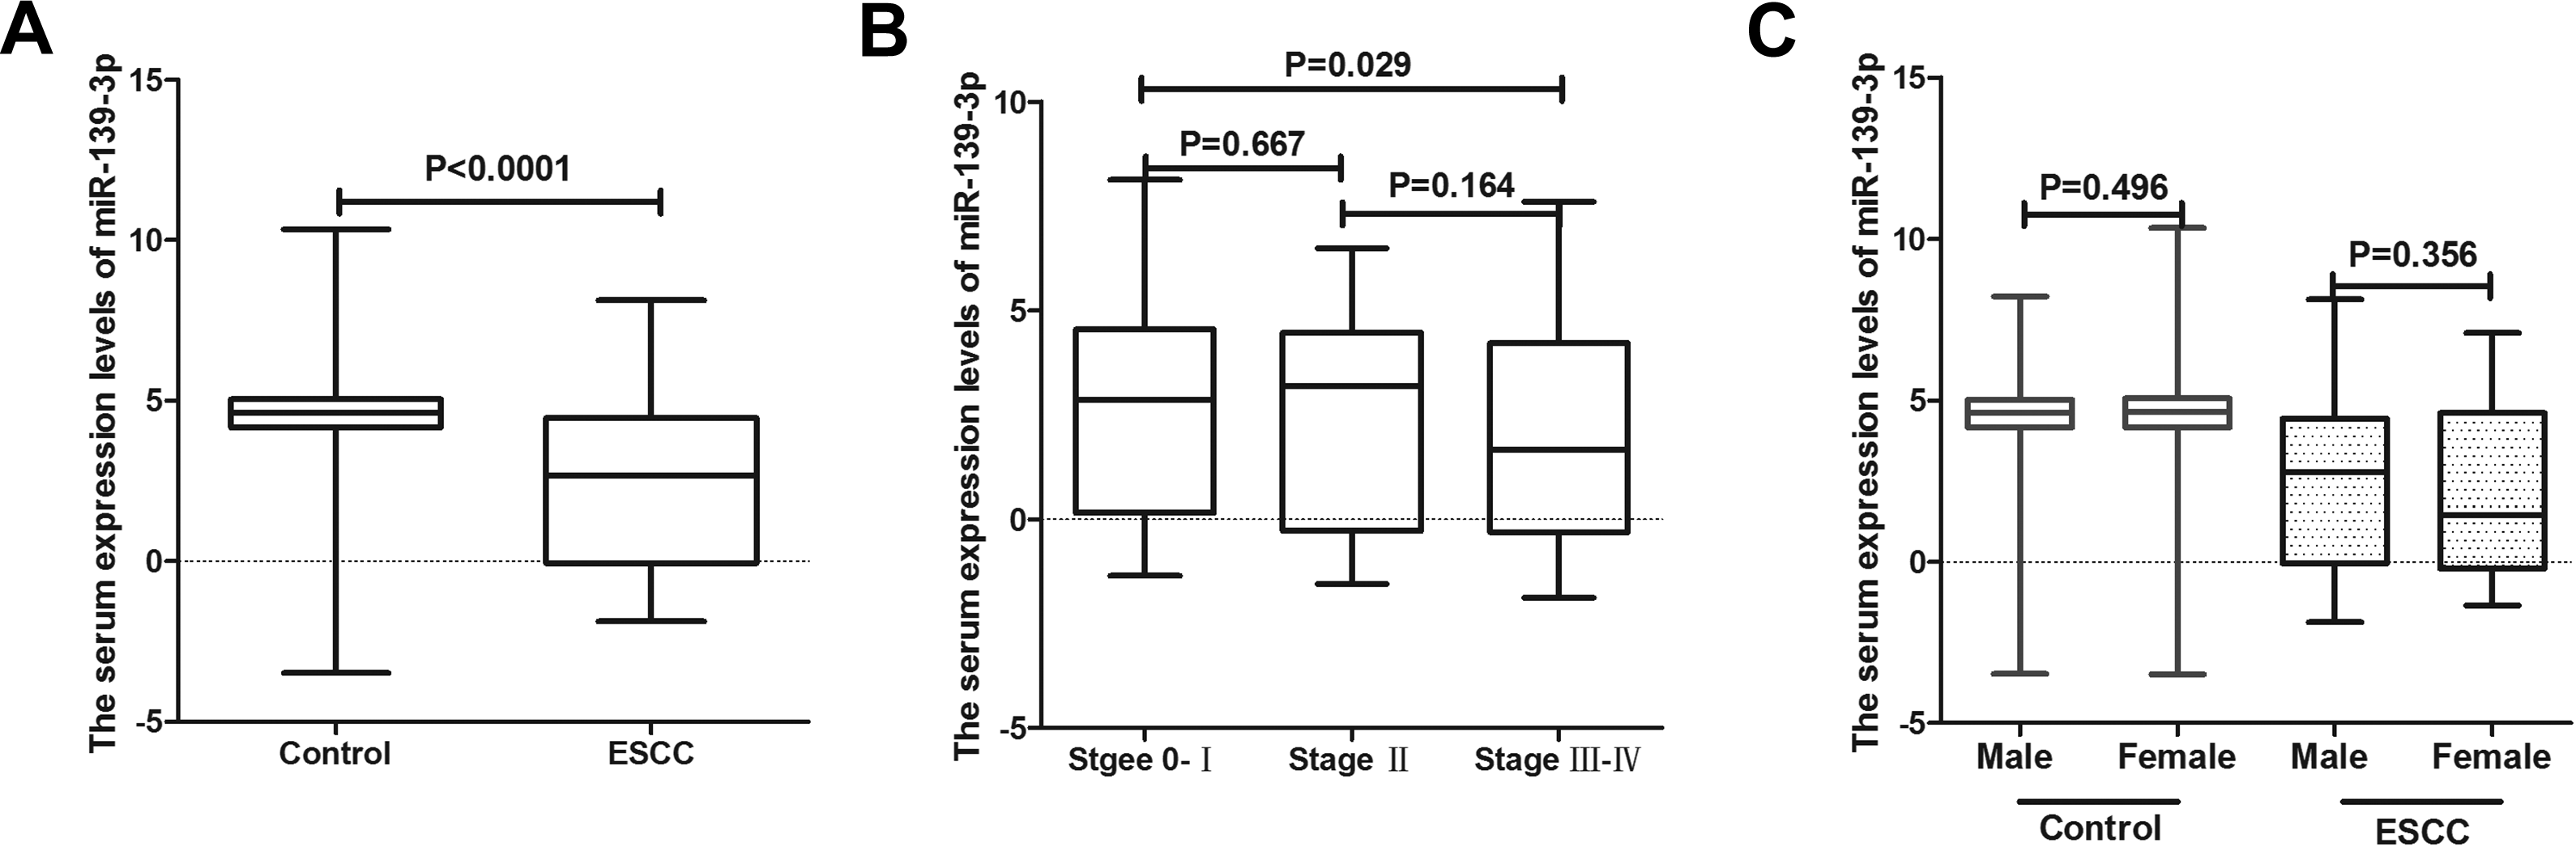
The serum expression levels of miR-139-3p in GSE122497. A, Box plots of the serum miR-139-3p expression levels in healthy controls (n = 4965) and patients with ESCC (n = 566). B, Box plots of miR-139-3p levels for stage 0 to I (n = 306), stage II (n = 115) and stage III to IV (n = 145) categories. There were significant differences between stage 0 to I and stage III to IV (P = .029). C, Box plots of miR-139-3p levels between male and female in control (n = 2217 vs n = 2748) and ESCC (n = 471 vs n = 95) group. There were no significant differences between each group. ESCC indicates esophageal squamous cell carcinoma.
Analysis of the ROC curve revealed that at the optimal cutoff value of ≤ 4.035 for miR-139-3p, the sensitivity was 67.49% and the specificity was 80.00%, with an AUC of 0.754 (95% confidence interval: 0.743-0.766; Figure 5A). In this study, at a cutoff value of 3.495 for miR-139-3p, the sensitivity was 58.48% and the specificity was 91.38%. Sensitivity and specificity for patients with early stage of ESCC were 54.9% and 93.01%, respectively (Figure 5B and Table 1). To further verify the clinical performance of serum levels of miR-139-3p, we analyzed the miR-139-3p expression level at different stages and in both genders, however no difference was observed between groups except for early stage 0 to I and stage III to IV (P = .029).

Performance of the miR-139-3p to detect ESCC. A, Receiver-operating characteristic curve for the miR-139-3p for all patients with ESCC versus normal controls in GSE122497. B, Receiver-operating characteristic curve for the miR-139-3p for patients with early stage (0 to I) ESCC versus normal controls in GSE122497. ESCC indicates esophageal squamous cell carcinoma.
Diagnostic Results for the MiR-139-3p in ESCC.

Abbreviations: AUC, area under the curve; CI, confidence interval; ESCC, esophageal squamous cell carcinoma;
a Based on early stage (0-I).
Candidate Target Genes of MiR-139-3p
Candidate target genes of miR-139-3p were identified by differential expression analysis based on TCGA and 3 target gene prediction platforms. In the differential expression analysis, a total of 185 ESCA and 11 normal tissue samples were included. In addition, 2352 upregulated genes (log2FC > 1) were selected based on differential expression analysis performed by the R package “limma.”
Furthermore, 3193 miR-136-5p genes predicted by 3 online platforms were screened out. Finally, 395 overlapping genes were defined as candidate target genes of miR-139-3p.
Bioinformatics Analysis of Overlapping Genes
Gene Ontology and KEGG Enrichment Analysis
By GO function analysis, 10 significant biological processes (BPs), 1 molecular function, and 3 cell components (CCs) were identified in ESCA (Figure 6A and C). The top 5 KEGG pathway enrichment involved in ESCA included Epstein-Barr virus (EBV) infection, human T-cell leukemia virus 1 infection, human cytomegalovirus infection, phagosome, and Kaposi sarcoma-associated herpes virus infection (Figure 6B and D).

Overview of significant enriched GO and KEGG terms. The x-axis represents the ratio of involved genes, and the y-axis represents the GO and KEGG terms. Each bubble represents a term. The size of the bubble indicates the number of involved genes. Lighter colors indicate smaller P values. A, Enriched GO terms; B, enriched KEGG terms; C, significant enriched GO terms and involved genes; D, significant enriched KEGG terms and involved genes. GO indicates Gene Ontology; KEGG, Kyoto Encyclopedia of Genes and Genomes.
PPI Network and Module Analysis
The PPI network, incorporating 394 nodes and 1095 edges, was generated by inputting the 395 overlapping target genes using String ( https://string-db.org/; Figure 7). Ultimately, a total of 6 hub genes (CD1A, FCGR2A, ANPEP, CD1B, membrane metalloendopeptidase [MME], and TWIST1) were verified using module analysis, which illustrated the most densely connected region in the PPI network based on topology (Figure 8).
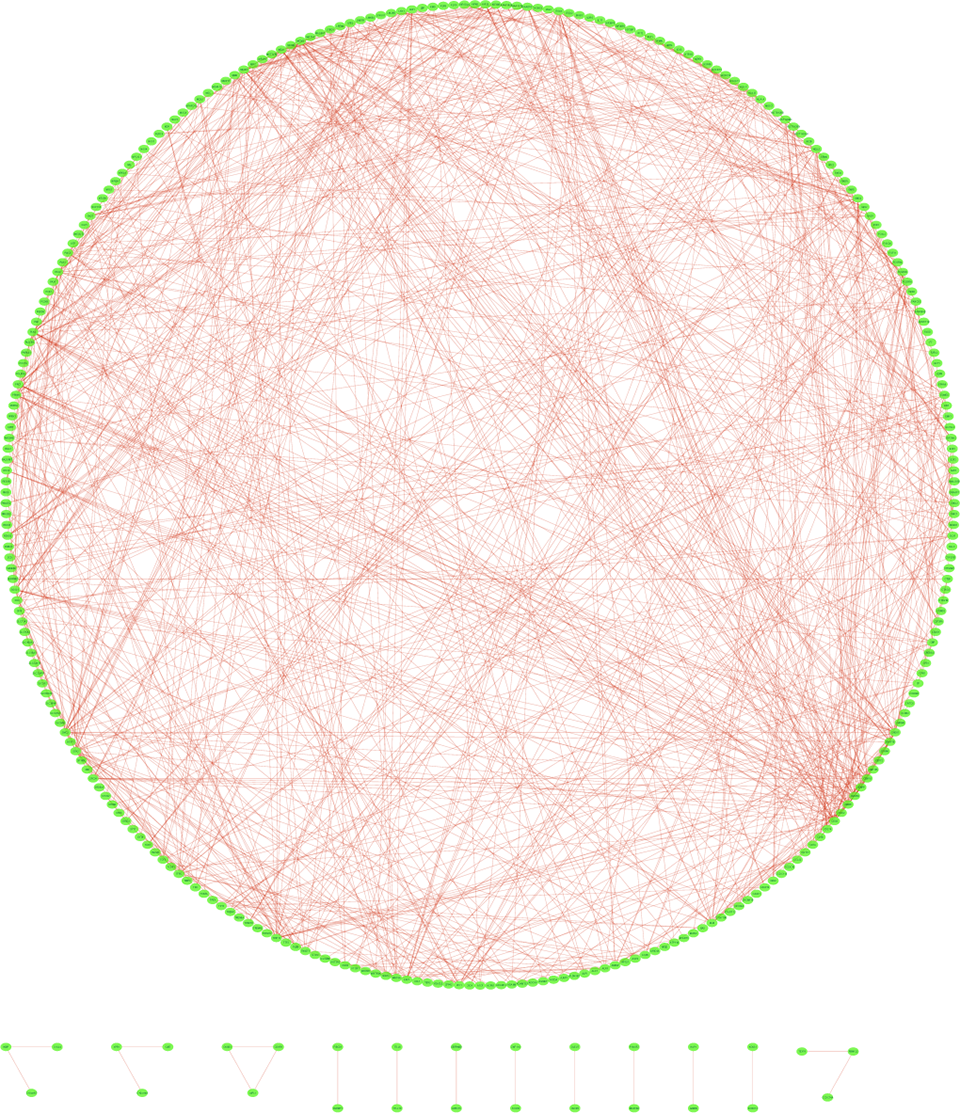
Protein–protein interaction network of possible miR-139-3p target genes. Each node represents a gene-encoded protein, while lines between the nodes represent protein associations.
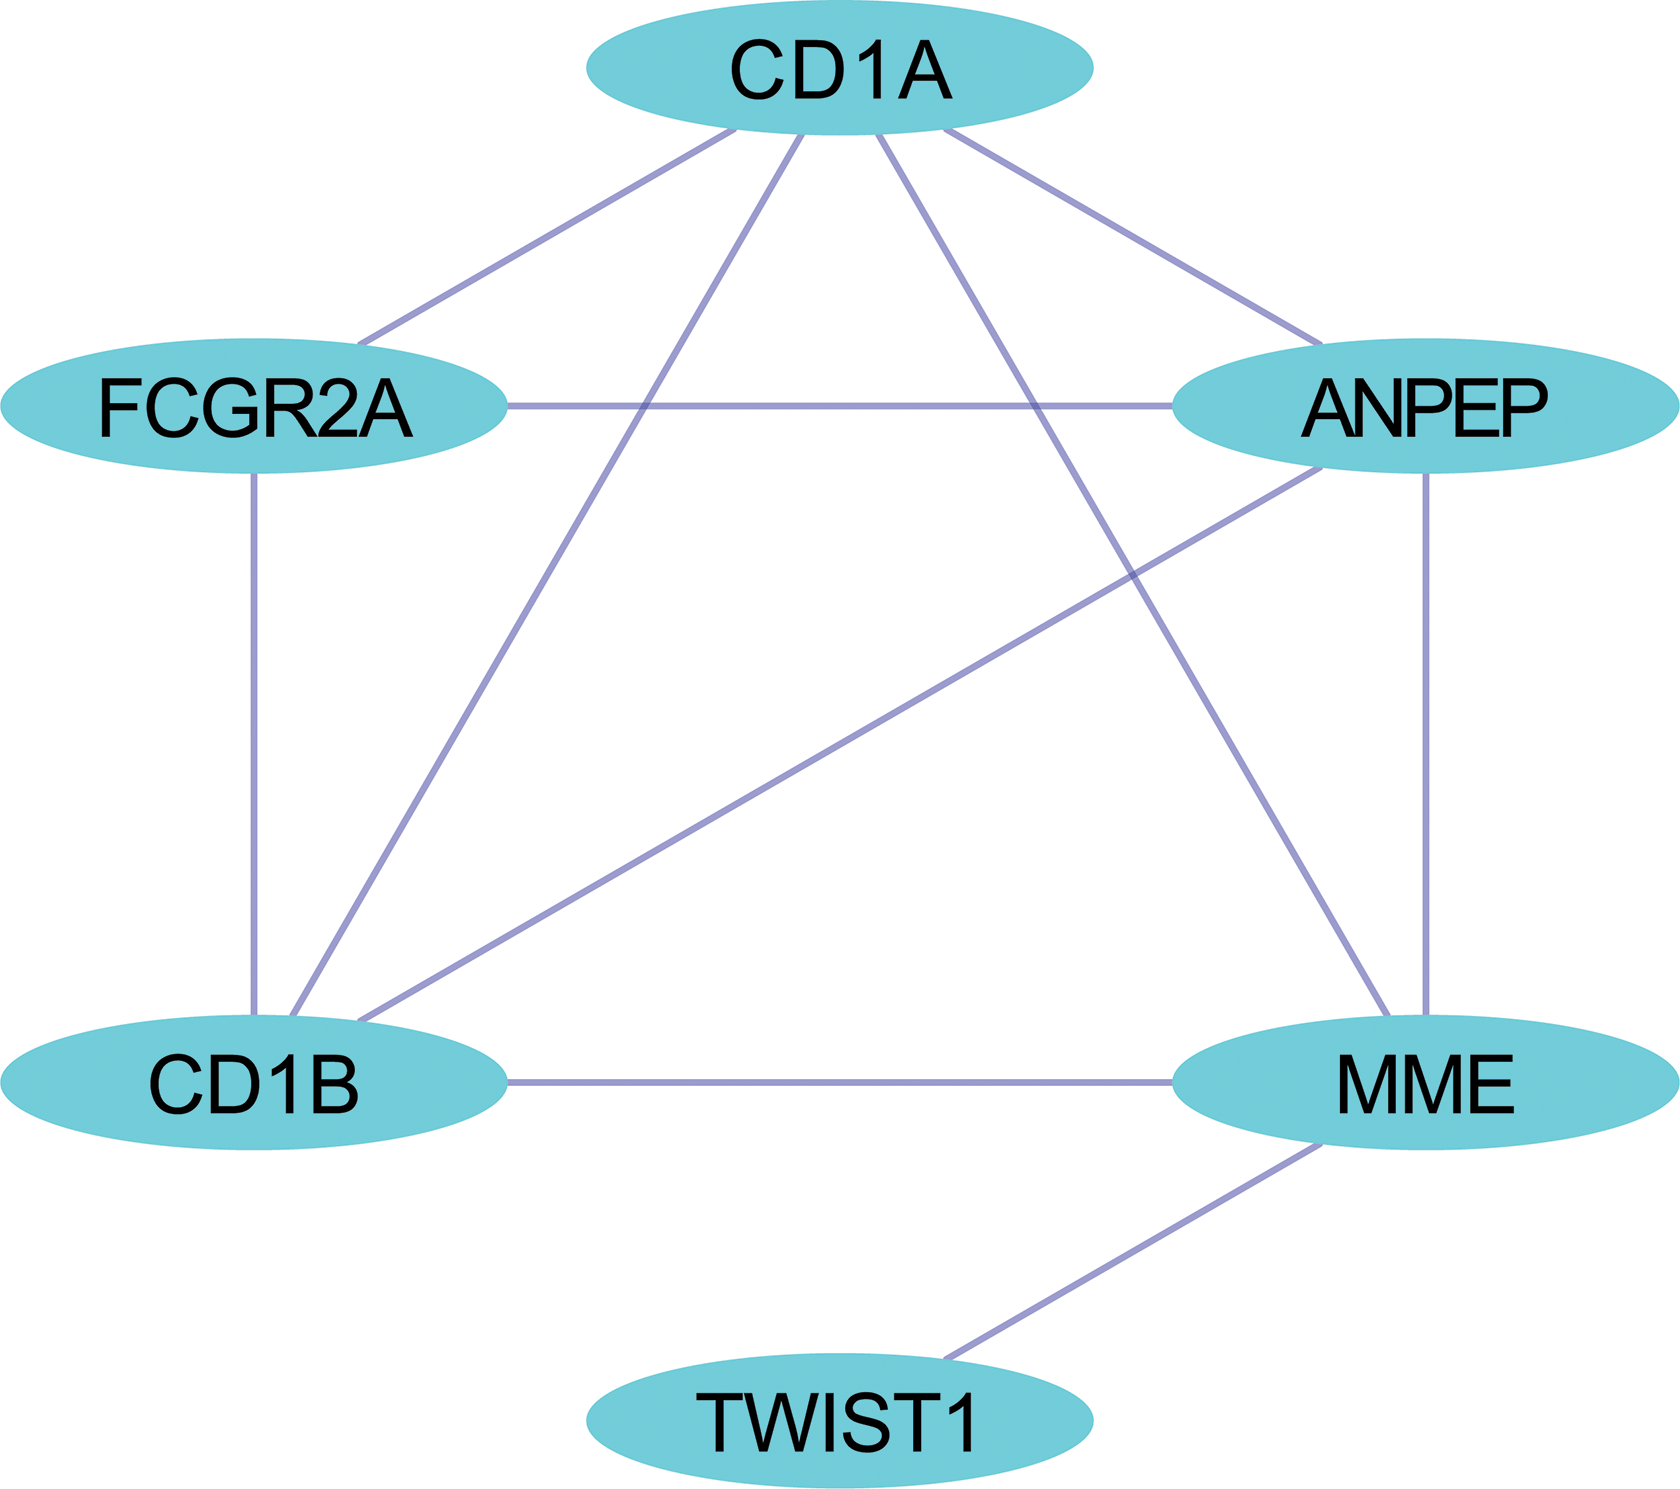
Hub genes of miR-139-3p from the PPI network. The network consists of 6 nodes and 10 edges.
Validation, Expression, and Prognostic Value of Hub Genes
MiR-139-3p was downregulated in ESCA, therefore, genes that showed increased expression in ESCA may have great potential serving as target genes. Of the 6 hub genes, FCGR2A and MME exhibited increased expression (P < .05) in 182 ESCA tissues and 286 PCT tissues (Figure 9).

Expression of hub genes in ESCA and PCT from GEPIA data. Expression of the hub genes was detected in 182 ESCA tissues (T) and 286 PCT tissues (N). Six hub genes—(A) CD1A, (B) FCGR2A, (C) ANPEP, (D) CD1B, (E) MME, and (F) TWIST1. ESCA indicates esophageal carcinoma; GEPIA, Gene Expression Profiling Interactive Analysis; MME, metalloendopeptidase.
In total, 182 cases with ESCA were included in the Kaplan-Meier curve analysis. Our data showed that low MME expression significantly correlated with a better OS (HR = 1.8, P = .015; Figure 10A) but not DFS (HR = 1.5, P = .1; Figure 10B). However, the survival analysis did not show any statistical significance for FCGR2A.

Kaplan-Meier survival curves of 182 cases with ESCA according to MME gene expression levels. A, OS survival curve of patients with ESCA based on MME expression level (HR = 1.8, P = .016). B, Disease-free survival curve of patients with ESCA based on MME expression level (HR = 1.5, P = .11). ESCA indicates esophageal carcinoma; HR, hazard ratio; MME, metalloendopeptidase; OS, overall survival.
Discussion
Advances in circulating miRNA research have demonstrated that miRNA is a stable and reliable serological biomarker. 22 Accumulating evidence has confirmed the potential of miRNAs as biomarkers for various types of cancer, including lymphoma, lung, breast, gastric, and esophageal cancers. 23 -27 Studies using plasma levels of miR-141 to identify patients with cancer indicated it may have potential as a novel blood biomarker. 28 -30
In this study, we performed genome-wide miRNA profiling from GEO and TCGA databases and identified miR-139-3p as a candidate for further analysis. The validation data from GEO database (GSE122497) revealed that miR-139-3p (sensitivity: 67.49%, specificity: 80.00%, and AUC: 0.754) may have a similar diagnostic performance as other markers, such as miR-1246 (sensitivity: 71.3%, specificity: 73.9%, and AUC: 0.754) and a superior discriminatory power when compared with squamous cell carcinoma antigen (sensitivity: 57.4%, specificity: 67.4%, and AUC: 0.665). 22 Expression levels of miR-139-3p in serum samples from patients with early stage 0 to I were significantly higher when compared to those from patients with stage III to IV (P = .029). However, no significant correlation was observed with patients’ age and gender. Furthermore, we observed a similar expression of miR-139-3p between tissue samples and serum obtained from patients with ESCC. Currently, the function of miR-139-3p regarding acting as an oncome or tumor suppressor in ESCA is unknown. In the current study, we investigated the function of miR-139-3p through possible target genes. The GO and KEGG analyses were performed to identify enriched pathways of possible target genes. For BP, we discovered the top 3 genes and directly related terms included pattern specification process, development of the skeletal system, and regionalization. For CC, the top 3 terms were side of membrane, transcription factor complex, and external side of the plasma membrane. For MIF, we discovered that DNA-binding transcription activator activity polymerase II specific was the dominant function. The KEGG analysis showed that EBV infection was top pathway enrichment involved in ESCA. These findings were also confirmed in other studies. Wu et al. reported the involvement of herpes simplex virus (HSV) and EBV in ESCAs and the relationship between HSV and EBV infection and ESCA cell differentiation. 31 -33
Here, we constructed an interaction network of target genes and selected the most densely connected region based on topology. A total of 6 genes were identified, including CD1A, FCGR2A, ANPEP, CD1B, MME, and TWIST1. Finally, FCGR2A and MME were confirmed to be significantly different by the GEPIA tool. Through Kaplan-Meier survival analysis, we discovered that MME significantly correlated with the OS but not with the DFS of patients with ESCA. Low expression levels of MME predicted a better OS. Metalloendopeptidase is also named neprilysin, CALLA, NEP, SFE, and CD10, and belongs to the peptidase M13 family. Metalloendopeptidase is overexpressed in many cancers, such as colorectal carcinoma, pancreatic endocrine tumor, and advanced melanomas. In ovarian cancer, low MME expression may indicate a poor outcome (response to platinum). 34 However, in prostate cancer, the MME positive group predicted a better prognosis. 35 Conflicting results have been reported in bladder carcinoma: A higher MME expression was reported in noninvasive carcinomas. 36 Thus, these findings indicated that the function of MME in cancer is cell-type dependent. Metalloendopeptidase/CD10 is a remarkable member of a class of widely expressed cell surface proteins, endopeptidases. Metalloendopeptidase is considered the prototype of the membrane bound zinc-dependent endopeptidase family. It regulates the physiological functions of various peptides by reducing extracellular concentration that can be used for receptor binding. The DNA sequence related to MME is located on human chromosome 33q21-27.Three types of MME have been identified by alternative splicing, which suggested that expression of the MME gene may be controlled in a tissue-specific manner. 37 These findings are consistent with the results of our GO functional analysis. Metalloendopeptidase is a key molecule that integrated the cell environment or intracellular signals. These signals control main physiological functions, which may be related to important changes in cell/tissue biology and remodeling of the microenvironment. Further experimental studies will be required to confirm these findings.
Our study had several limitations. The Cancer Genome Atlas databases only contain ESCA data and are not subdivided into ESCC. Part of our analyses uses ESCA for analysis, although most ESCA is considered squamous cell carcinoma. This is a study that is based on bioinformatics analysis. Therefore, the data obtained in this study need to be verified by additional experiments.
In summary, this study was performed online, using comprehensive, large databases. Our findings demonstrated the diagnostic value of serum levels of miR-139-3p in patients with ESCC and suggested potential functions of miR-139-3p target MME as part of an intercellular network correlated with cancer development.
Footnotes
Authors’ Note
Yonghong Wang and Qimei Fang contributed equally to this article. YHW and QMF conceptualized the research and developed the bioinformatics model. LZT and LRT and ZZY collected the data. LZT, ZZY, YHW, and QMF performed the computational analysis. YHW, ZLZ, and LRT drafted and revised the manuscript. All authors read and approved the final manuscript. The data sets used and/or analyzed during the current study are available from the corresponding author on reasonable request.
Acknowledgments
The authors gratefully thank the TCGA, DAVID, STRING, and GEPIA databases for the valuable data.
Declaration of Conflicting Interests
The author(s) declared no potential conflicts of interest with respect to the research, authorship, and/or publication of this article.
Funding
The author(s) received no financial support for the research, authorship, and/or publication of this article.