
Abstract
BACKGROUND:
Hepatocellular carcinoma (HCC) is one of the most common malignant tumors. Due to the lack of specific characteristics in the early stage of the disease, patients are usually diagnosed in the advanced stage of disease progression.
OBJECTIVE:
This study used machine learning algorithms to identify key genes in the progression of hepatocellular carcinoma and constructed a prediction model to predict the survival risk of HCC patients.
METHODS:
The transcriptome data and clinical information were downloaded from The Cancer Genome Atlas (TCGA) and Gene Expression Omnibus (GEO). The differential expression analysis and COX proportional-hazards model participated in the identification of survival-related genes. K-Means, Random forests, and LASSO regression are involved in identifying novel subtypes of HCC and screening key genes. The prediction model was constructed by deep neural networks (DNN), and Gene Set Enrichment Analysis (GSEA) reveals the metabolic pathways where key genes are located.
RESULTS:
Two subtypes were identified with significantly different survival rates (
CONCLUSIONS:
In this study, we used machine learning algorithms to screen out 17 genes related to the survival risk of HCC patients, and trained a DNN model based on them to predict the survival risk of HCC patients. The genes that make up the model are all key genes that affect the formation and development of cancer.
Abbreviation
DEGs, Differentially Expressed Genes; DNN, Deep neural networks; FPKM, Fragments Per Kilobase of exon model per Million mapped fragments; GEO, Gene expression omnibus; GSEA, Gene Set Enrichment Analysis; HCC, Hepatocellular carcinoma; LASSO, Least absolute shrinkage and selection operator; ROC, Receiver operating characteristic; TCGA, The cancer genome atlas.
Introduction
Among the most common cancers in the world, hepatocellular carcinoma (HCC) ranks fifth and is also one of the top three causes of cancer-related deaths [1]. In North America and Europe, these historically low incidences of HCC have increased in recent years [2]. Moreover, the early symptoms of HCC patients are not obvious, and most of them are already in the late stage after discovery. Therefore, there is an urgent need for an accurate model to predict the prognostic survival risk of HCC patients to guide clinical treatment [3]. Furthermore, the high-throughput sequencing data and chip data that are publicly available around the world are increasing. Finding the characteristics of cancer from the enormous data requires efficient tools. Machine learning and deep learning are scientific researches on algorithms and statistical models. They can efficiently help us process many genes when constructing prognostic models [4]. There have been many precedents for the use of machine learning algorithms to build cancer prognosis prediction models in recent years. Yang et al. used the random forest algorithm to predict the risk of colorectal cancer recurrence. Xue et al. screened 12 genes for predicting the survival risk of lung adenocarcinoma patients through machine learning algorithms. Liu et al. used the LASSO algorithm to identify the melanoma immune-associated prognostic features [5, 6, 7].
Changes in cell gene expression and disorders of metabolic, pathological, and physiological signaling pathways can promote the course and progression of HCC [8, 9]. In addition, complex signaling pathway changes will significantly influence the migration and invasion of HCC cells. Cancer cells up-regulate the expression of various genes that promote metastasis to metastasize. An in-depth understanding of these molecular mechanisms may help develop effective metastasis-targeted therapies and improve the overall prognosis of HCC patients. In recent years, many researchers have established HCC prognostic prediction models and explored the influence of genes in the model on the formation and development of cancer from the molecular mechanism [10, 11, 12].
The study aims to use machine learning algorithms to screen prognosis genes of hepatocellular carcinoma (HCC), identify two novel subtypes through an unsupervised clustering method, and construct a prediction model with significant prognostic value using a deep neural network. We integrated differentially expressed genes from TCGA transcriptome data and GEO data sets to identify overlapping differentially expressed genes. Univariate COX and multivariate COX regression were used to identify survival-related genes. K-Means clustering classifies HCC patient samples based on these survival-related genes expression. HCC patients were divided into two subtypes with high and low survival rates. Random forest and LASSO regression algorithm were used to find the most important genes that distinguish the two subtypes with high and low survival rates, 17 overlapping genes were obtained. The differentially expressed genes between the two subtypes were annotated by KEGG, GO, and MSigDB databases. The unregulated expression of 17 genes in HCC patients provides us with a key basis for the identification of two new subtypes of HCC patients and their survival rates. Use the DNN model to train the weights of 17 gene features, and build a prognostic prediction model that can accurately predict the survival risk of HCC patients.
Material and methods
Data source and processing
In this study, we selected the gene expression microarray data numbered GSE112790 stored in the GEO database (
FPKM calculation formula [14]:
COX regression model
The COX regression model is mainly used for the prognosis analysis of tumors and other chronic diseases, and the results obtained from the analysis can be directly applied to clinical applications [15]. Therefore, this analysis has a very critical role in the clinical diagnosis of cancer. This study uses the COX regression model to simultaneously evaluate the impact of multiple prognostic factors on the survival risk of patients. The above steps are all implemented with the “survminer” and “survival” packages in R. The COX model calculates the independent hazard ratio (HR) of the gene and the corresponding confidence interval, determines the significant prognostic gene through the
K-Means clustering algorithm
K-Means is an unsupervised clustering algorithm, which divides the overall sample into
Where
We calculate the Euclidean distance between HCC patient samples from TCGA for K-Means clustering and compare the contour widths under different clusters to determine the best
Random forest classification
Random forest is an excellent machine learning algorithm that performs well when applied to classification or regression. Because of its fast processing speed and ability to process large data sets, it has been widely used in the field of bioinformatics [17]. In addition, the random forest can measure the importance of features. The corresponding evaluation index is the Gini index. The larger the GINI index, the importance of this feature to the category vector is higher. We use the R package “randomforest” to implement the random forest algorithm. The high-risk and low-risk subtypes obtained through K-means clustering are used as the known category vector and the gene expression as the feature vector of random forest. After repeated training and learning, we got a random forest model with a very low out-of-bag error rate (OOB). According to the random forest algorithm principle, we also get each feature simultaneously, that is the GINI index of the gene, and sort it from high to low. The GINI index is calculated by the following formula:
LASSO algorithm
One of the defects of the random forest algorithm is that it is prone to overfitting. LASSO is a regularization method, by adding the
Where,
The overall design of this study.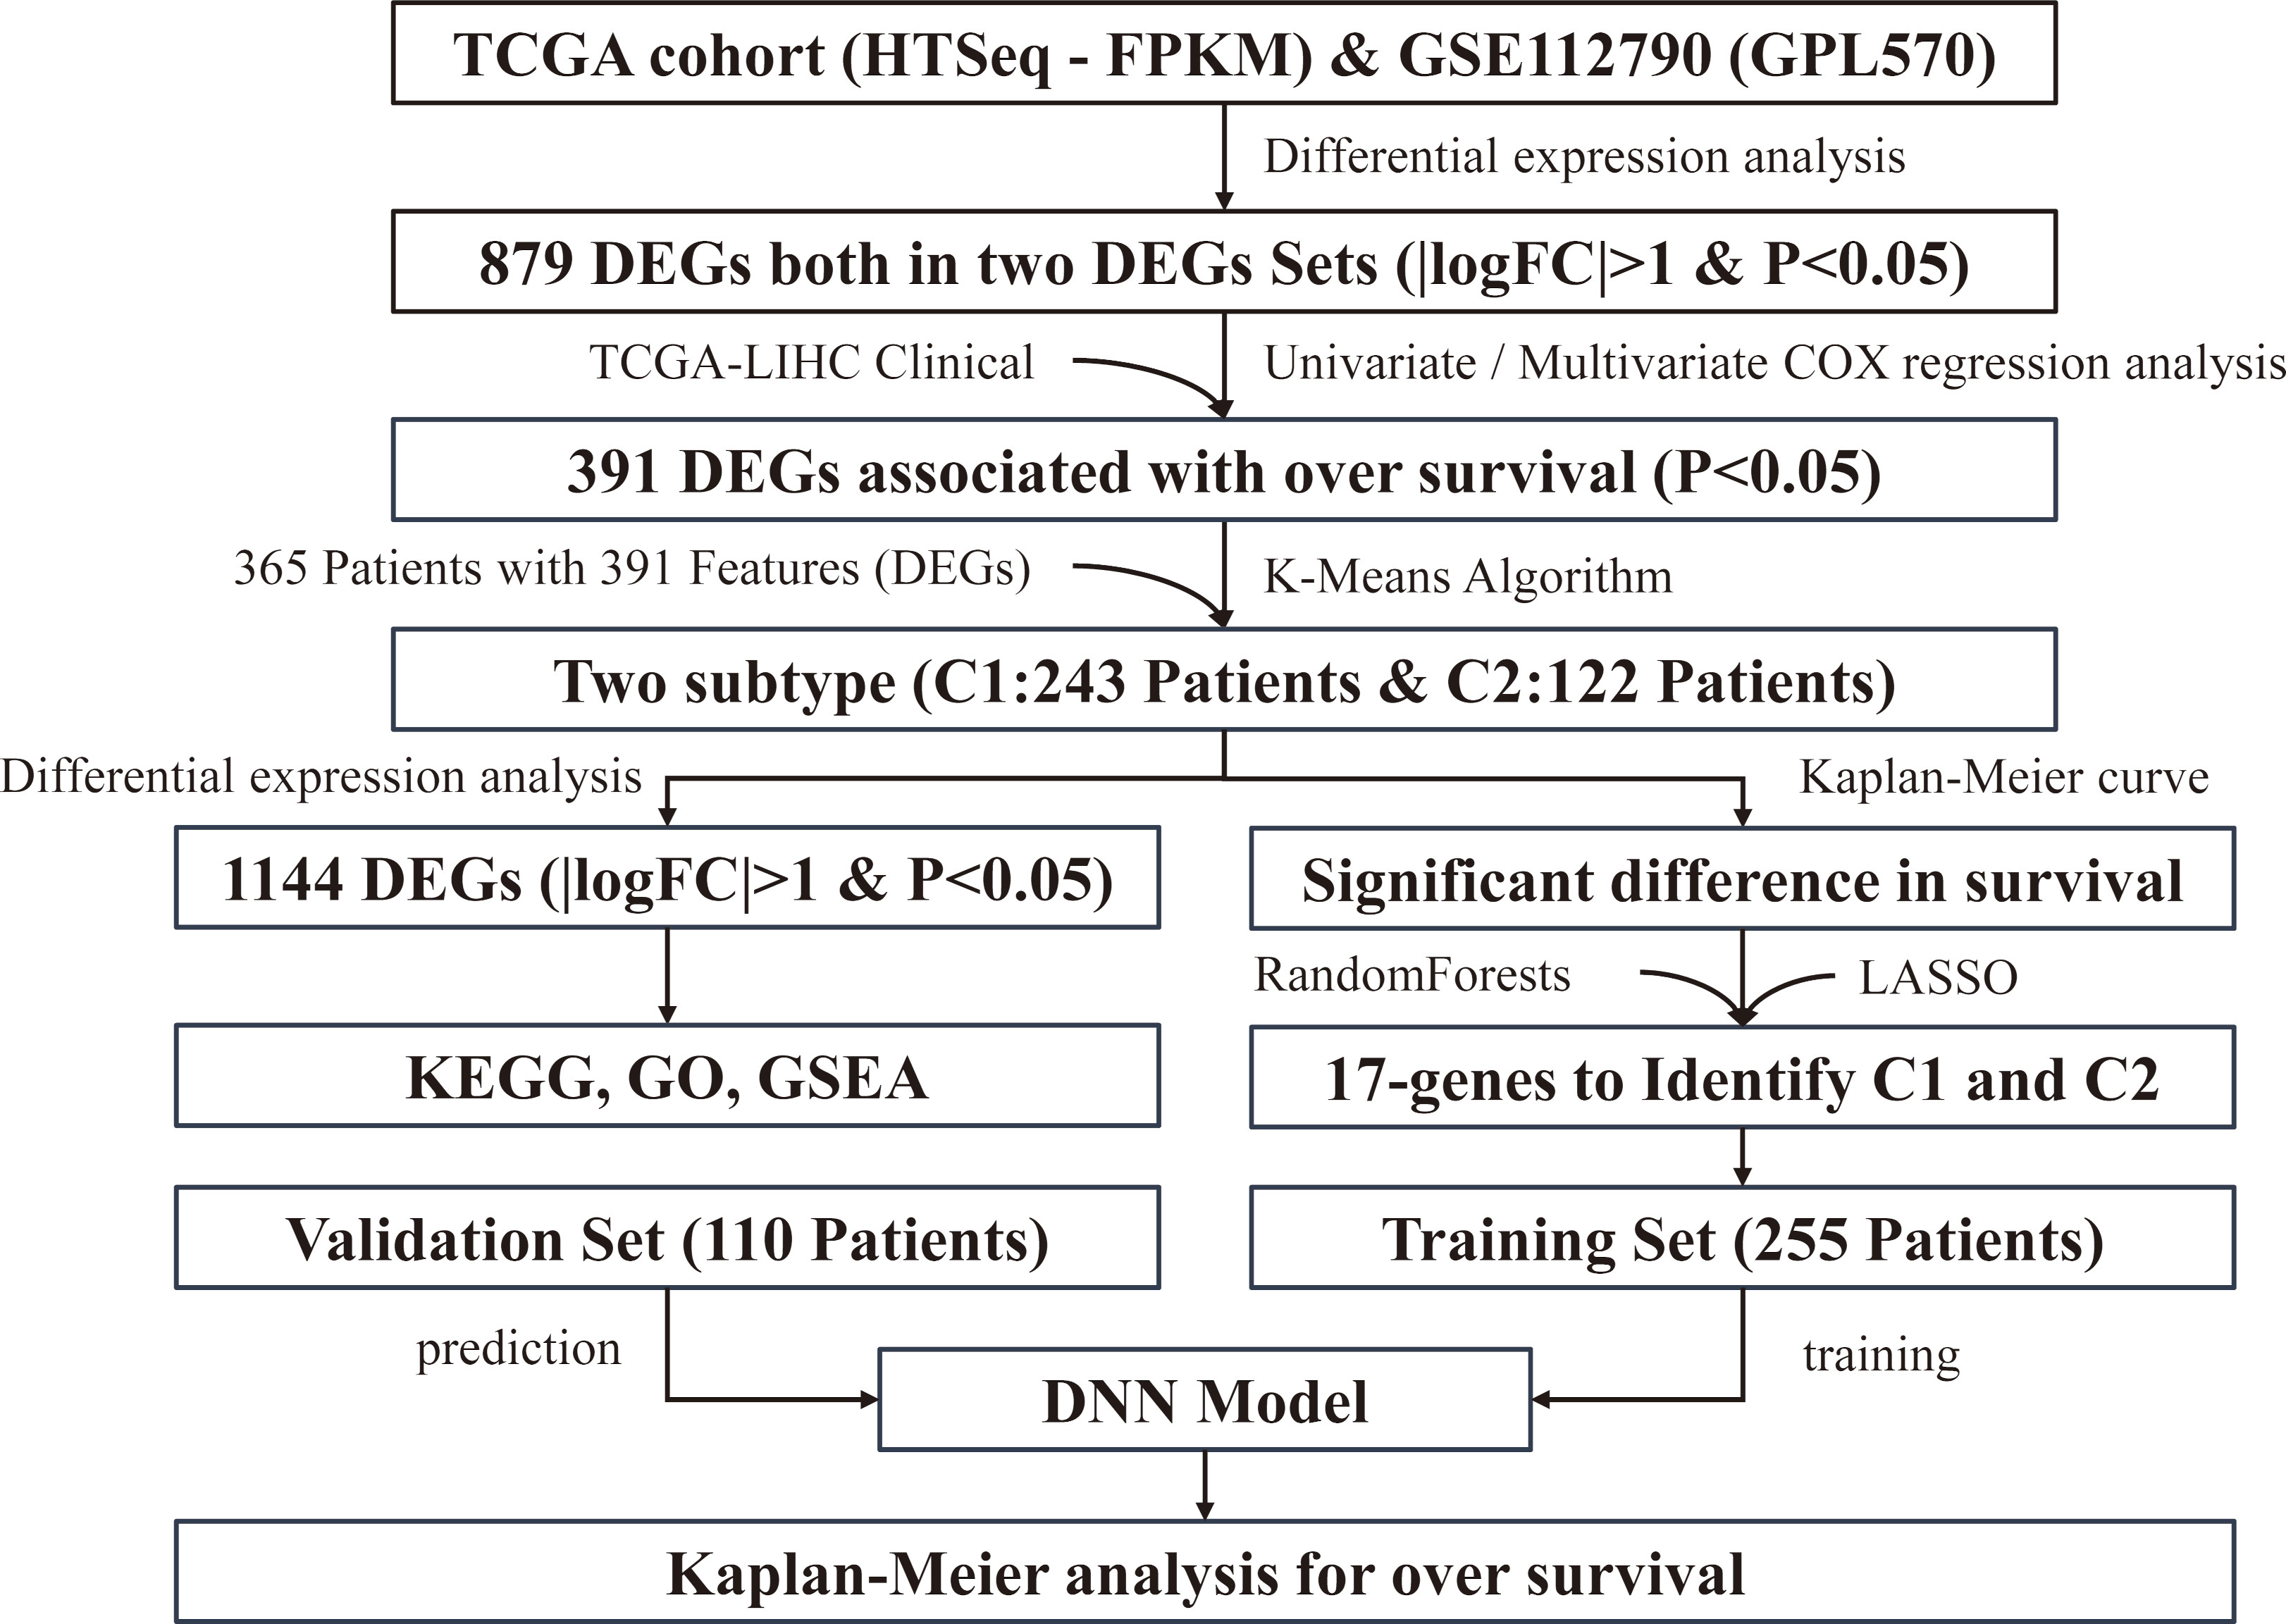
There is a screening process for variables in LASSO. Instead of fitting all variables at the beginning, LASSO selectively puts variables in to optimize the model and the performance parameters [18]. The coefficient
A deep neural network (DNN) is also called a Multi-Layer perceptron (MLP), which consists of an input layer, hidden layer, and output layer. In the study, we choose python to build the DNN model and TensorFlow as the back-end tool of Keras. The first layer in front is the input layer, the middle is the hidden layer, and the last layer is the output layer. To verify the effectiveness of the DNN model, the HCC patient samples were randomly divided by 7:3. We put 70% of the samples into the DNN model to build a mature prognosis prediction model by continuously training and learning. The other 30% of samples are used for predictive analytics. The effect of learning is controlled by the accuracy of the model output and the cross-entropy loss, and the prediction results will be compared with the K-Means results in the confusion matrix.
Gene set enrichment analysis (GSEA)
Gene Set Enrichment Analysis (GSEA) is a computational method that calculates the enrichment score, estimates its significance level, and adjusts for multiple hypothesis testing [19]. The advantage of GSEA is that it can consider genes with small differences but important functions. We used the R package “clusterProfiler” to do GSEA, and the background gene selects all the gene sets in the MSigDB database (C1, C2, C3, C4, C5, C6, C7, C8, H). We also selected Gene Ontology (GO) and Kyoto Encyclopedia of Genes and Genomes (KEGG) to annotate differential genes. There are three main categories of annotations in the GO database: Molecular Function (MF), Biological Process (BP), and Cellular Components (CC). These three functional categories define and describe the function of a gene in many aspects [20]. The KEGG database annotates the metabolic pathways that genes participate in [21].
Statistical analysis
Identifying the differentially expressed genes (DEGs) from two data sets. (A) Volcano plot presenting the differentially expressed genes (DEGs) between the tumor patient and normal group in GSE112790. (B) Volcano plot presenting the DEGs between the tumor patient and normal group in TCGA-LIHC. (C) Heatmap of differentially expressed genes (DEGs) expression. (D) Venn diagram presenting the number of the overlapped DEGs.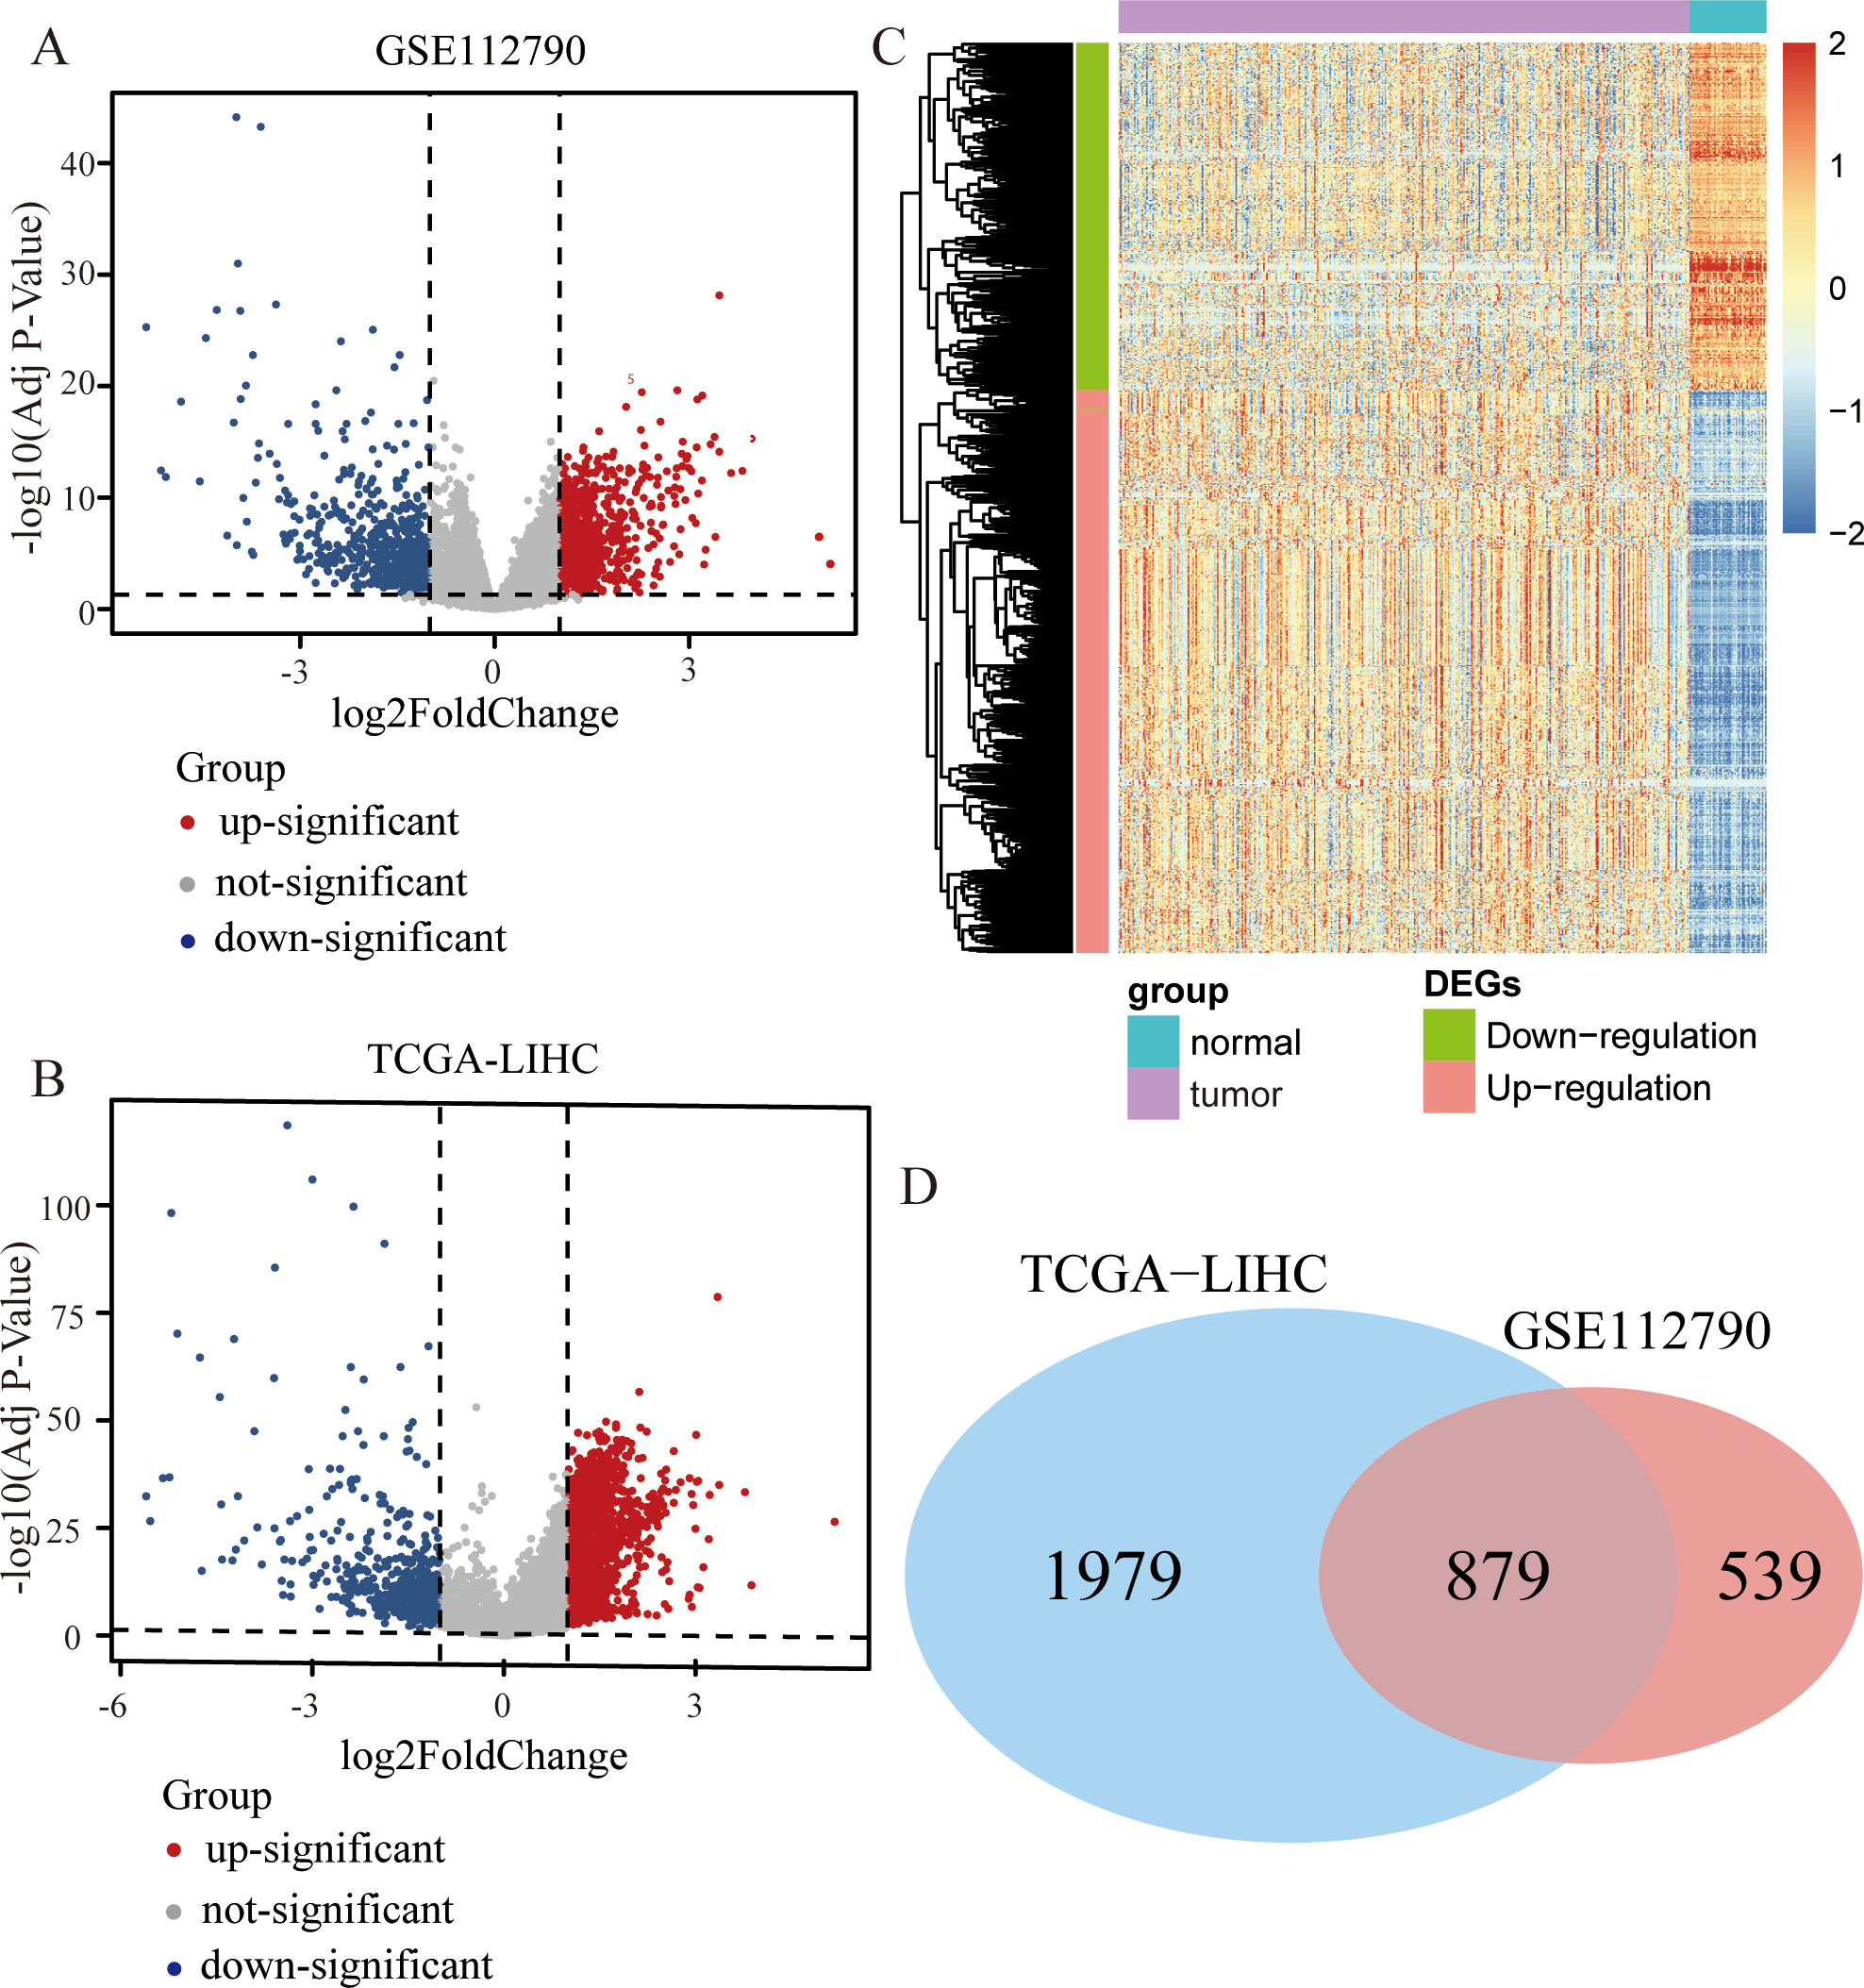
R software version 4.0.5 was used to do statistical analysis for this article.
Identification of the DEGs
Figure 1 shows the steps and logical sequence of this study. We downloaded 198 samples (including 183 patient samples and 15 normal samples) from GSE112790. Using the package “Limma” to identify the differentially expressed genes (DEGs), we obtained 624 down-regulated genes and 794 up-regulated genes. The corresponding volcano map is shown in Fig. 2A. We also downloaded 421 samples (including 371 patient samples and 50 normal samples) from TCGA and identified 464 down-regulated genes and 2394 up-regulated genes after the differential expression analysis. The corresponding volcano map is shown in Fig. 2B. The heatmap shows all the DEGs (Fig. 2C). We selected overlapping differentially expressed genes (DEGs) from two differential expression analyses (Fig. 2D).
Selection of key HCC survival-related genes
Two novel subtypes based on unsupervised K-Means clustering. (A) The curve shows that when the number of clusters is 2, our data can have the best clustering effect. (B) A distribution diagram of two types of samples in a two-dimensional coordinate. (C) Kaplan-Meier survival analysis of the two novel subtypes based on K-Means clustering. The Red line indicates the low-risk group; the blue line indicates the high-risk group. (D) ROC curves show that the result of K-Means clustering is reliable. (E) The proportion of different cancer stages in the two groups (G1, G2, G3, G4). (F) The proportion of different cancer stages in the two groups (Stage I, Stage II, Stage III, Stage IV).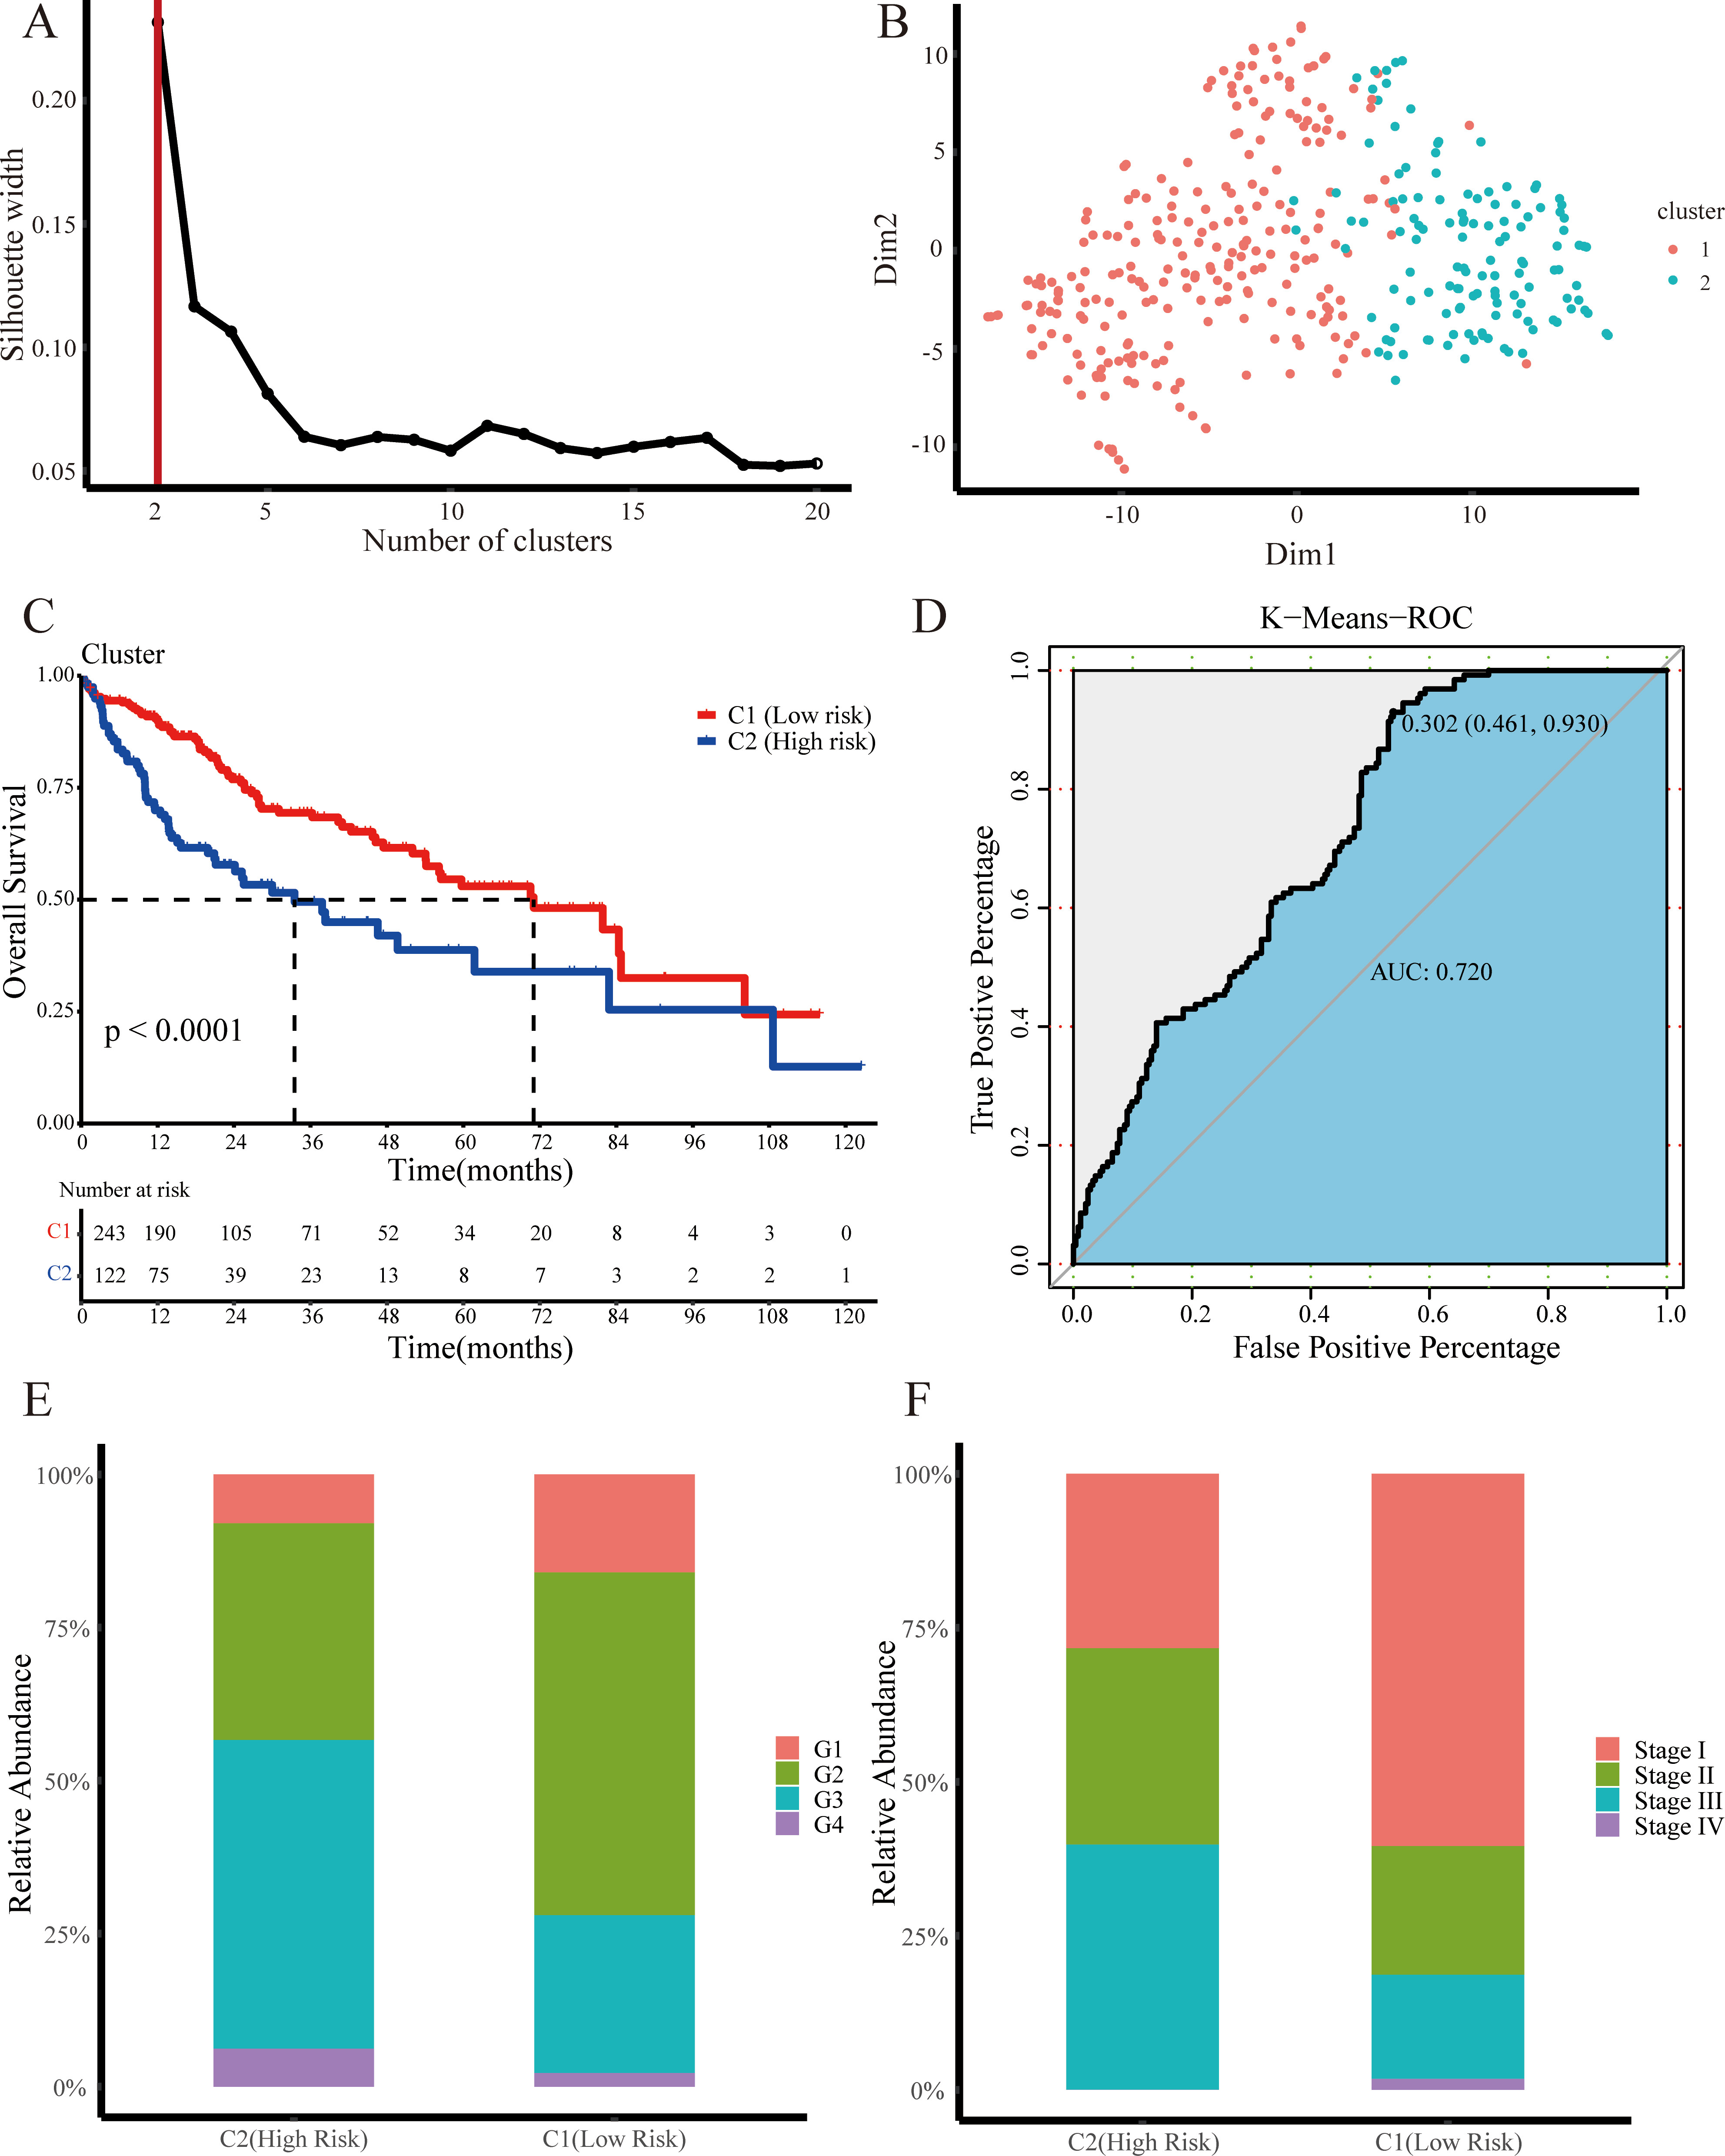
We use a univariate COX regression model in R to examine the prognostic effect of each gene. The screening threshold is
Recognition of candidate genes in RandomForest. (A) 1000 decision trees are enough to make the error of the RandomForest model converge to a reliable interval. (B) MDS plot presenting sample distribution in C1 or C2. (C) ROC curves show that the result of RandomForest is reliable. (D) The top 50 were selected because of their Gini coefficient.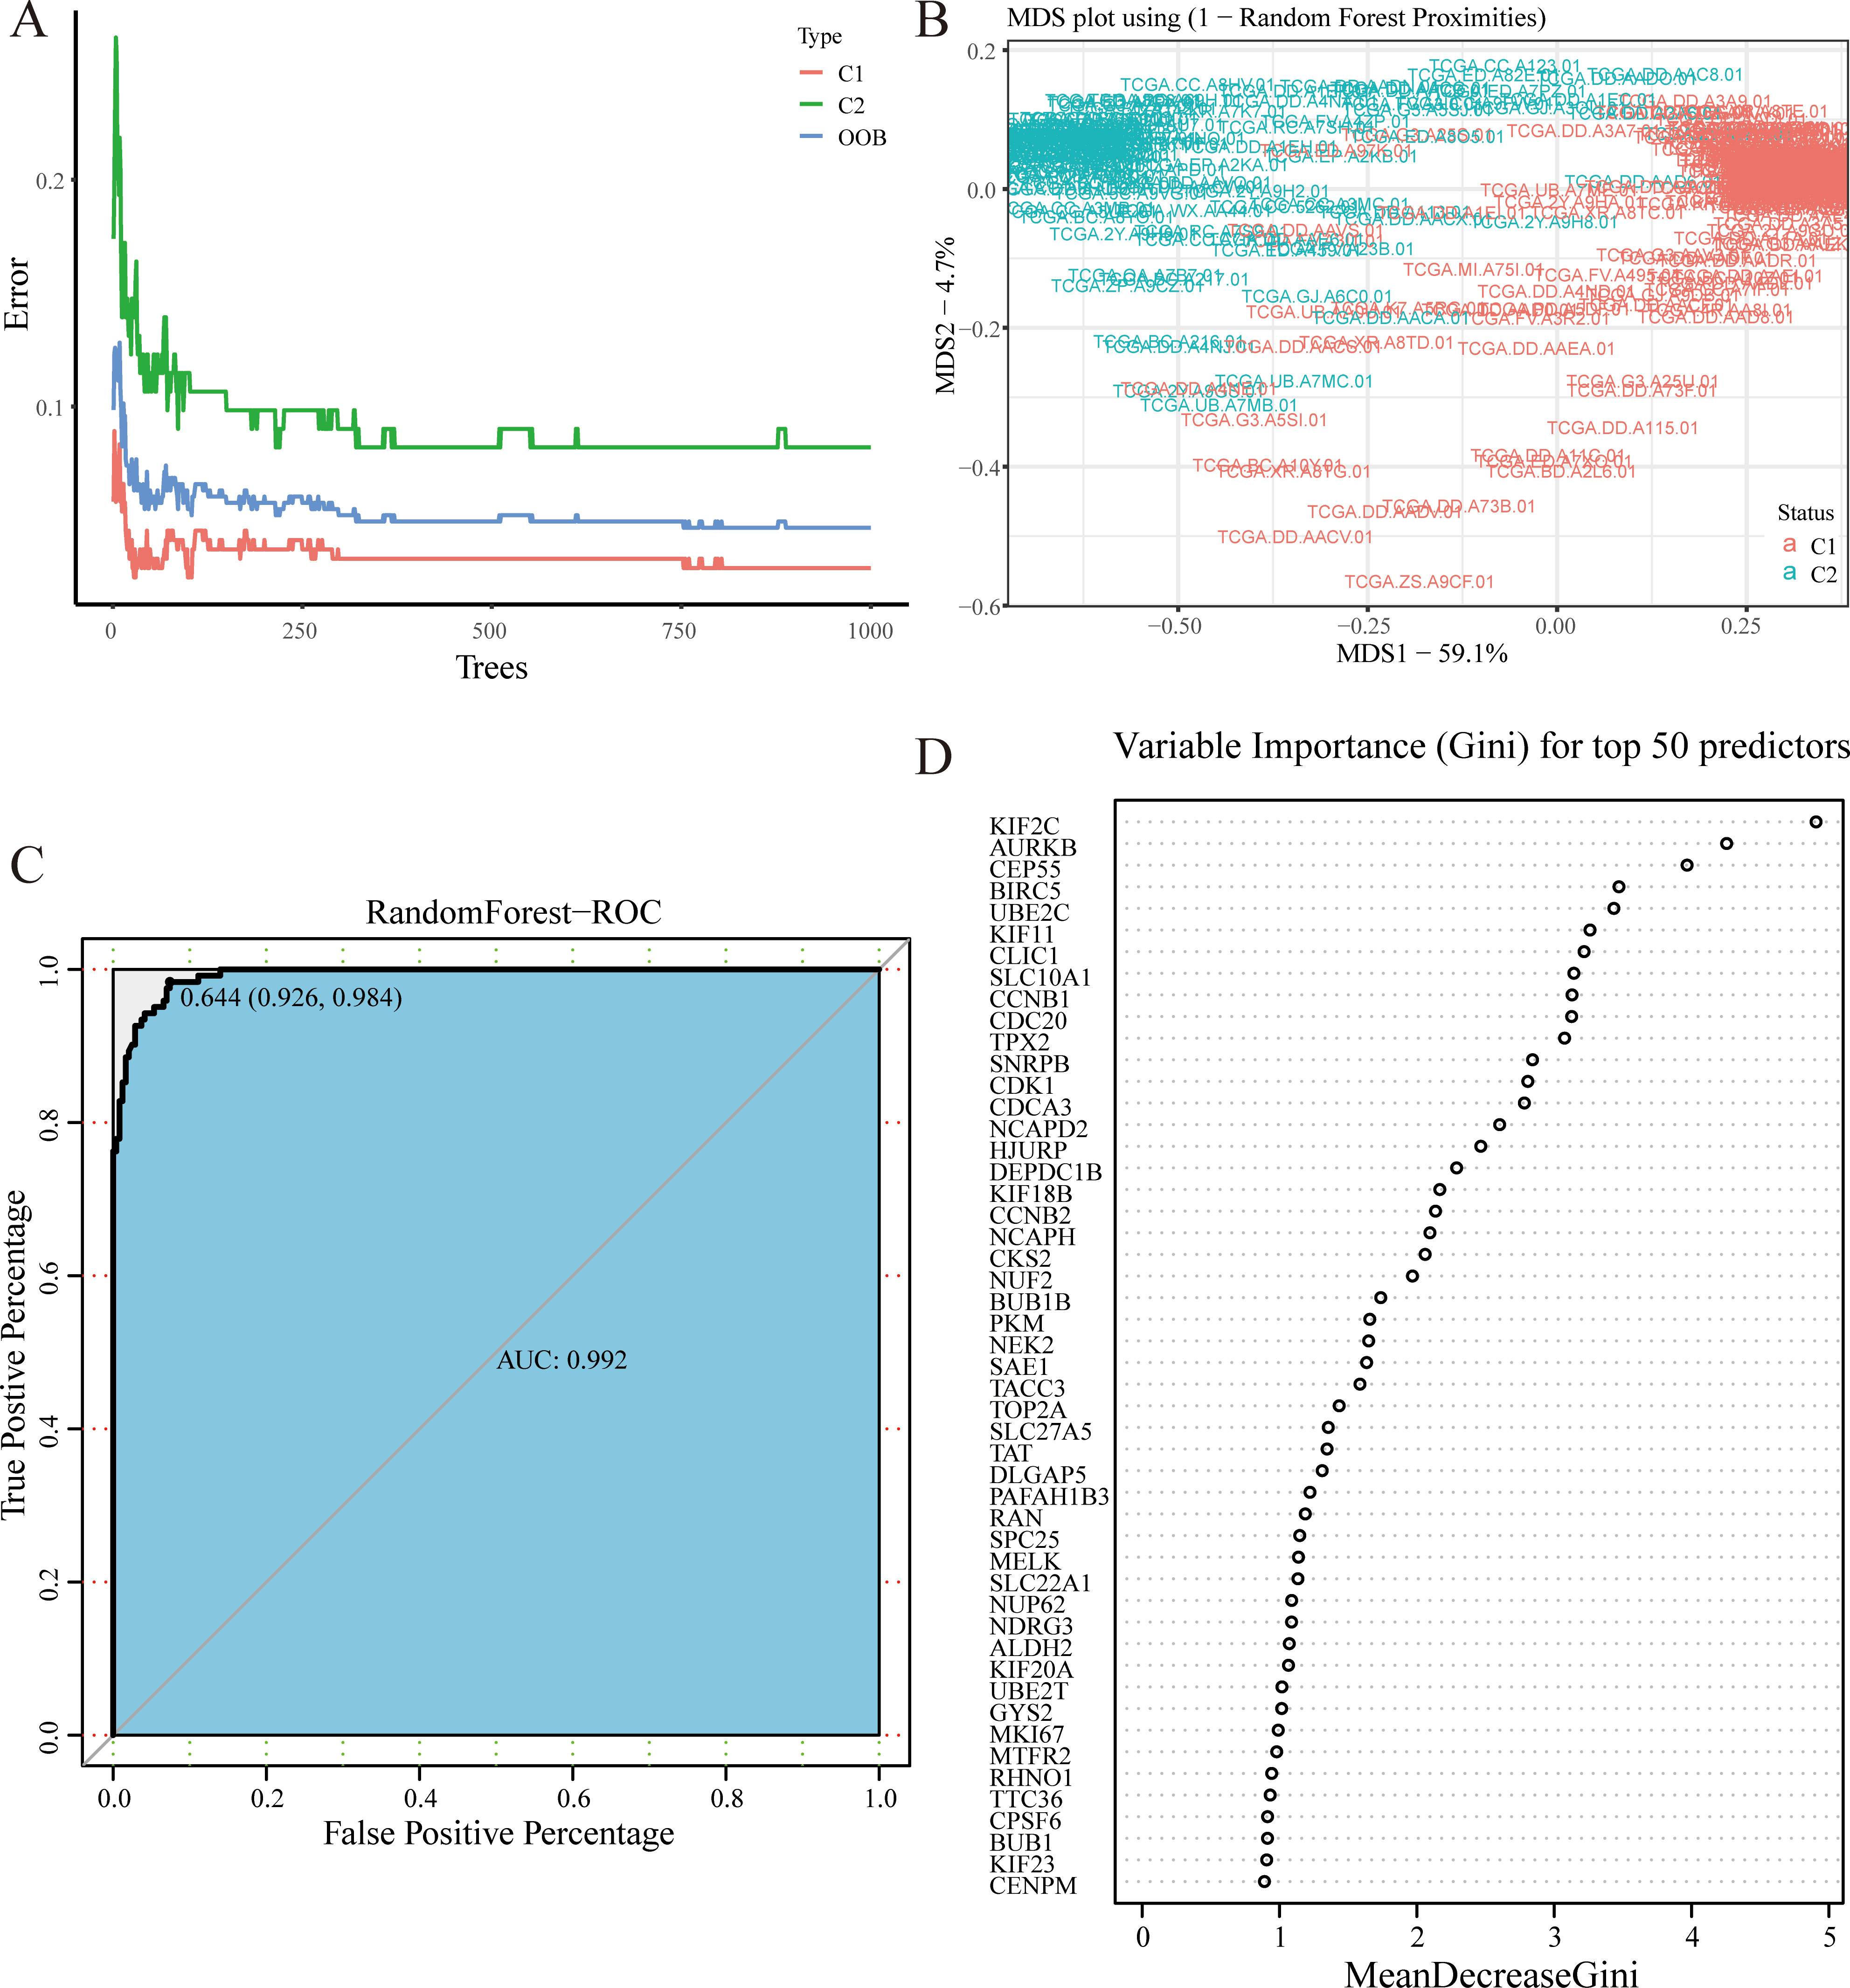
Unsupervised K-Means clustering uses the PAM function to calculate the contour width between clusters under different
Recognition of candidate genes in LASSO. (A) 47 genes were selected on LASSO coefficient profiles. The colored curves correspond to these genes. (B) The process in which the coefficient gradually tends to 0 as the lambda increases. (C) The change of binomial deviance in the LASSO model as lambda increases tells us why 47 genes were selected. (D) The change of AUC value in the LASSO model.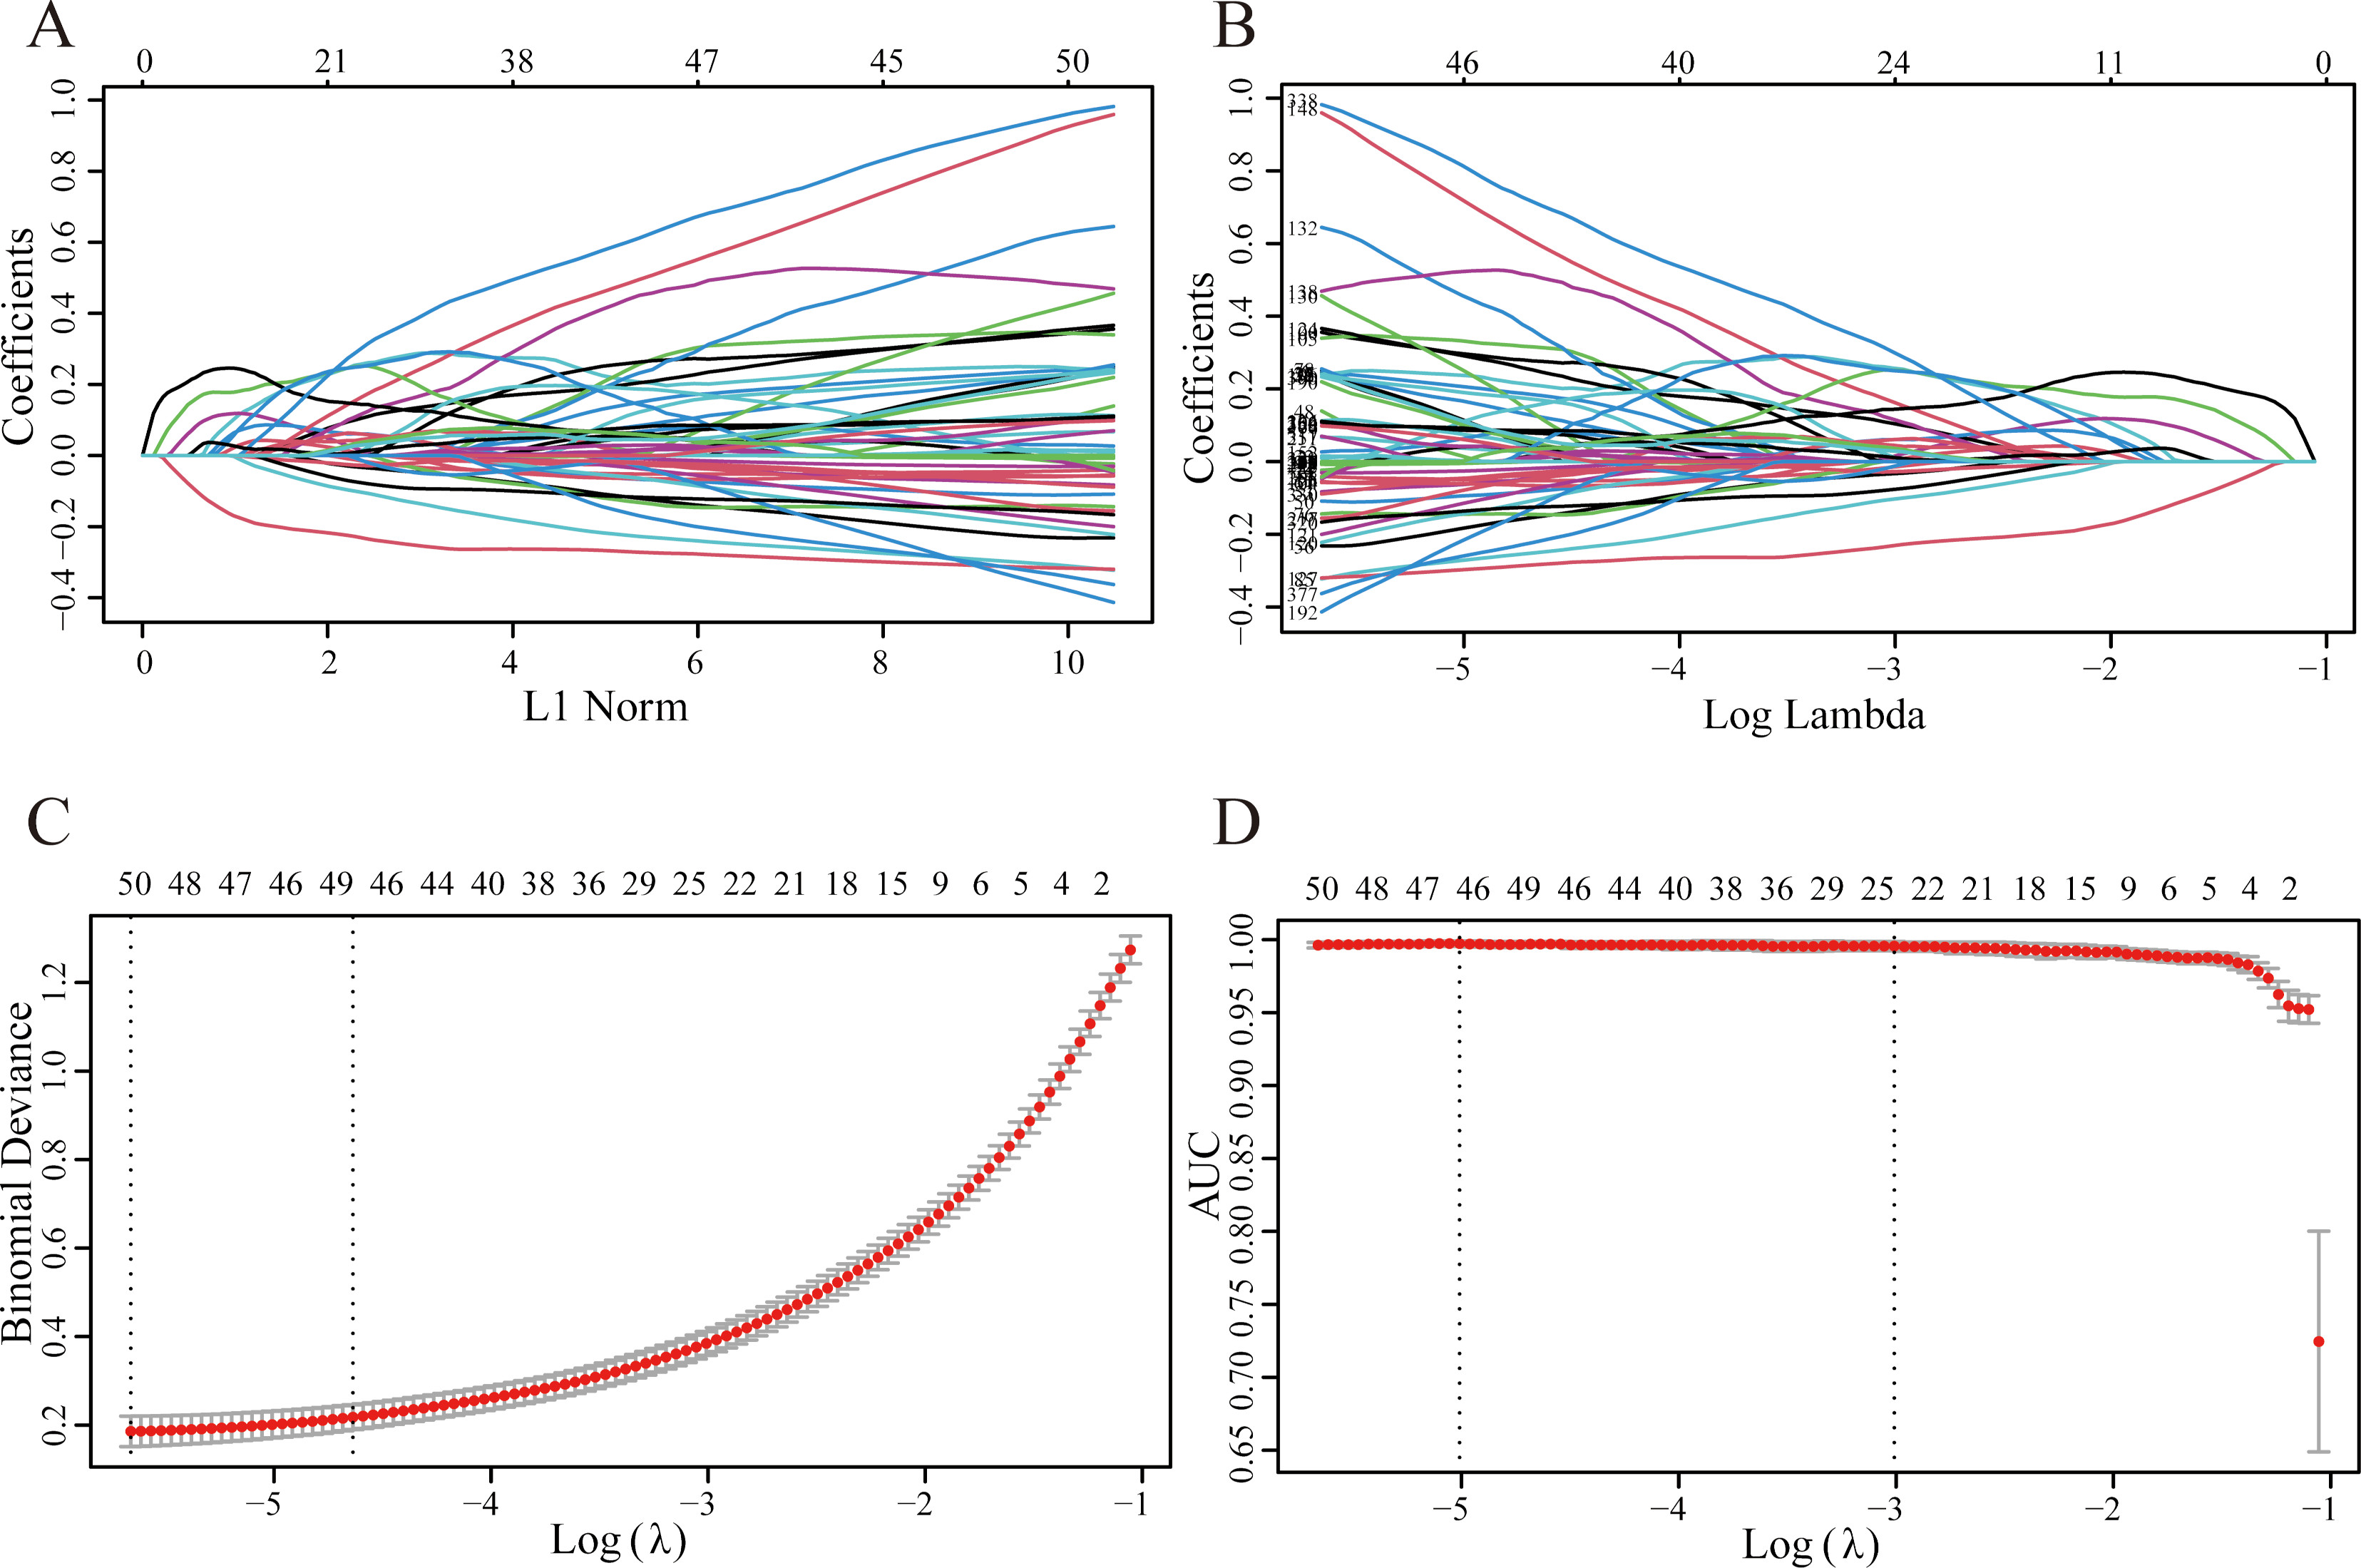
The random forest model’s number of decision trees parameter (ntree) is optimized by the error-tree diagram (Fig. 4A), and “mtry” uses the default parameters. The feature vectors of the model are survival-related genes, and the category vector uses the high-risk and low-risk subtypes. After repeated training, the out-of-bag error rate of the model is 4.66%. We convert the proximity matrix into a distance matrix and calculate the importance of each MDS axis, thereby drawing an MDS diagram (Fig. 4B). The samples of patients with high-risk and low-risk are distributed at both ends of the MDS1 axis, and the corresponding ROC curve (Fig. 4C) also verifies that the random forest model is reliable. Sort genes by their GINI coefficients from high to low and output the top 50 most important genes (Fig. 4D).
We use the R package “glmnet” to implement LASSO logistic regression, with the family parameter set to “binomial”. Continuously increase the penalty (Lambda), so that the coefficients of each variable (gene) in the model are adjusted to tend to 0, and the coefficient visualization is shown in Fig. 5A and B. Cross-validation is a pretty choice for optimizing the model to ensure that the mean square error of the model meets the requirements (Fig. 5C). The area under the ROC curve corresponding to each model is stored in the AUC and output (Fig. 5D), where the AUC values are all greater than 0.9.
Establishment of DNN prediction model. (A) 17 final genes were selected by Random Forest and LASSO. (B) The confusion matrix shows the comparison between the results predicted by the DNN model and the original classification results of K-Means. (C) The accuracy of DNN model training data. (D) The accuracy of DNN model validation data. (E) The cross-entropy of DNN model training data. (F) The cross-entropy of DNN model validation data. (G) The Kaplan-Meier survival analysis shows the effect of the DNN model on the prediction data set classification.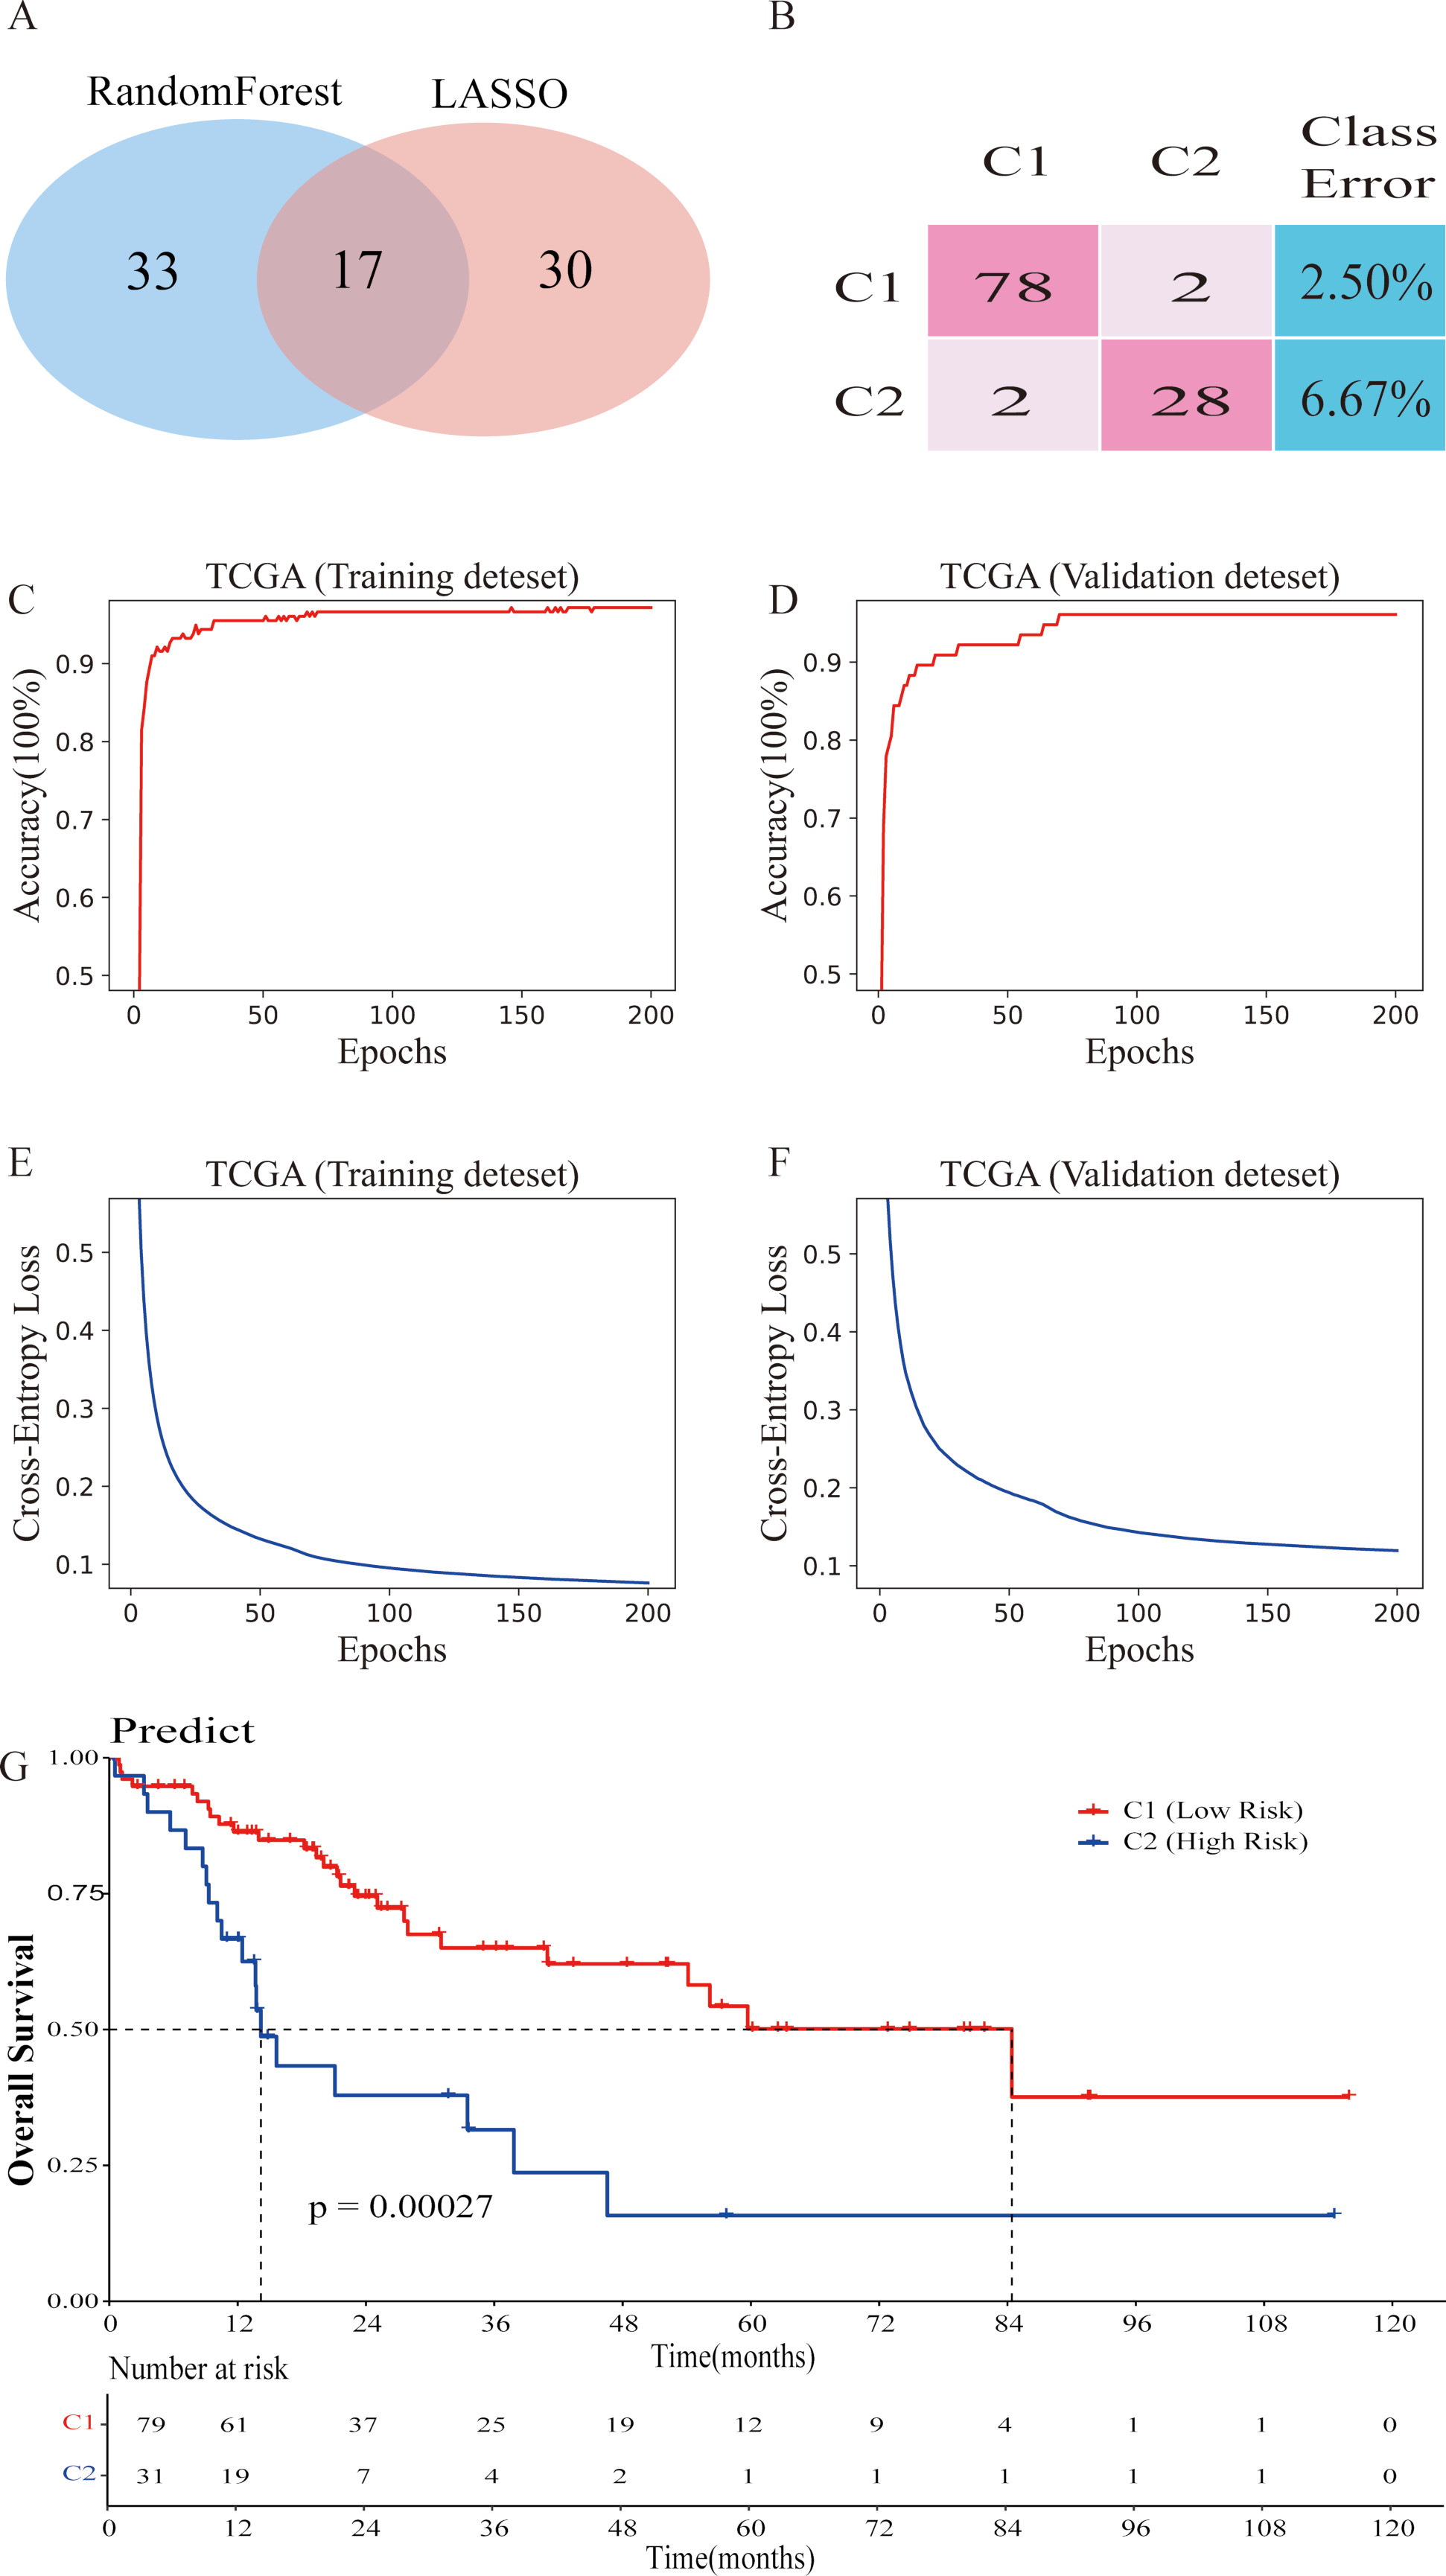
The optimal solution of the LASSO model lies within one standard error of the minimum mean square error, where
KEGG pathway enrichment analysis of the DEGs between the C1 and C2. (A) KEGG annotation of the DEGs. The color of the dot indicates statistical significance. The size of the dot indicates the number of genes included. (B) The main metabolic pathways the DEGs are enriched in. Red bars represent pathways that are significantly enriched for up-regulated DEGs. Blue bars represent pathways that are significantly enriched for down-regulated DEGs.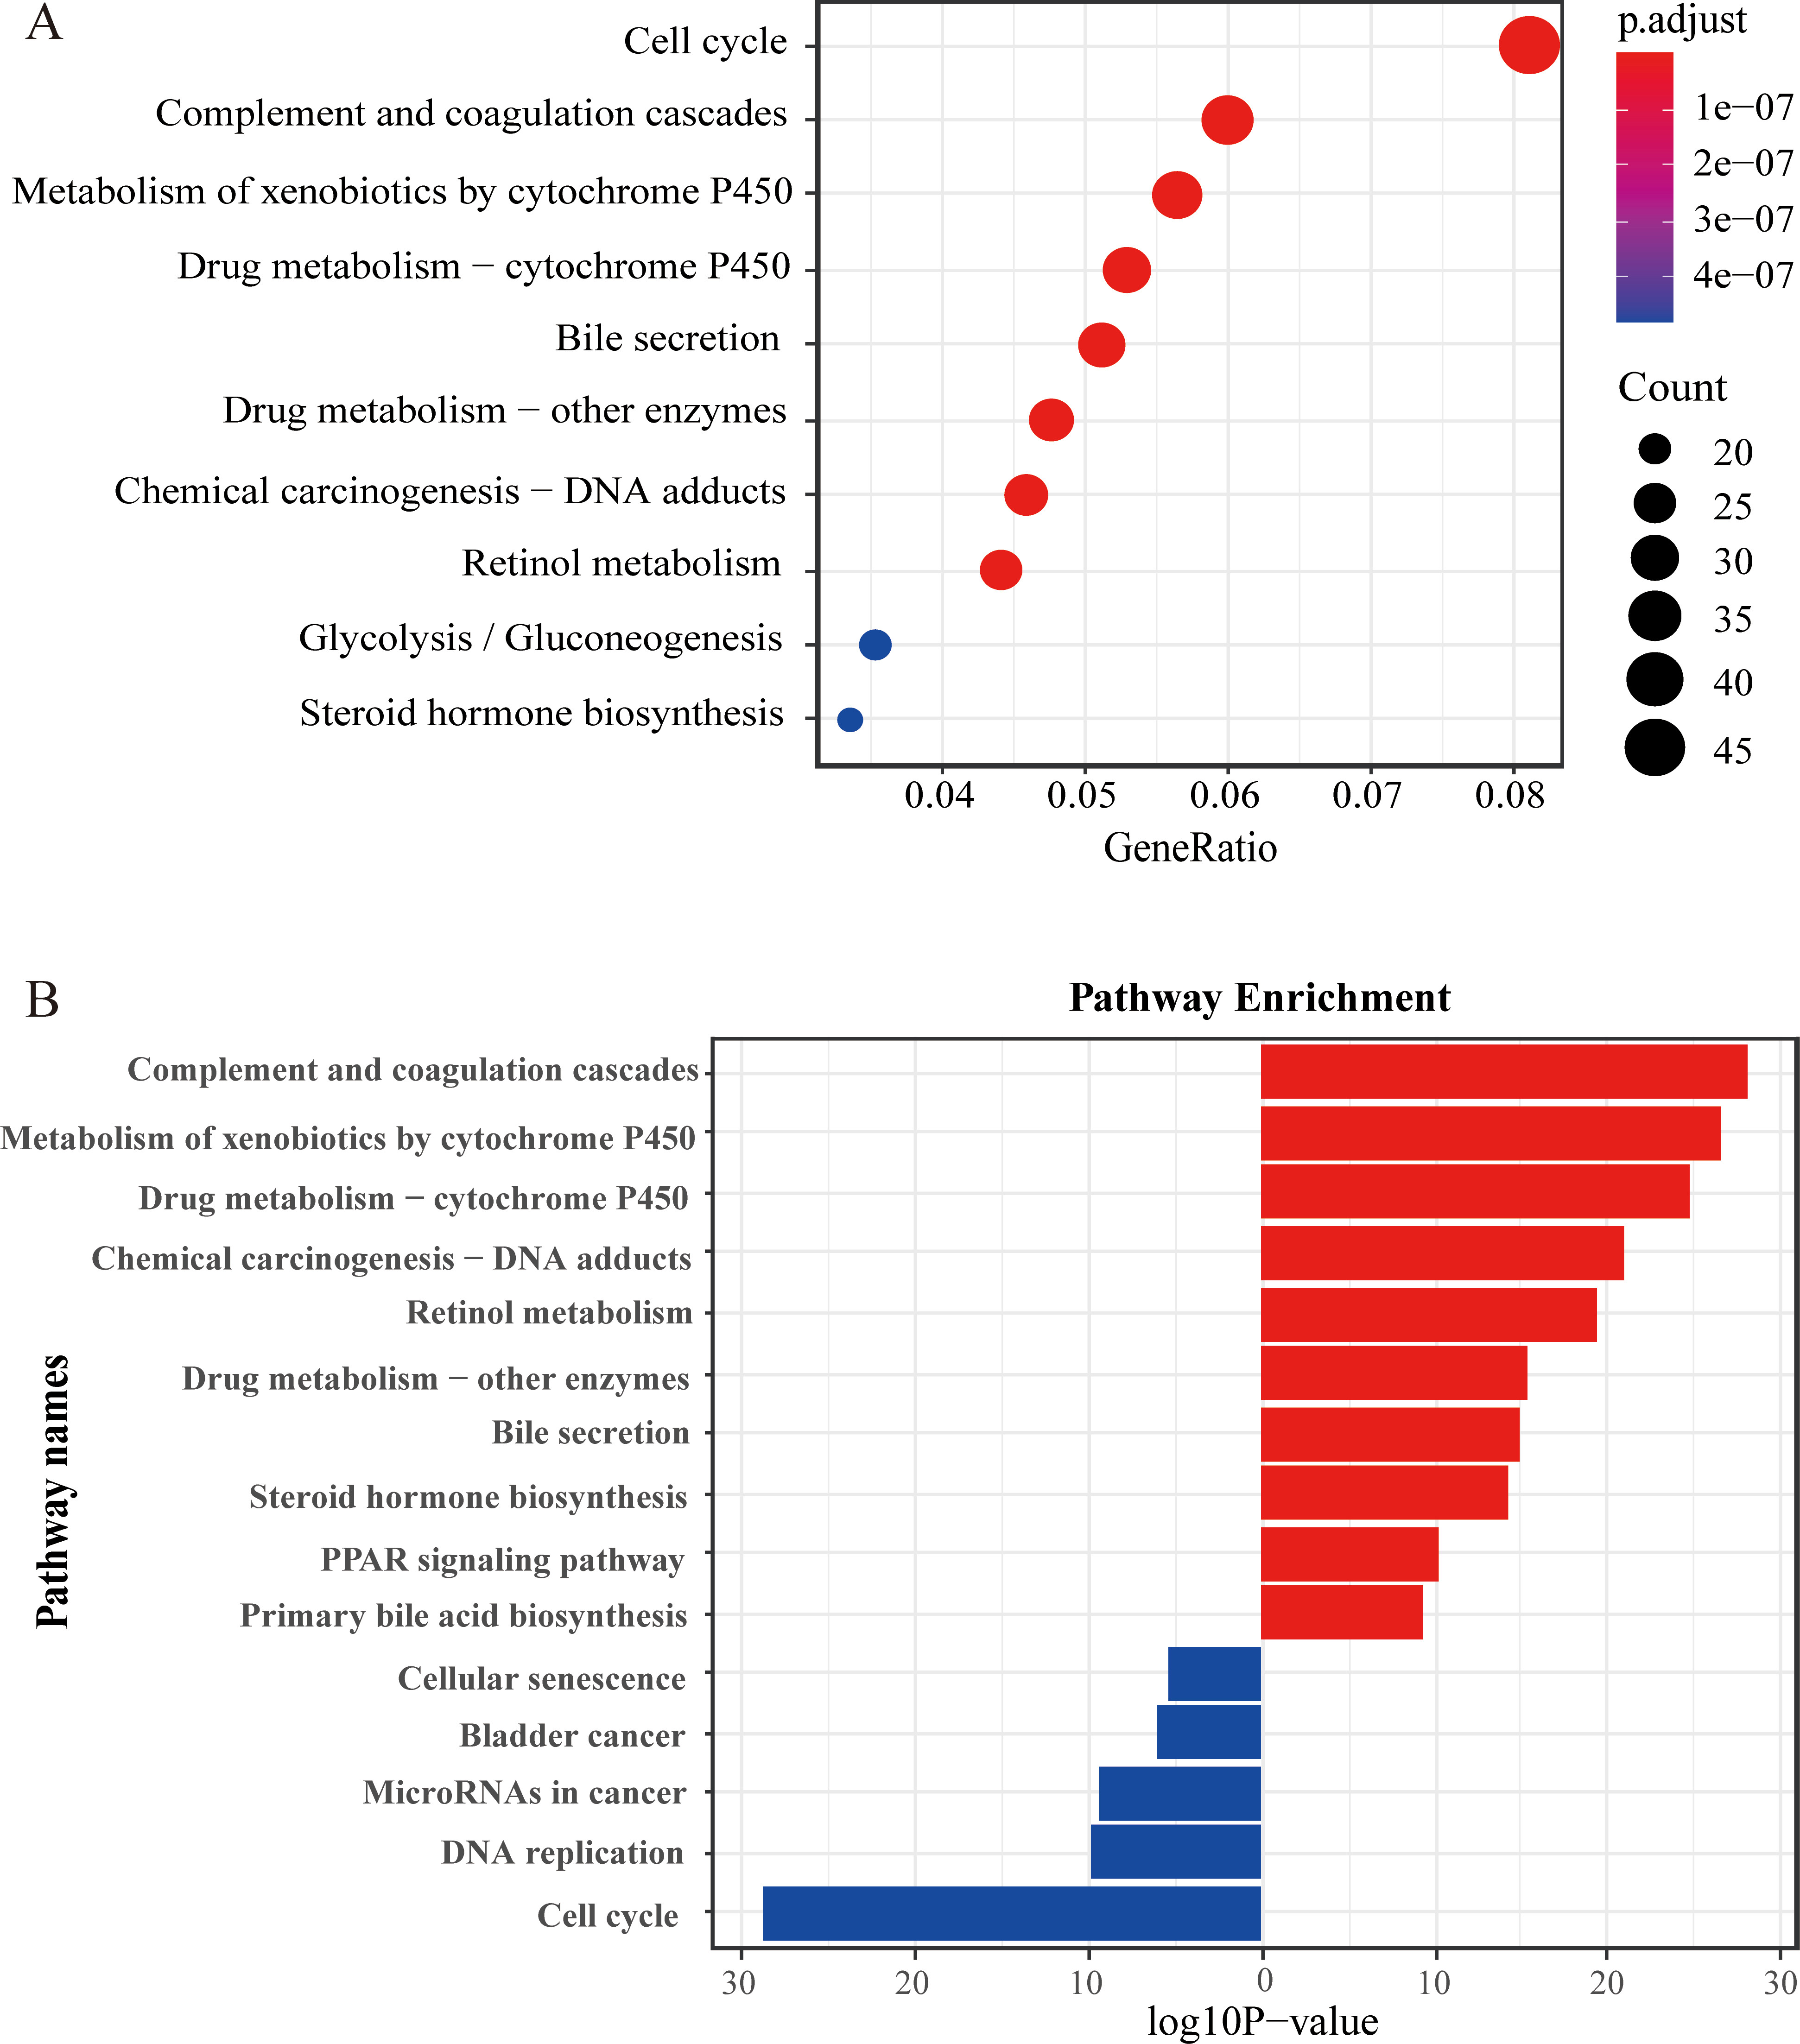
Gene Ontology (GO) functional enrichment analysis of the DEGs. (A) Up-regulated gene enrichment pathway in BP. (B) Down-regulated gene enrichment pathway in BP. (C) Up-regulated gene enrichment pathway in CC. (D) Down-regulated gene enrichment pathway in CC. (E) Up-regulated gene enrichment pathway in MF. (F) Down-regulated gene enrichment pathway in MF.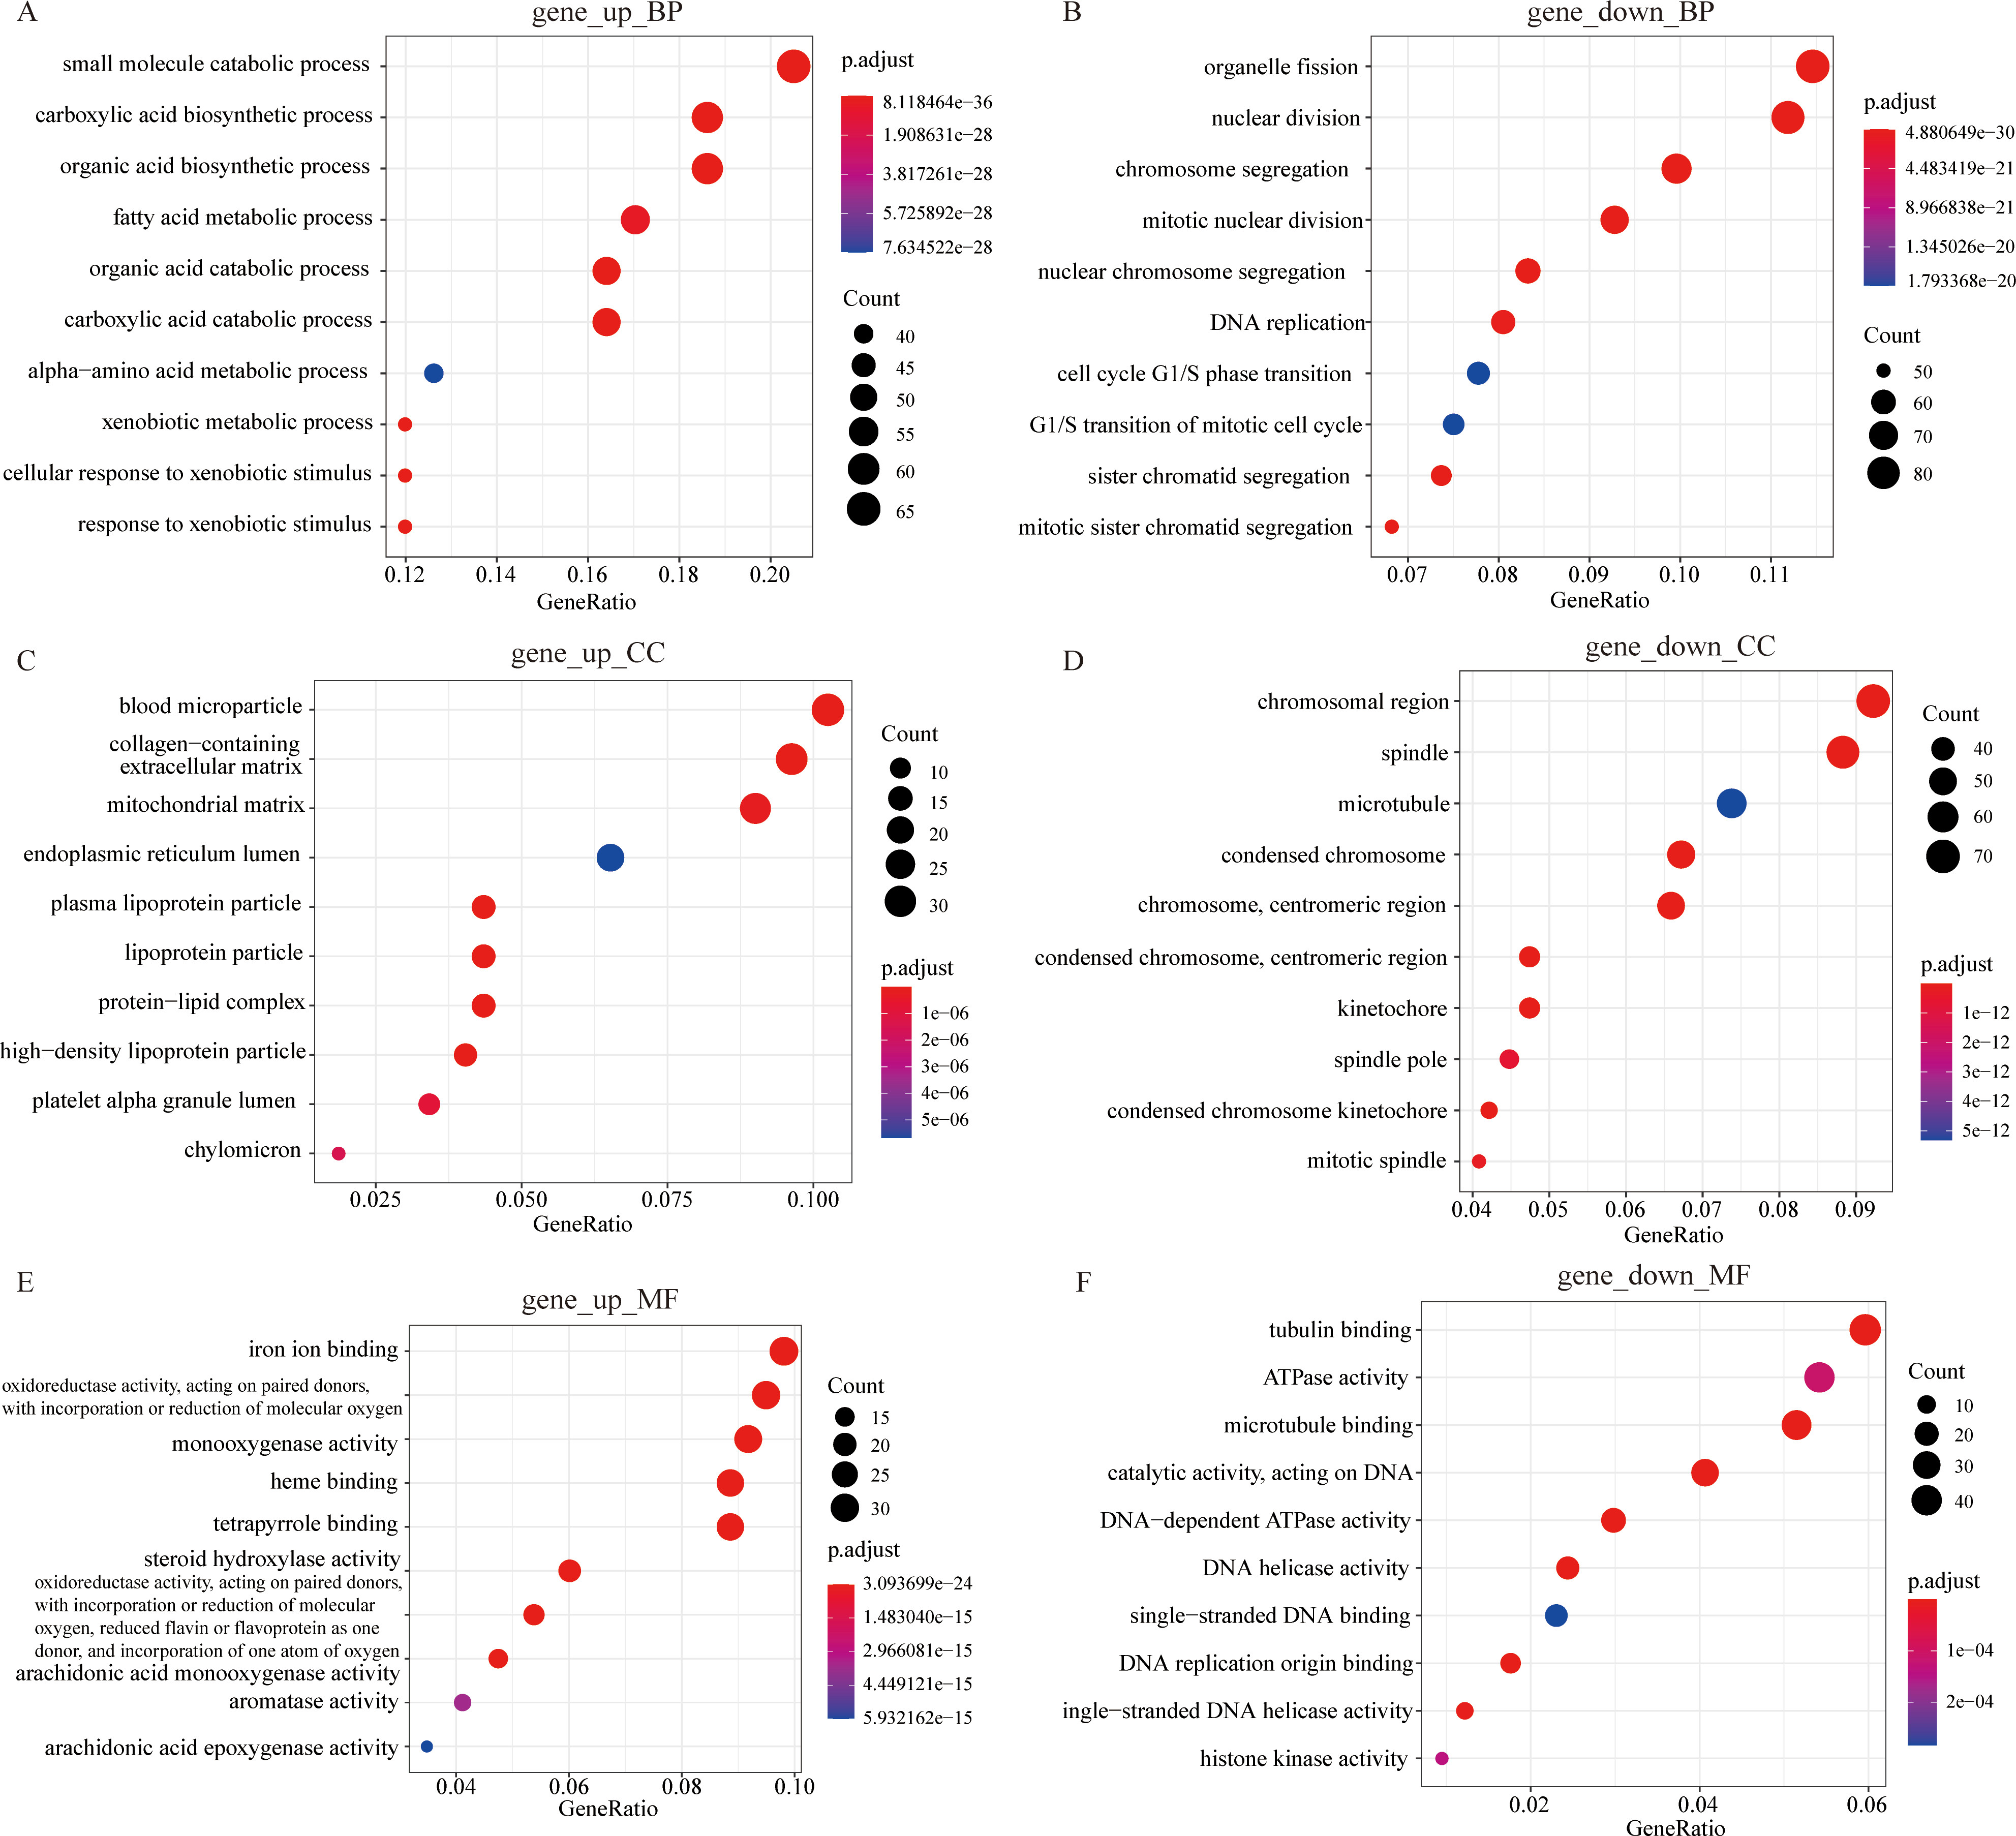
To explain the huge difference in survival between the two subtypes, we discarded the previous differential expression analysis based on the normal and tumor groups. Instead, we selected C1 (low risk) and C2 (high risk) as the new difference grouping. As a result, we obtained 1144 differential genes between the two novel subtypes. Then we used the R package “enrichGO” and “enrichKEGG” to perform a hypergeometric distribution test analysis on differential genes. The annotation results of the KEGG databases are shown in Fig. 7. The main enrichment pathway for differential genes is “Cell cycle” and “Complement and coagulation cascades” (Fig. 7A). Figure 7B shows the main metabolic pathways enriched for up-regulated and down-regulated differentially expressed genes between the two subtypes, respectively. The bubble graphs display the results of GO database annotations (Fig. 8). The up-regulated differentially expressed genes are mainly involved in the “small molecule catabolic process (BP)”, “blood microparticle (CC)”, and “iron ion binding (MF)” and other activities (Fig. 8A, C and E). The down-regulated differentially expressed genes are mainly involved in activities such as “organelle fission (BP)”, “chromosomal region (CC)” and “tubulin binding” (Fig. 8B, D and F). The bubble size indicates the size of the gene set, and the more reddish the color, the smaller the
In the GSEA, we choose the MSigDB database as the background gene set. The result of GSEA indicated that the up-regulated genes were significantly enriched in hallmark gene sets in the MSigDB database (Fig. 9A). We can see that the first four pathways with significant gene enrichment are “HALLMARK_BILE_ACID_METABOLISM” and “HALLMARK_COAGULATION”, “HALLMARK_FATTY_ACID_ METABOLISM” and “HALLMARK_PEROXISOME”. Figure 9B shows that down-regulated genes are significantly enriched in the MSigDB database regulatory target gene sets. The first four pathways with significant gene enrichment are “TCANNTGAY_SREBP1_01”, “ZNF140_TARGET_GENES”, “ZNF329_TARGET_GENES” and “ZNF563_TARGET_GENES”.
GSEA results in MSigDB and GSEA results in KEGG. (A) GSEA results in MSigDB hallmark gene sets. (B) Several significant enrichment pathways in KEGG.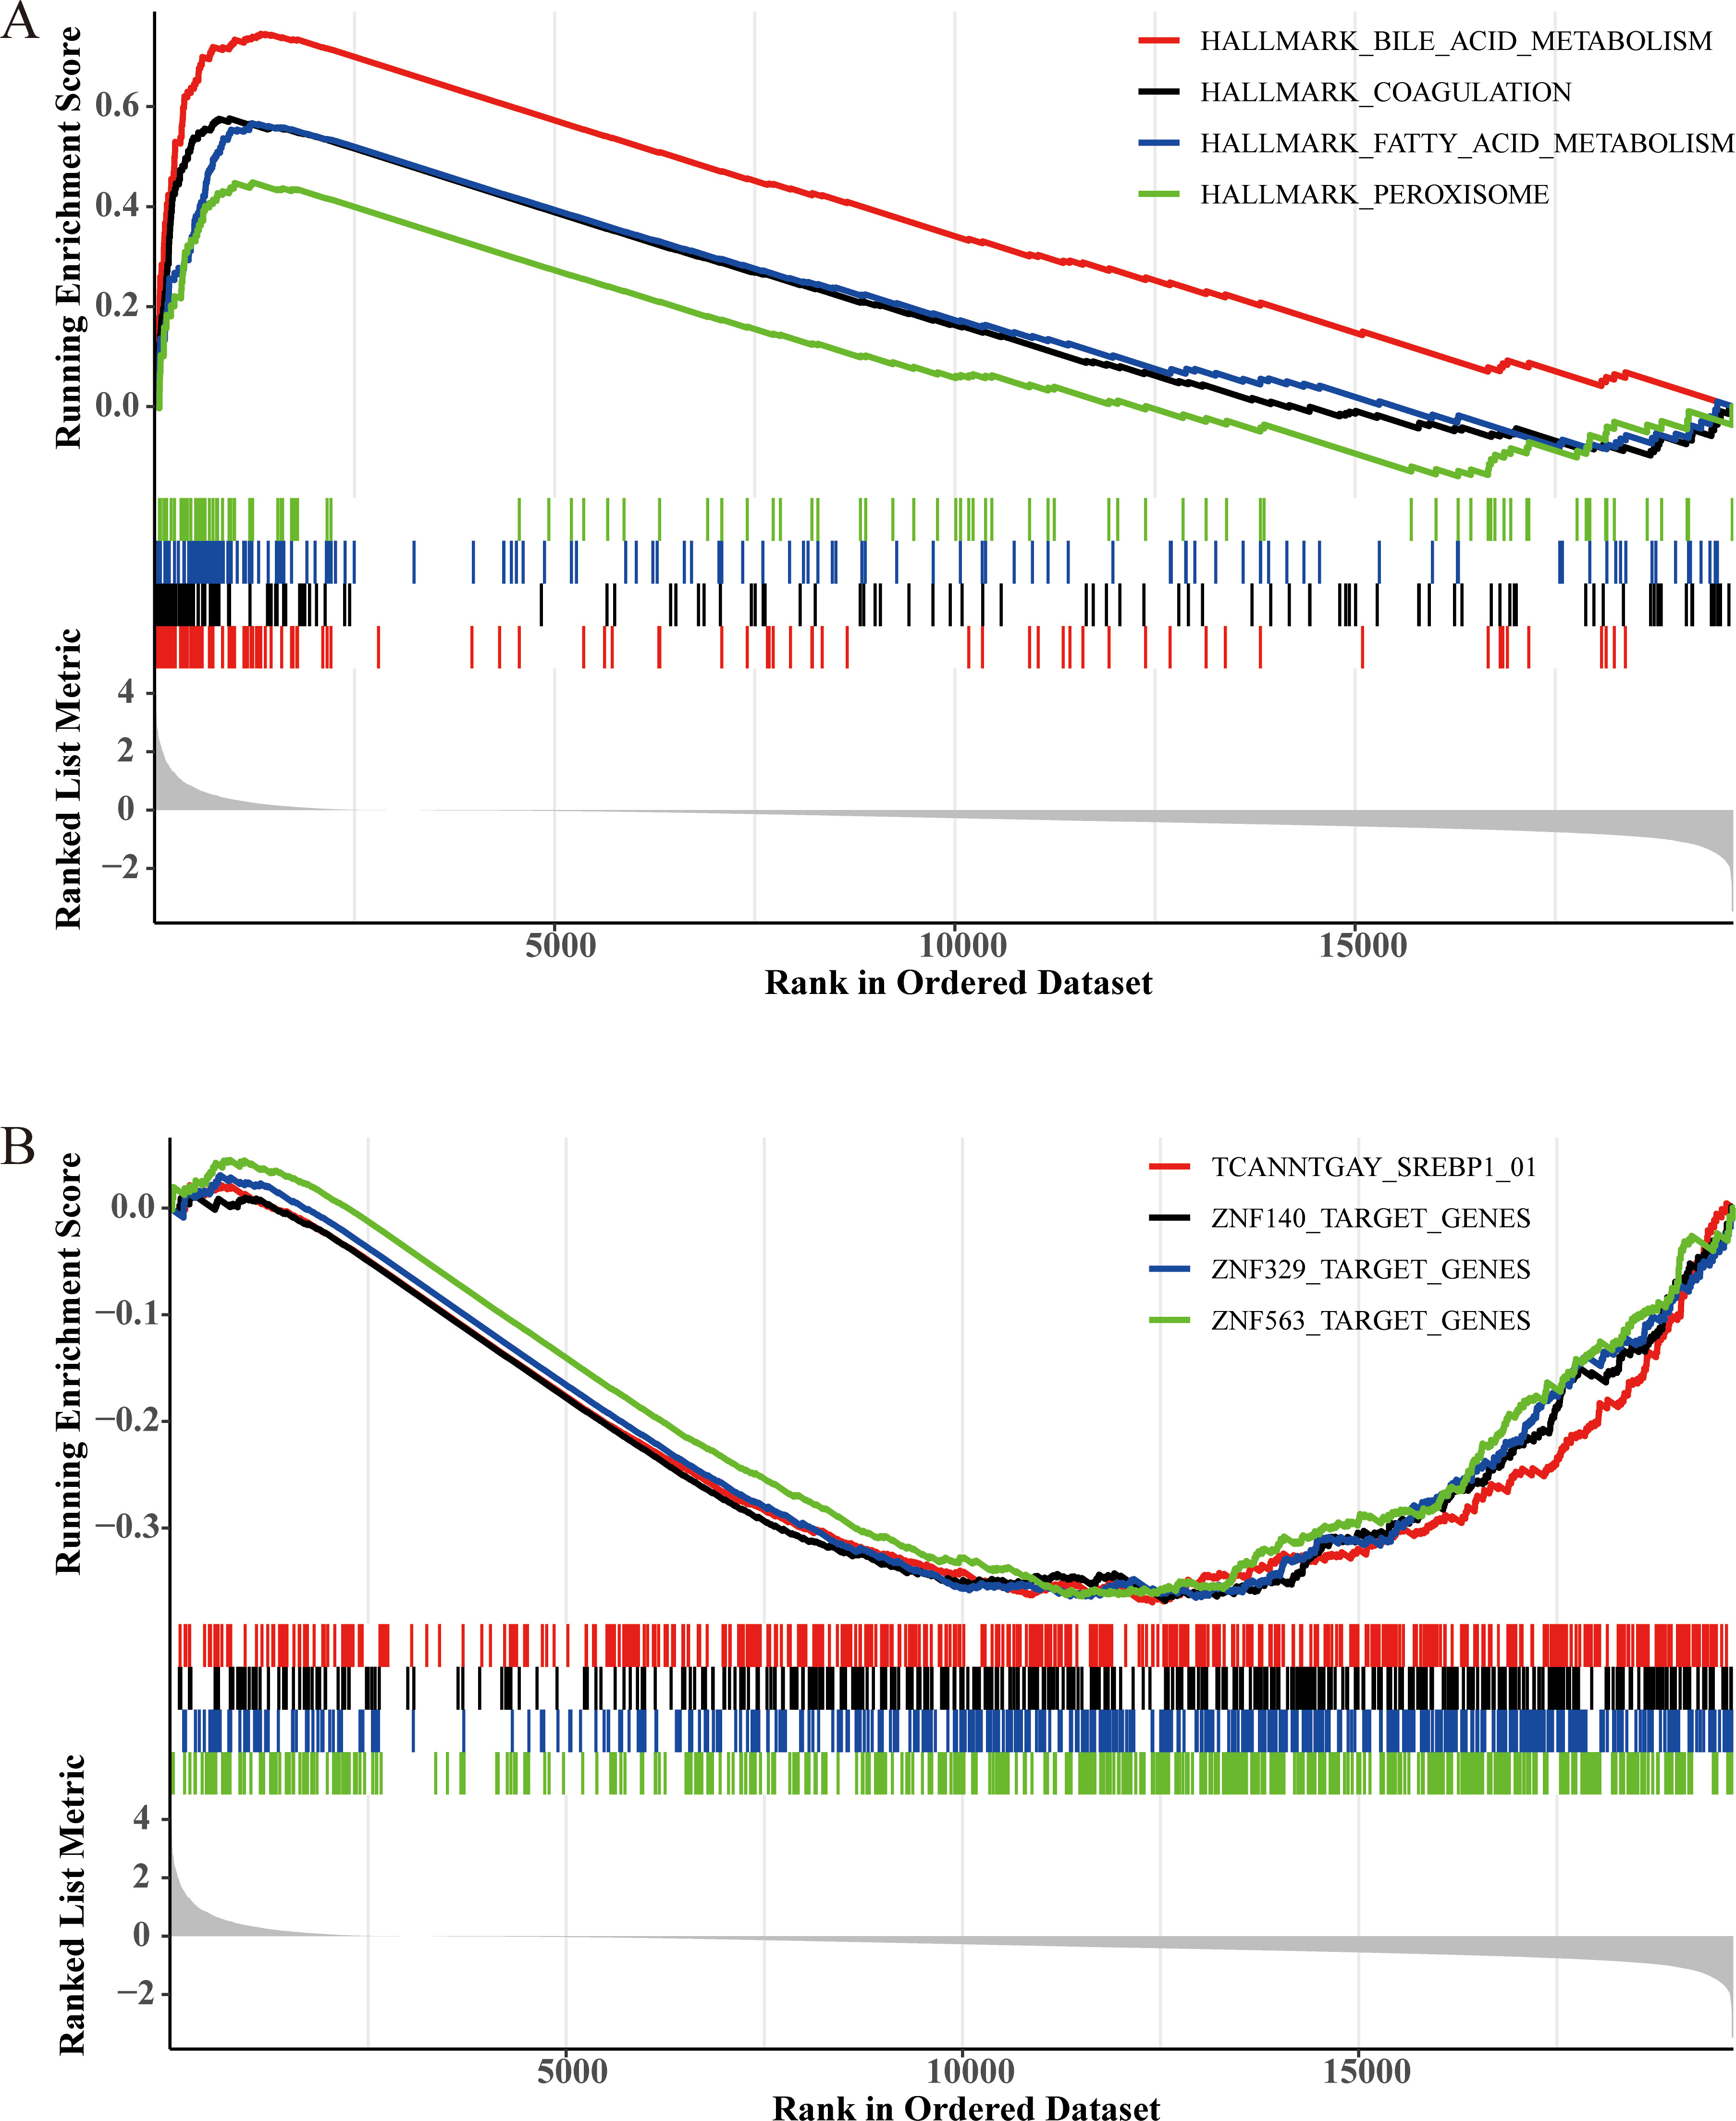
HCC is still a significant challenge facing global public health, and many studies are devoted to clarifying the pathogenesis and epidemiology of HCC. Although surgery and drug treatment have made significant progress, the prognosis of HCC is still poor. Considering the huge heterogeneity of HCC, there is an urgent need to establish more accurate prognostic prediction models. Since its establishment, the TCGA database has provided great help for cancer researchers to improve the prevention, diagnosis, and treatment of cancer. The type of TCGA data we downloaded is RNA sequencing. We also selected a data set (GSE112790) in the GEO database to screen for the same differential genes. This step makes our subsequent research more generally applicable.
In this paper, the first step is to identify differentially expressed genes from the two projects TCGA-LIHC and GSE112790. The close and subtle relationship between genes and patient survival is our main concern, so we use univariate COX and multivariate COX regression analyses to further identify the survival-related genes. The unsupervised clustering algorithm K-means has the advantages of strong interpretability and fast convergence. We put survival-related genes into K-Means to cluster two types of hepatocellular carcinoma patients. One subtype of the patient has a significantly better survival rate than another subtype. We realized that this result from the machine learning algorithm is not accidental. We respectively used random forest and LASSO regression algorithms to help identify the key genes that affect the prognosis of patients with hepatocellular carcinoma. Finally, we trained the DNN through a part of the sample and used the other part of the data unfamiliar to the DNN to predict the subtype of patients. We used the Kaplan-Meier method to evaluate the effect.
We have obtained an HCC prognosis prediction model with 17 genes as the main body, which predicts the survival rate of HCC patients, and the effect is pretty good. The 17 genes are ALDH2, GYS2, SLC10A1, SLC27A5, SLC22A1, PKM, NCAPD2, HJURP, CKS2, MELK, CEP55, KIF18B, SAE1, CDCA3, AURKB, NUP62, MTFR2. Five genes, including ALDH2, GYS2, SLC10A1, SLC27A5, and SLC22A1 were down-regulated in a subtype with a poor prognosis. ALDH2 can be a potential therapeutic target for cancer treatment, and related studies have also identified it as a possible prognostic marker for several cancers [22]. In this study, the expression of ALDH2 in a subtype of patients with poor prognosis was down-regulated, which coincides with the study of Zahid et al. [23], and they found that transcriptional inhibition of ALDH2 expression can reduce the survival rate of HCC patients. Some scientists have found that the high expression of ALDH2 in the body inhibits the expression of DNA repair protein (XRCC1), resulting in a low survival rate for HCC patients [24].
Furthermore, according to a recent report, ALDH2 promotes the transfer of extracellular vesicles enriched with oxidized mtDNA from weakened liver cells into HCC cells, which will accelerate the progression of HCC [25]. This is enough to show that ALDH2 could be a suitable biological marker and target for evaluating prognosis and improving the therapy options for HCC. According to a study, glycogen synthase 2 (GYS2) inhibited tumor growth in hepatitis B virus-related HCC via a negative feedback loop with p53. GYS2 expression was considerably downregulated in HCC, linked to lower glycogen content and poor patient outcomes [26]. GYS2 has also been reported to appear in models that identify the survival period of hepatocellular carcinoma [27]. SLC10A1 (also called NCTP) has also been reported as a potential HCC early diagnosis and prognostic marker. Some studies have shown that in HCC patients, the down-regulation of SLC10A1 is significantly related to recurrence-free survival (RFS), S-Me, and S-Pf [28, 29]. Studies have shown through in vitro experiments that the down-regulation of SLC27A5 promotes the progression of HCC by driving EMT. The expression of SLC27A5 is positively correlated with the prognosis of HCC. SLC27A5 expression is downregulated in tumor tissues compared to non-tumor tissues. This is also consistent with the performance of SLC27A5 in patients with a poor prognosis in our study [30]. Down-regulation of SLC22A1, which codes for the organic cation transporter-1 (OCT1), alters the responsiveness of hepatocellular carcinoma (HCC) to the cationic medication sorafenib [31].
12 genes including PKM, NCAPD2, HJURP, CKS2, MELK, CEP55, KIF18B, SAE1, CDCA3, AURKB, NUP62, MTFR2 were up-regulated in a subtype with poor prognosis. Hypoxia-inducible factor 1
In addition, after the classification of hepatocellular carcinoma patients, we conducted a differential expression analysis between two subtypes and used GO and KEGG databases to annotate the DEGs obtained. Genes up-regulated in patients with subtype C1 (low-risk) are significantly enriched in metabolic pathways such as “Complement and coagulation cascades”, “Metabolism of xenobiotics by cytochrome P450” and “Drug metabolism-cytochrome P450”. Among them, “Cytochromes P450” (henceforth P450s) are engaged in a wide range of metabolic and biochemical processes. Similarly, genes that are down-regulated in patients with subtype C1 (low-risk) are significantly enriched in metabolic pathways such as “Cell cycle”, “DNA replication”, and “MicroRNAs in cancer”. Down-regulation of specific miRNAs can lead to increased oncogene expression, which can have severe implications for cell proliferation, differentiation, apoptosis, and tumor growth and progression.
Through the filter we designed, most of the genes that finally stand out have an essential impact on the development of tumors. Many genes, such as ALDH2 and SAE1, have even been reported as independent prognostic markers for hepatocellular carcinoma. That is to say, we have used excellent machine learning algorithms and clever design logic to obtain a prediction model containing many genes that have been reported to be closely related to the formation and development of hepatocellular carcinoma. Then the model based on this same logic also contains some genes that have not been thoroughly studied in the mechanism of hepatocellular carcinomas, such as AURKB, MTFR2, etc. they all have some reports on hepatocellular carcinoma. Still, the excavation is not deep enough, and MTFR2 has been reported in the clinical value and potential mechanism of lung adenocarcinoma [46].
This study obtained a DNN model containing 17 genes, which brings together many genes that play an essential role in hepatocellular carcinoma. The mechanism of action of some genes has been unearthed, and some are not. To guide clinical treatment, we save these 17 genes in a DNN model to help distinguish low-risk subtypes from high-risk subtypes. Such a collection can also guide researchers to in-depth exploration of genes related to the formation and development of hepatocellular carcinoma.
Conclusions
All in all, we used the machine learning algorithm to screen out 17 survival-related genes of HCC patients and trained a DNN model based on them to predict the survival risk of HCC patients. The genes that make up the model are all key genes that affect the formation and development of cancer. Their expression and weight coefficients are stored in DNN, which facilitates us to predict the survival rate of any HCC patient at the molecular level. Such an efficient and accurate model will significantly help the prognostic treatment of HCC patients.
Author contributions
Conception: Quan Zi, Hanwei Cui.
Interpretation or analysis of data: Quan Zi, Wei Liang.
Preparation of the manuscript: Quan Zi.
Revision for important intellectual content: Quan Zi, Qingjia Chi.
Supervision: Quan Zi, Qingjia Chi.
Declaration of competing interests
The authors have declared that no competing interests exist.
Funding
These studies were supported by grants from the National Natural Science Foundation of China (Grant Number: 81970631, 81801639).
Footnotes
Acknowledgments
We appreciate the generosity of TCGA database and GEO database for sharing the huge amount of data.