
Abstract
Synovial sarcoma is a rare disease with diverse progression characteristics. We developed a novel deep-learning-based prediction algorithm for survival rates of synovial sarcoma patients. The purpose of this study is to evaluate the performance of the proposed prediction model and demonstrate its clinical usage. The study involved 242 patients who were diagnosed with synovial sarcoma in three institutions between March 2001 and February 2013. The patients were randomly divided into a training set (80%) and a testing set (20%). Fivefold cross validation was performed utilizing the training set. The test set was retained for the final testing. A Cox proportional hazard model, simple neural network, and the proposed survival neural network were all trained utilizing the same training set, and fivefold cross validation was performed. The final testing was performed utilizing the isolated test data to determine the best prediction model. The multivariate Cox proportional hazard regression analysis revealed that size, initial metastasis, and margin were independent prognostic factors. In fivefold cross validation, the median value of the receiver-operating characteristic curve (area under the curve) was 0.87 in the survival neural network, which is significantly higher compared to the area under the curve of 0.792 for the simple neural network (p = 0.043). In the final test, survival neural network model showed the better performance (area under the curve: 0.814) compared to the Cox proportional hazard model (area under the curve: 0.629; p = 0.0001). The survival neural network model predicted survival of synovial sarcoma patients more accurately compared to Cox proportional hazard model.
Introduction
Synovial sarcoma is a rare malignancy that accounts for 6% of all soft-tissue sarcomas.1–3 It occurs with diverse clinical presentations based on various tumor sizes, locations, and histological subtypes. 4 Although many studies demonstrated that these clinical factors have significant impact on survival, attempts to determine treatment protocols based on these clinical factors have been unsuccessful. Therefore, the current protocol of adjuvant treatment following surgery is still controversial.
Recent protocols for cancer treatment have been developed according to survival analysis based on clinical data and related outcomes. Many statistical methods for survival analysis have contributed significantly to identifying prognostic factors and to assessing treatment outcomes of cancer patients. The Cox proportional hazard regression (CoxPHR) model is one of the most widely used survival models and has achieved good accuracy on the prediction of patient survival time for many types of cancers. However, prediction models utilizing conventional methods show poor prediction performance for rare cancers, such as synovial sarcoma. Because the total number of cases of these cancers was small, it is difficult to identify significant time-dependent covariates in rare cancers.
To analyze survival data, we must collect clinical data from a long period of observation. During a study period, many patients can be lost for follow-up examinations. These lost cases should be considered in survival analysis, especially in small-case analysis. Machine learning has recently been introduced for the analysis of medical big data. However, there have been no deep learning models that can consider lost cases during analysis.
The main purpose of this study was to implement a superior patient survival model for rare cancers, such as synovial sarcoma, which can consider lost cases during prediction.
We developed a novel deep-learning-based prediction algorithm that can analyze lost cases in a sequential manner and compared the proposed model to a conventional neural network (NN) and the Cox regression model.
Methods
Study population and data collection
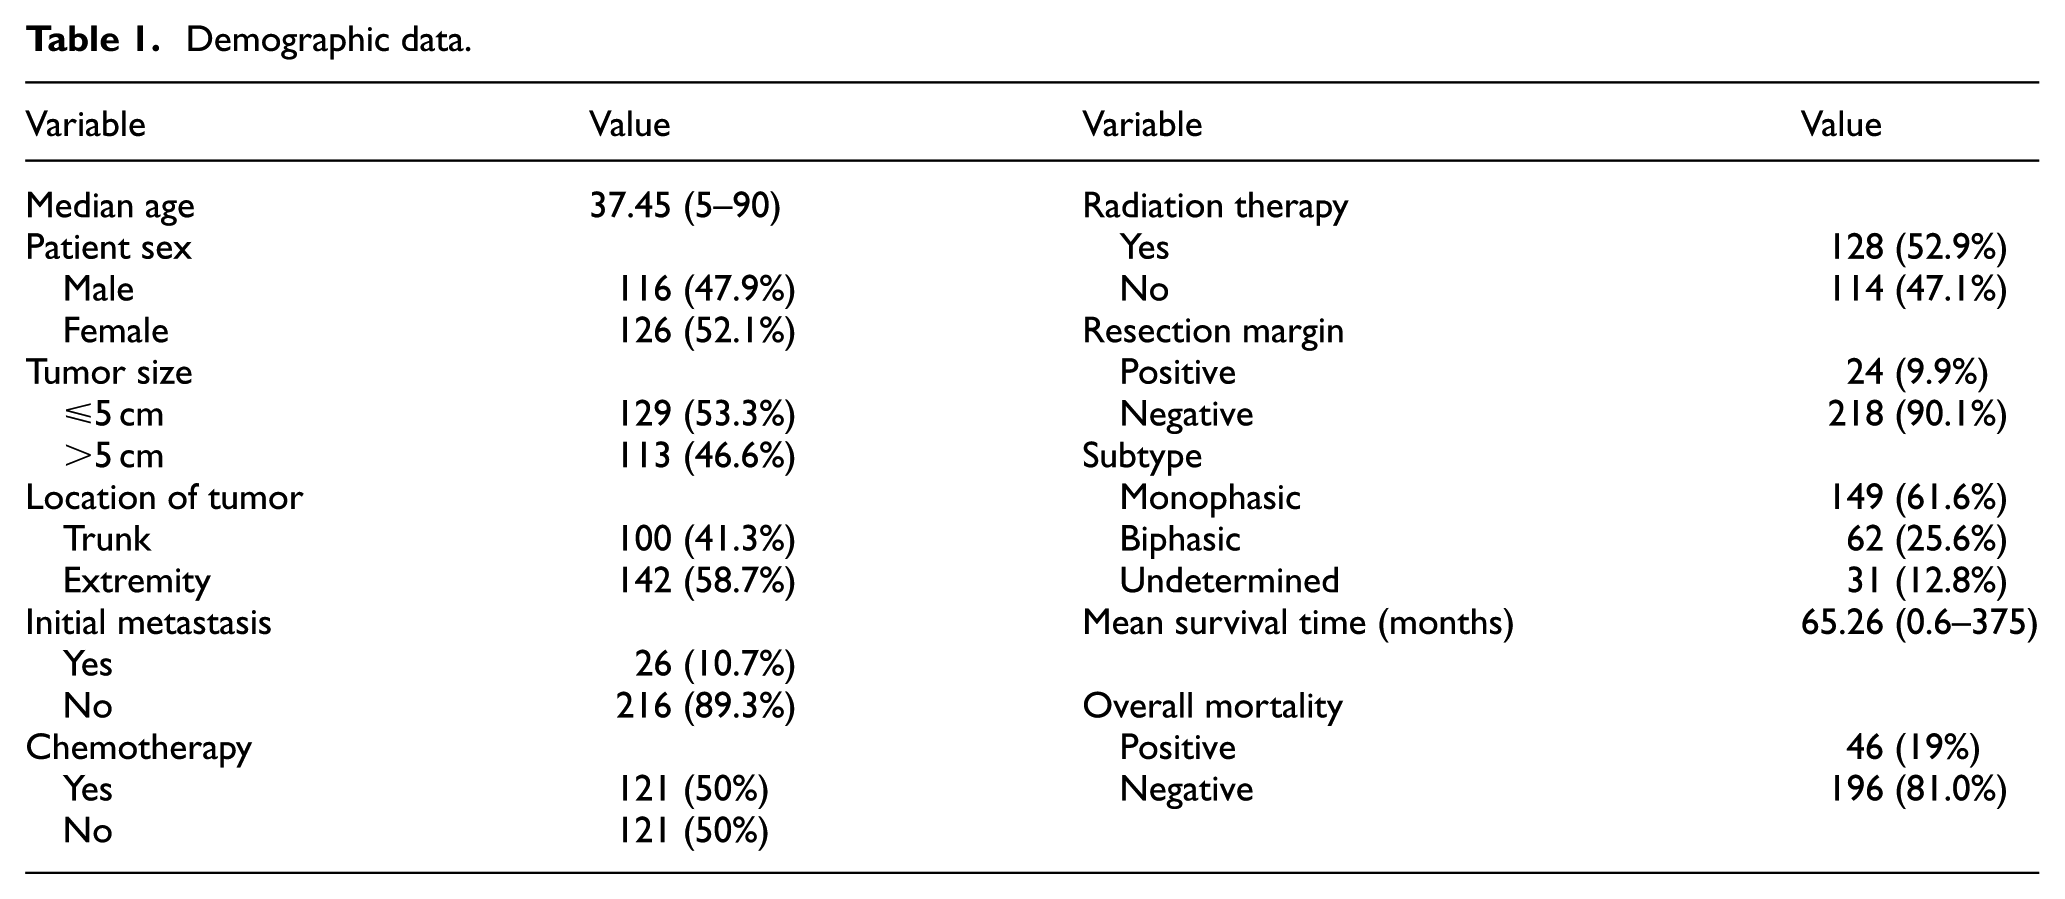
Between March 2001 and February 2013, 260 patients who were diagnosed with synovial sarcoma underwent surgery in three institutions. Among these patients, 18 were excluded because their medical records were insufficient or because the postoperative follow-up period was less than 6 months. Therefore, 242 synovial sarcoma patients were selected for retrospective analysis from three different institutes: 107 from Seoul National University, 83 from Samsung Medical Center, and 2 from the National Cancer Center. The median age was 35 years (ranging from 5 to 90 years; Table 1). There were 126 females and 116 males. Surgical resection was performed on all patients. Tumor size was evaluated following surgery. The tumor size was larger than 5 cm in 113 patients and the remaining 129 patients had tumors smaller than 5 cm. A total of 26 patients had initial metastasis at the time of diagnosis. The resection margin was clear (R0 resection) in 182 patients. In total, 24 patients had positive resection margins in microscopic pathological examinations. Information regarding resection margins was not retrievable for 36 patients. Adjuvant chemotherapy was administered to 121 patients and radiation therapy was administered to 128 patients. The median follow-up duration was 48.5 months (ranging from 6 to 231 months). A total of 46 patients (19%) died from the disease during the follow-up period. Our protocol was approved by the institutional review boards of the involved institutions (Seoul National University Hospital (H-1701-084-823), Samsung Medical Center (No201701136), and the National Cancer Center (No. 201700190001)). All methods were carried out in accordance with the guidelines and regulations of the institutional review boards of the involved institutions. Informed consent was obtained from all patients.
Demographic data.
The deep-learning-based survival model
The sequential learning process of clinicians in an outpatient clinic was simulated by utilizing an NN algorithm and time-sequential outcome data. The network was designed to learn updated data every year. The model was composed of three main learning systems. The first included covariates (S) that represent the initial statuses of patients. The second included the computed survival probability (P) at the time of follow-up, which is sequentially updated. The third part is composed of the nonparametric rank scores (0 < r < 1) of cases that were lost during each time interval. Let

where for
The rank score was imputed to Y instead of the real outcome in lost cases. The subject status (S) and survival probability (P) from the previous year are inputted to the basic unit of the NN for prediction of the following year’s survival probability, which is then utilized recurrently for the subsequent year’s prediction. This loop reinforces the training of the basic NN by sequentially updating the residuals between the real outcome (Y) and predicted probability (Y-hat) at each time point. In addition, the residuals (λ) from the previous year are added with a parameter

Schematic equation for the SNN. In addition to the neural network backbone (h(X)), the likelihood of survival from the previous year (Pn-1) is inputted as a feature for the following year. α is a constant representing the weight of the previous survival probability. The residuals (λ) of previous year are added to Y of the following year. β is a constant representing the weight of the residuals. W represents the connection weights, b is the neuron bias, g is the activation function, and p is the previous survival probability. Y is the label value (alive coded as 1 and death coded as 0). Lost cases are scored by an embedded ranking algorithm. Y-hat is the predicted value from the SNN.
The architecture of the NN was composed of an input layer, output layer, and three hidden layers. The input layer contained 10 nodes, where nine represented input features and one represented survival probability. The output layer contained two nodes implementing a softmax function, which represents the probability of patient survival. The hidden layers were composed of fully connected nodes implementing a linear function. The number of nodes was gradually reduced across the hidden layers (Figure 2).

The network architecture of the basic unit consists of an input layer, output layer, and three hidden layers. The input layer contains 10 nodes that represent nine input features and a previous survival probability (p). The output layer contains two nodes for implementing a softmax function, which represents the survival/death probability. All the nodes between layers are fully connected. The number of nodes gradually decreases across the hidden layers. The SNN was trained iteratively for every year utilizing the nine clinical features and previous survival probability prediction. The previous residual (λ = the real value of survival probability minus the predicted probability) was added to the real survival probability of the following year. Through this iterative training method, the difference between survival and death became more distinct and accuracy improved.
To compare the performance of the survival neural network (SNN) to a simple NN (simple NN), a simple NN with the same architecture as the SNN was developed. In the simple NN, lost cases were not included for analysis, meaning only binary (life or death) outcomes were utilized for both training and validation. The simple NN cannot be updated iteratively based on previous survival probabilities.
Feature selection and data separation
To find representative covariates among the clinical information, we utilized Kaplan–Meier survival analysis and the log-rank test. The nine covariates with the lowest p values in the log-rank test were selected as independent covariates for training our model. The final outcome measure was total survival time.
Patients were randomly divided into a training set (80%) and testing set (20%; Figure 3). Missing values among the covariates were filled in by utilizing the k-nearest neighbor algorithm after separating the training and testing sets. Fivefold cross validation was performed by utilizing the training data to optimize the NNs. The validation error reached a minimum at epoch 5. The optimized model was tested utilizing the retained testing data.

Enrolled study population and pipeline of data analysis.
Performance evaluation and statistics
The Cox proportional hazard model was trained utilizing the training dataset. We evaluated the accuracy of the Cox model for predicting survival 5 years after surgery utilizing the testing dataset. The receiver-operating characteristic (ROC) curves and area under the curve (AUC) were compared utilizing nonparametric rank tests (Wilcoxon rank test) in the MedCalc program (version 12.7, MedCalc Software, Ostend, Belgium). 5 All NNs were constructed utilizing the Keras and Theano library in Python. The Scikit-learn library was utilizing for additional data management and preprocessing.
Results
Selection of important covariates for survival prediction model
Kaplan–Meier log-rank tests were performed utilizing clinical variables. For patients older than 38 years (median value of the study population), poor prognosis was strongly associated with males (p = 0.021), tumor size larger than 5 cm (p = 0.004), axial location (p = 0.007), initial metastasis (p = 0.001), positive resection margin (p = 0.004), and monophasic type (p = 0.0043; Figure 4). We compared the survival curves of three institutes utilizing Kaplan–Meier analysis. There were no significant differences (p = 0.087). Age and treatment options (adjuvant chemotherapy and radiation therapy) were included in the deep survival model in order to assess treatment outcomes. The same number of covariates was used for the SNN and simple NN.

Kaplan–Meier survival analysis of important variables. The Kaplan–Meier log-rank test was performed on the training dataset. Poor prognosis was strongly associated with (a) patients older than 38 years (median value of the study population). Poor prognosis was also strongly associated with (b) males (p = 0.021), (c) tumors larger than 5 cm (p = 0.004), (d) axial location (p = 0.007), (e) initial metastasis (p = 0.001), (h) positive resection margin (p = 0.004), and (i) monophasic type (p = 0.0043). Adjuvant chemotherapy (f) and radiation therapy (g) did not have a significant impact on survival.
Cox proportional hazard model
The training dataset was first utilized for multivariate CoxPHR. The multivariate CoxPHR revealed that size, initial metastasis, and margin were independent prognostic factors (Table 2; “size,” hazard ratio (HR) = 2.2913, 95% confidence interval (CI): 1.0356–5.0697, p = 0.04; “initial metastasis,” HR = 3.23, 95% CI: 1.54–6.79, p = 0.002; “margin,” HR = 4.74, 95% CI: 1.8–12.46, p = 0.0016).
Cox proportional hazard ratio.
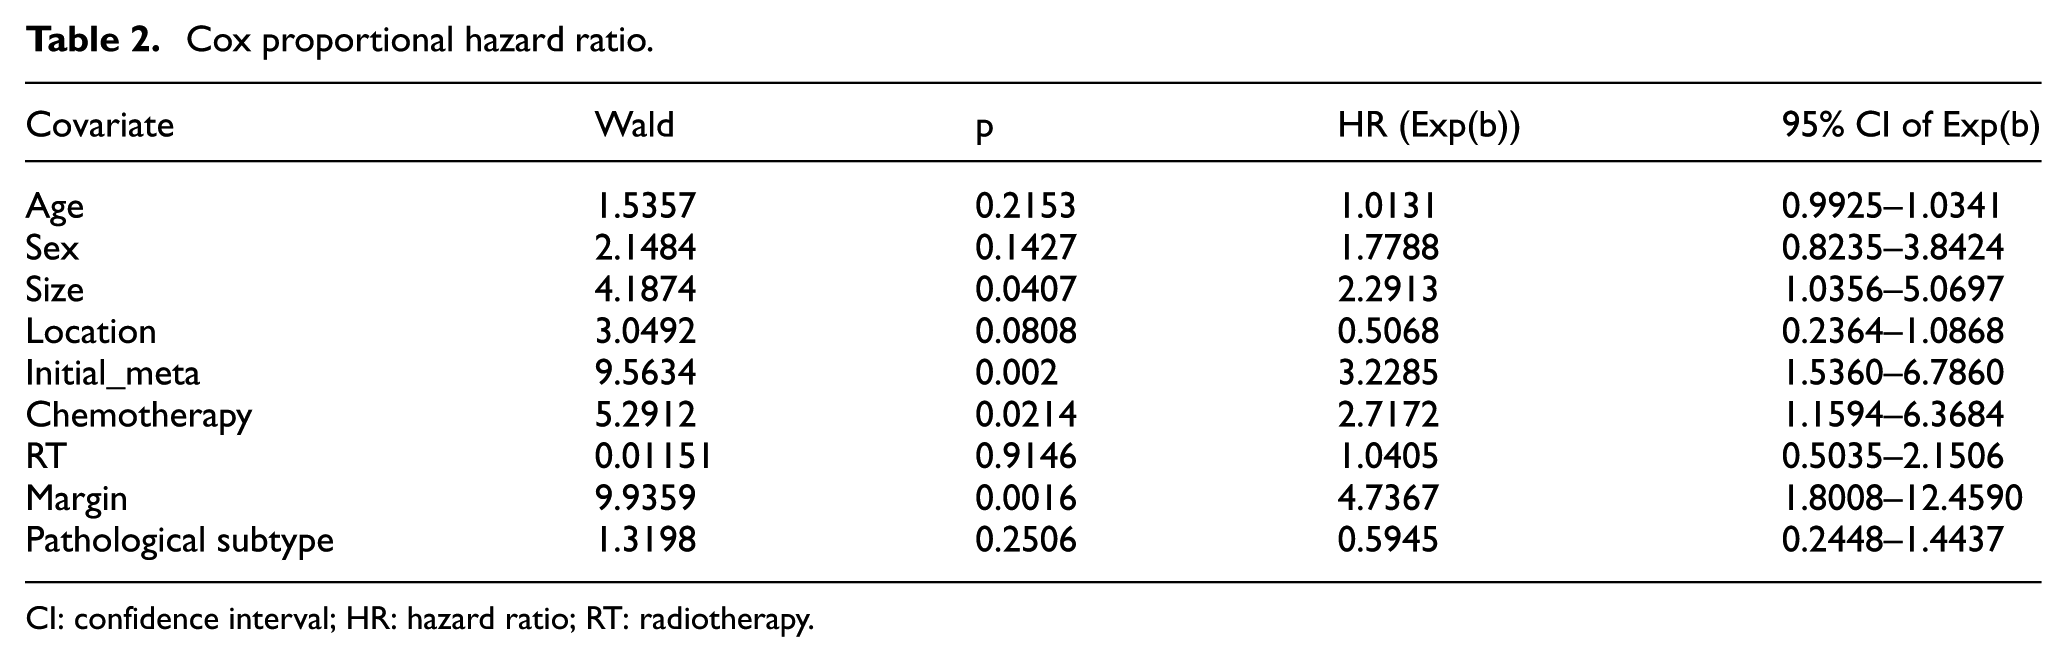
CI: confidence interval; HR: hazard ratio; RT: radiotherapy.
Training and validation of SNN
Next, the SNN was trained utilizing the training dataset. In the validation and testing phases, the model only sees the patients at their first visit. It then sequentially predicts their survival rates over the next five sequential years. Fivefold cross validation was performed to optimize the deep survival network (Figure 5). The performance of the model was evaluated based on the prediction accuracy of survival during the 5 years following surgery. The median AUC value was 0.87 in the SNN optimized with fivefold cross validation. The simple NN was also trained utilizing the training dataset and fivefold cross validation was performed. The AUC value was 0.792 for the simple NN optimized with fivefold cross validation. A Wilcoxon rank test was performed to compare the AUC values of the SNN and simple NN with fivefold cross validation. The AUC value of the SNN was significantly higher than that of the simple NN (p = 0.043).

Validation of SNN and simple NN. Fivefold cross validation was performed for both methods. (a) SNN: the hyperparameters (n_epochs, residual weight (β), probability weight (α), number of hidden layers, and node function) were adjusted to maximize the average AUC value. The optimal hyperparameters were batch_size = 30, n_epoch = 5, residual weight = 0.3, probability weight = 0.01, number of hidden layers = 3, node activation function for the first, the second, and third node = Relu, and that for the output node = softmax. (b) Simple NN: fivefold cross validation was performed and the following hyperparameter settings were obtained: batch_size = 30, N_epoch = 100, number of hidden layers = 3, node activation function for the first, second, and third node = Relu, and that for the output node = softmax. (c) Wilcoxon rank test was performed to compare AUC values of the SNN and simple NN. The SNN achieved significantly better AUC values from fivefold cross validation. (d) Wilcoxon rank test was performed to compare Brier scores of the SNN and simple NN. The SNN achieved a significantly better score (lower = better) from fivefold cross validation.
The Brier scores of SNN and simple NN were also compared. The SNN achieved a significantly lower score with smaller variance in fivefold cross validation.
Final validation of the SNN with isolated test data
The optimized SNN was finally trained utilizing all the training data and tested on the retained testing dataset. The Cox prediction model was also evaluated on the testing dataset. The AUC values of the SNN and the Cox prediction model were compared based on the log-rank test and DeLong et al.’s methods.5 The AUC value of the SNN was 0.814 (95% CI: 0.813–0.823). The AUC of the Cox prediction model was 0.629 (95% CI: 0.471–0.77). The difference between the AUC values of the two models was statistically significant (p = 0.0001). To evaluate the reliability of our optimized SNN model, fivefold cross validation was performed 100 times with the whole dataset. The SNN showed the average AUC of 0.814 (standard deviation (SD): 0.055, 95% CI: 0.813–0.823). The optimized NN showed the average AUC of 0.602 (SD: 0.11, 95% CI: 0.58~0.62). The mean AUC of SNN was significantly higher than the mean AUC of NN in t-test (p = 0.0001; Figure 6).

Validation of optimized neural network with the whole dataset (242 samples). (a) ROC curves of SNN: fivefold cross validation was performed 100 times with randomly separated dataset. The average AUC was 0.814 (SD: 0.0551, 95% CI: 0.813–0.823). (b) ROC curves of NN: fivefold cross validation was performed 100 times with randomly separated dataset. The average AUC was 0.602 (SD: 0.11, 95% CI: 0.58–0.62). (c) Violinplots for performance comparison of SNN and NN. The mean AUC of SNN was significantly higher than the mean AUC of NN in t-test (p = 0.0001).
Discussion
Synovial sarcoma is a rare soft-tissue sarcoma. There are very few studies on synovial sarcoma with adequate sample size. Naing et al. 6 analyzed 1189 cases of synovial sarcoma obtained from an open-source dataset called SEER. However, this dataset does not include certain important factors, such as chemotherapy information and surgical margins. The next three largest studies analyzed fewer than 300 cases. The sample size in our study was 242 cases, which is comparable to that of other large studies. Therefore, our study has sufficient statistical power to detect clinically meaningful differences and support the generalizability of our prediction model.
However, it is very difficult to create a robust prediction model for a rare cancer. Our model utilized lost cases for training, which enabled us to create a more robust prediction model with a smaller number of cases.
Our study population was also comparable to those in previous studies. Palmerini et al. 7 reported a 5-year survival rate of 76% for 250 patients. Naing et al. 6 reported a 5-year survival rate of 69.1% with a median follow-up period of 49 months. The 5-year survival rate for our study population was 81% with a median follow-up period of 65 months. Therefore, our study population was well balanced for training our prediction model.
Initial metastasis, large tumor size (greater than 5 cm), and positive resection margin 8 were the major risk factors that were consistently observed as significant factors in most previous studies.9–11 Our study also revealed that these three factors are significant risk factors based on CoxPHR. The significance of pathological subtype (monophasic vs biphasic) is still open for debate.12,13 Some studies have reported that the SYT–SSX fusion type is an independent significant factor for survival.14,15 This information was not available for our present study. Location (extremity vs axial) was also reported as a significant risk factor in certain studies. Our study revealed that axial location and monophasic type are strongly related to poor prognosis in the Kaplan–Meier log-rank test. However, these factors were insignificant in multivariate Cox regression.
Although previous studies have found several important risk factors for survival in synovial sarcoma patients, to the best of our knowledge, a survival prediction model based on these risk factors has not been formalized. The Cox proportional hazard model is one of the most popular methods for predicting covariate-adjusted survival. However, it assumes that the hazard function is constant throughout a patient’s lifespan, meaning it cannot represent the changing weights of covariates over time.
This article compared the AUC values of the proposed SNN and simple NN. We proved that the performance of the SNN is superior to that of the simple NN.
The proposed SNN simulates a physician’s learning process. We assume that physicians learn about patient statuses and outcomes every year at outpatient clinics. At the first visit, our network predicts what a patient’s condition will be at the next visit based on their current medical status and learns outcomes through subsequent visits. In this context, the more often the SNN sees survivors, the more familiar it becomes with them. Therefore, the network should be optimized for longer survivors.
In contrast, the simple NN cannot represent the changing weights of covariates during these time intervals because it differentiates only a cross section of the data at a given time. In addition, it cannot analyze lost patient data in a nonparametric manner. We note the following limitations in our study: the small sample size may have reduced the predictive power of our model. The number of covariates was also limited in this study. A multitude of other covariates, such as genetic data, may have improved the prediction performance of our SNN model.
In summary, we determined that the proposed SNN prediction model can predict the survival of patients with synovial sarcoma more accurately than the simple NN model. The proposed model can also be useful for simulating therapeutic options to find superior treatment options. Therefore, the SNN is a practical method for guiding individualized treatments. A prospective clinical trial will be required to confirm that SNN-guided treatment will improve patient survival rates.
Footnotes
Acknowledgements
Ilkyu Han and June Hyuk Kim contributed equally to this manuscript.
Declaration of conflicting interests
The author(s) declared no potential conflicts of interest with respect to the research, authorship, and/or publication of this article.
Funding
The author(s) disclosed receipt of the following financial support for the research, authorship, and/or publication of this article: This study was supported by Samsung Medical Center (grant nos SMX1170501 and OTC1180131).