Sorafenib and lenvatinib are tyrosine kinase inhibitors widely used in the targeted therapy to treat advanced hepatocellular carcinoma (aHCC). The GALNT14-rs9679162 genotype is a predictor of therapeutic outcome in multiple gastrointestinal cancers.
OBJECTIVE:
To investigate the predictive role of the GALNT14-rs9679162 genotype in aHCC treated with sorafenib or lenvatinib.
METHODS:
Totally 350 real-world patients with aHCC received sorafenib or lenvatinib were enrolled for GALNT14-rs9679162 genotyping and outcome analysis. Kaplan-Meier and Cox regression analysis were conducted to evaluate therapeutic outcomes. Cell-based assays were performed to determine the underlying mechanism.
RESULTS:
Kaplan-Meier and Cox regression analysis showed that the “GG” genotype was not associated with overall survival (OS) when all patients were included. However, it was associated with shorter OS in specific clinical subgroups, including anti-hepatitis C virus antibody-positive ( 108; 0.005) and hepatitis B surface antigen-negative ( 117; 0.002) patients. Intriguingly, hepatitis B virus X protein trans-suppressed the GALNT14 promoter, thereby reducing the elevated expression of GALNT14 in hepatoma cells, which partially contributed to the inability of the GALNT14-rs9679162 genotypes to predict the outcome of hepatitis B-related HCC. Finally, by analyzing the outcomes of 52 patients with aHCC treated with lenvatinib, patients with the “GG” genotype were associated with a favorable/shorter time-to-response ( 0.013).
CONCLUSIONS:
The GALNT14-rs9679162 “GG” genotype predicted shorter OS in patients with HBsAg-negative aHCC treated with sorafenib, but predicted a favorable response in all patients with aHCC treated with lenvatinib.
Hepatocellular carcinoma (HCC) accounts for 80% of the histological subtypes of primary liver cancer and ranks the fourth most common cause of cancer-related death worldwide [1, 2]. The incidence of HCC is multifactorial and the three main risk factors of concern worldwide are chronic hepatitis B virus (HBV) infection, chronic hepatitis C virus (HCV) infection and alcohol consumption [3, 4, 5, 6]. If patients are diagnosed at an early stage, complete remission can be achieved with curative treatments such as surgical resection, radiofrequency ablation, and liver transplantation [7, 8]. In contrast, for patients diagnosed as inoperable, such as locally advanced HCC or distant metastases, recommended treatments include transcatheter arterial chemoembolization (TACE) for patients with HCC at Barcelona Clinic Liver Cancer (BCLC) Stage B, as well as radiotherapy, chemotherapy, targeted therapy, and immunotherapy for stage C patients [9, 10, 11]. Among these therapies in current treatment guidelines, sorafenib and lenvatinib, which are tyrosine kinase inhibitors (TKIs), are the most widely used targeted drugs. Sorafenib has previously been shown to prolong overall survival (OS) in patients with advanced HCC in two large Phase III randomized controlled studies [12, 13]. On the other hand, lenvatinib has advantages in delaying disease progression and has been shown to be non-inferior to sorafenib in terms of prolonging OS [14, 15]. Although patients with advanced HCC have benefited greatly from sorafenib or lenvatinib in recent years, the therapeutic outcomes vary from patient to patient and the long-term prognosis remains suboptimal. Therefore, it is pivotal to identify valid predictors of response to treatment with sorafenib and/or lenvatinib, so that clinicians can select patients who are favorable to these treatments, or recommend other alternative anticancer regimens for those who are not.
Previously, we identified a single nucleotide polymorphism (SNP) marker rs9679162 in the Polypeptide N-Acetylgalactosaminyltransferase 14 (GALNT14) gene, which predicted the therapeutic outcome of various anti-HCC treatments [9, 16, 17, 18, 19, 20, 21, 22]. In these studies, patients with the “TT” genotype had a better prognosis than “non-TT” patients on most anti-HCC treatments. Surprisingly, the only exception was that the GALNT14-rs9679162 “GG” genotype was associated with longer OS in patients treated with hepatic arterial infusion chemotherapy (HAIC) [22]. Additionally, interestingly, in a cohort of 81 HCC patients receiving sorafenib as first-line therapy (without prior anti-HCC therapy), when all patients were enrolled, the GALNT14-rs9679162 genotype was not associated with OS. However, subgroup analysis showed that the “GG” genotype was associated with shorter OS in anti-HCV positive patients. These findings suggest that the “GG” genotype is associated with opposite therapeutic outcomes in patients receiving HAIC and sorafenib, respectively. However, since the majority of patients have been treated with other anticancer regimens before switching to targeted therapy in the real-world situation, further investigation of the predictive value of the “GG” genotype in patients receiving sorafenib/lenvatinib in the real-world setting is warranted. Therefore, this study aimed to determine whether the GALNT14-rs9679162 “GG” genotype could still be used as a valid prognostic predictor in real-world patients with BCLC stage C HCC treated with sorafenib or lenvatinib.
Materials and methods
Patients and samples
This retrospective cohort study was conducted under the approval of the Institutional Review Board of Chang Gung Memorial Hospital, Taiwan (approval numbers: 201506308A3 and 201900261B0). From January 2010 to December 2020, a total of 350 patients with advanced HCC at BCLC stage C who received targeted therapy were retrospectively included. Of these, 298 were treated with sorafenib, and the remaining 52 were treated with lenvatinib at the Linkou and Keelung branches of Chang Gung Memorial Hospital. Their blood samples were retrieved for genomic DNA isolation and their clinical parameters were reviewed, including gender, age, HBV surface antigen (HBsAg), anti-HCV antibody, alcoholism, liver cirrhosis status, presence of ascites, Child-Pugh classification, Eastern Cooperative Oncology Group (ECOG) performance status, initial metastasis, main portal vein thrombosis, previous anticancer treatments (TACE, radiotherapy, or chemotherapy), additional anticancer therapies following TKI failure, total dosage of TKIs, largest tumor size (in diameter), date of response, date of tumor progression, and date of last follow-up or HCC related death. Biochemistry and hemogram analysis included alpha-fetoprotein, albumin, bilirubin, aspartate transaminase (AST), alanine transaminase (ALT), creatinine, prothrombin time, and platelet count. In addition, the APRI (aspartate aminotransferase-to-platelet ratio index) [23], ALBI (Albumin-Bilirubin) grade [24], FIB-4 (Fibrosis-4) score [25], and PALBI (Platelet-Albumin-Bilirubin) grade were calculated according to the published formulas.
HCC was diagnosed by dynamic computed tomography or dynamic magnetic resonance imaging, plus angiography, when the size of HCC in a cirrhotic liver exceeded 2 cm and typical HCC characteristics were present. In the absence of such typical features, liver biopsy or aspiration cytology was required for diagnosis. Response to TKIs treatment was assessed using alpha-fetoprotein (AFP) and modified response evaluation criteria in solid tumors (mRECIST), as previously described [26, 27, 28]. A 20% reduction in AFP was also considered to achieve a therapeutic response [27].
GALNT14 genotyping
Genotyping of the SNP GALNT14-rs9679162 was performed as previously described [16]. Briefly, genomic DNA isolated from patient blood samples was amplified using the QIAamp DNA mini kit (QIAGEN, Cat: 51306) to obtain 172-bp DNA containing the GALNT14-rs9679162 by polymerase chain reaction (PCR). Two primers were used: 5’-TCACGAGGCCAACATTCTAG-3’ and 5’-TTAGATTC-TGCATGGCTCAC-3’. PCR was performed using Hi-Fi Tag polymerase (BIOTOOLS, Cat: KTT-BB05) according to the protocol provided by the manufacturer. SNP genotypes were determined by direct sequencing.
GALNT14 promoter luciferase assay
The primers, forward: 5’-ATCGGGTACCTCCAACTTTGGACCTCTTTT-3’ and reverse: 5’-ATCGAAGCTTCCAGACCATCGTGGGTTG-3’, were used to amplify a 507-bp DNA fragment containing the GALNT14 promoter. The underlined sequence is recognized by KpnI in the forward primer and HindIII in the reverse primer, respectively. The PCR product containing GALNT14 promoter region was digested with the aforementioned restriction enzymes and inserted into pGL3. After verification of the sequence, the plasmids were transfected into hepatoma cells for the luciferase assay, with or without co-expression of wild type HBx. The procedure was performed as previously described [29].
Immunohistochemical staining (IHC) and western blot analysis
IHC and western blot analysis were performed as described in previous studies [9, 30]. The GALNT14 rabbit polyclonal antibody (Proteintech, Cat: 16939-1-AP) was used for IHC in 1:200 and for western blot analysis in 1:2000 dilutions.
Cell culture and cell viability assay
In this study, three HCC-derived cell lines were used, including J7 [Research Resource Identification (RRID): CVCL_4Z69], Huh7 (RRID: CVCL_0336) and HepG2 (RRID: CVCL_0027). All three cell lines were gifts from Dr. Kwang-Huei Lin, Chang Gung University, Taoyuan, Taiwan. J7 and Huh7 were cultured in Dulbecco’s Modified Eagle Medium (DMEM), while HepG2 was maintained in minimal essential medium (MEM) under standard culture conditions with 5% CO in a humidified incubator at 37C. All the cell lines were routinely examined for mycoplasma contamination. The Alarmar Blue-based cell viability assay (Invitrogen, DAL1100) was performed as previously described [31].
Statistical analysis
Parametric data are presented as the mean standard deviation and compared using a two-sample -test. Dichotomized data are presented as numbers and percentages (%) and compared using the chi-square test or Fisher’s exact tests. Univariate and following multivariate Cox proportional hazard models were performed to estimate overall survival for clinical factors and genotypic variables. In this study, the significant factors identified from the univariate analysis could be included in the multivariate Cox proportional hazards. The Kaplan-Meier method was used to estimate the probability of survival between the different groups, and the log-rank test was used to compare the survival rate. All tests were two-tailed, and 0.05 was considered statistically significant. All statistical analyses were performed using the Statistical Package for the Social Sciences (SPSS) Version 20 (SPSS, Chicago, IL, USA).
Comparison of clinical parameters between sorafenib-treated advanced HCC patients carrying GALNT14-rs9679162 “GG” and “non-GG” (“GT” “TT”) genotype
Clinical parameters
All patients ( 298)
GALNT14 genotype
“GG” ( 52)
“GT” “TT” ( 246)
Gender, male, (%)
234 (78.5%)
40 (76.9%)
194 (78.9%)
0.757
Age, years, mean SD
63.4 12.1
64.9 12.9
63.1 11.9
0.317
Anti-HCV, positive, (%)
108 (36.2%)
20 (38.5%)
88 (35.8%)
0.714
HBsAg, positive, (%)
181 (60.7%)
32 (61.5%)
149 (60.6%)
0.897
Alcoholism, yes, (%)
94 (31.5%)
10 (19.2%)
84 (34.1%)
0.035
Cirrhosis, yes, (%)
256 (85.9%)
43 (82.7%)
213 (86.6%)
0.464
Ascites, yes, (%)
74 (24.8%)
15 (28.8%)
59 (24.0%)
0.461
ECOG, 0/1/2/3, (%)
229/56/10/3
36/11/5/0
193/45/5/3
0.034
(76.8%/18.8%/3.4%/1.0%)
(69.2%/21.2%/9.6%/0%)
(78.5%/18.3%/2.0%/1.2%)
Initial metastasis, yes, (%)
126 (42.3%)
24 (46.2%)
102 (41.5%)
0.534
Portal vein thrombosis, yes, (%)
149 (50%)
28 (53.8%)
121 (49.2 %)
0.542
Previous treatment, yes, (%)
267 (89.6%)
44 (84.6%)
223 (90.7%)
0.195
Tumor size, cm, mean SD
5.4 3.9
5.9 4.3
5.4 3.8
0.408
AFP, ng/mL, median (range)
226.7 (0.8 to 831318)
223.3 (2.6 to 831318)
226.7 (0.8 to 745879)
0.374
Albumin, g/dL, mean SD
3.7 0.5
3.7 0.6
3.7 0.5
0.751
Bilirubin, mg/dL, mean SD
1.1 1.4
1.4 2.6
1.0 0.9
0.315
Prothrombin time, sec, mean SD
12.1 1.6
12.4 1.6
12.1 1.6
0.187
Creatinine, mg/dL, mean SD
0.9 0.5
0.9 0.3
0.9 0.5
0.493
AST, U/L, mean SD
75.1 67.7
92.0 99.4
71.6 58.5
0.159
ALT, U/L, mean SD
51.1 41.6
63.2 57.5
48.5 37.0
0.082
Platelet, 1000/L, mean SD
161.9 94.0
173.6 93.0
159.4 94.2
0.322
ALBI score
2.38 0.53
2.33 0.59
2.39 0.52
0.461
ALBI grade
1.7 0.5
1.7 0.6
1.7 0.5
0.482
ALBI grade 1vs. 23
102 vs. 196 (34.2% vs 65.8%)
17 vs. 35 (32.7% vs 67.3%)
85 vs. 161 (34.6% vs 65.4%)
0.797
Child-Pugh score
5.9 1.1
6.1 1.3
5.9 1.1
0.110
Child-Pugh grade
1.2 0.5
1.3 0.5
1.2 0.4
0.836
Child-Pugh grade A vs. BC
230 vs. 68 (77.2% vs 22.8%)
40 vs. 12 (76.9% vs 23.1%)
190 vs. 56 (77.2% vs 22.8%)
0.961
PALBI score
3.05 0.55
2.93 0.58
3.08 0.54
0.085
PALBI grade
1.2 0.5
1.3 0.6
1.2 0.5
0.224
PALBI grade 1vs. 23
255 vs. 43 (85.6% vs 14.4%)
41 vs. 111 (78.8% vs 21.2%)
102 vs. 196 (87% vs 13%)
0.129
APRI score
1.6 1.7
1.9 2.6
1.5 1.5
0.286
APRI grade
1.4 1.2
1.3 1.2
1.4 1.2
0.552
APRI grade 0 vs. 123
104 vs. 194 (34.9% vs 65.1%)
19 vs. 33 (36.5% vs 63.5%)
85 vs. 161 (34.6% vs 65.4%)
0.785
APRI grade 012 vs. 3
232 vs. 66 (77.9% vs 22.1%)
41 vs. 11 (78.8% vs 21.2%)
191 vs. 55 (77.6% vs 22.4%)
0.849
FIB-4 score
5.53 4.99
5.89 6.05
5.45 4.74
0.561
FIB-4 grade
1.5 0.6
1.5 0.6
1.5 0.6
0.643
FIB-4 grade 0 vs. 12
22 vs. 276 (7.4% vs 92.6%)
4 vs. 48 (7.7% vs 92.3%)
18 vs. 228 (7.3% vs 92.7%)
1.000
Total sorafenib dose, g, mean SD
124.4 137.2
122.8 116.8
124.8 141.6
0.914
Post-sorafenib therapy, yes, (%)
167 (56%)
27 (51.9%)
140 (56.9%)
0.614
Total death/HCC-related death,
170/97
33/18
137/79
0.897
Objective response rate, (%)
44 (14.8%)
8 (15.4%)
36 (14.6%)
0.349
Disease control rate, (%)
187 (62.8%)
33 (63.5%)
154 (62.6%)
0.594
Bold values indicate statistical significance 0.05. Anti-HCV, antibody against hepatitis C virus; HBsAg, hepatitis B virus surface antigen; ECOG, Eastern Cooperative Oncology Group; AFP, alpha-fetoprotein; AST, aspartate transaminase; ALT, alanine transaminase; ALBI score, albumin-bilirubin score; PALBI score, platelet-albumin-bilirubin score; APRI, AST to platelet ratio index; FIB-4 score, fibrosis-4 score. Additional treatments following lenvatinib failure.
Results
Baseline demographic characteristics of HCC patients treated with sorafenib
A total of 298 patients treated with sorafenib were included in this study. Their baseline clinical and genotypic characteristics are listed in Table 1. Among them, 52 (17.4%) were GALNT14-rs9679162 “GG” genotype, and 246 (82.6%) were GALNT14 “non-GG” (“GT” “TT”) genotype. The mean age was 63.4 12.1 years; 234 (78.5%) were male; 256 (85.9%) had histological or clinical evidence of liver cirrhosis; 267 (89.6%) had previously received anticancer treatments, including TACE, chemotherapy and radiotherapy. Higher rates of initial metastases (126, 42.3%) and portal vein thrombosis (149, 50%) were noted due to the inclusion of patients with advanced HCC. The etiological analysis showed that 108 (36.2%) were anti-HCV positive, 181 (60.7%) were HBsAg positive and 94 (31.5%) were associated with alcohol abuse. It was not uncommon for patients to have more than one etiology.
Cox proportional hazard analysis for association between clinical factors and overall survival in advanced HCC patients receiving sorafenib treatment
Clinical parameters
Univariate analysis
Multivariate analysis
Hazard ratio (95% CI)
Hazard ratio (95% CI)
GALNT14 genotype, “GG” 1
1.270 (0.867–1.860)
0.220
Gender, male 1
0.887 (0.620–1.269)
0.511
Age, per year increase
1.000 (0.987–1.013)
0.993
Anti-HCV, positive 1
0.778 (0.565–1.071)
0.124
HBsAg, positive 1
1.462 (1.068–2.002)
0.018
1.674 (1.208–2.319)
0.002
Alcoholism, yes 1
1.074 (0.772–1.495)
0.670
Cirrhosis, yes 1
1.673 (0.999–2.802)
0.051
Ascites, yes 1
2.244 (1.613–3.122)
0.001
2.328 (1.648–3.289)
0.001
ECOG, per grade increase
1.281 (0.989–1.658)
0.060
Initial metastasis, yes 1
1.398 (1.033–1.892)
0.030
1.505 (1.101–2.057)
0.010
Portal vein thrombosis, yes 1
1.286 (0.951–1.740)
0.102
Previous treatment, yes 1
1.123 (0.685–1.844)
0.645
Tumor size, per cm increase
1.032 (0.994–1.071)
0.103
AFP, per 1000 ng/mL increase
1.001 (1.000–1.003)
0.098
Albumin, per g/dL increase
0.647 (0.490–0.855)
0.002
0.683 (0.510–0.913)
0.010
Bilirubin, per mg/dL increase
1.298 (1.133–1.488)
0.001
Prothrombin time, per sec increase
0.875 (0.782–0.979)
0.019
0.836 (0.745–0.937)
0.002
Creatinine, per mg/dL increase
1.260 (0.964–1.645)
0.090
AST, per U/L increase
1.004 (1.002–1.006)
0.001
1.003 (1.001–1.005)
0.010
ALT, per U/L increase
1.002 (0.998–1.006)
0.293
Platelet, per 1000/L increase
1.001 (0.999–1.003)
0.180
ALBI score
1.713 (1.275–2.302)
0.001
ALBI grade
1.664 (1.241–2.230)
0.001
Child-Pugh score
1.227 (1.078–1.397)
0.002
Child-Pugh grade
1.326 (0.951–1.848)
0.096
Neutrophil/platelet ratio
1.313 (0.874–1.972)
0.189
PALBI score
1.652 (1.210–2.255)
0.002
PALBI grade
1.783 (1.309–2.429)
0.001
1.542 (1.090–2.181)
0.014
APRI score
1.074 (0.991–1.164)
0.081
APRI grade
1.160 (1.017–1.323)
0.027
FIB-4 score
1.029 (1.001–1.057)
0.043
FIB-4 grade
1.183 (0.919–1.523)
0.191
Bold values indicate statistical significance 0.05. Anti-HCV, antibody against hepatitis C virus; HBsAg, hepatitis B virus surface antigen; ECOG, Eastern Cooperative Oncology Group; AFP, alpha-fetoprotein; AST, aspartate transaminase; ALT, alanine transaminase; ALBI score, albumin-bilirubin score; PALBI score, platelet-albumin-bilirubin score; APRI, AST to platelet ratio index; FIB-4 score, fibrosis-4 score.
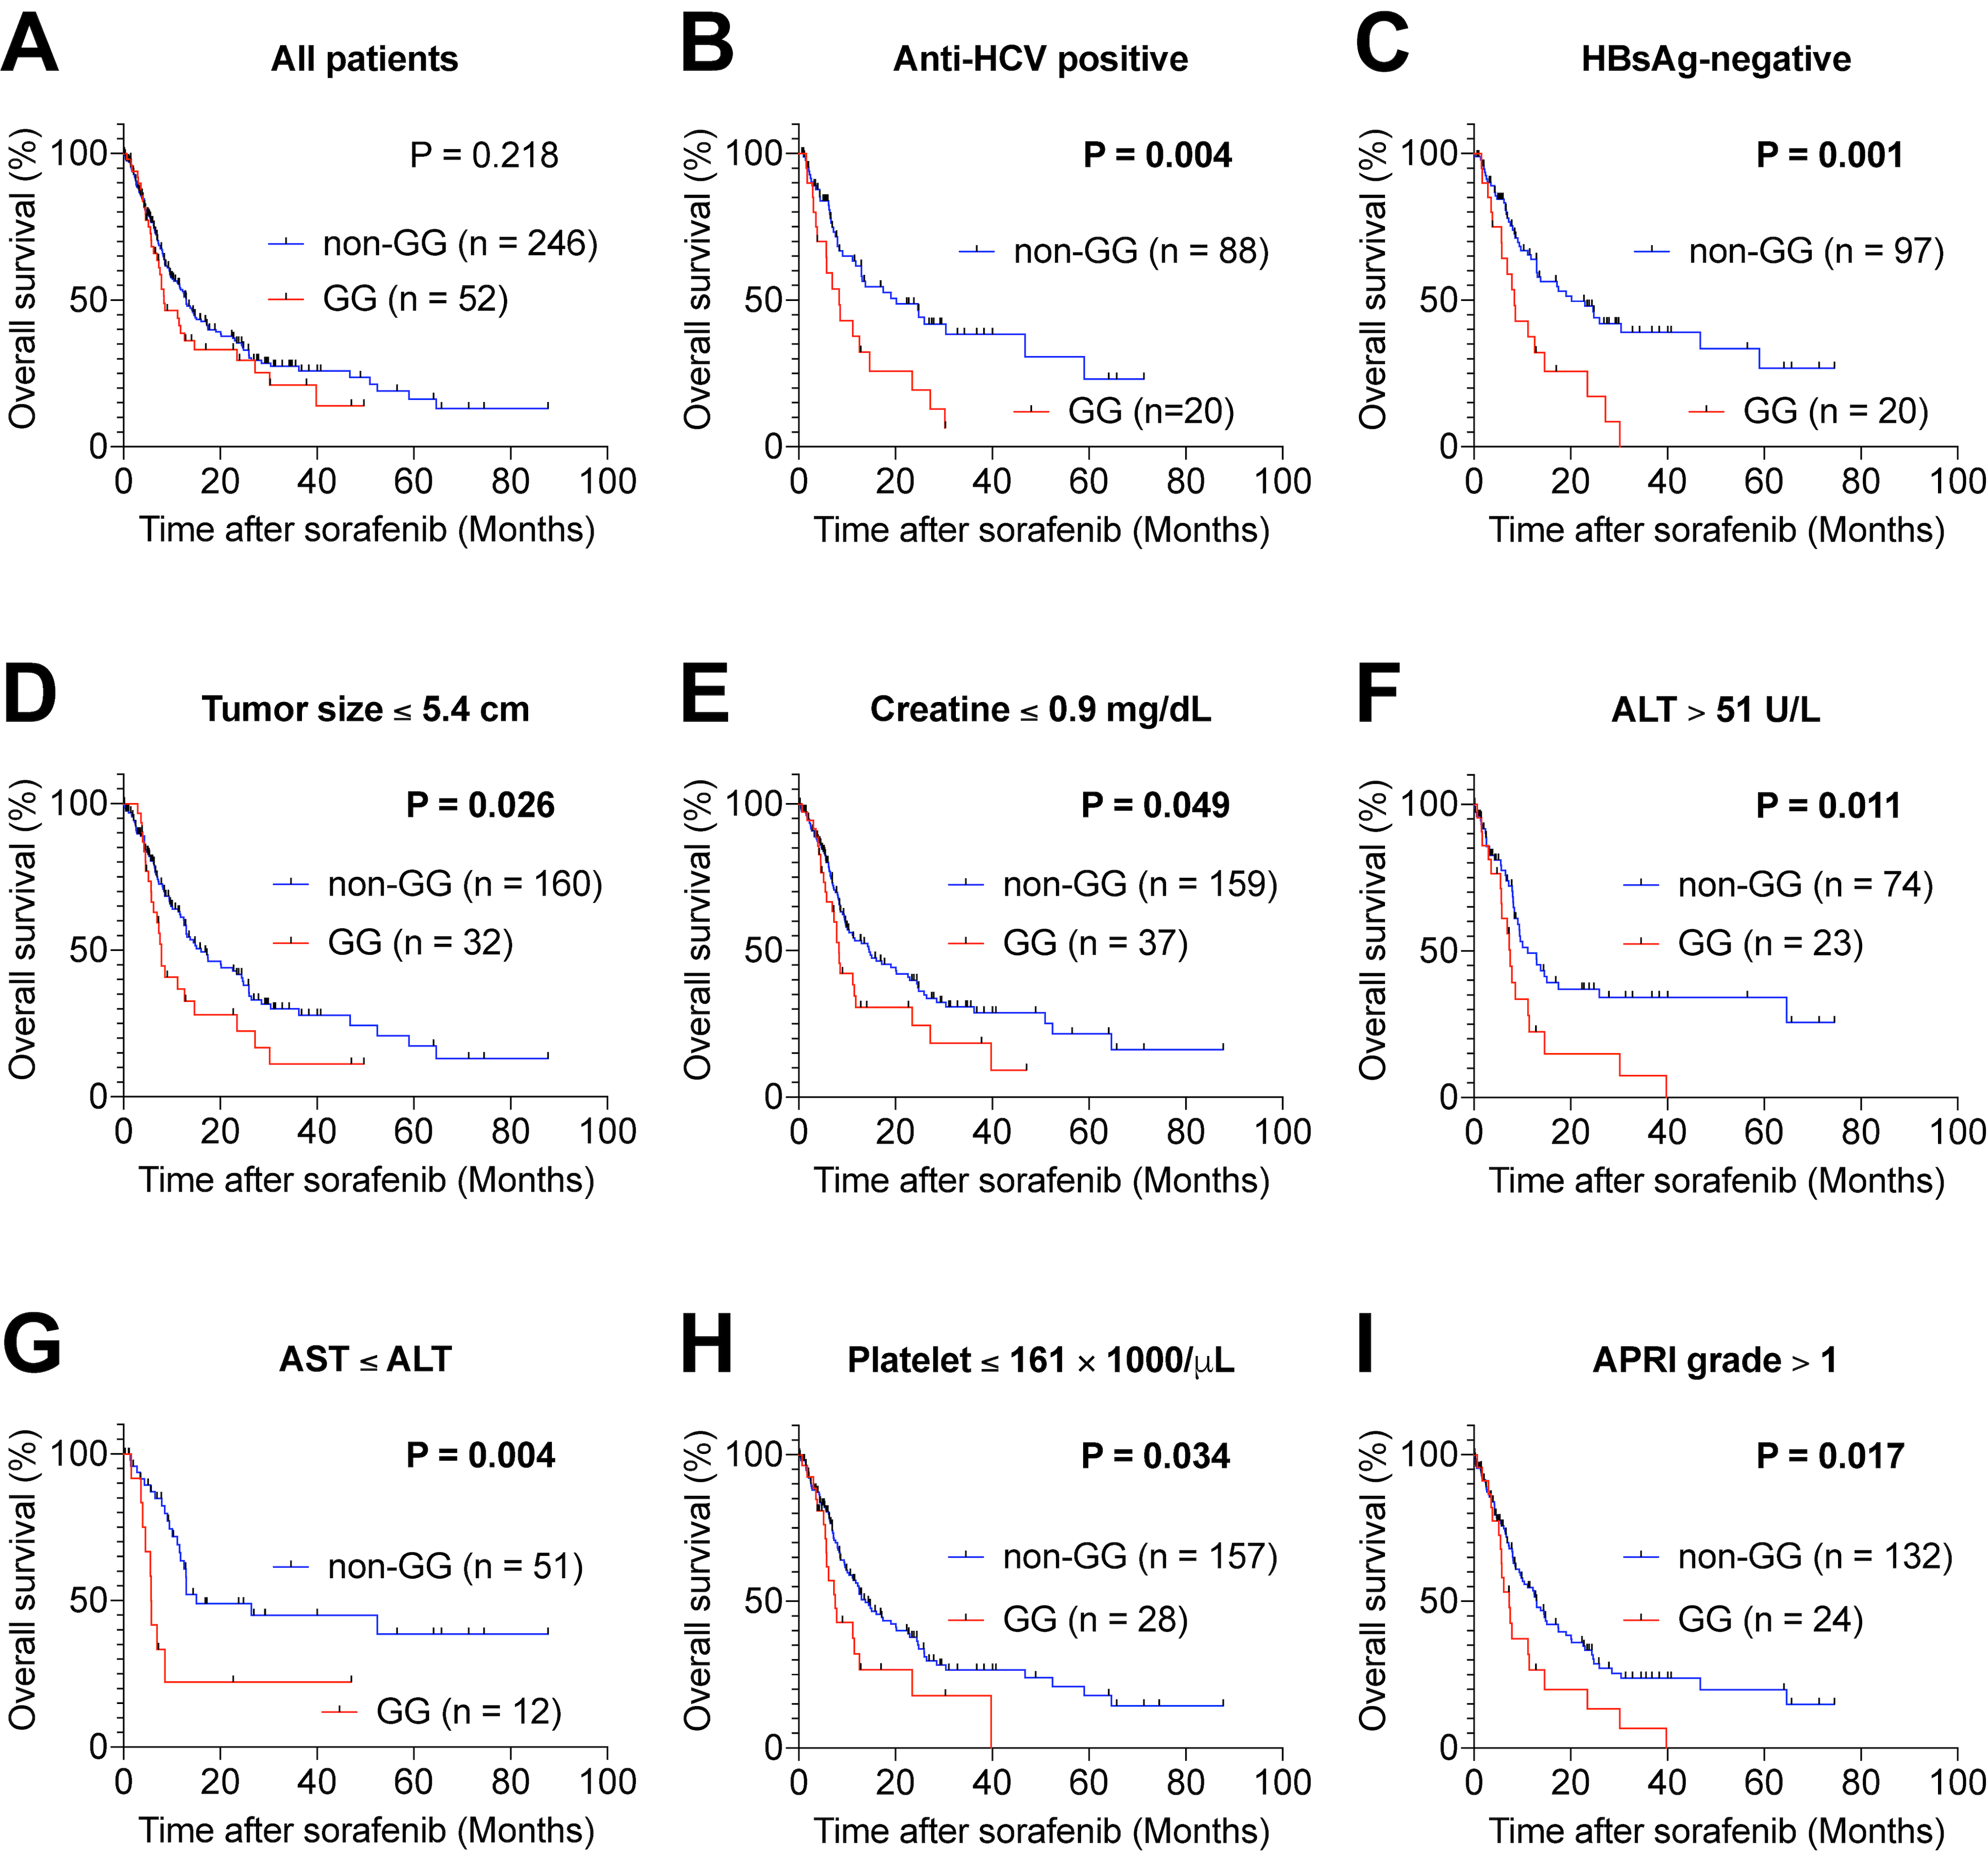
Kaplan-Meier analysis of OS following sorafenib therapy in patients with advanced HCC with the GALNT14-rs9679162 “GG” and “non-GG” genotype. (A) Comparison of OS in all sorafenib-treated patients. (B) Comparison of OS in subgroup of anti-HCV-positive patient. (C) Comparison of OS in subgroup of HBsAg-negative patient. (D) Comparison of OS in subgroup of patients with tumor size 5.4 cm. (E) Comparison of OS in subgroup of patients with creatinine (Cr) 0.9 mg/dL. (F) Comparison of OS in subgroup of patients with ALT 51 U/L. (G) Comparison of OS in subgroup of patients with AST ALT. (H) Comparison of OS in subgroup of patients with platelet 161 1000/L. (I) Comparison of OS in subgroup of patients with APRI grade 1. For (D–F and H), the median values were used as the threshold. Red line, “GG” genotype; Blue line, “non-GG” genotype.
Comparison of baseline characteristics of patients with advanced HCC with GALNT14-rs9679162 “GG” and “non-GG” genotypes
Table 1 also shows the results of a detailed comparison of all clinical characteristics and scores between patients with advanced HCC with GALNT14-rs9679162 “GG” and “non-GG” (“GT” “TT”) genotypes. Patients with the “GG” genotype had lower rates of alcohol abuse (19.2% versus 34.1%; 0.035) and lower ECOG performance status ( 0.034). No significant difference was observed in the other variables and clinical scores. Furthermore, no statistical difference was found between the patients of the two genotypes after correction of the multiple comparisons by Bonferroni method.
The independent prognostic predictors before treatment in all patients receiving sorafenib
Kaplan-Meier analysis was used to investigate the prognostic significance of the GALNT14-rs9679162 genotype and found that the “GG” genotype was not associated with OS ( 0.218), progression-free survival (PFS) ( 0.893), and time-to-response (TTR) ( 0.272) (Figs 1A, S1A, and S2A) when all patients were included. Univariate analysis and multivariate Cox proportional hazard analysis were performed to understand the relationship between clinical factors and OS after sorafenib treatment (Table 2). Univariate analysis revealed that HBsAg-positive, ascites, initial metastasis, lower albumin, shorter prothrombin time, higher bilirubin, higher AST, higher ALBI score, higher ALBI grade, higher Child-Pugh score, higher PALBI score, higher PALBI grade, higher APRI grade, and a higher FIB-4 score were significantly associated with shorter OS. After adjusting for confounding factors, multivariate analysis revealed positivity for HBsAg ( 0.002), ascites ( 0.001), initial metastasis ( 0.010), lower albumin level ( 0.010), shorter prothrombin time ( 0.002), higher AST ( 0.010), and higher PALBI grade ( 0.014) remained as independent predictors of shorter OS. Notably, alcoholism ( 0.017), higher ECOG grade ( 0.025), initial metastasis ( 0.001), higher AFP ( 0.008), and higher prothrombin time ( 0.017) were markedly correlated to shorter PFS, while only alcoholism ( 0.006), initial metastasis ( 0.001), higher AFP ( 0.036) and higher prothrombin time ( 0.027) were an independent predictor for PFS in multivariate analysis (Table S1). Absence of cirrhosis ( 0.016), and lower neutrophil/platelet ratio ( 0.036) were associated with shorter TTR. However, no factor was an independent predictor of TTR in the multivariate analysis (Table S2). These findings suggest that these baseline characteristics identified from multivariate analysis were independent prognostic predictors for all patients treated with sorafenib.
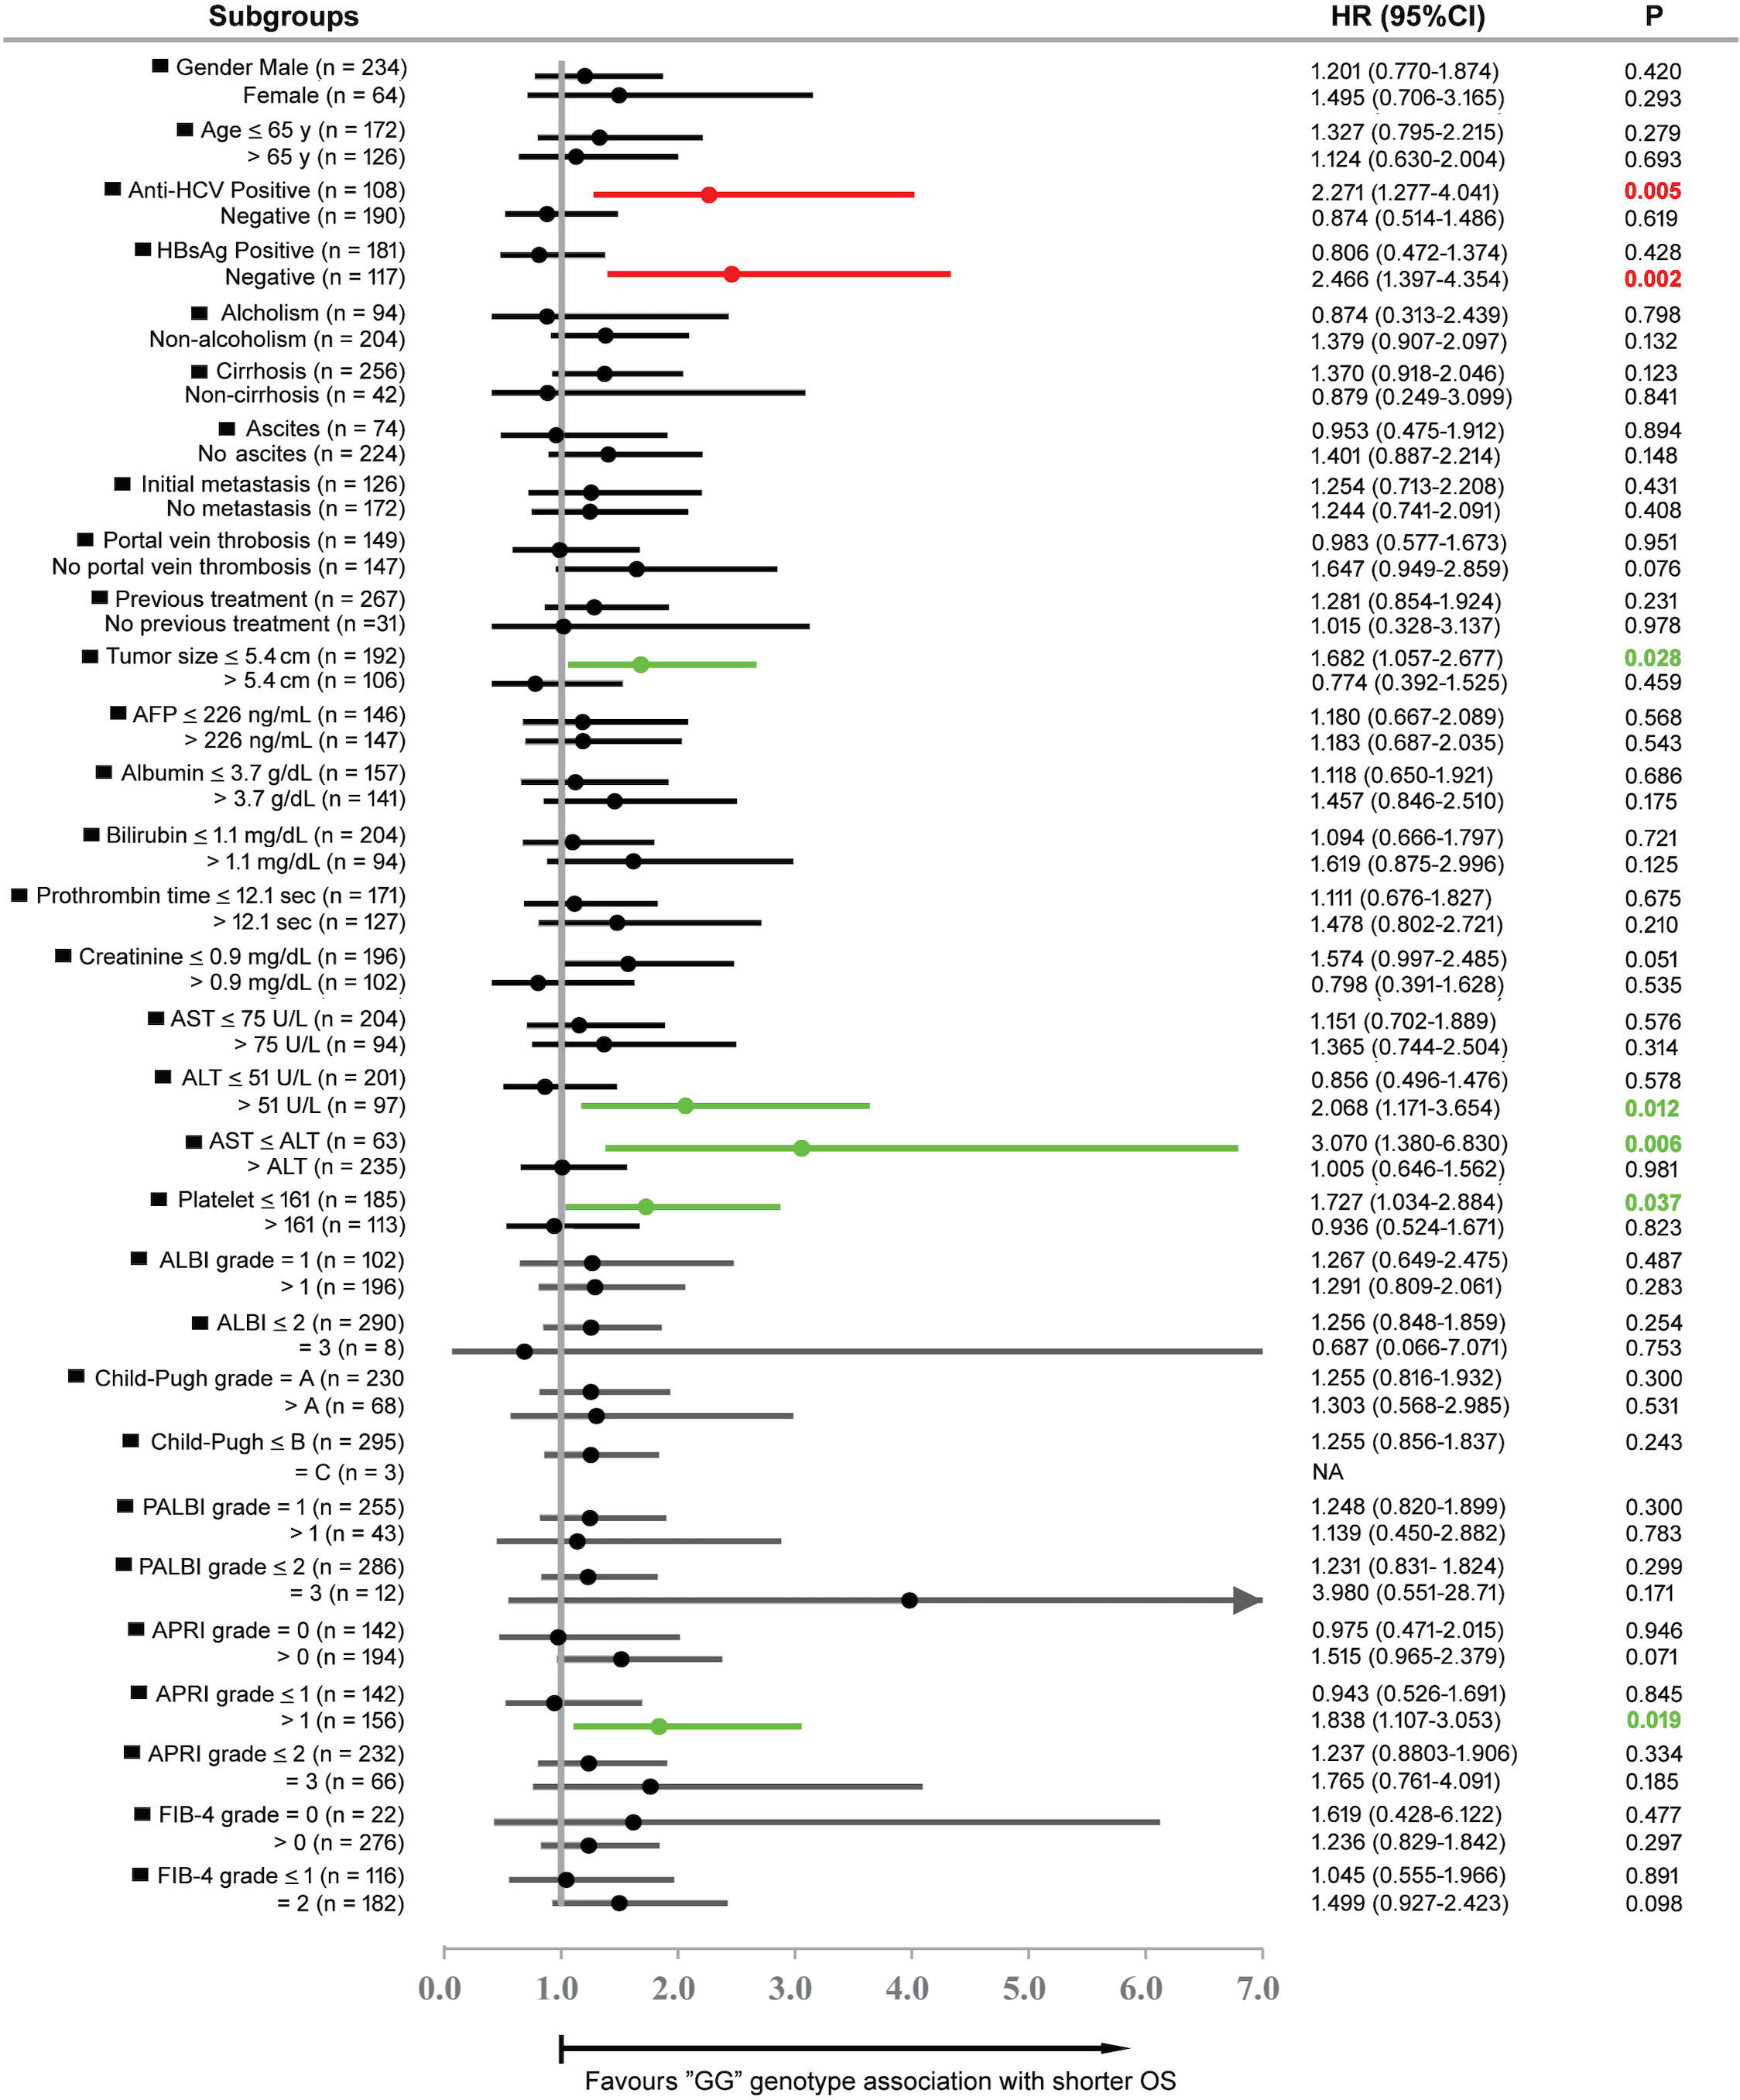
Forest plot analysis of OS in relation to GALNT14-rs9679162 “GG” genotype in different clinical subgroups of sorafenib-treated patients. The median values of the clinical parameters served as thresholds. Red line, etiology-related subgroups with significant difference; green line, subgroups related to other clinical parameters with significant difference. HR, hazardous ratio; CI, confidence interval.
Subgroup analysis to identify subgroups of patients whose GALNT14-rs9679162 genotype effectively predicts sorafenib therapeutic outcome
Although in the present study, when all patients were included, the GALNT14-rs9679162 genotype was not associated with prognosis in patients receiving sorafenib, our previous study showed that in treatment-naïve BCLC stage C HCC patients receiving sorafenib as first-line therapy, the GALNT14-rs9679162 “GG” genotype was significantly associated with shorter OS in specific patient subgroups [22]. To understand whether this association stands valid in real-world BCLC stage C patients who received another anticancer treatment before sorafenib, we divided the patients into different subgroups and asked whether GALNT14-rs9679162 “GG” in these subgroups was associated with OS using Cox proportional hazard analysis (Fig. 2). We found in certain subgroups of patients (anti-HCV-positive, HBsAg-negative, tumor size 5.4 cm, creatinine 0.9 mg/dL, ALT 51 U/L, AST ALT, platelet 161 1000/L, and APRI grade 1), the “GG” genotype was significantly associated with shorter OS (Fig. 2). Subsequently, Kaplan-Meier plots with log-rank analysis were used to further confirm these data. The “GG” genotype effectively predicted unfavorable OS after sorafenib therapy in the following subgroups: anti-HCV-positive (Fig. 1B, 0.004), HBsAg-negative (Fig. 1C, 0.001), tumor size 5.4 cm (Fig. 1D, 0.026), Creatinine 0.9 mg/dL (Fig. 1E, 0.049), ALT 51 U/L (Fig. 1F, 0.010), AST ALT (Fig. 1G, 0.004), platelet 161 1000/L (Fig. 1H, 0.035), or APRI grade 1 (Fig. 1I, 0.017). However, the “GG” genotype could not predict PFS (Fig. S1B–I) and TTR (Fig. S2B–I) after sorafenib treatment in these subgroups.
Expansion of the patient subgroups eligible for survival prediction by GALNT14-rs9679162 genotype
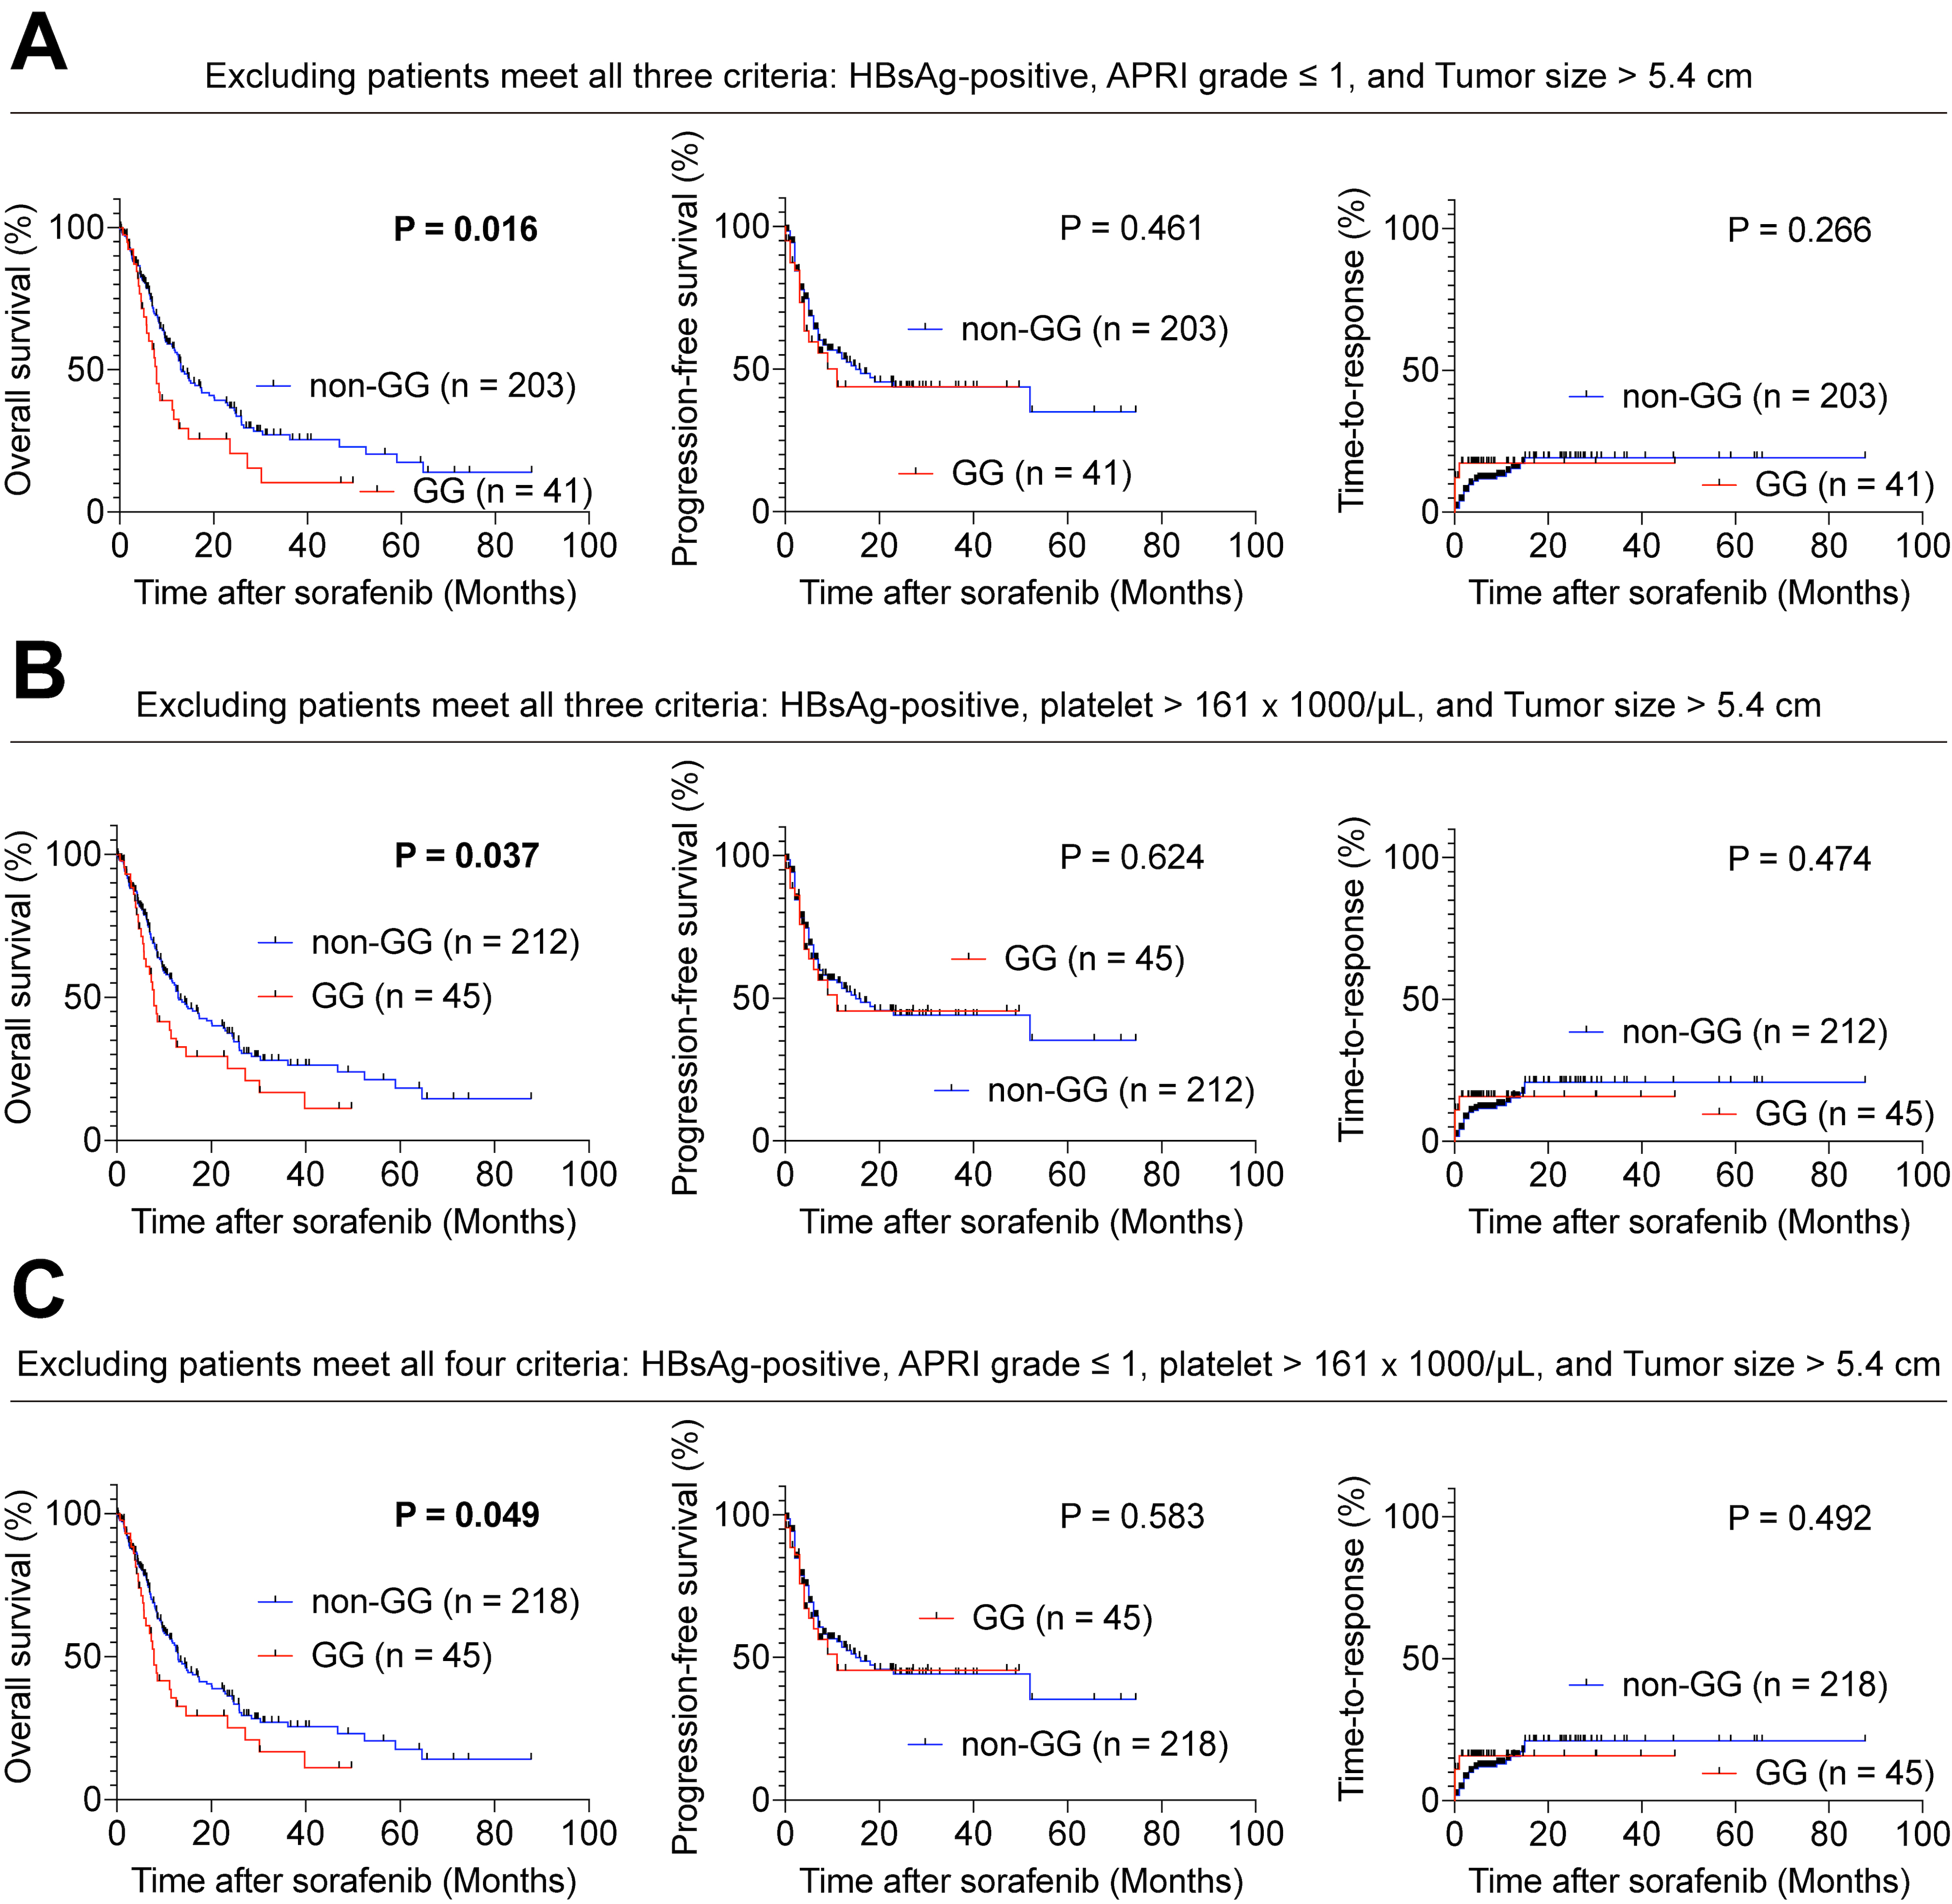
In Fig. 2, the GALNT14-rs9679162 “GG” genotype could only predict unfavorable response to sorafenib in certain specific subgroups, including the red lines subgroups: HBsAg-negative and anti-HCV positive (Fig. 2, red lines), and the green line subgroups: smaller tumors, hepatitis, and cirrhosis (Fig. 2, green lines). Accordingly, we examined a group of patients without the following clinical conditions: HBsAg positivity, APRI grade 1 and tumor size 5.4 cm. In other words, patients with HBsAg-positive, non-cirrhotic and larger tumors were excluded. After exclusion of these patients, 244 patients (81.9%) remained. In this large subgroup, the “GG” genotype was significantly associated with shorter OS ( 0.016), but not with PFS ( 0.461) and TTR ( 0.266) (Fig. 3A). Similarly, we were able to select patients without a combination of: HBsAg positivity, platelet 161 1000/L and tumor size 5.4 cm ( 257, 86.3%). In this subgroup, the “GG” genotype was also significantly associated with shorter OS ( 0.037), but not with PFS ( 0.624) and TTR ( 0.474) (Fig. 3B). Further exclusion of patients meeting all four factors: HBsAg-positive, APRI grade 1, platelet 161 1000/L, and tumor size 5.4 cm resulted in a larger subgroup of 263 patients (88.3%). In this subgroup, the “GG” genotype was significantly associated with shorter OS ( 0.049), but not with PFS ( 0.583) and TTR ( 0.492) (Fig. 3C).
Kaplan-Meier analysis of overall survival, progression-free survival, and time-to-response in patients with advanced HCC with GALNT14-rs9679162 “GG” or “non-GG” genotype following sorafenib therapy. Comparison of overall survival, progression-free survival, and time-to-response in the following cases: (A) after exclusion of patients with concurrent HBsAg-positive, APRI grade 1 and tumor size 5.4 cm, (B) after exclusion of patients with concurrent HBsAg-positive, platelet 161 1000/L and tumor size 5.4 cm, and (C) after exclusion of patients with concurrent HBsAg-positive, platelet 161 1000/L, APRI grade 1 and tumor size 5.4 cm.
Collectively, in HBsAg-negative or anti-HCV-positive patients, the “GG” genotype effectively predicted shorter OS, but not PFS and TTR, in sorafenib-treated patients. However, if we wanted to apply this marker to a larger proportion of patients, patients with both HBsAg-positive, larger tumors, and non-cirrhosis (or higher platelet counts) should be excluded.
HBx perturbs GALNT14 expression by trans-repressing the GALNT14 promoter activity in HCC cells
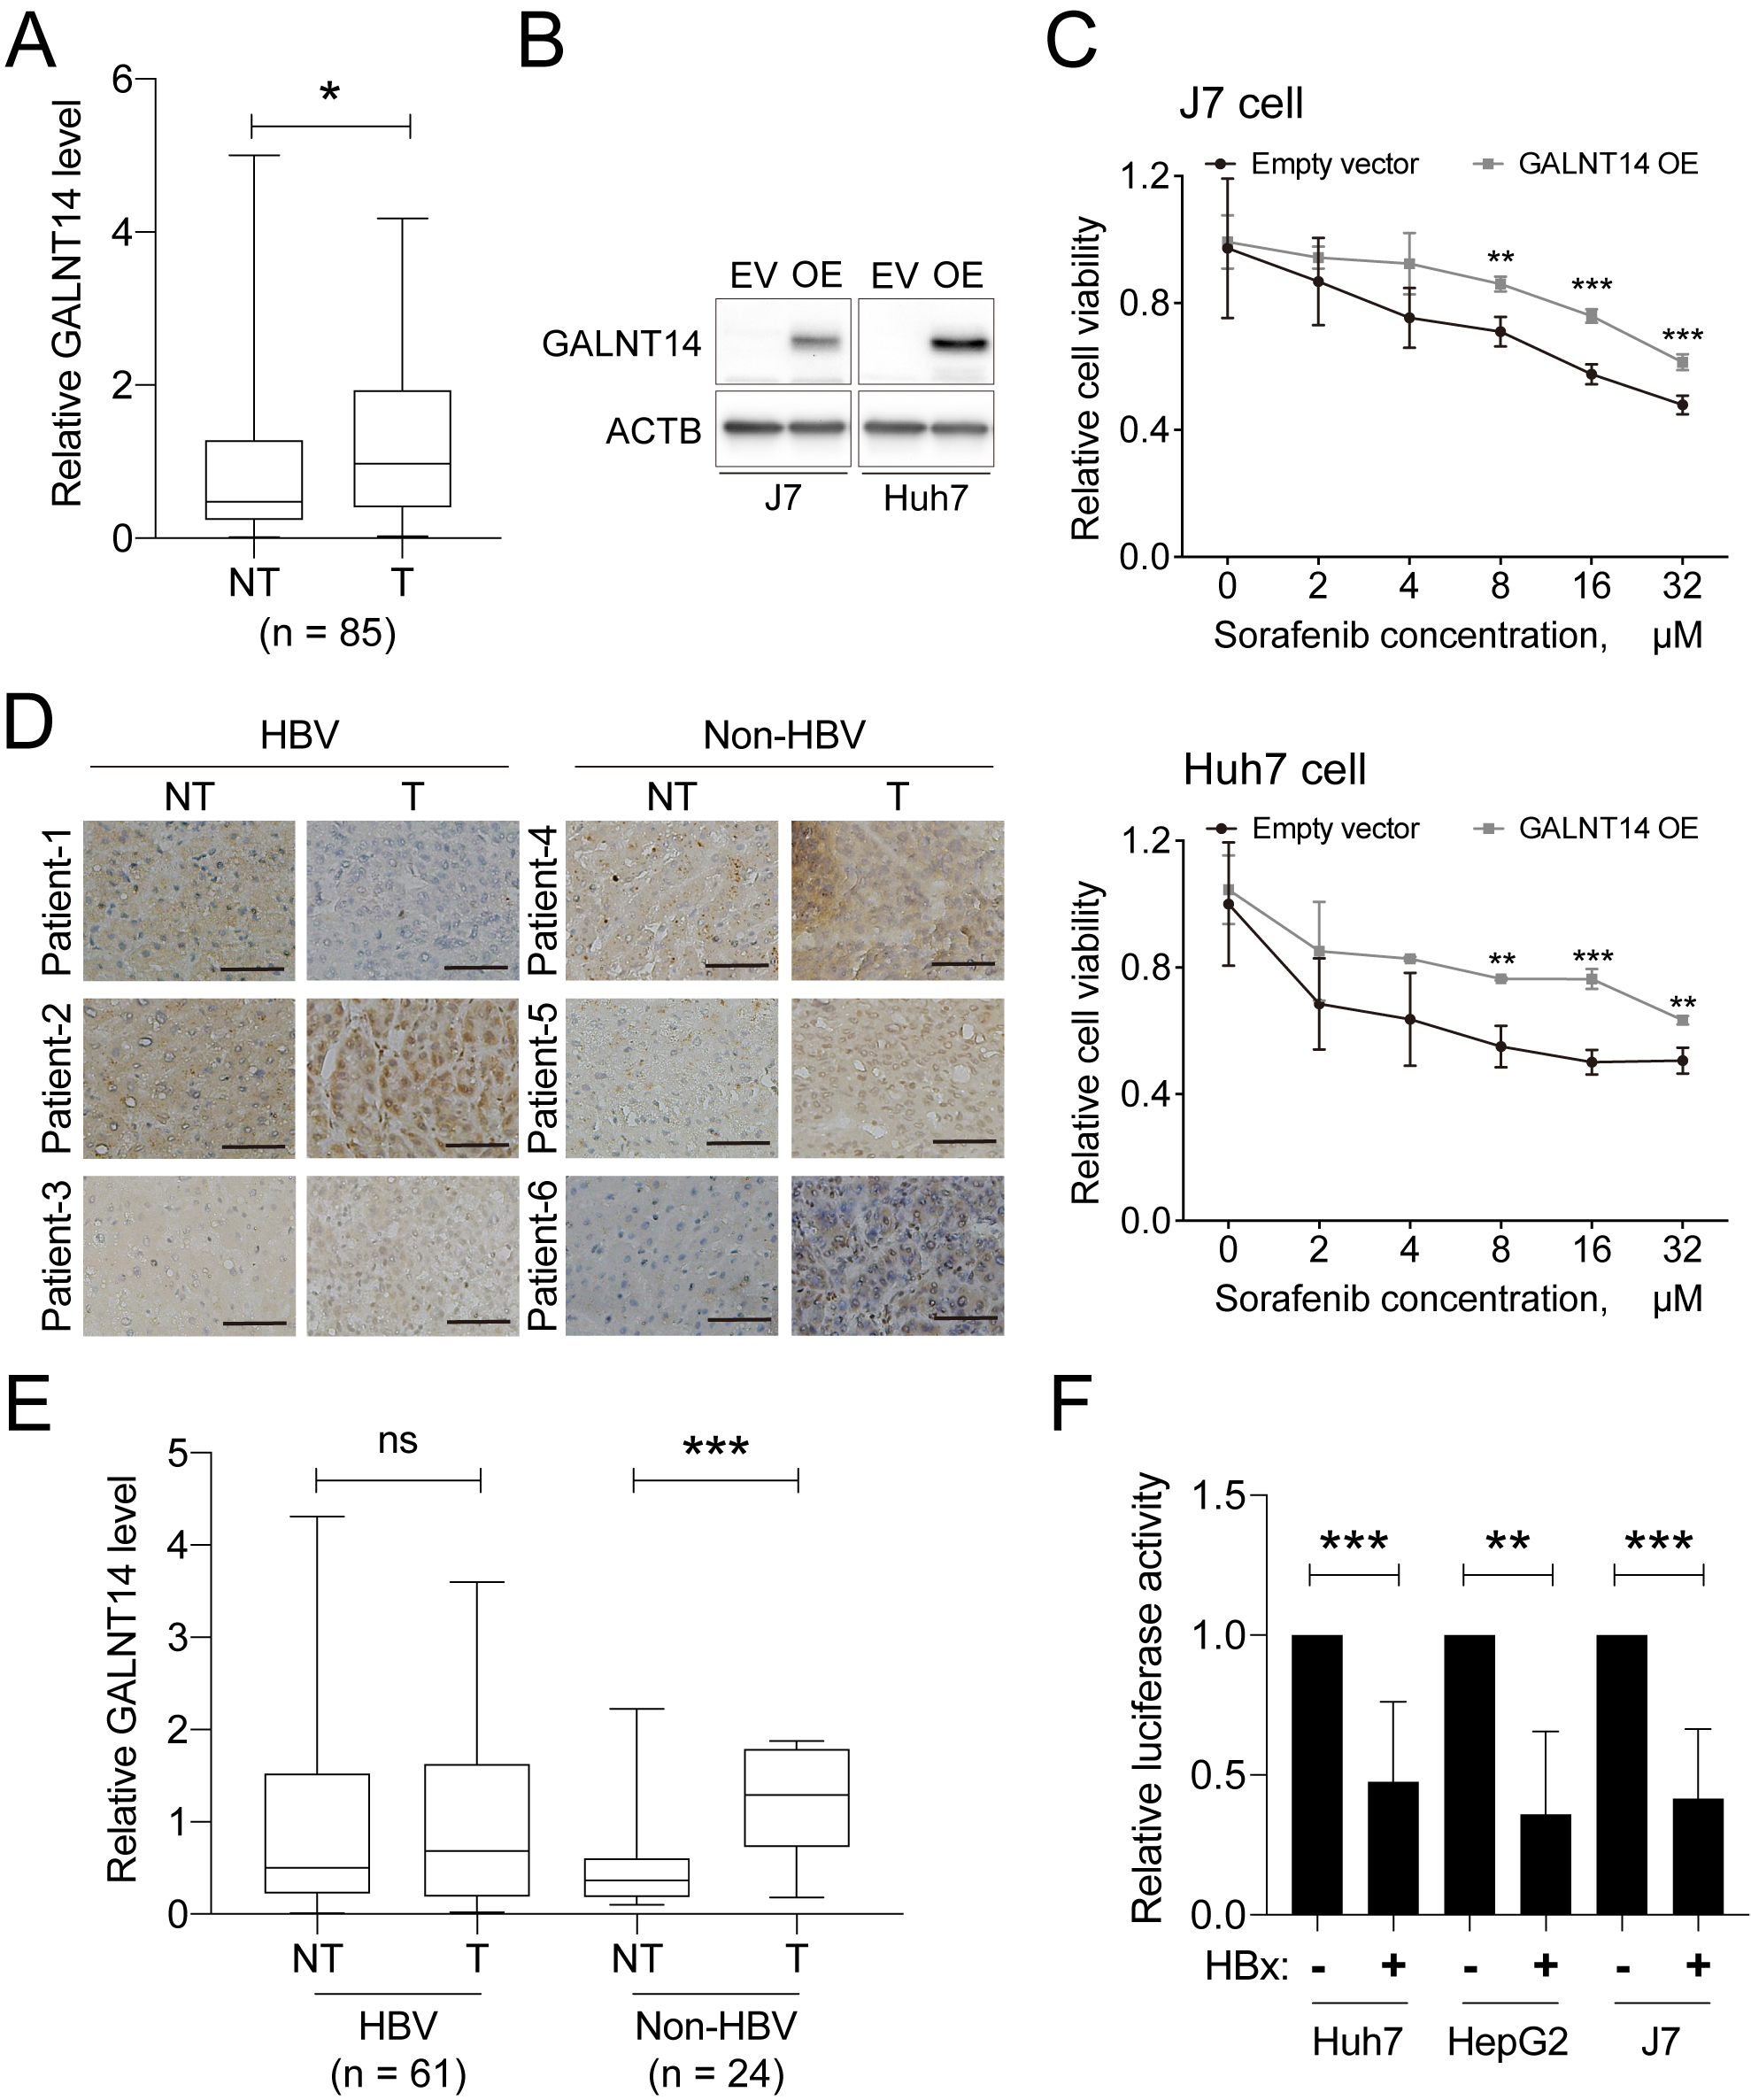
In the aforementioned findings, it was found that the GALNT14-rs9679162 genotype was unable to predict the prognosis of HBV-related HCC. A previous study also demonstrated that in patients with BCLC stage B HCC, GALNT14 levels were higher in cancerous liver tissue than in non-cancerous parts [9]. Therefore, here we examined 85 HCC tissues obtained from patients with BCLC stage A. GALNT14 expression was stained by IHC and scored according to a computer algorithm (Fig. 4A). Higher levels of GALNT14 were found in cancerous tissue, which was consistent with what has been observed in mid-stage HCC [9]. By performing a cell-based sorafenib susceptibility assay, we found that overexpression of GALNT14 significantly suppressed drug sensitivity to sorafenib in two HCC cell lines, J7 and Huh7 (Fig. 4B and C). Therefore, overexpression of GALNT14 may play an important role in controlling susceptibility of HCC cells to sorafenib.
Diverse expression of GALNT14 in HBV-related HCC results in unpredictability of sorafenib sensitivity. (A) Relative IHC staining intensity of GALNT14 in BCLC stage A HCC tissues. (B) Western blot analysis of HCC cell samples, with or without GALNT14 overexpression (OE). (C) The alarmar blue-based cell viability assays performed using cells with or without GALNT14 overexpression (OE). (D) The representative image of IHC staining of HBV-related or non-HBV-related HCC tissues. The black scale bar represents 50 m. (E) Quantitative results of IHC staining scores in HBV and non-HBV groups. (F) Luciferase assay of the GALNT14 promoter with or without co-expression of HBx in HCC cells. ns, not significant; , 0.05; , 0.01; , 0.001.
Intriguingly, when 85 samples were stratified into HBV ( 61) and non-HBV ( 24) groups, elevated expression of GALNT14 at tumor parts was only found in non-HBV HCCs (Fig. 4D and E). In contrast, in HBV-related HCC tissues, the levels of GALNT14 in tumor tissues were highly diverse. Some GALNT14 levels decreased (e.g., patient-1, Fig. 4D), some increased (e.g., patient-2), and some remained unchanged (e.g., patient-3), when compared to the nontumor part.
To understand why the high expression of GALNT14 in cancerous liver tissue is absent in HBV-related HCC, a GALNT14 promoter fragment was inserted upstream of the luciferase gene as a reporter plasmid. This plasmid was co-transfected with mock or HBx expression plasmid into HCC cells. HBx is known as a promiscuous transactivator and plays crucial roles in hepatocarcinogenesis. Surprisingly, the presence of HBx was found to markedly inhibit the activity of the GALNT14 promoter in three independent HCC cell lines, Huh7, HepG2 and J7 (Fig. 4F), indicating that HBx serves a trans-repressor of the GALNT14 promoter, but not transactivator. Due to different levels of HBx in liver tissue between different individuals, diverse levels of GALNT14 were observed, as shown in Fig. 4D.
Comparison of baseline clinical characteristics of HCC patients with GALNT14-rs9679162 “GG” and “non-GG” genotypes treated with lenvatinib
Comparison of clinical parameters between lenvatinib-treated advanced HCC patients carrying GALNT14-rs9679162 “GG” and “non-GG” (“GT” “TT”) genotype
GALNT14 genotype
Clinical parameters
All patients ( 52)
“GG” ( 14)
“GT” “TT” ( 38)
Gender, male, (%)
40 (76.9%)
8 (57.1%)
32 (84.2%)
0.092
Age, years, mean SD
65.4 10.3
62.1 11.6
66.6 9.6
0.205
Anti-HCV, positive, (%)
19 (36.5%)
5 (35.7%)
14 (36.8%)
0.940
HBsAg, positive, (%)
34 (65.4%)
11 (78.6%)
23 (60.5%)
0.376
Alcoholism, yes, (%)
7 (15.3%)
2 (14.3%)
5 (13.2%)
0.916
Cirrhosis, yes, (%)
44 (84.6%)
13 (92.9%)
31 (81.6%)
0.571
Ascites, yes, (%)
18 (34.6%)
3 (21.4%)
15 (39.5%)
0.376
ECOG, 0/1/2, (%)
27/24/1 (51.9%/46.2%/1.9%)
8/6/0 (57.1%/42.9%/0%)
19/18/1 (50.0%/47.4%/2.6%)
0.773
Initial metastasis, yes, (%)
18 (34.6%)
3 (21.4%)
15 (39.5%)
0.376
Portal vein thrombosis, yes, (%)
33 (63.5%)
6 (42.9%)
27 (71.1%)
0.122
Previous treatment, yes, (%)
43 (82.7%)
14 (100.0%)
29 (76.3%)
0.112
Tumor size, cm, mean SD
5.9 3.8
5.4 2.1
6.0 4.2
0.907
AFP, ng/mL, median (range)
120.4 (1.5 to 60500)
178.8 (1.5 to 60500)
83.2 (6.0 to 5142)
0.455
Albumin, g/dL, mean SD
3.6 0.6
3.6 0.6
3.7 0.6
0.877
Bilirubin, mg/dL, mean SD
1.3 1.0
1.4 1.1
1.3 0.9
0.929
Prothrombin time, sec, mean SD
12.4 2.0
13.0 2.3
12.2 1.8
0.231
Creatinine, mg/dL, mean SD
0.9 0.3
0.8 0.3
0.9 0.3
0.384
AST, U/L, mean SD
60.2 47.5
49.8 20.5
64.1 53.9
0.939
ALT, U/L, mean SD
53.4 56.6
41.4 24.2
58.0 64.3
0.980
Platelet, 1000/L, mean SD
148.9 86.9
115.4 38.1
161.3 96.5
0.170
ALBI score
2.3 0.6
2.2 0.6
2.3 0.6
0.922
ALBI grade
1.8 0.6
1.8 0.6
1.8 0.6
0.943
ALBI grade 1 vs. 23
14 vs. 38 (29.6% vs 70.4%)
4 vs. 10 (28.6% vs 71.4%)
10 vs. 28 (26.3% vs 73.7%)
0.871
Child-Pugh score
6.0 1.3
5.9 1.6
6.0 1.3
0.518
Child-Pugh grade
1.3 0.6
1.3 0.6
1.3 0.5
0.740
Child-Pugh grade A vs. BC
35 vs. 17 (67.3% vs 32.7%)
10 vs. 4 (71.4% vs 28.6%)
25 vs. 13 (65.8% vs 34.2%)
0.959
PALBI score
2.9 0.5
3.0 0.5
2.9 0.6
0.442
PALBI grade
1.3 0.7
1.3 0.7
1.4 0.7
0.662
PALBI grade 1 vs. 23
40 vs. 12 (76.9% vs 23.1%)
12 vs. 2 (85.7% vs 14.3%)
28 vs. 10 (73.7% vs 26.3%)
0.588
APRI score
1.8 3.9
1.1 0.5
2.0 4.5
0.222
APRI grade
1.3 1.0
1.6 0.6
1.2 1.1
0.216
APRI grade 0 vs. 123
13 vs. 39 (25.0% vs 75.0%)
0 vs. 14 (0.0% vs 100.0%)
13 vs. 25 (34.2% vs 65.8%)
0.030
APRI grade 012 vs. 3
43 vs. 9 (82.7% vs 17.3%)
13 vs. 1 (92.9% vs 7.1%)
30 vs. 8 (78.9% vs 11.1%)
0.446
FIB-4 score
7.6 20.8
4.9 2.9
8.5 24.3
0.517
FIB-4 grade
2.3 0.9
2.7 0.7
2.1 1.0
0.038
FIB-4 grade 0 vs. 123
2 vs. 50 (3.8% vs 92.6%)
0 vs. 14 (0.0% vs 100.0%)
2 vs. 36 (5.3% vs 94.7%)
0.950
Total lenvatinib dose, g, mean SD
2.0 2.0
2.3 1.8
1.9 2.1
0.170
Post-lenvatinib therapy, yes, (%)
23 (44.2%)
7 (50.0%)
16 (42.1%)
0.913
Total death/HCC-related death,
21/15
3/2
18/13
0.844
Objective response rate, (%)
17 (32.7%)
8 (57.1%)
9 (23.7%)
0.051
Disease control rate, (%)
25 (48.1%)
9 (64.3%)
16 (42.1%)
0.268
Bold values indicate statistical significance 0.05. Anti-HCV, antibody against hepatitis C virus; HBsAg, hepatitis B virus surface antigen; ECOG, Eastern Cooperative Oncology Group; AFP, alpha-fetoprotein; AST, aspartate transaminase; ALT, alanine transaminase; ALBI score, albumin-bilirubin score; PALBI score, platelet-albumin-bilirubin score; APRI, AST to platelet ratio index; FIB-4 score, fibrosis-4 score. Additional treatments following lenvatinib failure. Borderline significance.
In the results above, the GALNT14-rs9679162 “GG” genotype was found to predict unfavorable outcomes in specific subgroups of HCC patients treated with sorafenib, such as the HBsAg-negative group. However, it is unclear whether these rules also apply to HCC patients treated with lenvatinib. To answer this question, another cohort of 52 patients with advanced HCC treated with lenvatinib was included in this study. Their baseline clinical and genotypic characteristics are listed in Table 3. Among them, 14 (26.9%) were GALNT14-rs9679162 “GG” genotype, and 38 (73.1%) were GALNT14 “non-GG” (“GT” “TT”) genotype. The mean age was 65.4 10.3 years; 40 (76.9%) were male; 44 (84.6%) had histological or clinical evidence of liver cirrhosis; 43 (82.7%) had previously received other anticancer treatments, including TACE, chemotherapy, and radiotherapy. Due to the inclusion of patients with advanced HCC, the rates of initial metastases (18, 34.6%) and portal vein thrombosis (33, 63.5%) were higher. Etiological analysis showed that 19 (36.5%) were anti-HCV-positive, 34 (65.4%) were HBsAg-positive, and 7 (15.3%) were alcohol-related. Patients with the “GG” genotype were associated with higher APRI ( 0.030) and FIB-4 ( 0.038) grades. Notably, the difference in objective response rate (ORR) was borderline significance between patients with “GG” and “non-GG” genotypes, with “GG” genotype associated with a higher ORR (53.1% vs 23.7%, 0.051). No significant difference was observed in other variables and clinical scores.
Table S3 also shows the comparison between the cohorts treated with sorafenib and lenvatinib, respectively. Among them, number of alcoholic patients ( 0.013, 31.5% vs 15.3%), ECOG performance status ( 0.001), total TKI dose ( 0.001), ORR ( 0.003, 14.8% vs 32.7%), PALBI score ( 0.024) and FIB grade ( 0.001) were significantly different in the two cohorts.
GALNT14-rs9679162 “GG” genotype predicts TTR but not OS and PFS in HCC patients treated with lenvatinib
To understand the predictive value of the GALNT14-rs9679162 “GG” genotype in HCC patients receiving lenvatinib, the same analysis strategy as in sorafenib-treated patients was used. As with sorafenib-treated patients, the “GG” genotype was not significantly associated with OS ( 0.791) when all patients were included (Fig. S3A). Univariate followed by multivariate Cox proportional hazard analysis was performed to examine the relationship between clinical factors and OS after receiving lenvatinib (Table 4). In univariate analysis, higher bilirubin, higher AST, higher Child-Pugh grade, higher PALBI score, higher PALBI grade, higher APRI score, higher APRI grade, and higher FIB-4 score were significantly associated with shorter OS. In multivariate analysis, higher AST ( 0.023), higher Child-Pugh grade ( 0.010), and higher APRI score ( 0.005) remained as independent predictors of shorter OS. Notably, in patients with advanced HCC treated with lenvatinib, only a higher APRI score ( 0.019) and the “GG” genotype ( 0.022) were associated with shorter PFS and TTR (Tables S4 and 5).
Cox proportional hazard analysis for association between clinical factors and overall survival in advanced HCC patients receiving lenvatinib treatment
Clinical parameters
Univariate analysis
Multivariate analysis
Hazard ratio (95% CI)
Hazard ratio (95% CI)
GALNT14 genotype, “GG” 1
1.185 (0.332–4.225)
0.794
Gender, male 1
1.187 (0.333–4.231)
0.791
Age, per year increase
0.999 (0.956–1.044)
0.981
Anti-HCV, positive 1
0.545 (0.204–1.455)
0.226
HBsAg, positive 1
0.995 (1.360–2.755)
0.993
Alcoholism, yes 1
1.534 (0.347–6.777)
0.572
Cirrhosis, yes 1
0.472 (0.062–3.596)
0.469
Ascites, yes 1
0.566 (0.210–1.526)
0.261
ECOG, per grade increase
1.742 (0.626–4.847)
0.287
Initial metastasis, yes 1
0.939 (0.340–2.593)
0.903
Portal vein thrombosis, yes 1
0.456 (0.130–1.605)
0.221
Previous treatment, yes 1
0.686 (0.154–3.050)
0.621
Tumor size, per cm increase
0.991 (0.874–1.124)
0.887
AFP, per 1000 ng/mL increase
0.998 (0.963–1.035)
0.933
Albumin, per g/dL increase
0.519 (0.208–1.296)
0.160
Bilirubin, per mg/dL increase
1.590 (1.122–2.253)
0.009
Prothrombin time, per sec increase
1.040 (0.809–1.336)
0.761
Creatinine, per mg/dL increase
0.459 (0.062–3.377)
0.444
AST, per U/L increase
1.012 (1.003–1.021)
0.007
1.012 (1.002–1.022)
0.023
ALT, per U/L increase
1.006 (0.998–1.014)
0.149
Platelet, per 1000/L increase
0.997 (0.991–1.003)
0.283
ALBI score
2.206 (0.966–5.038)
0.060
ALBI grade
1.661 (0.643–4.292)
0.295
Child-Pugh score
1.336 (0.993–1.798)
0.056
Child-Pugh grade
2.338 (1.153–4.741)
0.019
2.941 (1.293–6.691)
0.010
PALBI score
2.727 (1.232–6.036)
0.013
PALBI grade
2.421 (1.343–4.362)
0.003
APRI score
1.128 (1.042–1.221)
0.003
1.140 (1.040–1.249)
0.005
APRI grade
1.852 (1.096–3.129)
0.021
FIB-4 score
1.020 (1.005–1.035)
0.009
FIB-4 grade
1.597 (0.883–2.888)
0.121
Bold values indicate statistical significance 0.05. Anti-HCV, antibody against hepatitis C virus; HBsAg, hepatitis B virus surface antigen; ECOG, Eastern Cooperative Oncology Group; AFP, alpha-fetoprotein; AST, aspartate transaminase; ALT, alanine transaminase; ALBI score, albumin-bilirubin score; PALBI score, platelet-albumin-bilirubin score; APRI, AST to platelet ratio index; FIB-4 score, fibrosis-4 score.
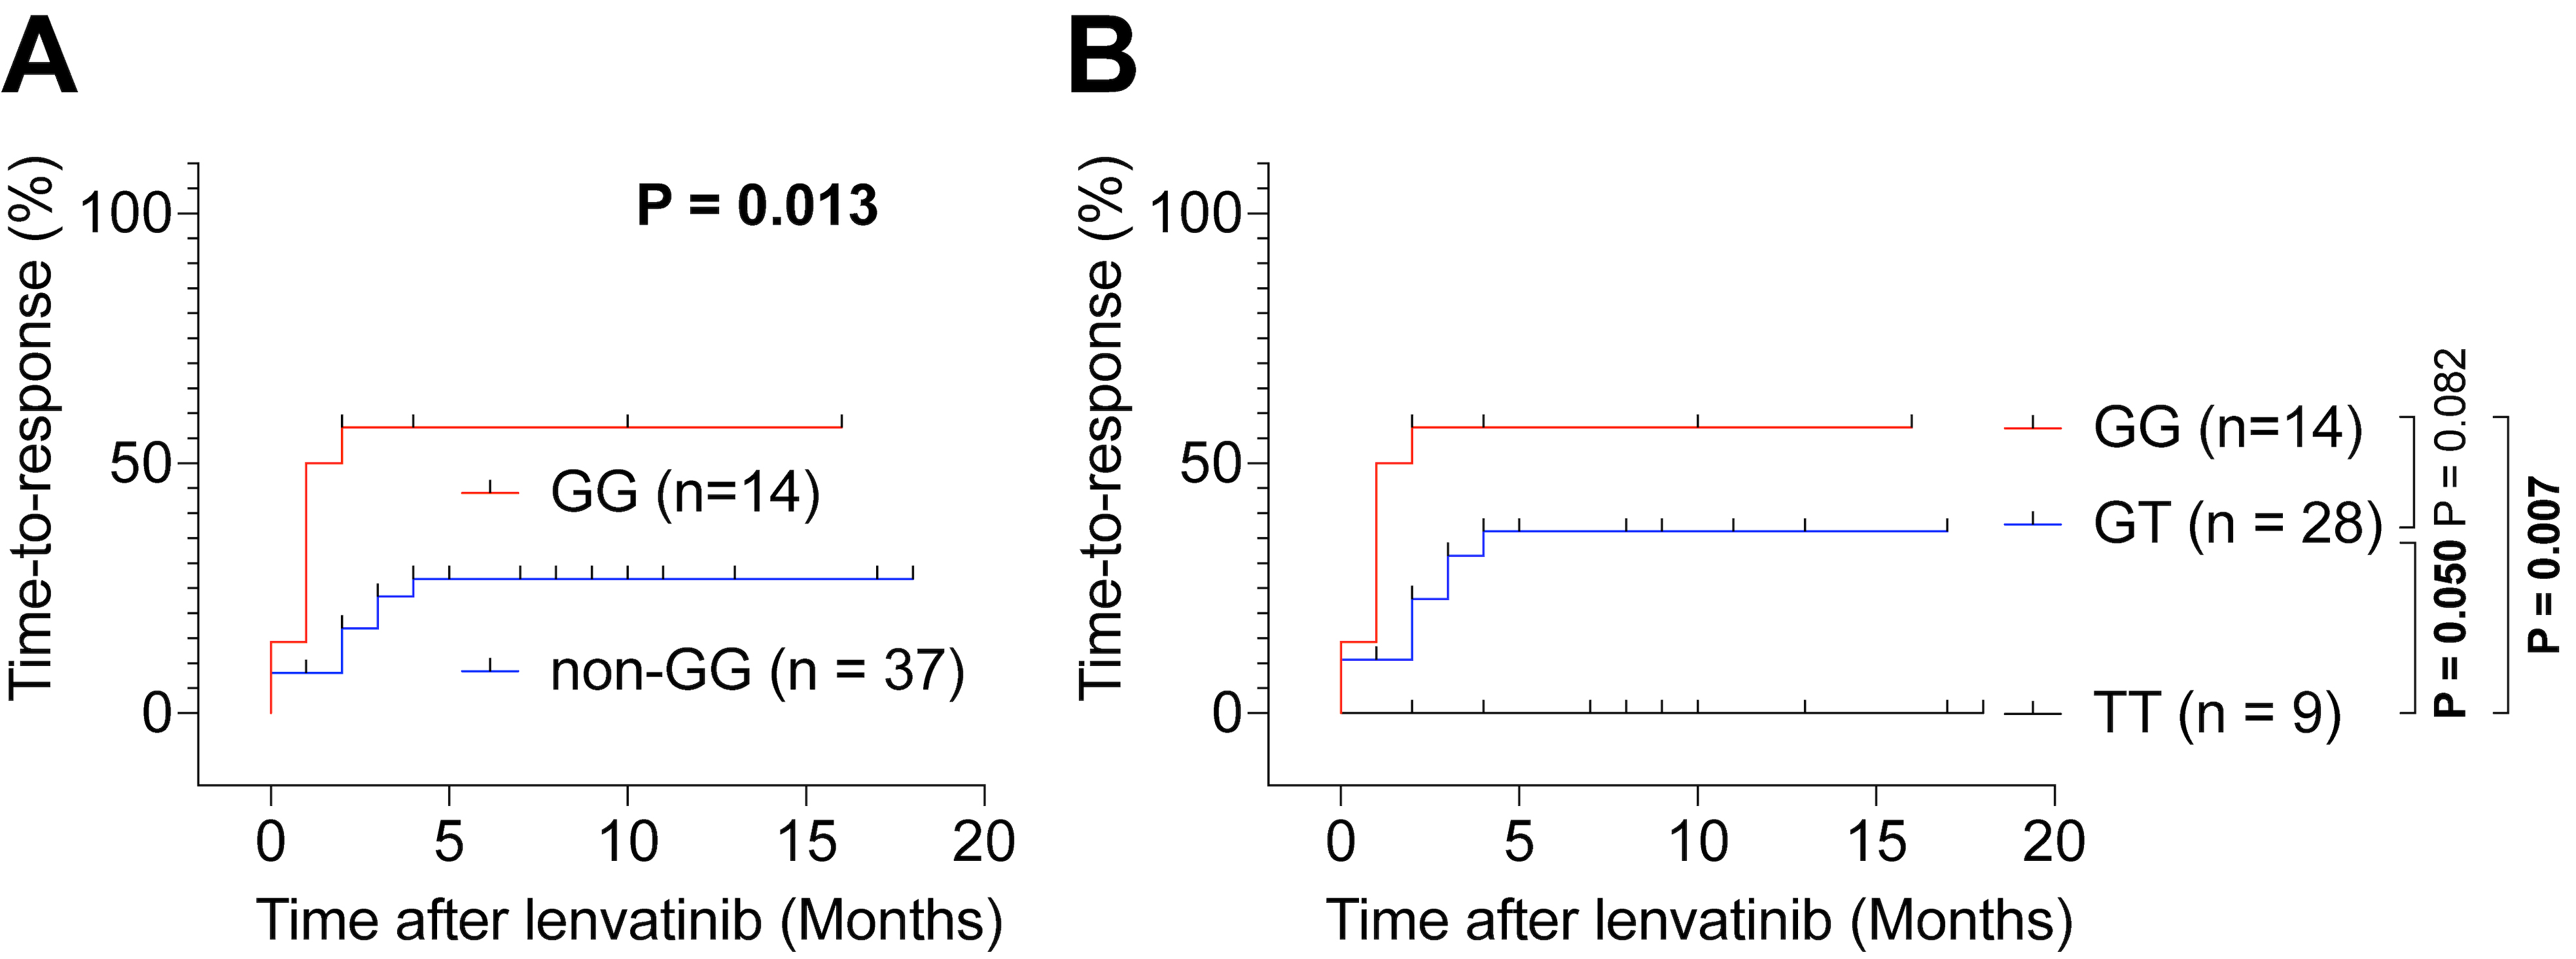
Kaplan-Meier analysis of time-to-response following lenvatinib treatment in all enrolled patients with advanced HCC. (A) Comparison of time-to-response of GALNT14-rs9679162 “GG” and “Non-GG” genotype patients. (B) Comparison of time-to-response of GALNT14-rs9679162 “GG”, “GT”, and “TT” genotype patients. Response to treatment was defined as 30% reduction in tumor volume or 20% decrease in circulating AFP levels.
Subsequently, to examine the predictive value of GALNT14-rs9679162 “GG” in any subgroup, Cox proportional hazard analysis and Kaplan-Meyer analysis were performed. However, no significant association was found in any subgroup using Cox regression analysis (Fig. S4) and Kaplan-Meyer analysis (Fig. S3B–I). Moreover, except for the AST ALT subgroup ( 0.024), there was no significant difference in PFS between the “GG” and “non-GG” genotypes in the other subgroups (Fig. S5). Additionally, according to subgroups defined among sorafenib-treated patients, those with HBsAg-positive, non-cirrhosis, and larger tumors ( 37, 71.2%; Fig. S6A); with HBsAg-positive, higher platelet counts, and large tumors ( 40, 76.9%; Fig. S6B); or with four criteria ( 40, 76.9%; Fig. S6C) were excluded from the comparison. However, OS and PFS were not significantly different between patients with GALNT14-rs9679162 “GG” and “non-GG” genotypes. Interestingly, all of these subgroups were significantly different between patients with “GG” and “non-GG” genotypes in TTR (Fig. S6A–C, 0.035, 0.018, and 0.018, respectively).
Some patients treated with lenvatinib had partial responses, assessed by AFP and mRECIST [26, 27, 28], we then estimated the TTR in this group of patients. Compared with “non-GG” genotype patients, “GG” genotype patients had a shorter (favorable) TTR (Fig. 5A, 0.013). This was also true compared to those with the “TT” genotype (Fig. 5B, 0.007, “GG” vs “TT”).
In summary, in HBsAg-negative or anti-HCV-positive patients, the “GG” genotype effectively predicted shorter OS in patients with advanced HCC treated with sorafenib but not lenvatinib. Conversely, in patients treated with lenvatinib, the “GG” genotype was associated with a favorable TTR. Therefore, it is recommended to choose lenvatinib over sorafenib when using targeted agents to treat advanced HCC in “GG” genotype patients.
Discussion
In the present study, we sought to identify the subgroup of patients for whom the GALNT14-rs9679162 “GG” genotype could effectively predict the therapeutic outcome of sorafenib. First, as in our previous study (including treatment-naïve patients), patients with advanced HCC with the GALNT14-rs9679162 “GG” genotype were not significantly associated with OS, compared to “non-GG” (“GT” “TT”) genotype patients (Fig. 1A; all patients were included in the analysis) [22]. However, subsequent subgroup analysis showed that GALNT14-rs9679162 “GG” could effectively predict OS in some specific subgroups, especially for anti-HCV-positive, or HBsAg-negative subgroups (Figs 1B–I and 2). Notably, most of our real-world patients with HCC had already received other anticancer therapies before sorafenib administration (Table 1). Therefore, we believe that the GALNT14-rs9679162 “GG” genotype is a useful genetic marker for patients with advanced HCC treated with sorafenib, especially in countries where HBV is not a major cause of HCC, regardless of previous treatments. For patients with the GALNT14-rs9679162 “GG” genotype, alternative treatment regimens such as immunotherapy or other second-line therapy should be considered.
Before the advent of immunotherapy, sorafenib was the gold standard treatment for the first-line therapy of patients with advanced HCC with vascular invasion and/or extrahepatic metastases [7, 8]. In a large-scale global prospective observational registration study of 3202 patients with HCC, Child-Pugh A patients had longer median OS (13.6 months) than Child-Pugh B patients (5.2 months) and Child-Pugh C patients (2.6 months) in an intent-to-treat analysis [32]. Among the various components of the Child-Pugh score, albumin, ascites and bilirubin levels have important prognostic values for OS. A recent meta-analysis including four randomized controlled trials and 26 cohort studies ( 8678) showed that the median OS was 7.2 months for the entire cohort, 8.8 months for Child-Pugh A patients, and 4.6 months for Child-Pugh B patients. Multivariate meta-regression analysis revealed a significant negative correlation between OS and patients with an ECOG performance status of 2 ( 0.04) and Child-Pugh B ( 0.001) [32]. In our real-world cohort study ( 298), although Child-Pugh score remained significant in univariate analysis ( 0.002, Table 2), Child-Pugh stage/grade was not a significant predictor ( 0.096). Additionally, multivariate analysis showed that HBsAg-positive, ascites, initial metastasis, lower albumin, shorter prothrombin time, higher AST, and higher PALBI grade, but not the Child-Pugh score, were significantly associated with shorter OS. Thus, in our patients, the Child-Pugh score was not considered a good predictor of OS, while the PALBI seemed to be a better indicator. To validate this finding, a plausible approach is to determine the pre-treatment Child-Pugh and PALBI scores and follow the final outcomes of the patients.
The level of GALNT14 has previously been shown to be upregulated in HCC tissues derived from BCLC stage B patients [9]. Here we found that in tissues from patients with BCLC stage A, GALNT14 expression was also significantly increased in cancerous tissues and may contribute to partial sorafenib resistance in HCC cells (Fig. 4A–C). IHC-stained tissues were further stratified into two groups based on HBV infection, and GALNT14 expression was not elevated in cancerous parts of HBV-related HCC tissues (Figs 4D and E). This observation may be explained by the trans-suppression effect of HBx on the GALNT14 promoter, albeit the detailed mechanism remains to be investigated. Previous studies have shown that the GALNT14-rs9679162 genotypes were associated with tissue levels of GALNT14 in at least two cancers (HCC and pancreatic cancer), with the “GG” genotype being associated with higher expression of GALNT14 in HCC [9, 33]. This study further demonstrated that the presence of HBx affected the activity of the GALNT14 promoter, thereby reducing the expression of GALNT14 in HCC cells. By analyzing the sequence of the GALNT14 promoter, we found that an NF-kappaB (NFB) binding site is located in the promoter of GALNT14 (Fig. S7). HBx has previously been shown to activate NFB activity in HCC cells [34]. However, NFB activation may act as a transcriptional activator or repressor of certain genes [35]. Thus, it is possible that HBx can induce the activity of NFB, which in turn inhibits the activity of the GALNT14 promoter, thereby reducing the expression of GALNT14 in HCC cells. Although the underlying mechanism is unclear, the fact that HBx perturbs GALNT14 expression in HCC cancerous tissues may explain why the GALNT14-rs9679162 “GG” genotype did not predict clinical outcomes in patients with HBV-related HCC treated with sorafenib.
An important question regarding the outcome prediction of the GALNT14-rs9679162 genotype is why the GALNT14-rs9679162 “GG” genotype can predict shorter OS, but not PFS and TTR, in patients with advanced HCC receiving sorafenib. One proposed explanation is that the “GG” genotype is associated with lower level of cFLIP-S, an anti-apoptotic protein implicated in chemoresistance [9], and higher level of GALNT14 in HCC which may contribute resistance to sorafenib (Fig. 4C), thereby promoting cancer growth [36]. This difference can result in a shorter OS. However, in real-world practice, when HCC begins to progress during treatment of sorafenib, patients are usually managed with add-on (or switch to) other therapies such as radiotherapy or proton therapy. This additional treatment would reduce/eliminate differences in PFS and TTR when calculated by mRECIST criteria. Nevertheless, patients with the “GG” genotype had a shorter OS because this additional treatment may also impair liver function.
Finally, we examined the predictive value of the GALNT14-rs9679162 “GG” genotype in patients treated with lenvatinib. However, unfortunately, no significant association of OS and PFS was found in any defined subgroups (Figs S3–6). Despite a small sample size of lenvatinib-treated patients ( 52), we found that the “GG” genotype was associated with a favorable TTR in these patients using the combined criteria of mRECIST and reduction in AFP (Fig. 5). The ORR for lenvatinib in the REFLECT trial was 40.6%. However, in our case, it was only 32.7% (Table 3). This difference may be due to the different clinical characteristics of the patients enrolled in these studies. For example, lenvatinib was the first-line therapy (treatment naïve) for patients in the REFLECT trial, but those who had previously received other anti-cancer therapies (the real-world practice) were enrolled in the present study. The patients we recruited also had numerically different characteristics, such as higher Child-Pugh scores (only 1% had Child-Pugh classes B in REFLECT trial, while 32.7% of our patients had Child-Pugh class B and C). Additionally, there were differences in clinical stage between these studies; in REFLECT trial, only 78% were BCLC stage C, whereas all of our patients had BCLC stage C. These differences may result in lower ORR.
The difference in correlations of results for the GALNT14-rs9679162 genotype between patients receiving sorafenib and lenvatinib may be due to a variety of reasons. First, according to the REFLECT trial, the two drugs have different ORRs: lenvatinib was 40.6% and sorafenib was only 12.4%, meaning that although they are both TKIs, their working mechanism or efficacy are not completely identical. Second, from this perspective, the two TKIs have different molecular targets and efficacies. Sorafenib targets RAF/MEK/ERK, vascular endothelial growth factor receptors (VEGFRs), and platelet-derived growth factor receptor (PDGFR-), while lenvatinib mainly modulated VEGFRs, PDGFR-, fibroblast growth factor receptor 1-4 (FGFR 1-4), KIT and rearrangement during transfection (RET) activities [37, 38]. The differences between these two TKIs suggest that their potency and/or precise molecular targets may differ. These differences may further lead to different outcome predictions for the GALNT14-rs9679162 genotypes.
The current study has limitations, including the retrospective nature, limited sample size (particularly in the lenvatinib group), lack of detailed mechanistic studies and limitation to the Taiwanese cohorts. Despite these shortcomings, our findings may still provide useful information for deciding which TKI to use in real-world clinical practice.
In conclusion, we found that the GALNT14-rs9679162 “GG” genotype was a valid predictor of shorter OS in patients with advanced HCC with HBsAg-negative or anti-HCV-positive treated with sorafenib, but not in patients treated with lenvatinib. Conversely, the “GG” genotype was associated with a shorter/favorable TTR in patients treated with lenvatinib.
Author contributions
Conception: C.-L.L., R.-N.C., Y.-D.C. and C.-T.Y.
Interpretation or analysis of data: C.-L.L., Y.-D.C., L.-W.C. and C.-T.Y.
Preparation of the manuscript: C.-L.L., Y.-D.C. and C.-T.Y.
Revision for important intellectual content: C.-L.L., Y.-D.C. and C.-T.Y.
Supervision: C.-L.L. and C.-T.Y.
Supplementary data
The supplementary files are available to download from http://dx.doi.org/10.3233/CBM-220042.
sj-docx-1-cbm-10.3233_CBM-220042.docx - Supplemental material
The authors would like to thanks Ms. Yu-Ru Liang, Mei-Ling Tsao, Yu-Chiao Chuang and Chung-In Wu in Liver Research Center, Chang Gung Memorial Hospital. This research was funded by grants from Chang Gung Memorial Hospital Linkou and Keelung branches, Taiwan, grant numbers CMRPG2J0011, CRRPG2H0042, CRRPG2H0082, CLRPG2J0051, CMRPG2K0081.
Conflict of interest
The authors declare that there is no any potential conflict of interest.
References
1.
FitzmauriceC. et al., Global, regional, and national cancer incidence, mortality, years of life lost, years lived with disability, and disability-adjusted life-years for 32 cancer groups, 1990 to 2015: A systematic analysis for the global burden of disease study, JAMA Oncology3 (2017), 524–548.
2.
YangJ.D. et al., A global view of hepatocellular carcinoma: Trends, risk, prevention and management, Nature Review Gastroenterology & Hepatology16 (2019), 589–604.
3.
KulikL. and El-SeragH.B., Epidemiology and management of hepatocellular carcinoma, Gastroenterology156 (2019), 477–491.e1.
4.
PerzJ.F. et al., The contributions of hepatitis B virus and hepatitis C virus infections to cirrhosis and primary liver cancer worldwide, Journal of Hepatology45 (2006), 529–538.
5.
ParkJ.W. et al., Global patterns of hepatocellular carcinoma management from diagnosis to death: The BRIDGE study, Liver International35 (2015), 2155–2166.
6.
HuangP.H. et al., The defective allele of aldehyde dehydrogenase 2 gene is associated with favorable postoperative prognosis in hepatocellular carcinoma, Journal of Cancer10 (2019), 5735–5743.
7.
MarreroJ.A. et al., Diagnosis, staging, and management of hepatocellular carcinoma: 2018 practice guidance by the american association for the study of liver diseases, Hepatology68 (2018), 723–750.
8.
OmataM. et al., Asia-Pacific clinical practice guidelines on the management of hepatocellular carcinoma: A 2017 update, Hepatology International11 (2017), 317–370.
9.
LiangK.H. et al., GALNT14 genotype effectively predicts the therapeutic response in unresectable hepatocellular carcinoma treated with transcatheter arterial chemoembolization, Pharmacogenomics17 (2016), 353–366.
10.
LinC.L. et al., Significant renoprotective effect of telbivudine during preemptive antiviral therapy in advanced liver cancer patients receiving cisplatin-based chemotherapy: A case-control study, Scandinavian Journal of Gastroenterology49 (2014), 1456–1464.
11.
YehC.T. et al., Retrospective comparison between a regular and a split-dose protocol of 5-fluorouracil, cisplatin, and mitoxantrone for the treatment of far advanced hepatocellular carcinoma, BMC Cancer11 (2011), 117.
12.
LlovetJ.M. et al., Sorafenib in advanced hepatocellular carcinoma, The New England Journal of Medicine359 (2008), 378–390.
13.
ChengA.L. et al., Efficacy and safety of sorafenib in patients in the Asia-Pacific region with advanced hepatocellular carcinoma: A phase III randomised, double-blind, placebo-controlled trial, Lancet Oncology10 (2009), 25–34.
14.
KudoM. et al., Lenvatinib versus sorafenib in first-line treatment of patients with unresectable hepatocellular carcinoma: A randomised phase 3 non-inferiority trial, The Lancet391 (2018), 1163–1173.
15.
KimS. et al., Lenvatinib is independently associated with the reduced risk of progressive disease when compared with sorafenib in patients with advanced hepatocellular carcinoma, Journal of Gastroenterology & Hepatology36 (2021), 1317–1325.
16.
YehC.T. et al., A single nucleotide polymorphism on the GALNT14 gene as an effective predictor of response to chemotherapy in advanced hepatocellular carcinoma, International Journal of Cancer134 (2014), 1214–1224.
17.
LiangK.H.LinC.C. and YehC.T., GALNT14 SNP as a potential predictor of response to combination chemotherapy using 5-FU, mitoxantrone and cisplatin in advanced HCC, Pharmacogenomics12 (2011), 1061–1073.
18.
LinW.R. et al., GALNT14 genotype, alpha-fetoprotein and therapeutic side effects predict post-chemotherapy survival in patients with advanced hepatocellular carcinoma, Molecular and Clinical Oncology2 (2014), 630–640.
19.
LiangK.H.YangP.C. and YehC.T., Genotyping the GALNT14 gene by joint analysis of two linked single nucleotide polymorphisms using liver tissues for clinical and geographical comparisons, Oncology Letters8 (2014), 2215–2220.
20.
LinW.R. et al., Combinations of single nucleotide polymorphisms WWOX-rs13338697, GALNT14-rs9679162 and rs6025211 effectively stratify outcomes of chemotherapy in advanced hepatocellular carcinoma, Asia-Pacific Journal of Clinical Oncology14 (2018), e54–e63.
21.
LiangK.H. et al., GALNT14 genotype is associated with perineural invasion, lymph node metastasis and overall survival in resected cholangiocarcinoma, Oncology Letters13 (2017), 4215–4223.
22.
LinC.C. et al., A GALNT14 rs9679162 genotype-guided therapeutic strategy for advanced hepatocellular carcinoma: Systemic or hepatic arterial infusion chemotherapy, Pharmacogenomics Journal20 (2020), 57–68.
23.
WaiC.T. et al., A simple noninvasive index can predict both significant fibrosis and cirrhosis in patients with chronic hepatitis C, Hepatology38 (2003), 518–526.
24.
JohnsonP.J. et al., Assessment of liver function in patients with hepatocellular carcinoma: A new evidence-based approach-the ALBI grade, Journal of Clinical Oncology33 (2015), 550–558.
25.
SterlingR.K. et al., Development of a simple noninvasive index to predict significant fibrosis in patients with HIV/HCV coinfection, Hepatology43 (2006), 1317–1325.
26.
LaiQ. et al., Alpha-fetoprotein and modified response evaluation criteria in solid tumors progression after locoregional therapy as predictors of hepatocellular cancer recurrence and death after transplantation, Liver Transplantation19 (2013), 1108–1118.
27.
SanchezA.I.P. et al., Value of alpha-fetoprotein as an early biomarker for treatment response to sorafenib therapy in advanced hepatocellular carcinoma, Oncology Letters15 (2018), 8863–8870.
28.
ZhangY.Q. et al., Comparison of alpha-fetoprotein criteria and modified response evaluation criteria in solid tumors for the prediction of overall survival of patients with hepatocellular carcinoma after transarterial chemoembolization, Journal of Vascular and Interventional Radiology29 (2018), 1654–1661.
29.
LinC.L. et al., Hepatitis B virus X gene mutants emerge during antiviral therapy and increase cccDNA levels to compensate for replication suppression, Hepatology International14 (2020), 973–984.
30.
LinC.L.ChuY.D. and YehC.T., Emergence of Oncogenic-Enhancing Hepatitis B Virus X Gene Mutants in Patients Receiving Suboptimal Entecavir Treatment, Hepatology69 (2019), 2292–2296.
31.
ChuY.D. et al., COX5B-Mediated Bioenergetic Alteration Regulates Tumor Growth and Migration by Modulating AMPK-UHMK1-ERK Cascade in Hepatoma, Cancers12 (2020), 1646.
32.
MarreroJ.A. et al., Observational registry of sorafenib use in clinical practice across Child-Pugh subgroups: The GIDEON study, Journal of Hepatology65 (2016), 1140–1147.
33.
LinW.R. and YehC.T., GALNT14: An emerging marker capable of predicting therapeutic outcomes in multiple cancers, International Journal of Molecular Science21 (2020), 1491.
34.
SuF. and SchneiderR.J., Hepatitis B virus HBx protein activates transcription factor NF-kappaB by acting on multiple cytoplasmic inhibitors of rel-related proteins, Journal of Virology70 (1996), 4558–4566.
35.
Datta DeD. et al., NF-kappaB mediated transcriptional repression of acid modifying hormone gastrin, PloS one8 (2013), e73409.
36.
SongK.H. et al., GALNT14 promotes lung-specific breast cancer metastasis by modulating self-renewal and interaction with the lung microenvironment, Nature Communications7 (2016), p13796..
37.
WilhelmS.M. et al., BAY 43-9006 Exhibits Broad Spectrum Oral Antitumor Activity and Targets the RAF/MEK/ERK Pathway and Receptor Tyrosine Kinases Involved in Tumor Progression and Angiogenesis, Cancer Research64 (2004), 7099–7109.
38.
TohyamaO. et al., Antitumor Activity of Lenvatinib (E7080): An Angiogenesis Inhibitor That Targets Multiple Receptor Tyrosine Kinases in Preclinical Human Thyroid Cancer Models, Journal of Thyroid Research2014 (2014), p.638747.