
Abstract
BACKGROUND:
Acute myeloid leukemia (AML) is a malignant disorder of hematopoietic stem and progenitor cells, characterized by accumulation of immature blasts in the bone marrow and peripheral blood of affected patients. Response to chemotherapy treatment in patients with AML is wide-ranging, and to date there are no adequate molecular biomarkers used to predict clinical outcome.
OBJECTIVE:
The aim of this study was to identify potential protein biomarkers which could help predict response to induction treatment in AML patients.
METHODS:
Peripheral blood samples were obtained from 15 AML patients both before and after treatment. A comparative proteomic analysis was performed using 2D gel electrophoresis followed by Mass Spectrometry.
RESULTS:
This comparative proteomic study, combined with a protein network analysis, revealed several proteins that could be considered potential biomarkers of poor prognosis in AML: GAPDH which favors increased glucose metabolism; eEF1A1 and Annexin A1 that promote proliferation and migration, cofilin 1 which plays a role in the activation of apoptosis; and GSTP1 which is involved in the processes of detoxification and chemoresistance.
CONCLUSIONS:
This study gives an insight into a panel of protein biomarkers with prognostic potential that should be further investigated.
Keywords
Introduction
Acute myeloid leukemia (AML) is a malignant disorder of hematopoietic stem and progenitor cells, which results in the build-up of immature blasts in the bone marrow and eventually in the peripheral blood of affected patients. There is enormous genetic heterogeneity within defined AML subsets, with many gene mutations identified [1], which means AML is still a disease with a very variable prognosis. Current clinical guidelines in AML recognize three prognostic groups: favorable, intermediate, and poor risk, based on cytogenetic abnormalities and/or gene mutations [2]. Patients in the favorable-risk group have a complete remission rate of over 90%, and overall survival of 60%, while those in the poor-risk group have a disease-free survival and overall survival ranging between 5 and 15%, which is largely due to a high treatment resistance rate during induction chemotherapy. Most AML patients fall within the intermediate risk group (those with a normal karyotype); however, for these patients the outcome of treatment is very heterogeneous.
Accurately assessing patient’s prognosis is very important for clinical management of the disease, which is why there are several prognostic factors such as age, performance status at diagnosis, platelet count, serum creatinine or albumin that are considered by the clinician when deciding the course of treatment [3]. However, the patient’s cytogenetic profile is currently the strongest prognostic factor; for example, a complex karyotype, monosomy 5 or 7, t(6;9), inv(3) or 11q changes other than t(9;11) have all been associated with a significantly lower response to treatment and overall survival (OS) [4].
It is clear that genetic studies are very valuable; however, isolated from a context in which thousands of proteins mediate cellular function, this prognostic model is not complete. In this study we compared the protein profiles of peripheral blood mononuclear cells (PBMC) taken from patients with AML at time of diagnosis and after induction treatment, with the aim of identifying potential prognostic protein biomarkers in terms of response to treatment. As there are currently very few proteomic studies in the literature regarding AML, and less so that focus on prognosis, this study gives an insight into a panel of protein biomarkers with prognostic potential that could be further investigated.
Materials and methods
Experimental subjects
Peripheral blood was obtained from 15 newly diagnosed patients with de novo AML, at Hospital Manuel Uribe Angel, Colombia, between 2015–2017. The disease was diagnosed based on morphology, cytochemical staining, and immunophenotypic analysis. Two blood samples were taken from each patient: at time of diagnosis (before the start of chemotherapy), and once again after the completion of the first round of induction therapy, which was typically 2–3 weeks after induction or when medullary aplasia was resolved. Patients included in the study did not have neutropenic fever at the time of the first blood draw. This study was reviewed and approved both by the Instituto Tecnologico Metropolitano’s Ethics Committee (6 June 2014) and the Hospital Manuel Uribe Angel Ethics Committee (17 April 2015). Written informed consent was appropriately obtained from all patients, and international as well as institutional guidelines were complied with, specifically The Code of Ethics of the World Medical Association (Declaration of Helsinki), printed in the British Medical Journal (18 July 1964).
Complete remission (CR) was defined by the presence of
Isolation of PBMCs and protein extraction
All blood samples were processed the same day of collection. PBMCs were isolated from peripheral blood by standard density gradient centrifugation with Ficoll Histopaque
2D electrophoresis
Proteins (50
Image analysis and 2DE gel comparison
Gel images were analyzed and compared using the PDQuest Advanced 2-D Software (BioRad). The protein spots in each gel image were detected and then the images within each group of patients were matched to create synthetic images containing the spot data from all the gels in the match set, so synthetic images were obtained for CR before treatment, CR after treatment, PR before treatment, PR after treatment, Res before treatment, Res after treatment, and Death. After automated matching, spot alignment was improved by manual spot detection and matching, using some common spots as landmarks to align the images. The spot intensities were normalized to equalize the total densities of each gel image using the Local Regression Model. Normalized protein spot volumes in the proteomes were then compared among experimental groups, according to the response to induction therapy. The 2DE proteomes before and after treatment were clustered in subgroups to identify differentially expressed spots: (a) comparison of protein expression between CR before and after treatment; (b) comparison between PR (c) Res and (d) death during induction.
Parametric test analyses were performed with bootstrapping, which is a resampling method that provides a critical adjusted p-value, controlling for a type I error (false positive), reducing over-fit bias, and validating the accuracy estimates. We performed all the analyses to identify differentially expressed proteins based on 1000 bootstrap samples. In all analyses, the confidence interval (CI) was 95% and p values less than 0.05 were considered as significant. For protein identification by mass spectrometry, we filtered out significant spots with a fold change below 1.5-fold in density.
To analyze intragroup variability, the Correlation Coefficient and Coefficient of Variation were determined for each gel in the match set. Lastly, scatter plot analysis was performed to calculate the linear dependency between the spot values of one gel in comparison to another.
Mass spectrometry
For mass spectrometry (MS), protein samples were pooled, and 300
Protein network analysis
A protein-protein interaction (PPI) network was constructed using the 6 proteins identified by MS as associated with unfavorable prognosis, using databases STRING (Search Tool for the Retrieval of Interacting Genes/Proteins) [5] and BioGRID (Biological General Repository) for Interaction Datasets [6]. Cytoscape 3.2.1 [7] was used to perform the topological analysis of the PPI network under default parameters. The three main topological parameters analyzed were: connectivity degree (
Results
Clinical characteristics of patients
For this study, 15 patients diagnosed with de novo AML were recruited. Of these patients, six achieved complete remission, three had a partial response, three were resistant to therapy, and three died during induction. For the last group of patients, it was only possible to analyze samples taken before treatment started. There were four cases of Acute Promyelocytic Leukemia (APL) (patients 1, 2, 13 and 14), two cases treated with the PETHEMA protocol (patients 1 and 2), one case treated with the FLUGA protocol (patient 10), and the remaining patients were treated with the 7
Clinical characteristics of patients included in the study
Clinical characteristics of patients included in the study
% Blasts(i): Percentage of initial blasts – before treatment. % Blasts(f): Percentage of final blasts – after treatment. “–”: no data available.
Spots detected in PBMC proteomes before and after treatment
CV: coefficient of variation. CC: coefficient of correlation.
We analyzed the proteome of 15 AML samples: 6 with complete response, 3 with partial response, 3 with resistance and 3 who died during induction. Analysis of 2DE images revealed an average of 201,8 spots before treatment and 160,1 spots after treatment, distributed within a pI range of 3–10 and molecular weight between 10–110 kDa, as seen in Fig. 1 and Table 2. Samples from patients with CR exhibited the greatest number of spots (both before and after treatment) compared with PR, Res and death, which could be due to the high number of blasts present in these patients. In all groups we observed high intragroup variability, due in part to normal interindividual variability within the population, as well as to the different clinical characteristics of patients within a group (see Table 1) and the small sample size.
Representative gel images.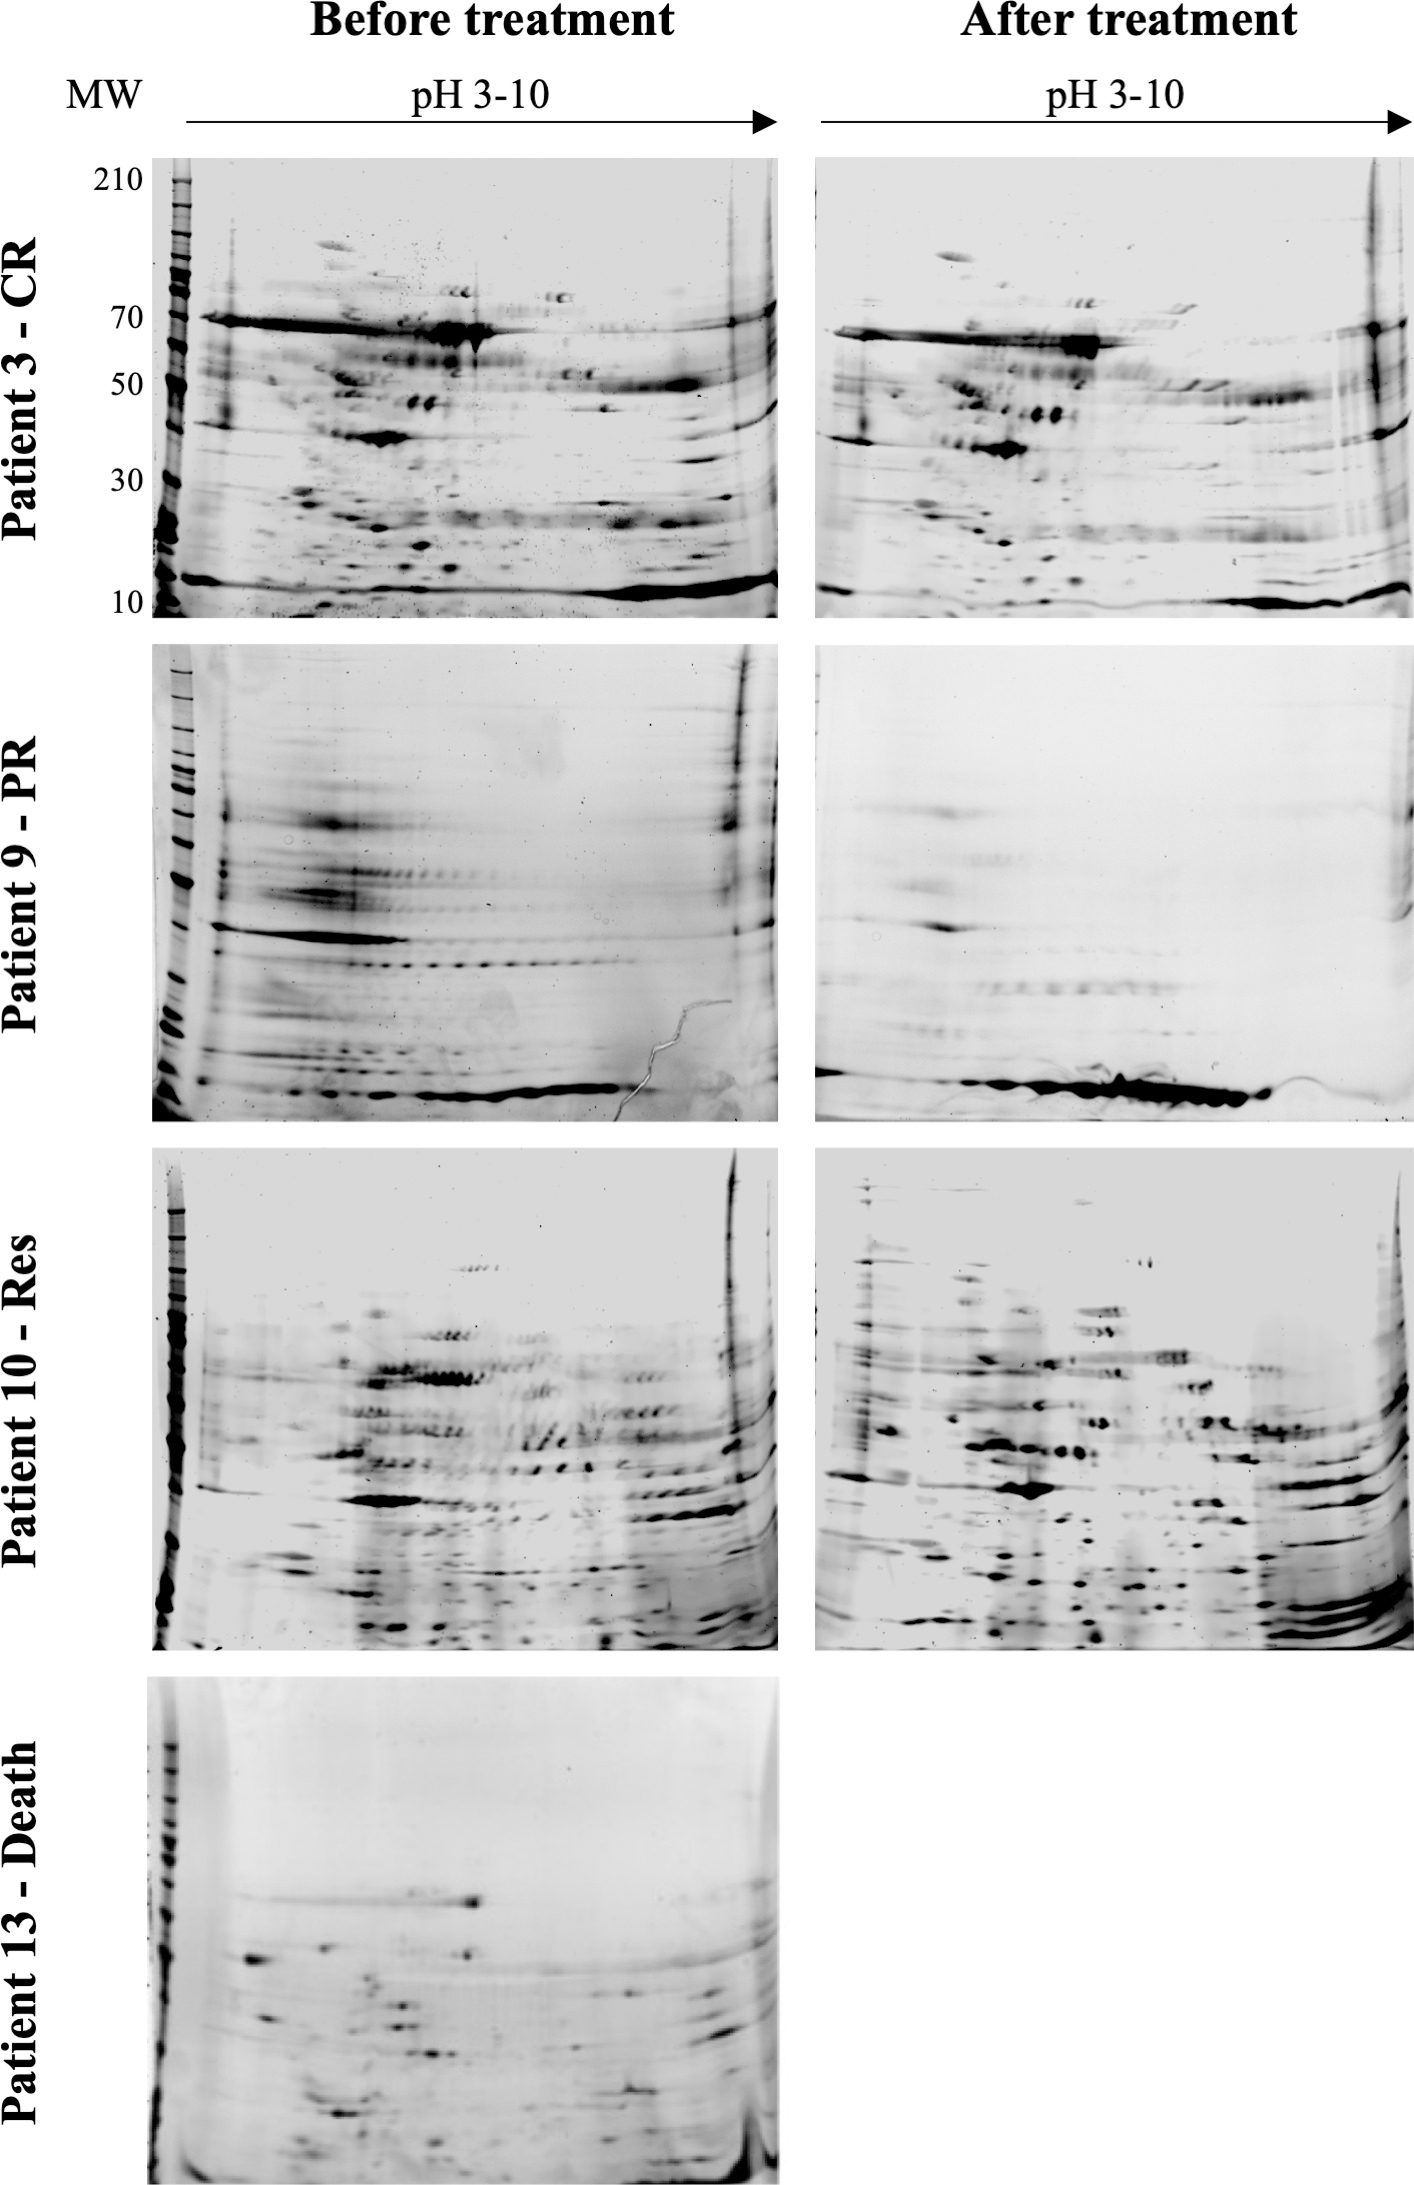
The proteomic profiles of the four patient groups were subsequently analyzed for differentially expressed protein spots.
A total of 27 2DE images were analyzed with PDQuest: 15 images before treatment and 12 after treatment. The comparison of spots between groups, both before and after treatment, by paired T-test and Mann-Whitney U test, revealed 37 spots that were significantly (
These 37 spots were analyzed by nanoHPLC-QTOF mass spectrometry to determine their identity and following a Mascot database search using the acquired MS data, 30 spots were identified; however, some of these proteins were identified more than once and we excluded extracellular (fibrinogen) and contaminant proteins (apoliprotein AI, hemoglobin subunit beta and keratin type II) so in total 17 proteins of interest were identified. The following 12 proteins identified were significantly associated with favorable prognosis: ATP synthase
Proteins in the backbone network of unfavorable prognosis
Proteins in the backbone network of unfavorable prognosis
BC: betweenness centrality.
Backbone network of unfavorable prognosis. BC: betweenness centrality. 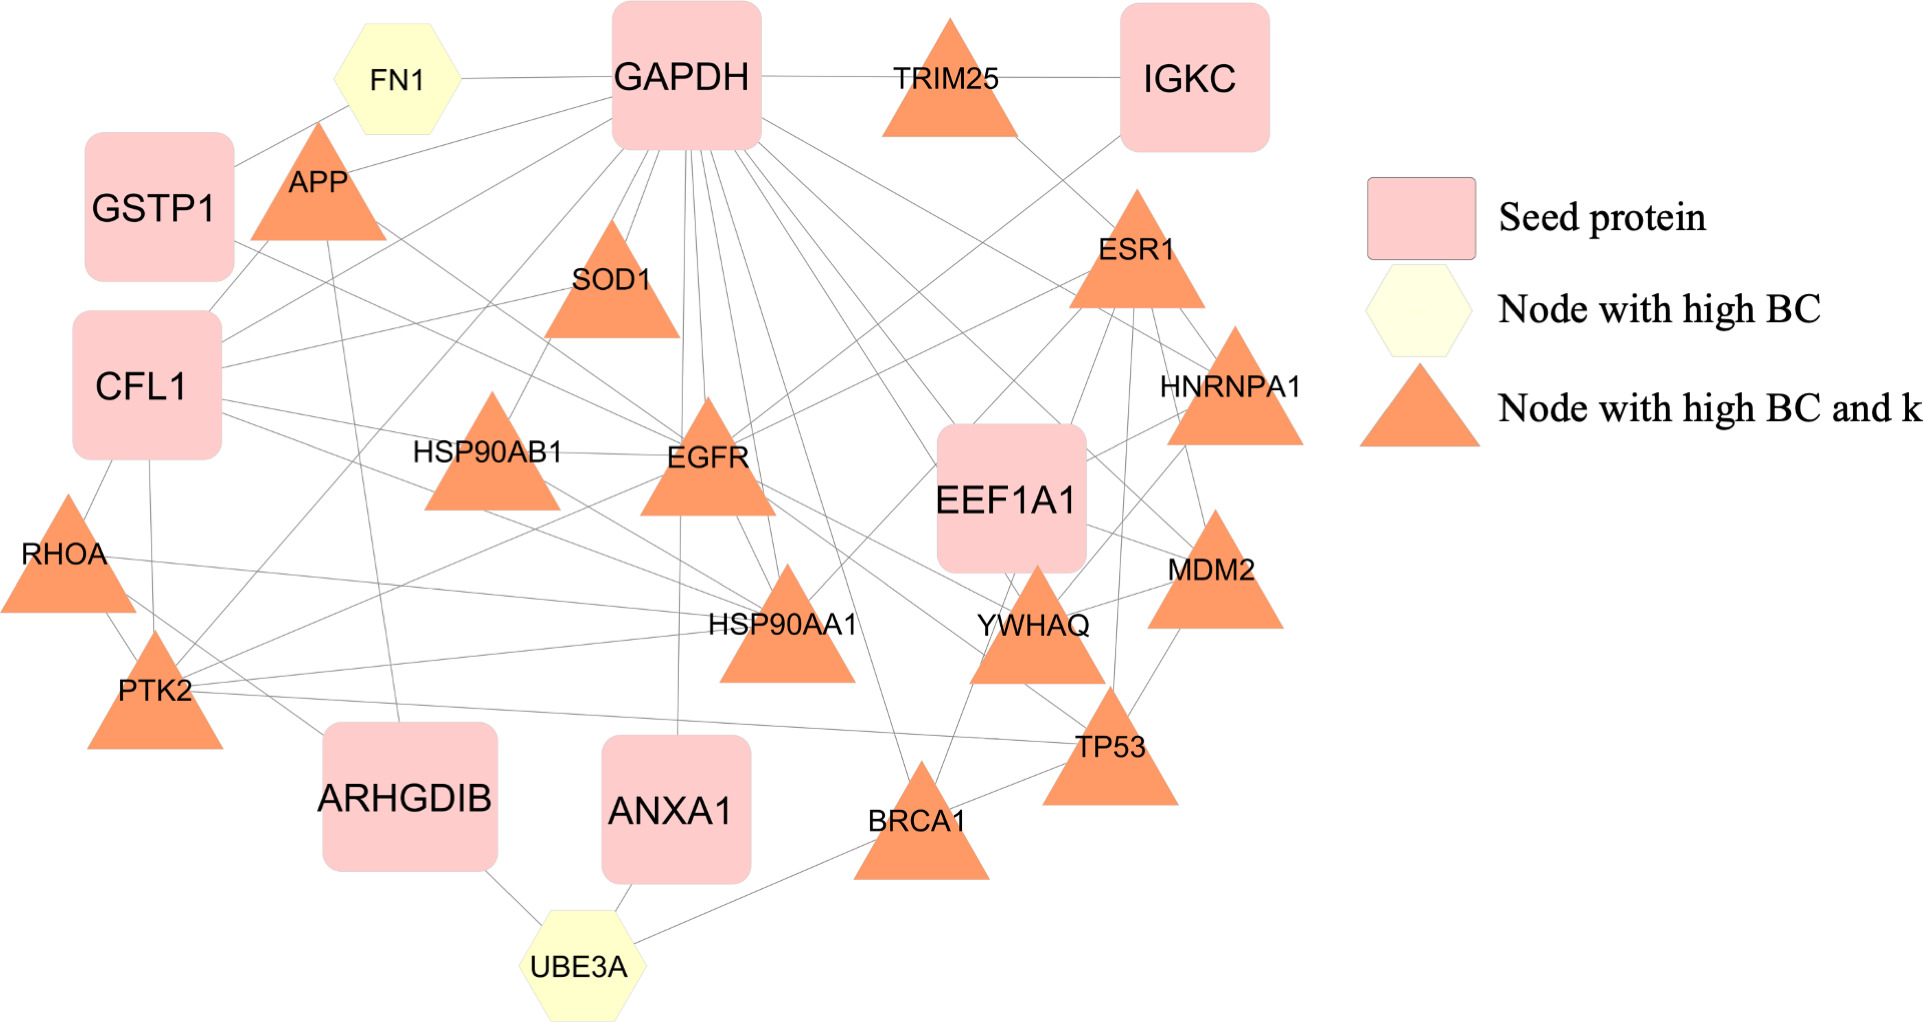
This study had two cases treated with PETHEMA, one treated with FLUGA, and the remaining patients were treated with the 7
The PPI network was constructed with 6 seed proteins associated with unfavorable prognosis in AML patients. This network was found to have 458 nodes and connected by 1.899 edges (Supplementary Fig. S1). The proteins in the network were classified into four categories according to their
Of this main network we retrieved the proteins within the top 5% highest BC (23 protein nodes and 54 edges) to construct a backbone network. Of the 23 nodes comprising the backbone network, GAPDH is the hub-bottleneck node and has 15 primary nodes, including 4 seed proteins (eEF1A1, CFL1, SOD1, ANXA1) (see Fig. 2). The nodes with the highest
Discussion
In this study, the comparative proteomic analysis of AML patients with differing response to treatment, led to the identification of 12 proteins associated with favorable prognosis and 6 proteins associated with unfavorable prognosis. As protein-protein interaction networks help in understanding the functional relevance of expressed proteins, we implemented this strategy to further analyze the proteins related to poor treatment response. Both in the main and backbone networks constructed, two proteins of interest stood out: GAPDH and eEF1A1; while the backbone network also highlighted proteins ANXA1, CFL1, and GSTP1.
GAPDH was identified as the central node in both the main and the backbone networks. Interestingly, in the proteomic analysis, GAPDH was identified in both favorable (isoforms 25 kDa pI 7.1 and 7.8) and unfavorable prognosis (isoforms 40 kDa pI 6.8, 6.9 and 7.8) patient groups suggesting that the different isoforms of GAPDH have a multifunctional role favoring both mechanisms. In a study published in 2009, GAPD was purified from normal leukocytes of healthy subjects and leukocytes of patients with chronic myeloid leukemia (CML) showing that GAPDH from CML patients was distinctly different from GAPDH in healthy volunteers [8]. The most notable difference was in terms of molecular weight and subunit composition, as GAPDH from healthy sources was found to be a homotetramer with a molecular mass of 140 kDa, while GAPDH from leukemic leukocytes was a heterodimer of approximately 87 kDa. This could be an explanation as to why we identified several GAPDH isoforms in both favorable and unfavorable prognosis.
GAPDH is an essential enzyme of the glycolytic pathway. One of the well-known features of cancer cells is the increase in glucose metabolism, which actively contributes to an increase in cell proliferation. Therefore, our finding of increased expression of GAPDH in patients with unfavorable diagnosis is logical. A study using the transgenic mouse model of non-Hodgkin’s lymphoma revealed that an increase in GAPDH expression, but not in other glycolytic enzymes, was associated to tumor aggressiveness (increased growth and vascularization) [9]. This was confirmed in patients with diffuse large B-cell lymphoma, where 7 out of 13 patients presented elevated GAPDH expression at time of diagnosis. GAPDH was found to enhance the transcription of hypoxia-inducing factor-1
It is worth noting that GAPDH has other intracellular functions and locations within the cell. A key study reported that GAPDH accumulation in the mitochondria contributes to mitochondrial membrane permeabilization prior to apoptosis [11], which could also explain why we found increased levels of two isoforms of GAPDH in patients with a favorable response to treatment.
In our analysis, at time of diagnosis high levels of expression of eEF1A1 were found in the three patients who died and only in one patient of the RES group; however, in both protein networks that were constructed eEF1A1 was one of the central nodes. This protein is involved in the GTP-dependent binding of aminoacyl-tRNA to the ribosomes during protein biosynthesis. Until recently, there were not any reports into the prognostic significance of this protein in AML. However, a study published in 2020 [12] showed that in AML cell lines eEF1A1 promotes proliferation and migration, and inhibits apoptosis, which are well-known features of malignancy. Another study, published in 2021, which investigated prognostic markers for pediatric AML patients reported that eEF1A1 is associated with poor prognosis [13], and as such it could be considered as a novel strategy in AML treatment. These reports support our findings.
Annexin A1(ANXA1), was another of the proteins of interest in the protein network analysis, and we found it to be overexpressed in patients with unfavorable prognosis. The role of ANXA1 in cancer prognosis is rather unclear, in some cases, it has been reported that ANXA1 overexpression increases cell proliferation, migration and invasion [14, 15] due to the constitutive activation of the NF
Another protein of interest is cofilin 1, which we found to be notably increased in patients with an unfavorable prognosis. CFL1 is an actin regulatory protein that in its active form (unphosphorylated) causes depolymerization of F-actin to the G-actin form which translocates to mitochondria promoting the release of cytochrome c, and the activation of caspases, culminating with the activation of apoptosis [18, 19]. Overexpression of cofilin has been reported in multiple cancer types and is associated with a poor prognosis (malignant phenotype and metastasis) [20]. This is logical for solid tumors, as cofilin regulates cytoskeletal reorganization promoting tumor cell migration; however, recently cofilin has also been flagged as a protein of interested in leukemia. In a human leukemia cell line, it was shown that silencing cofilin 1 notably reduces cell proliferation [21], while gene expression analysis of 180 patients with chronic lymphocytic leukemia showed upregulation of cofilin1 expression in these patients, compared to healthy controls.
The last protein of interest that shall be discussed is GSTP1. Glutathione S-transferases (GSTs) are a family of enzymes which play a role in processes of detoxification, and as such has been reported to be of interest in several types of cancer, such as breast and prostate cancer. In terms of treatment response, in breast cancer cells it has been reported that overexpression of GSTP1 causes chemoresistance, while silencing this protein has the opposite effect (reduces chemoresistance) [22]. In patients with chronic myeloid leukemia this is also the case [23], thus supporting our result of increased GSTP1 expression in AML patients who did not respond to treatment.
This study is one of the first to report how protein expression changes before and after induction treatment in different AML patient groups; however, it is not without limitations.
This study is limited by the high interindividual variability within the AML population due to different AML subtypes, karyotypes and gene mutations. The French-American British (FAB) classification system has classified AML patients into subtypes (M0–M7) based on the type of cell the leukemia develops from and how mature the cells are. Particularly, Acute Promyelocytic Leukemia (APL) is a unique subtype of AML, classified as the M3 subtype, of which there were four cases included in this study. The genetic hallmark of APL is the fusion PML-RAR
The enormous genetic heterogeneity within defined AML subsets means that AML is still a disease with a very variable prognosis. A large percentage of AML patients have a normal karyotype, and as such fall within the intermediate risk group. For these patients the outcome of treatment is very heterogeneous; however, molecular markers such as FLT3, NPM1 and CEBPA have been found to improve risk stratification in this patient group and have already been incorporated into clinical practice in many countries. However, this is not the case in Colombia, so details of these molecular markers were absent from the study as they were not included in the routine clinical workup.
Lastly, it is important to note that due to the lack of a validation cohort, the proposed biomarkers are prognostic in nature rather than predictive.
Conclusions
This comparative proteomic study, combined with a protein network analysis, revealed several proteins that could be considered potential biomarkers of poor prognosis in AML: GAPDH which favors increased glucose metabolism; eEF1A1 and Annexin A1 that promote proliferation and migration, cofilin 1 which plays a role in the activation of apoptosis; and GSTP1 which is involved in the processes of detoxification and chemoresistance. This study gives an insight into a panel of protein biomarkers with prognostic potential that bares further investigation, as there are not many studies in the literature that focus on prognosis in AML.
Author contributions
Author contributions are as follows.
Conception: JPA, SR.
Interpretation or analysis of data: LRR, JPA, EC, SR.
Preparation of the manuscript: LRR, JPA, SR.
Revision for important intellectual content: LRR, JPA, EC, SR.
Supervision: SR.
Supplementary data
The supplementary files are available to download from http://dx.doi.org/10.3233/CBM-210540.
sj-docx-1-cbm-10.3233_CBM-210540.docx - Supplemental material
Supplemental material, sj-docx-1-cbm-10.3233_CBM-210540.docx
Footnotes
Acknowledgments
The authors gratefully acknowledge the support received by the Instituto Tecnológico Metropolitano (Project Code: P17215) and by Minciencias (Project Code: 115065743926). The authors would also like to thank the E.S.E. Hospital Manuel Uribe Angel, Colombia.