
Abstract
BACKGROUND:
HER2, ER, PR, and ERBB2 play a vital role in treating breast cancer. These are significant predictive and prognosis biomarkers of breast cancer.
OBJECTIVE:
We aim to obtain a unique biomarker-specific prediction on overall survival to know their survival and death risk.
METHODS:
Survival analysis is performed on classified data using Classification and Regression Tree (CART) analysis. Hazard ratio and Confidence Interval are computed using MLE and the Bayesian approach with the CPH model for univariate and multivariable illustrations. Validation of CART is executed with the Brier score, and accuracy and sensitivity are obtained using the k-nn classifier.
RESULTS:
Utilizing CART analysis, the cut-off value of continuous-valued biomarkers HER2, ER, PR, and ERBB2 are obtained as 14.707, 8.128, 13.153, and 6.884, respectively. Brier score of CART is 0.16 towards validation of methodology. Survival analysis gives a demonstration of the survival estimates with significant statistical strategies.
CONCLUSIONS:
Patients with breast cancer are at low risk of death, whose HER2 value is below its cut-off value, and ER, PR, and ERBB2 values are greater than their cut-off values. This comparison is with the patient having the opposite side of these cut-off values for the same biomarkers.
Introduction
Currently, breast cancer has become the leading cause of death among women, with most diagnosed malignancies between them [1, 2]. According to GLOBOCAN 2020, estimated new cases were 2,261,419 (24.5% of all new women cancer cases) and 684,996 new deaths (15.5% of all new women cancer deaths) of breast cancer in 2020 worldwide [1]. In 2020, the age-standardized rate (ASR) for incidence and mortality is estimated to be 47.8 and 13.6 respectively per 1,00,000 population for breast cancer worldwide [1]. Nearly one out of four cancer cases in women found to be breast cancer universally [3]. In developed countries like the US, the rates of invasive breast cancer have increased by 0.3% per year between 2007 to 2016. However, the death rate decreased by 1.3% per year between 2013 and 2017 [4]. The treatment choices for breast cancer are surgery, radiation, chemotherapy, targeted therapy, hormone therapy, immunotherapy (e.g., Checkpoint inhibitors), etc. [4]. There are many treatment strategies for breast cancer, but there are still so many deaths. The biomarker-specific pathological strategy may provide promising success in breast cancer and can reduce death rates.
Human Epidermal growth factor Receptor 2 (HER2), Estrogen Receptor (ER), Progesterone Receptor (PR), and ERBB2 are the prominent biomarkers of breast cancer [5]. Existing treatments for breast cancer, when the cell has the receptors for estrogen-positive (ER+) and progesterone positive (PR+), are more likely to respond to the hormonal therapy than the tumor is ER- or PR- [6]. Approximately 75% of breast cancer are found to be ER+ [7], and 65% to 75% are found to be PR+ [8]. Tamoxifen and Raloxifene have been in use since previous years to prevent breast cancer. These hormonal therapies are used for women at high risk of breast cancer [9]. Recently, aromatase inhibitors (e.g., Anastrozole, Exemestane, and Letrozole) are used to prevent the advanced ER+ breast cancer type [9]. If the protein asset is found hormone receptor-negative, then hormonal therapy is not going to work. In that case, it can be treated along with chemotherapy, surgery, or radiation therapy. Treatment of the ER- type of breast cancer patients can be done by kinase inhibitors specific [10]. Approximately 20% of breast cancer are found to be with HER2 receptors, and it is found to be faster spreading and aggressive than other types of breast cancer [11]. It is categorized in HER2+, HER2- and HER2 borderline (HER2B). A special drug for the treatment of breast cancer of type HER2 is called targeted therapies [12]. Some of the targeted drugs used for type HER2+, such as trastuzumab (Herceptin), have been shown positive response to decreasing the risk of breast cancer reappearance [13]. When this medication is given with chemotherapy after surgery, it becomes standard treatment for breast cancer [14]. Patients with triple-negative breast cancer and who have the PD-L1 protein can be diagnosed with chemotherapy drug nab-paclitaxel with checkpoint inhibitor Atezolizumab [15].
There are many scopes for more treatments and a declining mortality rate. Biomarker-specific treatments also exist; nevertheless, we are not getting the outcome as expected. As the scenario of biomarkers is characteristic, it varies from one geographical location to another geographical location [16]. So, we need to have an integrated study on biomarkers to know the risk of disease with the continuous value of biomarkers HER2, ER, PR, and ERBB2. In this article, we made an integrated analysis on overall survival (OS) of breast cancer patients by performing classification on biomarkers HER2, ER, PR, and ERBB2. Knowing the risk level of any disease is the first step towards the treatment of any disease, which this study does. We provide descriptions of the cut-off value of biomarkers for fast survival estimation of breast cancer patients.
In the article [17], the Bayesian approach has been performed to find a classification tree using CART analysis. This article is the motivation of the depicted paper. Here, we first made a classification on integrated breast cancer data using CART, which is biomarker specific, making it unique. Then we performed classical (MLE) and Bayesian approaches on classified data for predicting survival estimates to know the chances to survive and death risk due to variation in values of biomarkers of breast cancer. Similarly, this methodology can also be applied for any other disease to know their biomarker-specific fast prediction on survival.
The purpose of this article is to obtain the optimal threshold value for four prominent biomarkers, HER2, ER, PR, and ERBB2, of breast cancer, with continuous values of biomarkers (predictor variable) and categorical response variable to make a conclusion on OS. This article is designed as section ‘Introduction’ gives a brief outline about breast cancer, its biomarker specific treatments, and methodology motivation. All information about data material, study design, and performed methodology with validation techniques are described in section ‘Material and methods’. Section ‘Results’ contains all the numerical estimates obtained from performed methodology and its interpretation. Effects of numerical results and discussion about methodologies have been included in section ‘Conclusion’.
Flowchart for selection of data to make study on overall survival.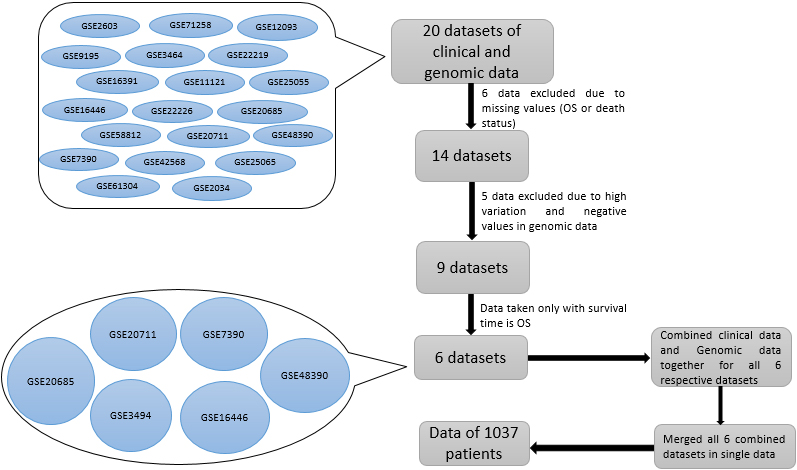
Material and study design
We studied overall survival for breast cancer patients using datasets of clinical data and continuous-valued genomic data. The flowchart for the selection of the studied six datasets, meeting our criteria, is illustrated in Fig. 1. These 6 independent datasets (GSE3494, GSE7390, GSE16446, GSE20685, GSE20711 and GSE48390) together include 1037 unique breast cancer patients. Dataset GSE3494 (236) is collected in Uppsala (Sweden) from 1 January 1987 to 31 December 1989 and published on the PNAS website and approved by Karolinska Institute, Stockholm, Sweden [18]. Gene expression data GSE7390 (198) is taken from [19]. Diagnosis duration of patients was 1980 to 1998, and validation of data was done at all six clinical centers where data is seen [19] by two independent auditors. Dataset GSE16446 (107) is taken from [20], in which microarray data profiles were assessed using pre-epirubicin biopsies, and validation was done with MDACC 2003-0321 neoadjuvant trials. Dataset GSE20685 (327) is accessed from [21] with a diagnosis period 1991 to 2004 at the Koo Foundation Sun-Yat-Sen Cancer Center (KFSYSCC). Dataset GSE20711 (88) is taken from [22] and available at Infinium Methylation Platform to find the profile of breast tumors at single-CpG resolution. Dataset GSE48390 (81) is taken from [23], and the diagnosis duration was January 2007 to December 2010 for breast cancer patients from Taiwan. These six datasets are taken from different sources on homogenous breast cancer patients and taken from microarray experiments and were performed on a similar platform and direction. These datasets can be downloaded from
In this article, we are going to provide a methodology to make a conclusion on OS for breast cancer patients. All these 6 data are combined in a single data of 1037 patients to be meta-analyzed. Here some conversions have been made like the unit of survival time (overall survival) in all six independent data, converted into a single unit ‘day’ whether it was in the day, month or year. Overall survival, time to relapse, last follow-up, follow-up duration, and survival time all have been written in a single notation OS. For the event status, one indicates the occurrence of certain death status, and zero is for living or censored-biological accession ID. Reference of biomarkers into genomic data are 216836_s_at for HER2, 205225_at for ER, 219197_s_at for PR, and 203497_at for ERBB2.
Breast cancer varies from one geographical location to another geographical location [16]. Studied microarray data comes from different geographical locations while all have the same scenarios and same study type. So, we should expect a complete integrated study, which will have representation from different locations to give an overall survival estimate about the actual scenario of different biomarkers HER2, ER, PR and ERBB2. We made a classification study on it. We represented our work through CART analysis towards detecting the threshold values for biomarkers HER2, ER, PR, and ERBB2. From CART analysis, we are getting the cut-off value of all four biomarkers (predictor variable) HER2, ER, PR, and ERBB2 on overall survival for better and faster breast cancer treatment. Further studies are made on classified data with Cox proportional hazard (CPH) model for estimating the estimates (Hazard Ratio, Confidence Interval, and
A similar strategy we performed to make the validation on CART analysis on training data. As an arbitrary choice of 85% data, we selected from the entire dataset of 1037 sample size as training data for CART analysis towards validation of our methodology. The cut-off value obtained from the training data, we used to classify the testing data of sample size 157(15%). We also generated a Brier score of testing data to check the accuracy of the methodology in terms of risk or mean squared error. The Brier score is obtained with R software using packages ‘DescTools’.
Methods
CART is used in this study to obtain a threshold value of biomarkers using R. CART is preferred as it does not require making any hypothesis for the distribution of the predictor variable. It is suitable for highly skewed or multi-model data (numerical) and is an optimal tree-building technique [24]. The model used here to perform CART analysis is the regression model, in which covariates are considered as biomarkers, and the outcome was an event (death). Model trees were preferred to create classification on predictor variables. CART is chosen because we want to have the binary classification for our continuous predictor variables in the data.
After performing CART analysis, the study is done on classified data. Parameters have been estimated using the CPH model. Cox regression analysis (CRA) is based on the CPH model. The robust nature of the CPH model permits us to find survival function estimates for the unknown parameter using the correct parametric model. With it, we obtain MLE of unknown parameters with asymptotic deliberation [25]. Inferences of MLE depend on the likelihood of the data. The Cox regression model is most commonly used in regression models, as it does not require any hypothesis or assumptions regarding the nature or shape of the distribution [26]. CPH model is executed in this study to make a comparison among biomarkers HER2, ER, PR, and ERBB2 on OS. The performance of these biomarkers is analyzed by Hazard Ratio (HR), Confidence Interval (CI), and p-value.
Hazard function H(t) is expressed by
where
The Hazard ratio for two covariate vectors
Hazard ratio quantifies the degree of difference between the groups. The event’s occurrence (i.e., risk) increases if
Measures of efficiency
TP: True Positive, TN: True Negative, FP: False Positive, FN: False Negative.
In addition, the receiver operating characteristic (ROC) curve is prepared to measure the accuracy of created classification. Predictions obtained by Bayesian survival analysis (BSA) have very little bias and standard error than the Cox regression analysis (CRA), whether the sample size is large or small [27]. BSA uses the Bayesian method of estimation, in which inferences are exact. The Bayesian approach for estimation is based on prior information and new knowledge from the experimental (observed) data [28]. Bayesian analysis is mainly used for informative and non-informative prior. Informative prior is based on earlier experience, studies, or expert views, which are not conquered by likelihood, used to find posterior distribution. In some cases, when prior information is unavailable, non-informative prior density is used, which is conquered by the likelihood function. It has the minimal influence on posterior distribution [29, 30], and improper posterior can be obtained with it [29]. We have used two ways of estimation, MLE and Bayesian, to estimate the parameters. Prior information plays a vital role in Bayesian survival analysis. Here, regression coefficients are the parameters in the CPH model, in which prior distribution is taken as normal. The Markov Chain Monte Carlo (MCMC) method has used the parameter with posterior density. For estimating the parameters using the Bayesian approach, we have used function ‘survMC’ from the package ‘SurviMChd’ with 10000 iterations, which provides survival estimates using the CPH model with MCMC.
MCMC method is used in multi-dimensional data for the solution or explanation of sampling distribution. Monte Carlo is used for sampling (randomly) a probability distribution to estimate the parameters, whereas Markov chain is a systematic method for generating the sequence of random variables, in which the current variable is generated using a prior variable. In this article, it has been used to update the information about the parameter to be estimated by taking the sample from posterior density. Using MCMC, many samples can be generated from posterior density, and it is used to estimate the study of characteristics by taking its expectation. MCMC has many applications in statistics. For example, the Gibbs sampler is a powerful simulation technique, and it is a method of MCMC.
Risk prediction of the methodology is one of the key tasks. Brier score (BS) is used in this article to validate the accuracy of the classification model using its testing data. This illustrates validation in terms of mean squared error between predicted probabilities and expected values. The expression to calculate the Brier score is
where
Classification tree for Overall Survival (OS) and death on overall data.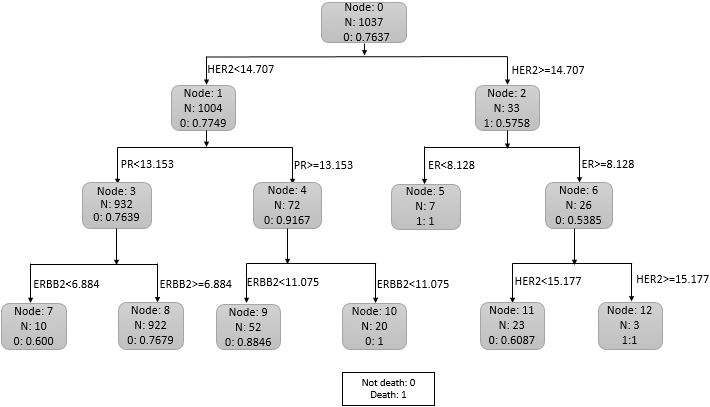
Recently, boosting has been used as an optimization technique to estimate the potentially high-dimensional models, whether additive or linear [31, 32, 33]. There is a ‘mboost’ (model-based boosting) package in R software for statistical modeling to minimize the empirical risk function
Boosting algorithm is based on the functional gradient descent (FGD) algorithm. It can be implemented on the Cox model using the negative gradient of the partial likelihood by
which yields population minimizer
After performing classification on data, its efficiency can be measured by accuracy rate, sensitivity, and specificity. These measures can be described in terms of true positive rate, false-positive rate, true negative rate, and false-negative rate. It is shown in Table 1.
In this article, an integrated study has been done on 1037 unique breast cancer patients. Flow chart for selection and integration of six datasets (GSE3494, GSE7390, GSE16446, GSE20685, GSE20711 and GSE48390) is shown in Fig. 1. We represented our work to make predictions on OS by detecting the cut-off value of biomarkers by performing classification CART analysis on an integrated dataset. Obtained cut-off values for prominent biomarkers HER2, ER, PR and ERBB2 are 14.707, 8.128, 13.153, and 6.884, respectively. Figure 2 shows that HER2 is the node that splits initially, and hence HER2 is the stronger predictor than the other three biomarkers. ROC curve has been obtained to measure the accuracy of the model in CART analysis, which provides the AUC value of 0.82 (shown in Fig. 3). It is relatively high.
ROC curve for Overall Survival (OS) and death on 85% training data.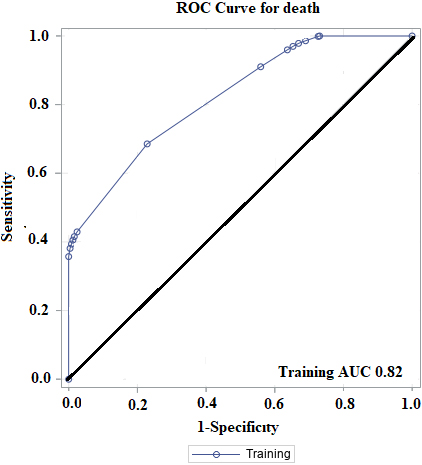
We found that from the dataset of 1037 patients (Fig. 2), 226(22.51%) out of 1004 patients whose
Estimates using MLE and Bayesian for univariate and multivariable
Accuracy and sensitivity for different
After performing CART analysis, estimates of parameters are obtained by the maximum likelihood method and Bayesian approach on classified data using the CPH model (shown in Table 2). Estimates using the Bayesian approach for all co-variates together (in multivariable) is HR (95% CI) of HER2 on death: 3.0 (1.63, 4.40). It shows, whose
Performed a similar strategy on training data to make the validation on CART analysis. Training data is a random selection of 880 (85%) sample size of the entire data of 1037 patients. Obtained threshold value (or cut-off value) for biomarkers HER2, ER, PR and ERBB2 are 14.993, 5.063, 13.153, and 11.152, respectively, using CART analysis on training data towards validating our methodology. It shows a significant difference between the entire dataset and the training dataset, and the cut-off value looks quite impressive. Finally, the cut-off value obtained by training data is used to classify testing data (15% of 1037 patients). We applied the Brier score prediction on classified testing data, and its representation of prediction error is shown in Fig. 4. Brier score provides an accuracy of binary prediction. The Brier score of death in testing data is 0.16, which shows the accuracy of our methodology, which is relatively high.
Representation of prediction error for Brier score.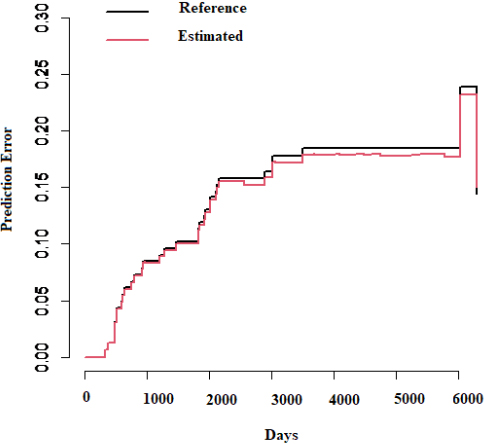
The ‘mboost’ package is present in R software to estimate the parameters using bootstrap, k-fold cross-validation and subsampling technique. We have used boosting for cross-validation on training data to know the partial contribution of biomarkers HER2, ER, PR and ERRBB2 in breast cancer patients using the Cox model with the linear predictor. Representation of the partial effect of biomarkers is shown in Fig. 5.
Partial contribution of biomarkers on breast cancer patients.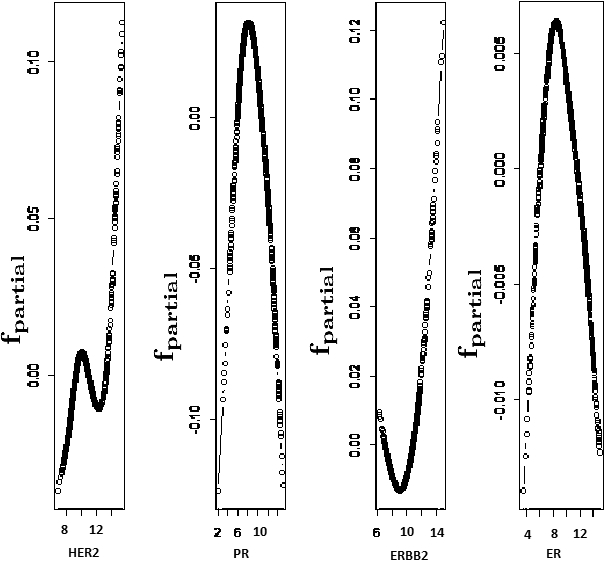
The efficiency of CART is measured by accuracy and sensitivity (correct measurement for risk) using the K-nn classifier in R software with package ‘caret’. Sensitivity describes the probability of correct estimation about the occurrence of the event of patients above or below the cut-off value of biomarkers HER2, ER, PR and ERBB2. Suppose
Variation of error with K.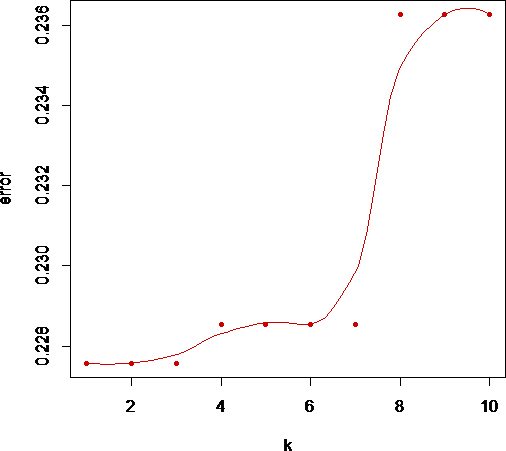
This study presented numerical threshold (or cutoff) values for biomarkers HER2, ER, PR, and ERBB2 by performing CART analysis on the integrated dataset. It also shows HER2 is robust biomarker than others.
CART models are flexible approach for specifying the conditional distribution of response variable given a multivariable vector of predictor variables. It uses the binary tree with a greedy algorithm that makes recursive partitioning in predictor variable space into subsets of it, and it results as the distribution of response variable become more homogeneous. Initially, the classification tree grows large and then prunes the tree that has the minimum error of cross-validation estimate. CART has become widely popular in the statistical field after Breiman, Friedman, Olshen, and Stone [35]. Brown [36] provided a linear programming solution for the linear split of predictor variables in CART by stochastic search. The Bayesian approach is used to find the CART models [17]. Oliver and Hand [37] delivered an experimental comparison of various pruning and Bayesian model methods based on CART. Application of CART is demonstrated to know the novel prognostic factor, the impact of the clinical variable on survival, and interaction between covariates [38].
On classified data based on CART, the comparison has been made on OS with MLE using the Cox model, and the Bayesian approach as BSA shows better results than CRA [27]. Here we observe that patients with breast cancer are at low risk of death, whose HER2 value is below its cut-off value, and ER, PR, and ERBB2 values are greater than their cut-off values. This comparison is with the patient having the opposite side of these cut-off values for the same biomarkers. Observation shows that HR (as it decreases, the death risk decreases with it) decreases to HER2, ER, PR, and ERBB2 in respective order when they exceed their cut-off values. It is consistent for both univariate and multivariable cases with MLE and the Bayesian approach. Brier score is used to verify the skill of probability forecasts for binary outcomes [39]. Here we have used and evaluated the Brier score to validate our methodology. It shows, the performed technique is relatively high. Another algorithm, ‘boosting’, we performed on the same data, which is completely independent of the CART analysis. The partial effect or contribution (partial likelihood estimate) of biomarkers HER2, ER, PR, and ERBB2 in the data on death, indicates the non-linearity. In this work, we have provided the result based on the integrated study on six different datasets belonging to six different-different geographical locations. Hence efficiently, this methodology works on any similar breast cancer data with same model for the same prominent biomarkers HER2, ER, PR, and ERBB2. The intention of this work is not to compare one study to another. The purpose is to integrate and create comprehensive results from different studies to get a holistic idea.
Footnotes
Acknowledgments
The authors are deeply indebted to the editor-in-chief Prof. Sudhir Srivastava and learned reviewers for their valuable comments leading to improving the contents and presentation of the original manuscript.
Authors’ contributions
Conception: GKV and AB.
Interpretation or analysis of data: PK.
Preparation of the manuscript: AB and PK.
Revision for important intellectual content: GKV.
Supervision: GKV and AB.