Investigating aberrant tumor-specific methylation in plasma cell-free DNA provides a promising and noninvasive biomarker for cancer detection.
OBJECTIVE:
We aimed to investigate methylation status of some promoter regions in the plasma and tumor tissues to find biomarkers for early detection of colorectal cancer.
METHODS:
This case-control study on seventy colorectal cancer patients and fifty matched healthy controls used Methylation-Specific High-Resolution Melting Curve analysis to evaluate the methylation of the selected promoter regions in converted genomic tissue DNA and plasma cfDNA.
RESULTS:
The methylation levels in selected regions of SPG20 (24375 to 24680, 24209 to 24399, and 23625 to 23883), SNCA (807 to 1013, 7 to 162, and 180 to 7), FBN1 (223 to 429, 1 to 245, and 18 to 175), ITF2 (296 to 436 and 180 to 55), SEPT9 (914412 to 91590 and 99083 to 92264), and MLH1 (13 to 22) were significantly higher in tumor tissues compared with normal adjacent tissues. The methylation levels of FBN1, ITF2, SNCA, and SPG20 promoters were significantly higher in the patient’s plasma compared to patient’s normal tissue and plasma of healthy control subjects. FBN1, SPG20, and SEPT9 promoter methylation had a good diagnostic performance for discriminating CRC tissues from normal adjacent tissues (AUC 0.8). A panel of SPG20, FBN1, and SEPT9 methylation had a higher diagnostic value than that of any single biomarker and other panels in tissue-based assay (AUC 0.9). The methylation of FBN1(a) and SPG20(a) regions, as the closest region to the first coding sequence (CDS), had a good diagnostic performance in plasma cfDNA (AUC 0.8) while a panel consisted of FBN1(a) and SPG20(a) regions showed excellent diagnostic performance for CRC detection in plasma cfDNA (AUC 0.9).
CONCLUSION:
Methylation of FBN1(a) and SPG20(a) promoter regions in the plasma cfDNA can be an excellent simple, non-invasive blood-based test for early detection of CRC.
Colorectal cancer (CRC) is the third leading cause of cancer-related death in the world. CRC death rate is increasing 1.3% every year in individuals under 50 years who are suffering from advanced stages of the disease [1, 2]. More than 1.9 million new cases of colorectal cancer (CRC) and 935,000 CRC-related deaths were estimated to occur in 2020, representing about one in 10 cancer-related diagnosis and deaths [3]. It is expected that the burden of colorectal cancer will be increased to more than 2.2 million new cases and 1.1 million new deaths by 2030 [4]. Early detection of CRC can improve clinical management and decrease its mortality rate. Colonoscopy is the gold standard screening procedure. However, it is invasive, expensive, and uncomfortable for many patients [5]. Also, the early-stage lesions may not be detected by colonoscopy, as a result of either polyp morphology or failure to be visualized in the entire colon [6]. Current non-invasive stool-based screening tests such as FOBT and FIT showed lower sensitivity for tumors either in the proximal colon or early-stages [7, 8].
Sporadic colorectal cancer is a somatic genetic disease accounting for 75% of all CRC cases [9]. Accumulative epigenetic changes in DNA are among the main drivers of carcinogenesis in sporadic CRCs. Aberrant CpG island methylations in the promoter regions are key elements of epigenetic alterations that induce transcriptional silencing [10]. Hyper-methylation of tumor suppressor genes appears during the initiation and progression phases of tumorigenesis, suggesting its utility as a good biomarker for either early detection or monitoring the progression of tumors [11]. The methylation status could be analyzed in circulating cell-free DNA (cfDNA) of the plasma which is also called liquid biopsy. Liquid biopsy can be considered a non-invasive, cost-effective, and feasible method for screening large populations [12]. Due to intra-tumoral heterogeneity, single-site biopsy sampling could not provide a true profile of genetic and epigenetic changes in the tumor, whereas liquid biopsy is representative of cfDNA from multiple sites of tumor. Therefore, tumor heterogeneity can be captured more accurately by liquid biopsy. However, despite numerous studies, translating the plasma cfDNA methylation biomarkers into clinical practice has been slow and inadequate [13]. The stool can be studied for cfDNA of tumors in the colon hence it may not lead to precise results due to different amounts of bacteria, fungus, and other microorganisms in addition to free DNA of other parts of the gastrointestinal tract leading to a mixture of heterogeneous DNA [14]. Moreover, the compliance of patients for stool-based tests is less than blood test. One study has shown that 78% of the participants preferred the blood test to the stool-based test for the screening of colorectal cancer [15].
Different genes can be selected as the biomarker. SEPT9 is a member of the Septin family. Septins play important roles in many cellular processes including scaffolding, cell membrane rigidity, cell polarization, and membrane diffusion barrier functions. Alterations in the Septin expression are associated with different types of cancer. SEPT9 gene is reported to be methylated in colon cancer tissue compared with normal tissue. As a result, methylated SEPT9 has been used as a biomarker for colon cancer [16, 17, 18]. FBN1 gene encodes fibrillin-1, a major structural component of the elastin-associated microfibrils. This protein is essential for protein assembly and the formation of a functional extracellular matrix. Fibrillin-containing microfibrils are sensed by transmembrane receptors influencing the shape of cells and homeostasis. FBN1 gene is considered a negative regulator of cell growth and angiogenesis [19, 20, 21]. SPG20 gene encodes Spartin as a multifunctional protein that is involved in the intracellular epidermal growth factor receptor trafficking. Spartin protein also plays role in the cytokinesis [22, 23, 24]. RUNX3 is a member of the Runt-related gene family encoding a DNA-binding transcription factor playing roles in cell growth and differentiation [25, 26, 27]. SNCA gene encodes synuclein alpha which is a key component of Lewy bodies found in Parkinson’s disease. Studies showed that DNA methylation of the SNCA decreased the expression of this gene in the colon cancer cell line [28, 29]. MLH1 gene is one of the components of the mismatch repair (MMR) system. Defects in MLH1 are associated with Microsatellite Instability (MSI) observed in the Lynch Syndrome and sporadic types of CRC. Hypermethylation of MLH1 promoter is likely a common cause of inactivation of this mismatch repair gene in sporadic cases of tumors, therefore, detecting methylation of this gene may help to distinguish sporadic cases of CRC from hereditary ones [30, 31, 32]. ITF2 gene encodes transcription factor 4, a basic helix-loop-helix protein showing dimerization with other classes of bHLH proteins regulating tissue-specific expression of different genes. This gene is a tumor supperssor gene which can induce cell cycle arrest. Transcriptional silencing of ITF2 by DNA methylation has been reported in CRC tissues [33, 34, 35].
In this study, we selected eighteen promoter regions of the above-mentioned tumor suppressor genes from a large number of candidate genes which have been previously studied in the stool or tumor tissues of CRC patients [28, 33, 36]. We aimed to evaluate the value of studying the plasma cfDNA methylation status of SPG20, FBN1, SNCA, ITF2, RUNX3, MLH1, and SEPT9 promoters as noninvasive blood-based assays for detection of colorectal cancer.
Materials and methods
Study population
This case-control study was done on seventy patients and fifty matched healthy controls. This study was approved in Ethical Committee of Pasteur Institute of Iran, Ethical code: IR.PII.REC.1398.055 (2017), in accordance with the relevant guidelines and regulations. All patients and healthy volunteers signed the informed consent before donating blood or tissue samples. Patients who underwent curative surgery or colonoscopy in the Division of Colorectal Surgery, Department of Surgery (Imam Khomeini Hospital Complex, Tehran, Iran) and Cancer Institute of Iran (Imam Khomeini Hospital Complex, Tehran, Iran) between August 2017 and June 2018 were enrolled in this study. The inclusion criteria were patients diagnosed with primary colorectal cancer or colorectal adenoma by colonoscopy which were confirmed by histopathology findings. The exclusion criteria were patients with known hereditary colorectal cancer syndrome (FAP and HNPCC) and inflammatory bowel disease (Crohn’s Disease or Ulcerative Colitis). Fifty controls were selected from the general population and matched to the cases according to their age and gender. A questionnaire of risk factors and previous colonoscopy history was used to select the control group. All individuals were asked to complete the questionnaire using in personal interview with a fixed interviewer. Twenty-Five (50%) of the participants were reported to be free of any tumor or polyp or any pathological finding in the colonoscopy examination while the remaining volunteers had not undergone colonoscopy during the last 5 years but they confirmed that they had no signs and symptoms of any colorectal disease. The exclusion criteria for the healthy control group were a personal history of cancer, systemic diseases, intestinal inflammatory disease, smoking, alcohol consumption, and a family history of colorectal cancer. Power analysis showed that a sample size of 70 is associated with the power 0.8 (more precisely, 1- beta 1 – 0.2) to reject a wrong model with an amount of alpha 0.05.
Seventy pairs of fresh tumor tissue and adjacent normal tissue samples were collected from patients. Proximal and distal resection margins for colorectal cancer should be at least 5 cm. During the operation, the histopathological examination of the margin confirmed that the resection were complete, tumor-free, and clear. Normal adjacent tissues were resected at least 20 cm from tumor margin which was definitely free of tumor. The surgically resected tissue samples were immediately snap-frozen in liquid nitrogen and stored at 70C in the laboratory until further processing. Before preparation for surgery, 4 ml of peripheral blood samples was collected in K2EDTA Vacuette tubes which were immediately transferred to the laboratory for plasma extraction. Blood samples (4 ml) were also obtained from 50 healthy volunteers as a control for plasma samples.
The sequence of primers for studying the methylation of eighteen selected promoter regions in seven genes by MS-HRM
Gene
Locus
Forward primer
Reverse primer
Ta C
Number of CpG
Amplicon position
SPG20
a
TTAAGGTTGGGTAGTTTTTTGTAA
TAAATTATAAATAAAACCAACCTC
59
14
24375 to 24680
b
TAATTTGGATTGTTAGGATGG
ACAAAAAAAAACTACAACCTTA
59
9
24209 to 24399
c
GAGTGGGTAATTTAGTTTG
AACTCCACTCCTTACACTAA
60
41
23625 to 23883
FBN1
a
AGGGTAGATAGGGATTGG
CCCACTCTCAACCTACCCTC
63
17
223 to 429
b
GATATTAAGAGGTGGGAAAG
ACCCCAATCCCTATCCCTACC
63
29
1 to 245
c
GTGGAAGGAGGATGGG
CCCTCCTTTCCCCACCTCT
63
9
18 to 175
SNCA
a
AGGAGGAGTTAATAGGTGG
CAAACA AACAAACCCAAATA
57
14
807 to 1013
b
GATTAGAAGGTTTAAGAGAG
AATACACTCCCAATTCC
59
18
7 to 162
c
GGTTGGAGTTTGGTTTAT
CCTTCTTAAACCCCTTCTAC
56
15
180 to 7
ITF2
a
TTAGGTTTTGGTTGTGTGTT
AAAAAAAAAAATATCTCTTCTAA
54
56
414 to 739
b
GAGTTTTTATTTATTTTTGT TGA
CAAACACAACCAAAATCCCA
58
6
296 to 436
c
TAAAAGAGGGGAGAAAGTATGT
CCCTCATCTT TCTTTCTCTTACT
63
8
180 to 55
RUNX3
a
GTAGTAGTAGGGGAAAAAAGAGA
CCACCCAACCCTAAACTATTATA
63
9
256 to 523
b
GAGTTTGGGTTGTTAAGGGT
TCTTTTTTCCCCTACTACTA
57
9
33 to 279
c
GAGGTAGTTATAAGATTTTAAAAG
CCTTAACAAAACCCAAACTC
60
13
274 to 13
DNA extraction and sodium bisulfite modification of DNA
Tissue DNA was extracted using DNeasy Blood & Tissue Kit (Cat No: 69504; Qiagen, the Netherlands) according to the manufacturer’s protocol. Plasma was isolated by Ficoll (Cat No: L0560-100; Biowest) separation technique. Thereafter, plasma cfDNA was extracted using NORGEN Plasma/Serum Cell-Free Circulating DNA Purification Midi Kit (Cat No: 55600; Canada) according to the manufacture’s protocol. Plasma/Serum Cell-Free Circulating DNA Purification Mini Kit (Cat No: 55100; Canada) was used for plasma volume less than 250 L. The purity and quantity of DNA were measured using a NanoDrop spectrophotometer, and then DNA was stored at 20C for further analysis. Genomic DNA and cfDNA samples were treated by “EZ DNA Methylation-Gold Kit” (Cat No: D5006, Zymo Research) according to the manufacturer’s protocol. The bisulfite converted DNA samples were stored at 20C until usage.
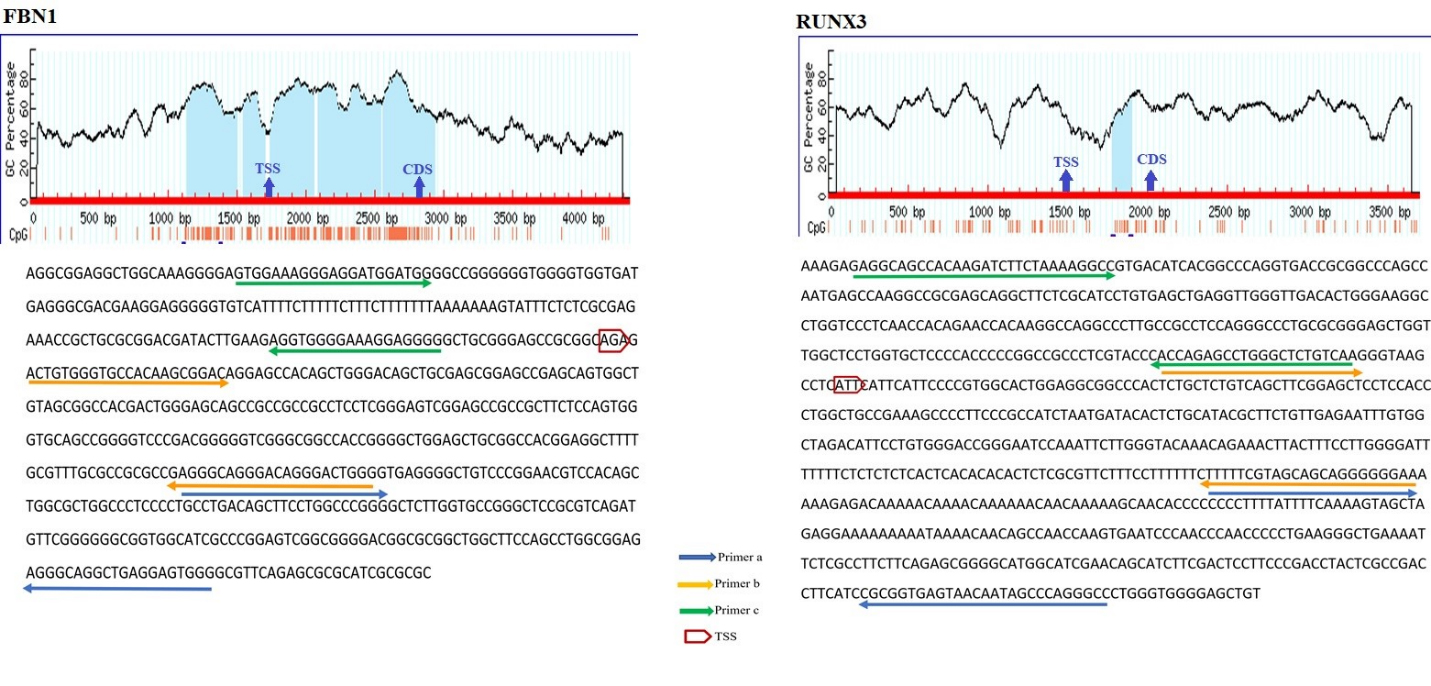
The schematic illustration by MethPrimer of the CpG islands in FBN1 and RUNX3 promoters and the regions spanned by the primers. In the diagram, the blue highlights represent CpG Island. Vertical red bars represent the CpG dinucleotides. The arrows indicate the Transcriptional Start Site (TSS) and first coding sequencing (CDS). The bisulfite sequence of the selected region is shown below the diagram. The arrows on the sequence indicate the primer binding regions. FBN1(a), FBN1(b), and FBN1(c) covered 223 to 429, 1 to 245, and 18 to 175 positions from TSS. RUNX3(a), RUNX3(b), and RUNX3(c) spanned 256 to 523, 33 to 279, and 274 to 13 positions from TSS.
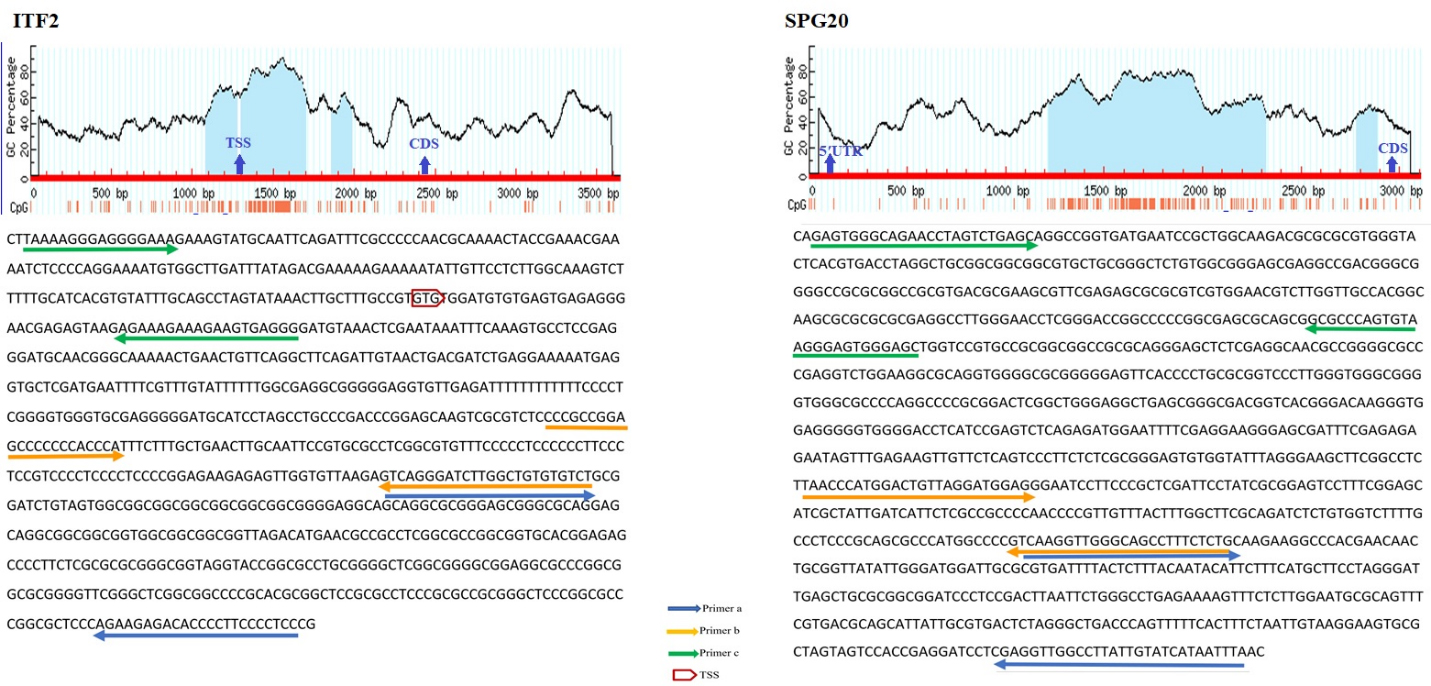
The schematic illustration by MethPrimer of the CpG islands in ITF2 and SPG20 promoters and the regions spanned by the primers. In the diagram, the blue highlights represent CpG Island. Vertical red bars represent CpG dinucleotides. The arrows indicate the Transcriptional Start Site (TSS) and first coding sequencing (CDS). The bisulfite sequence of the selected region is shown below the diagram. The arrows on the sequence indicate the primer binding regions. SPG20(a) located at the 24375 to 24680 positions while SPG20(b) and SPG20(c) spanned 24209 to 24399 and 23625 to 23883 positions from the transcriptional start site (TSS) respectively. ITF2(a), ITF2(b), and ITF2(c) covered 414 to 739, 296 to 436, and 180 to 55 positions from TSS respectively.
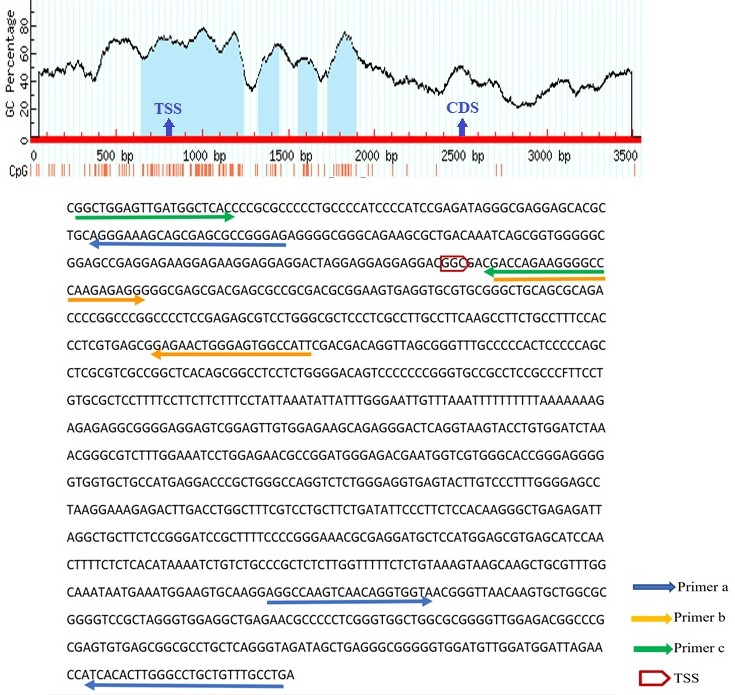
The schematic illustration by MethPrimer of the CpG islands in SNCA promoter and the regions spanned by the primers. In the diagram, the blue highlights represent CpG Island. Vertical red bars represent the CpG dinucleotides. The arrows indicate the Transcriptional Start Site (TSS) and first coding sequencing (CDS). The bisulfite sequence of the selected region is shown below the diagram. The arrows on the sequence indicate the primer binding regions. SNCA(a), SNCA(b), and SNCA(c) spanned 807 to 1013, 7 to 162, and 180 to 7 positions from TSS respectively.
Bisulfite conversion de-aminates non-methylated cytosine (C) to uracil (U) but does not affect methylated cytosine. These modifications can be detected by MS-HRM analysis. MS-HRM analysis is based on the comparison of melting profiles of unknown samples to the profiles of templates with known methylation levels [37]. Several sets of PCR primers were designed for each targeted region. The selected promoter regions were retrieved from www.ncbi.nlm.nih.gov/gene database. Thereafter, the sequence was converted into bisulfite modified in silico. Primers should encompass at least 8 CpG islands and they should be designed on the regions of promoters with minimum CpGs to amplify both methylated and non-methylated samples with similar efficiency. The Methprimer website (www.urogene.org/ Methprimer) was used for primer designing. The BLAST of primers was performed by the meth BLAST website (http://www.medgen.ugent.be/meth BLAST). Thermodynamic features of primers were checked by Gene runner version 3.0.1 (Hasting Software Inc., Hastings, New York, USA), and the Oligo Analyzer website (www.idtdna.com). All primers were purchased from Metabion (Steinkirchen, Germany). Methylation of three regions of FBN1, SNCA, ITF2, SPG20, and RUNX3 promoters, two regions of SEPT9 promoter [38], and one region of MLH1 promoter [39] were analyzed using the MS-HRM method. The sequence of each primer is given in Table 1 while the position of primers is depicted in Figs 1 and 2. The distances of the promoter regions to the first coding sequence (CDS) are indicated by (a), (b), and (c). The (a) indicates the closer promoter region to the CDS while (c) indicates the farther promoter region to the CDS. The promoter region between these two sites is named (b). SPG20(a) located at the 24375 to 24680 positions while SPG20(b) and SPG20(c) spanned 24209 to 24399 and 23625 to 23883 positions from the transcriptional start site (TSS) respectively. While FBN1(a) is located at the 223 to 429 positions from TSS, FBN1(b) and FBN1(c) are located at 1 to 245 and 18 to 175 positions from TSS. Whilst SNCA(a) spanned 807 to 1013 positions from TSS, SNCA(b) and SNCA(c) covered 7 to 162 and 180 to 7 positions from TSS respectively. ITF2(a), ITF2(b), and ITF2(c) covered 414 to 739, 296 to 436, and 180 to 55 positions from TSS respectively. RUNX3(a), RUNX3(b), and RUNX3(c) spanned 256 to 523, 33 to 279, and 274 to 13 positions from TSS.
Each reaction mixture in MS-HRM consisted of 5 l of Sybr Green Mastermix (Cat No: A325406; Amplicon RealQ Plus), 10 pmol of each primer, and 1 l of bisulfite modified DNA template in the final volume of 10 l. Then reaction mixtures were run in Real-Time PCR instrument (Applied biosystem, step one plus) with the following stages: holding stage at 95C for 15 minutes; cycling stage (40 cycles) at 95C for 20 seconds, appropriate annealing temperature for 30 seconds, and extension at 72C for 30 seconds followed by the melt curve stage with the ramp rate of 0.3C/15 sec. Methylated and non-methylated control DNA were purchased from HumDiagnostics Company (Tehran, Iran). Methylation controls of 25%, 50%, and 75% were prepared by diluting the appropriate volume of methylated and non-methylated controls. The methylation level of all samples was assessed by comparing the sample’s melting profile with the melting curve of amplified 0%, 25%, 50%, 75%, and 100% methylation controls. Samples were considered methylated when the methylation level was 12.5%, and non-methylated when the methylation level was lower than 12.5%. According to the previous studies, the cut-off point for methylation was 12.5% meaning that samples with methylation levels equal to or higher than 12.5% were considered methylated while the samples showing methylation levels less than 12.5% were considered non-methylated. The lowest methylation level which can be studied by the controls we used in High-Resolution Melting Curve Analysis is 12.5% and any methylation in the selected regions was indicative of methylation [40, 41].
Clinico-pathological features of patients
Variable
Case ( 70)
Variable
Case ( 70)
Age (Mean SD)
56.31 1.43
Gender
Male
37 (52.86%)
Female
33 (47.14%)
Tumor location
Differentiation of tumor tissues
Cecum
6 (8.57%)
Ascending colon
11 (15.72%)
Well-differentiated
23 (32.86%)
Transverse colon
4 (5.71%)
Moderately
14 (20%)
Descending colon
6 (8.57%)
Poorly differentiated
8 (11.43%)
Sigmoid
13 (18.57%)
No data
25 (35.71%)
Rectosigmoid
7 (10%)
Rectum
23 (32.86%)
Tumor histology
Metastasis
Adenocarcinoma
62 (88.57%)
M1
5 (7.14%)
Adenoma
8 (11.43%)
M0
65 (92.86%)
Chemotherapy
Radiotherapy
Yes
10 (14.29%)
Yes
13 (18.57%)
No
60 (85.71%)
No
57 (81.43%)
Statistical analysis
Normality of data was checked by Shapiro-Wilk and Kolmogorov-Smirnov tests, showing that the data were not distributed normally. Therefore, nonparametric tests were used; the Mann-Whitney U test was used to analyze the associations between DNA methylation status and clinico-pathological features of the patients. Wilcoxon matched-pairs test was used to compare the methylation levels between tumor tissues, paired normal adjacent tissues, and matched plasma samples. Additionally, the Mann-Whitney U test was used to compare cfDNA methylation levels between cancer patients and healthy controls. Kendall tau rank correlation coefficient was used to test the correlation between pairs of variables. To assess the applicability of DNA methylation of each promoter region as a diagnostic biomarker for colorectal cancer, the sensitivity and specificity were analyzed using ROC curve analysis. The optimum cut-off values of DNA methylation which distinguish tumor tissue from the normal adjacent tissues were determined by using the maximum value of the Youden’s index. Methylation levels above the cut-off value were considered as hyper-methylation. Logistic regression analysis was used for studying the association between promoter methylation and age, gender, and tumor location. The Cohen’s kappa and McNemar tests were applied to measure the agreement between detection of methylated biomarkers in the tissue-based tests and the plasma-based tests. values less than 0.05 were considered statistically significant. Statistical analysis was done by Statistical Package for Science Software 16 (SPSS Inc., Chicago, IL, USA).
Results
Clinico-pathological features of patients
The demographic and clinicopathological features of patients are outlined in Table 2. The mean age of the patients was 56.31 1.43-year-old (range: 22–93 years). The patients’ group consisted of 37 (52.9%) men and 33 (47.1%) women. The location of the tumor in 30.4% [21] of patients was the proximal colon (cecum, ascending colon, and transverse colon) while in 69.6% [49] of patients it was located in the distal colon including the rectum, sigmoid, and descending colon up to the splenic flexure. Twenty-three (51.1%) of tumors were well-differentiated, 14 (31.1%) were moderately differentiated, and 8 (17.8%) were poorly differentiated. The histologic subtypes were adenocarcinoma (86.7%) and adenoma (13.3%). About 28.5% of patients had received neoadjuvant therapy before the operation procedure, while 7.1% of the patients showed metastasis in the other organs. The healthy control group consisted of 28 (56%) men and 22 (44%) women. The mean age of the healthy volunteers was 54 years (range 27–78 years). There was no statistically significant difference in age and gender ( 0.27 and 0.59 respectively) between cases and controls.
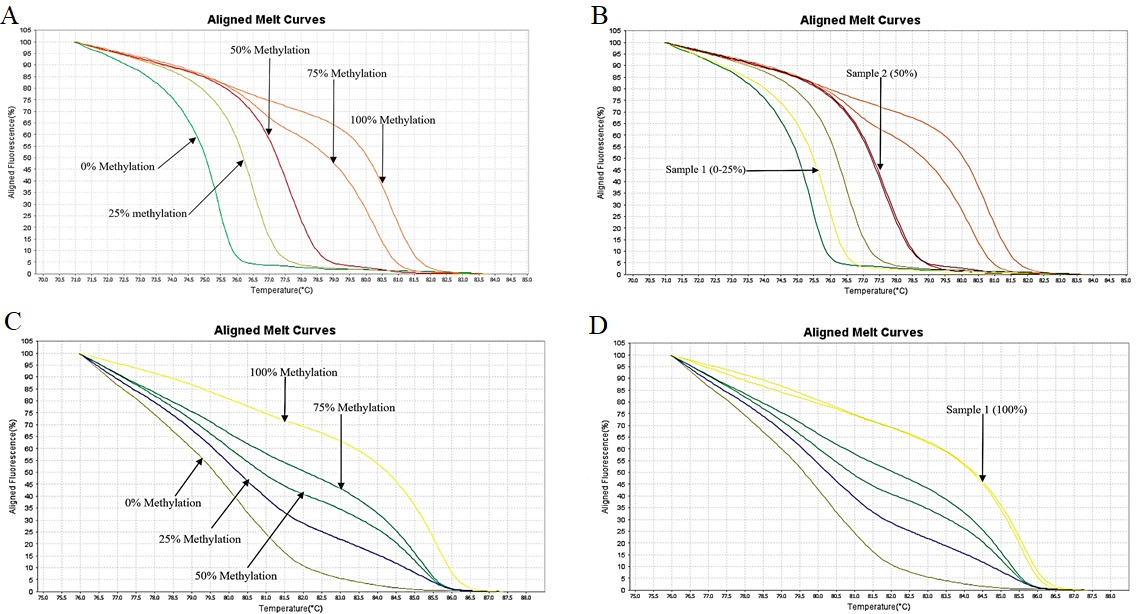
HRM aligned melt curves of FBN1(a) and SEPT9(b). (A) Control curves of FBN1(a). (B) Control curves and curves for two samples for estimating the methylation of FBN1(a) region showing methylation of 12.5% and 50% in these samples (C) Control curves of SEPT9(b) (D) Control curves and curves of one sample for estimating the methylation of SEPT9(b) region showing methylation level of 100% in this sample.
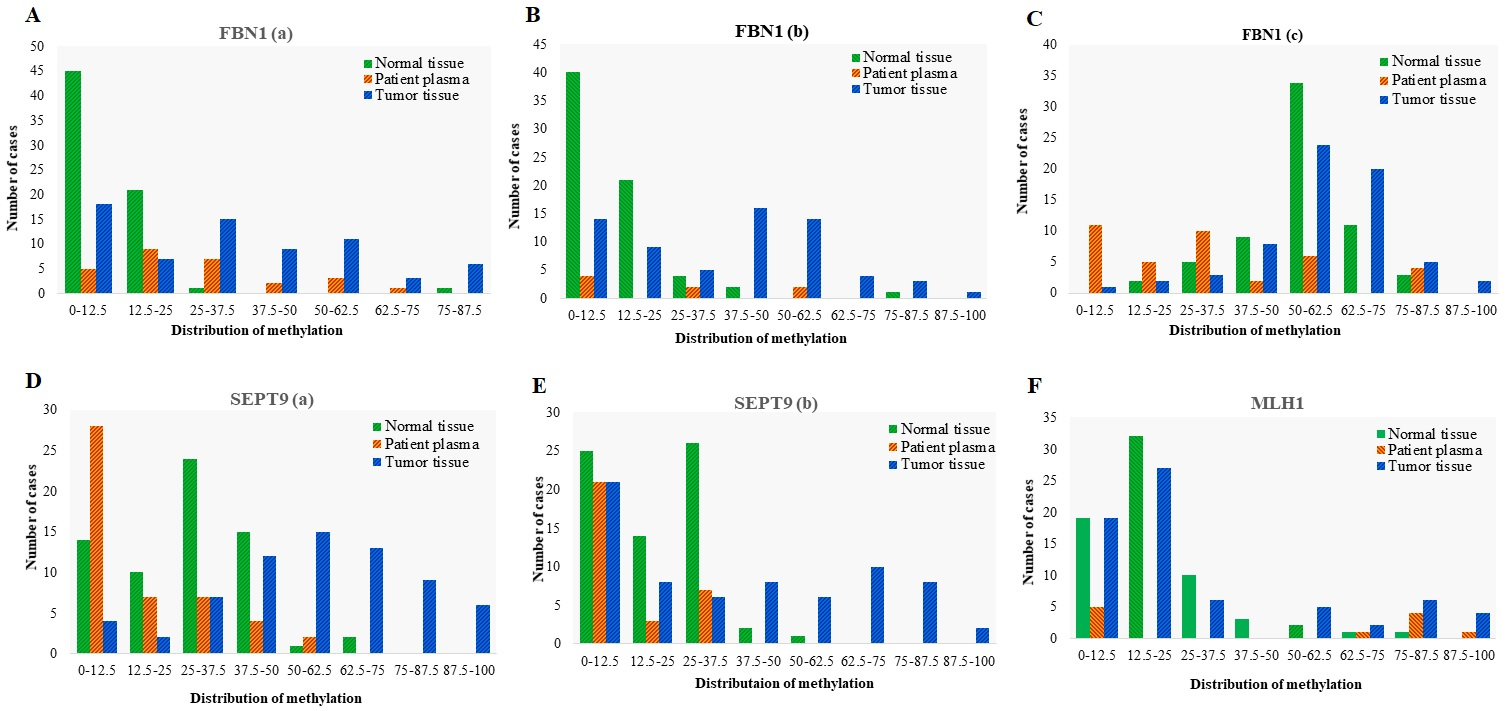
Distribution of Methylation in different promoter regions of FBN1, SEPT9, and MLH1 genes in tumor tissues ( 70), adjacent normal tissues ( 70), and matched plasma cfDNA ( 70) from CRC patients. Methylation distribution is categorized in 8 classes; 0–12.5: methylation percentage 12.5%, 12.5–25: methylation percentage from 12.5% to 25%, 25–37.5: methylation percentage from 25% to 37.5%, 37.5–50: methylation percentage from 37.5% to 50%, 50–62.5: methylation percentage from 50% to 62.5%; 62.5–75: methylation percentage from 62.5% to 75%, 75–87.5, methylation percentage from 75% to 87.5%; 87.5–100: methylation percentage from 87.5% to 100%.
FBN1(a) and FBN1(b) methylation showed good diagnostic performance for CRC detection in tissue DNA, while just FBN1(a) represented a good diagnostic value in the plasma cfDNA
HRM aligned melt curves of some samples in comparison with the methylation controls are given in Fig. 4. Using a 12.5% methylation level as the cutoff, FBN1(a) was methylated in 74% of tumor tissues, 81% of plasma cfDNA, and 33% of normal tissues. In the FBN1(b) region, 79% of tumor tissues, 50% of plasma cfDNA, and 41% of normal tissues showed methylation level 12.5%. FBN1(c) was methylated in 98% of tumor tissues, 71% of plasma cfDNA, and 100% of normal tissues (Fig. 5). The mean methylation level of FBN1(c) (56.17% 15.79%) in tumor tissues was higher than that of FBN1(a) (29.23% 24.28%), and FBN1(b) (34.56% 24.38%) regions. In FBN1(a) and FBN1(c) regions, the average methylation level of tumor tissues and plasma cfDNAs of CRC cases was higher than that
The mean methylation levels of different promoter regions in tumor and adjacent normal tissues, and matched plasma samples. values are calculated based on the Wilcoxon matched-pairs test
Gene
Tumor tissue
Normal tissue
Tumor tissue
Patient plasma
Normal tissue
Patient plasma
%Methylation
%Methylation
value
%Methylation
%Methylation
value
%Methylation
%Methylation
value
Mean SD
Mean SD
Mean SD
Mean SD
Mean SD
Mean SD
MLH1
24.67 28.75
69
14.77 15.048
68
0.005
24.67 28.75
69
42.04 41.18
11
0.959
14.77 15.04
68
42.04 41.18
11
0.192
SEPT9(a)
51.36 22.00
68
22.50 15.01
68
0.001
51.36 22.00
68
14.32 15.75
48
0.001
22.50 15.01
68
14.32 15.75
48
0.008
SEPT9(b)
33.40 28.71
69
14.48 12.70
68
0.001
33.40 28.71
69
11.06 12.06
31
0.001
14.48 12.70
68
11.06 12.06
31
0.059
FBN1(a)
29.23 24.28
69
4.56 10.23
69
0.001
29.23 24.28
69
21.87 21.00
28
0.001
4.56 10.23
69
21.87 21.00
28
0.001
FBN1(b)
34.56 24.38
69
8.66 12.27
68
0.001
34.56 24.38
69
18.61 20.35
9
0.079
8.66 12.27
68
18.61 20.35
9
0.123
FBN1(c)
56.17 15.79
65
52.67 13.07
64
0.056
56.17 15.79
65
29.55 24.52
39
0.001
52.67 13.07
64
29.55 24.52
39
0.001
SNCA(a)
24.12 17.37
66
12.53 13.53
68
0.001
24.12 17.37
66
28.25 17.99
10
0.123
12.53 13.53
68
28.25 17.99
10
0.091
SNCA(b)
27.60 21.07
65
12.82 12.99
69
0.001
27.60 21.07
65
19.16 13.82
24
0.001
12.82 12.99
69
19.16 13.82
24
0.586
SNCA(c)
29.15 23.62
68
16.37 10.45
69
0.001
29.15 23.62
68
29.22 21.26
29
0.003
16.37 10.45
69
29.22 21.26
29
0.042
ITF2(a)
30.25 22.94
69
24.28 17.43
70
0.071
30.25 22.94
69
88.05 13.89
55
0.001
24.28 17.43
70
88.05 13.89
55
0.001
ITF2(b)
30.90 28.29
69
12.21 14.18
70
0.001
30.90 28.29
69
81.00 21.15
20
0.002
12.21 14.18
70
81.00 21.15
20
0.001
ITF2(c)
50.36 30.84
69
33.39 25.68
70
0.001
50.36 30.84
69
31.96 18.38
33
0.001
33.39 25.68
70
31.96 18.38
33
0.106
RUNX3(a)
52.17 20.72
67
50.96 19.67
65
0.805
52.17 20.72
67
41.96 18.08
14
0.463
50.96 19.67
65
41.96 18.08
14
0.111
RUNX3(b)
25.83 27.63
69
23.51 23.33
69
0.869
25.83 27.63
69
37.50 23.06
23
0.312
23.51 23.33
69
37.50 23.06
23
0.940
RUNX3(c)
72.87 16.77
63
77.50 17.68
57
0.074
72.87 16.77
63
11.47 11.69
17
0.001
77.50 17.68
57
11.47 11.69
17
0.003
SPG20(a)
49.65 24.54
66
22.57 13.58
67
0.001
49.65 24.54
66
37.67 17.87
14
0.109
22.57 13.58
67
37.67 17.87
14
0.021
SPG20(b)
49.56 29.86
69
16.73 12.06
70
0.001
49.56 29.86
69
23.52 22.97
34
0.001
16.73 12.06
70
23.52 22.97
34
0.366
SPG20(c)
38.36 18.07
69
15.035 10.71
70
0.001
38.36 18.07
69
41.07 30.27
28
0.400
15.035 10.71
70
41.07 30.27
28
0.002
Indicates value less than 0.05.
of cfDNA in healthy control cases. The mean methylation level of FBN1(b) in patients’ plasma was 18.61% 20.35%, while the methylation of the FBN1(b) region was not detectable in healthy individuals’ plasma. The methylation levels of FBN1(a) and FBN1(b) were significantly higher in tumor tissue compared with the normal adjacent tissue ( 0.05) while there was no statistically significant difference in the methylation level of FBN1(c) between tumor tissue and paired normal tissue ( 0.05) (Fig. 6 and Table 3). ROC analysis showed that the FBN1(a) and FBN1(b) methylation had a good diagnostic performance for discriminating CRC tissues from paired normal adjacent tissues while FBN1(c) methylation failed in diagnostic performance. For FBN1(a) methylation, the area under curve was 0.818 ( 0.0001) and the optimal cut-off value for hyper-methylation was 20% with the sensitivity of 65.2%, the specificity of 98.2%, the positive predictive value of 97.8%, and the negative predictive value of 73.6%. For FBN1(b) methylation, the area under curve was 0.828 ( 0.0001) and the optimal cut-off value for hyper-methylation was 15% with the sensitivity of 71.6%, the specificity of 86.7%, the positive predictive value of 84.2%, and the negative predictive value of 75.6%. For FBN1(c) methylation, the area under curve was 0.580 ( 0.111) and the optimal cut-off value for hyper-methylation was 60% with the sensitivity of 41.5%, the specificity of 78.1%, the positive predictive value of 65.9%, and the negative predictive value of 56.8% in the tissue-based assay (Fig. 7 and Table 5). The methylation level of FBN1(a) was significantly higher in the patients’ plasma compared with the paired normal tissues. FBN1(a) methylation showed good diagnostic performance for CRC detection in plasma cfDNA (AUC 0.808, 0.0001), the optimal cut-off value for hyper-methylation in this region was 12.5% with the sensitivity of 81.5%, the specificity of 66.2%, the positive predictive value of 48.9% and negative predictive value of 90% (Fig. 8 and Table 5). The methylation level of FBN1(b) was not statistically significant between the patients’ plasma and paired normal tissues and the methylation level of FBN1(c) was significantly lower in patient’s plasma compared with paired normal tissues. Therefore, FBN1(b) and FBN1(c) could not be considered for diagnostic assay in plasma cfDNA (Fig. 6 and Table 3).
The mean methylation levels of plasma cfDNA in CRC patients and healthy controls. values are calculated based on the Wilcoxon matched-pairs test
Gene
Patient plasma sample
Normal plasma sample
value
%Methylation
%Methylation
(Mean SD)
Mean SD
FBN1 (c)
29.55 24.52
39
4.06 5.07
41
0.001
FBN1 (a)
21.87 21.00
28
18.37 1.86
45
0.352
SEPT9 (a)
14.322 15.75
48
9.64 3.54
50
0.043
SEPT9 (b)
11.06 12.06
31
9.300 3.79
50
0.338
ITF2 (c)
31.96 18.38
33
10.82 10.75
43
0.001
ITF2 (b)
81.00 21.15
20
4.86 7.045
19
0.001
RUNX3 (c)
11.47 11.69
17
19.67 5.86
40
0.001
SNCA (b)
19.16 13.82
24
40.83 37.12
15
0.013
Indicates p value less than 0.05.
There was no statistically significant association between the methylation levels of all selected regions of FBN1 promoter with tumor location, tumor histology, tumor grade, metastasis, patient’s age and any previous history of radiotherapy. The methylation levels FBN1(b) was significantly higher in female patients than male patients. All selected regions of the FBN1 promoter had a lower methylation level in tissue DNA of patients undergone chemotherapy compared to non-treated ones (Table 6).
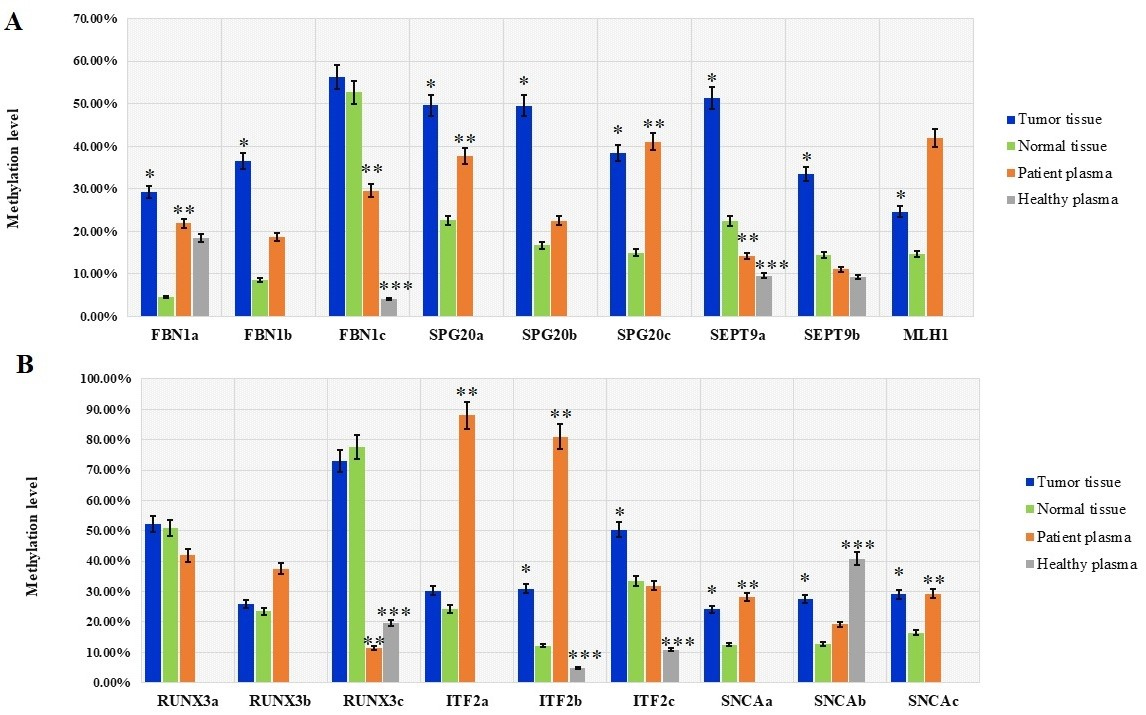
The mean methylation levels in different promoter regions of FBN1, SPG20, SEPT9, MLH1, RUNX3, ITF2, and SNCA genes in tumor tissues, normal adjacent tissues, plasma cfDNA from 70 CRC patients, and plasma from 50 healthy controls. Data are presented as mean methylation level SD. values are based on the Wilcoxon matched-pairs test. Asterisks mark significant differences. 0.05 (tumor tissue vs. normal tissue). 0.05 (patient plasma vs. normal tissue). 0.05 (healthy plasma vs. patient plasma).
Diagnostic performance of DNA methylation in eighteen promoter regions of seven targeted genes in CRC tumor tissues and 5 suitable markers in the plasma cfDNA
Locus
AUC
95% CI
value
%Methylation cut-off value
Sensitivity (%)
Specificity (%)
PPV (%)
NPV (%)
MLH1
0.554
0.466–0.639
0
.254
37
.5
24
.6
94
.1
81
.0
55
.2
SEPT9 (a)
0.876
0.808–0.926
0
.001
37
.5
75
.0
95
.52
94
.4
79
SEPT9 (b)
0.671
0.586–0.749
0
.001
30
49
.28
95
.59
91
.9
65
.0
FBN1 (a)
0.818
0.743–0.879
0
.001
20
65
.2
98
.5
97
.8
73
.6
FBN1 (b)
0.828
0.753–0.887
0
.001
15
71
.6
86
.7
84
.2
75
.6
FBN1 (c)
0.580
0.490–0.666
0
.111
60
41
.5
78
.1
65
.9
56
.8
SNCA (a)
0.679
0.592–0.758
0
.001
25
46
.27
87
.69
79
.5
61
.3
SNCA (b)
0.718
0.635–0.792
0
.001
25
44
.7
94
.2
88
.2
63
.7
SNCA (c)
0.670
0.567–0.763
0
.012
25
39
.2
89
.7
79
.4
59
.8
ITF2 (a)
0.543
0.456–0.628
0
.380
35
27
.5
85
.2
62
.5
53
.7
ITF2 (b)
0.661
0.574–0.740
0
.001
30
34
.7
96
.
92
.3
587
ITF2 (c)
0.650
0.565–0.729
0
.001
50
42
85
.7
74
.4
60
RUNX3 (a)
0.514
0.426–0.602
0
.776
68
.75
67
.1
40
.9
53
.6
55
.1
RUNX3 (b)
0.508
0.421–0.594
0
.874
37
.5
52
.1
56
.5
54
.5
54
.2
RUNX3 (c)
0.583
0.491–0.672
0
.104
86
80
.9
33
.3
56
62
.5
SPG20 (a)
0.819
0.719–0.896
0
.001
37
.5
73
.3
94
73
.3
94
SPG20 (b)
0.860
0.791–0.913
0
.001
20
81
.1
76
.8
77
.8
80
.3
SPG20 (c)
0.823
0.749–0.882
0
.001
22
76
.8
90
.0
88
.3
79
.7
FBN1 (a) in cfDNA
0.808
0.701–0.915
0
.001
12
.5
81
.5
66
.2
48
.9
90
SPG20 (a) in cfDNA
0.825
0.719–0.896
0
.001
37
.5
73
.3
94
73
.3
94
SPG20 (c) in cfDNA
0.674
0.508–0.839
0
.04
22
67
.9
90
73
.1
87
.5
SNCA (c) in cfDNA
0.670
0.567–0.763
0
.009
25
39
.3
89
.7
61
.1
78
.2
SEPT9 (a) in cfDNA
0.763
0.663–0.845
0
.001
15
58
.7
100
100
70
.8
Indicates value less than 0.05. PPV, positive predictive value; NPV, negative predictive value.
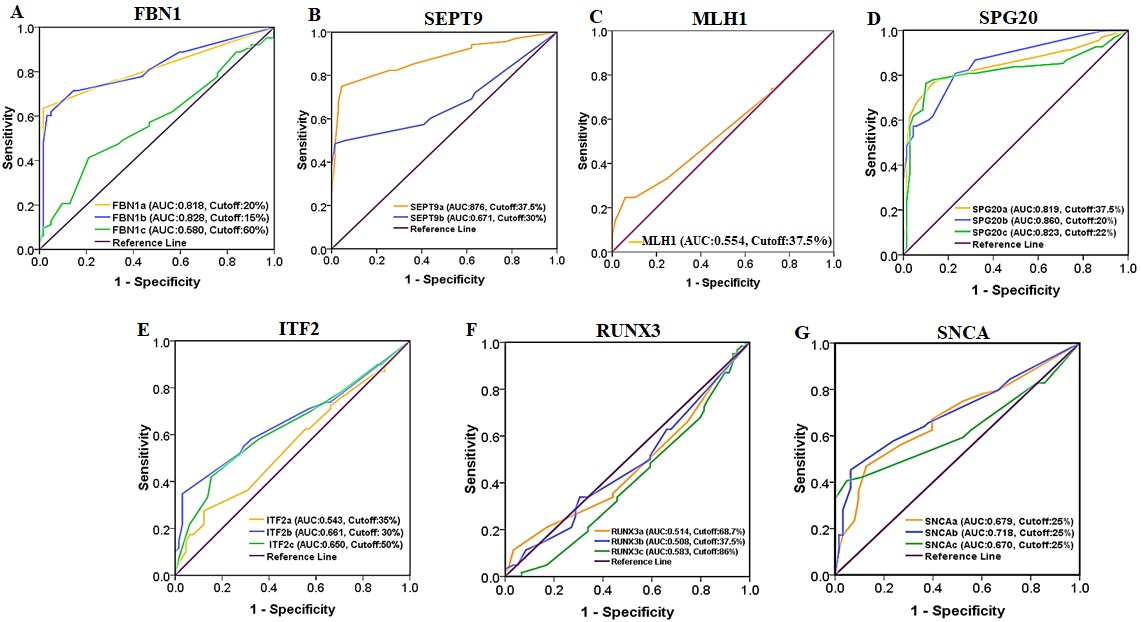
Receiver Operating Characteristic (ROC) curve analysis of FBN1, SEPT9, MLH1, SPG20, ITF2, RUNX3, and SNCA promoter methylation for discriminating CRC tissues from normal adjacent tissues.
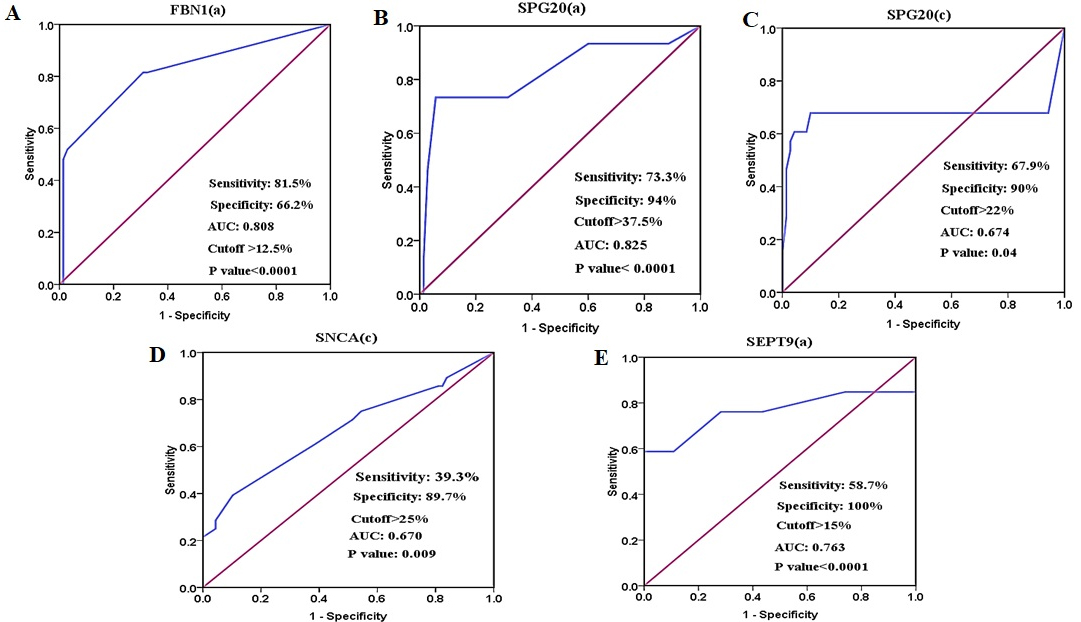
ROC curve analysis of (A) FBN1(a), (B) SPG20(a), (C) SPG20(c), and (D) SNCA(c) methylation for CRC detection in plasma cfDNA for discriminating the patients’ plasma from normal tissues. (E) ROC curve analysis of SEPT9(a) for discriminating the patients’ plasma from healthy control plasma. The AUCs of FBN1(a) and SPG20(a) regions are higher than other biomarkers.
SEPT9(a) methylation showed good diagnostic values for CRC detection in tissue DNA but it had poor diagnostic performance in plasma cfDNA
HRM aligned melt curves of some samples in comparison with methylation controls are given in Fig. 4. Using a 12.5% methylation cutoff, SEPT9(a) was methylated in 94% of tumor tissues, 42% of plasma cfDNA, and 78% of normal tissues. SEPT9(b) was methylated in 69% of tumor tissues, 48% of plasma cfDNA, and 63% of normal tissues (Fig. 5). The mean methylation level of SEPT9(a) in tumor tissues (51.36% 22.00%) was higher than that of SEPT9(b) (33.40% 28.7%). In both SEPT9 regions, the average methylation levels of tumor tissues and cfDNA in CRC cases was higher than that of cfDNA in healthy controls. The methylation levels of SEPT9(a) and SEPT9(b) were significantly higher in tumor tissues compared with normal adjacent tissues ( 0.05) (Fig. 6 and Table 3). ROC analysis showed that the SEPT9(a) methylation had a good diagnostic performance for discriminating CRC tissues from paired normal adjacent tissues (AUC 0.876, 0.0001), the optimal cut-off value in this region for hyper-methylation was 37.5% with a sensitivity of 75%, a specificity of 95.5%, a positive predictive value of 94.4%, and a negative predictive value of 79%. The SEPT9(b) methylation showed a poor diagnostic performance in the tissue-based assay (AUC 0.671, 0.0001), the optimal cut-off value for hyper-methylation in this region was 30% with a sensitivity of 49.2%, a specificity of 95.5%, a positive predictive value of 91.9%, and a negative predictive value of 65% (Fig. 7 and Table 5). The plasma cfDNA methylation level of the SEPT9(a) was significantly higher in CRC patients compared with healthy controls ( 0.05) (Fig. 6 and Table 3). SEPT9(a) methylation showed poor diagnostic performance in plasma cfDNA (AUC 0.763, 0.0001), the optimal cut-off value for hyper-methylation in this region was 15% with a sensitivity of 58.7%, a specificity of 100%, a positive predictive value of 100%, and the negative predictive value of 70.8% (Fig. 8 and Table 5). There was no statistically significant difference in the methylation level of SEPT9(b) between the patients’ plasma and paired normal tissues ( 0.05), therefore SEPT9(b) region could not be considered for diagnostic assay in plasma cfDNA (Fig. 6 and Table 3).
There was no statistically significant association between methylation levels of two selected regions of SEPT9 promoter with the tumor location, tumor histology, tumor grade, metastasis, patients’ age, gender, and the previous history of radiotherapy. SEPT9(a) and SEPT9(b) showed lower methylation level in tissue DNA of patients treated with chemotherapy compared to non-treated ones (Table 6).
MLH1 promoter methylation failed in diagnostic performance for CRC detection
Using 12.5% methylation level as cutoff, the selected region of MLH1 promoter was methylated in 72% of tumor tissues, 55% of plasma cfDNA, and 72% of normal tissues. Methylation of this region was not detectable in plasma of healthy control cases (Fig. 5). The mean methylation level was significantly higher in tumor tissues compared with the normal adjacent tissues ( 0.05) (Fig. 6 and Table 3) while it was not significantly different between tumor tissues/plasma sample and normal adjacent tissues/plasma samples (Table 3). ROC analysis showed that MLH1 promoter methylation has failed in diagnostic performance for CRC detection in tissue DNA (AUC 0.554, 0.254). The optimal cut-off value for hyper-methylation was 37.5% with a sensitivity of 24.6%, a specificity of 94.1%, a positive predictive value of 81%, and a negative predictive value of 55.2% (Fig. 7 and Table 5). There was no significant difference in the methylation level of MLH1 between normal tissues and paired plasma samples ( 0.05) hence this region of MLH1 could not be considered for diagnostic assays in the plasma cfDNA (Fig. 6 and Table 3). There was no significant association between the methylation level of MLH1 promoter with the tumor location, tumor histology, tumor grade, metastasis, patient’s age, gender, and the previous history of chemo-radiotherapy (Table 6).
The statistical relationship between methylation levels of FBN1, SEPT9 and MLH1 from tumor tissues and clinicopathological parameters of patients. values are based on the Mann-Whitney U test
The statistical relationship between methylation levels of SPG20 and ITF2 from tumor tissues and clinicopathological parameters of patients. values are calculated based on the Mann-Whitney U test
Methylation of all selected regions of SPG20 showed good diagnostic value for CRC detection in tissue DNA, while SPG20(a) had good diagnostic value in plasma cfDNA
Using a 12.5% methylation level as the cutoff, SPG20(a) was methylated in 88% of tumor tissues, 68% of plasma cfDNA, and 70% of normal tissues. In SPG20(b) region, 97% of tumor tissues, 72% of plasma cfDNA, and 81% of normal tissues showed methylation levels equal to or more than 12.5%. SPG20(c) was methylated in 96% of tumor tissues, 93% of plasma cfDNA, and 86% of normal tissues (Fig. 9). The mean methylation levels in tumor tissues were almost the same in SPG20(a) (49.65% 24.54%) and SPG20(b) (49.56% 29.86%) regions. The mean methylation level in SPG20(c) region (38.36% 18.07%) was lower than that of SPG20(a) and SPG20(b) regions. Methylation of SPG20 regions was not detectable in the plasma of healthy controls. The methylation levels of SPG20(a), SPG20(b), and SPG20(c) were significantly higher in tumor tissues compared with normal adjacent tissues ( 0.05) (Fig. 6 and Table 3). ROC analysis showed that all three regions of SPG20 promoter had good diagnostic value for discriminating the CRC tissues from paired normal adjacent tissues (Fig. 7 and Table 5). For SPG20(a) methylation, the area under the curve was 0.819 ( 0.0001) and the optimal cut-off value for hyper-methylation was 37.5% with a sensitivity of 73.3%, a specificity of 94%, a positive predictive value of 73.3%, and a negative predictive value of 94%. For SPG20(b) methylation, the area under curve was 0.860 ( 0.0001) and the optimal cut-off value for hyper-methylation was 20% with a sensitivity of 81.1%, a specificity of 76.8%, a positive predictive value of 77.8%, and a negative predictive value of 80.3%. For SPG20(c) methylation, the area under the curve was 0.823 ( 0.0001) and the optimal cut-off value for hyper-methylation was 22% with a sensitivity of 76.8%, a specificity of 90%, a positive predictive value of 88.3%, and a negative predictive value of 79.7% in tissue based-assay. The methylation levels of SPG20(a) and SPG20(c) were significantly higher in patients’ plasma compared with the paired normal tissues ( 0.05) (Fig. 6 and Table 3). SPG20(a) methylation showed good diagnostic performance for CRC detection in the plasma cfDNA (AUC 0.825, 0.0001) and the optimal cut-off value for hyper-methylation was 37.5% with a sensitivity of 73.3%, a specificity of 94%, a positive predictive value of 73.3% and a negative predictive value of 94%. SPG20(c) methylation showed poor diagnostic value in plasma cfDNA (AUC 0.674, 0.04) and the optimal cut-off value for hyper-methylation was 22% with a sensitivity of 67.9%, a specificity of 90%, a positive predictive value of 73.1%, and a negative predictive value of 87.5% in plasma based-assay (Fig. 8 and Table 5). There was no statistically significant difference in the methylation level of SPG20(b) between plasma cfDNA and paired normal tissues in CRC cases ( 0.05), therefore SPG20(b) region could not be considered for diagnostic assay in plasma cfDNA (Fig. 6 and Table 3).
There was no statistically significant association between methylation levels of all three regions of SPG20 promoter with the tumor location, tumor histology, tumor grade, metastasis, patients’ gender, and the previous history of radiotherapy. The methylation levels of SPG20(c) were significantly higher in tumor tissues of patients aged 50 years compared with those aged 50 years. SPG20(b) and SPG20(c) regions showed lower methylation level in the tissue DNA of patients undergone chemotherapy compared to non-treated ones (Table 7).
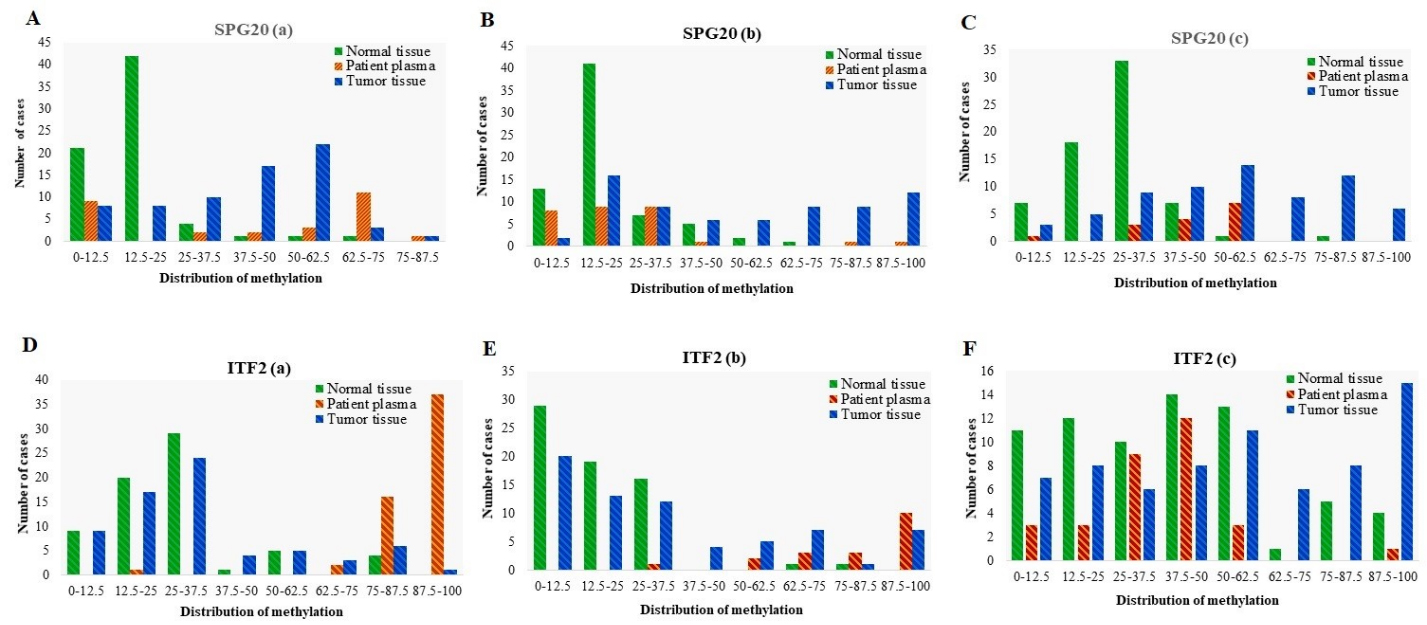
Distribution of Methylation in different promoter regions of SPG20 and ITF2 genes in tumor tissues ( 70), adjacent normal tissues ( 70), and matched plasma cfDNA ( 70) from CRC patients. Methylation distribution is categorized in 8 classes; 0–12.5: methylation percentage 12.5%, 12.5–25: methylation percentage from 12.5% to 25%, 25–37.5: methylation percentage from 25% to 37.5%, 37.5–50: methylation percentage from 37.5% to 50%, 50–62.5: methylation percentage from 50% to 62.5%; 62.5–75: methylation percentage from 62.5% to 75%, 75–87.5, methylation percentage from 75% to 87.5%; 87.5–100: methylation percentage from 87.5% to 100%.
ITF2 methylation showed poor diagnostic performance for CRC detection in tissue DNA whereas it showed false positive results in the plasma cfDNA
Using a 12.5% methylation level as the cutoff, ITF2(a) was methylated in 87% of tumor tissues, 100% of plasma cfDNA, and 87% of normal tissues. In ITF2(b) region, 72% of tumor tissues, 100% of plasma cfDNA, and 56% of normal tissues showed methylation level equal to or more than 12.5%. ITF2(c) was methylated in 90% of tumor tissues, 90% of plasma cfDNA, and 84% of normal tissues (Fig. 9). The mean methylation level of ITF2(c) (50.36% 30.84%) is higher than that of ITF2(a) (30.25% 22.94%), and ITF2(b) (30.90% 28.29%) regions. In ITF2(b) and ITF2(c), the average methylation level of tumor tissues and cfDNA in CRC cases was higher than that of cfDNA in healthy controls. Methylation of ITF2(a) was not detectable in the plasma of healthy controls. There was no statistically significant difference in the methylation levels of ITF2(a) between tumor and paired normal tissues ( 0.05). The methylation levels of ITF2(b) and ITF2(c) were significantly higher in tumor tissue compared with normal adjacent tissues ( 0.05) (Fig. 6 and Table 3). ROC analysis showed that ITF2(a) methylation had a failed diagnostic performance for discriminating CRC tissues from paired normal adjacent tissues (AUC 0.543, 0.380). The optimal cut-off value for hyper-methylation was 35% with a sensitivity of 27.5%, a specificity of 85.2%, a positive predictive value of 62.5%, and a negative predictive value of 53.7%. The methylation of ITF2(b) and ITF2(c) showed poor diagnostic performance in the tissue-based assay. For ITF2(b) methylation, the area under the curve was 0.661 ( 0.001) and the optimal cut-off value for hyper-methylation was 30% with a sensitivity of 34.7%, a specificity of 96%, a positive predictive value of 92.3%, and a negative predictive value of 58.7. For ITF2(c) methylation, the area under the curve was 0.650 ( 0.001) and the optimal cut-off value for hyper-methylation was 50% with a sensitivity of 42%, a specificity of 85.7%, a positive predictive value of 74.4%, and a negative predictive value of 60% (Fig. 7 and Table 5). The methylation levels of ITF2(a) and ITF2(b) were significantly higher in patients’ plasma compared with the tumor tissues ( 0.005), though ITF2(a) and ITF2(b) regions’ methylation could not be used for diagnostic purposes in the plasma cfDNA due to the false-positive results. In ITF2(c) region, there was no statistically significant difference in the mean methylation level between patients’ plasma and normal tissue ( 0.05), so ITF2(c) methylation in the plasma cfDNA could not be used for diagnostic aims (Fig. 6 and Tables 3 and 4).
There was no statistically significant association between the methylation levels of all three regions of ITF2 promoter with the tumor location, tumor histology, tumor grade, patient’s age, gender, previous history of radiotherapy and chemotherapy. The methylation level of ITF2(b) was significantly lower in tissues of patients showing metastasis (Table 7).
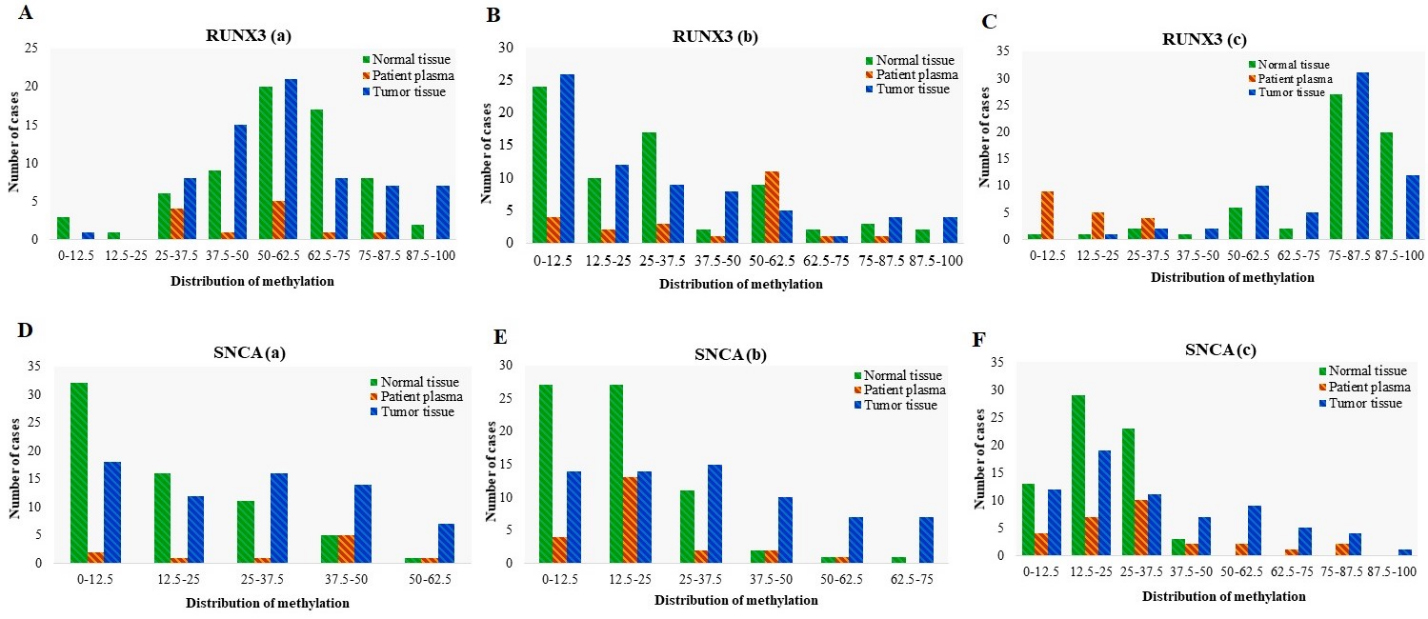
Distribution of Methylation in different promoter regions of RUNX3 and SNCA genes in tumor tissues ( 70), adjacent normal tissues ( 70), and matched plasma cfDNA ( 70) from CRC patients. Methylation distribution is categorized in 8 classes; 0–12.5: methylation percentage 12.5%, 12.5–25: methylation percentage from 12.5% to 25%, 25–37.5: methylation percentage from 25% to 37.5%, 37.5–50: methylation percentage from 37.5% to 50%, 50–62.5: methylation percentage from 50% to 62.5%; 62.5–75: methylation percentage from 62.5% to 75%, 75–87.5, methylation percentage from 75% to 87.5%; 87.5–100: methylation percentage from 87.5% to 100%.
The statistical relationship between methylation levels of RUNX3 and SNCA from tumor tissues and clinicopathological parameters of patients. values are calculated based on the Mann-Whitney U test
RUNX3 promoter methylation failed in diagnostic performance for detection of CRC
Using a 12.5% methylation as cutoff, RUNX3(a) was methylated in 99% of tumor tissues, 100% of plasma cfDNA, and 95% of normal tissues. In the RUNX3(b) region, 62% of tumor tissues, 82% of plasma cfDNA, and 65% of normal tissues showed methylation level equal to or more than 12.5%. RUNX3(c) was methylated in 100% of tumor tissues, 50% of plasma cfDNA, and 98% of normal tissues (Fig. 10). The mean methylation level of RUNX3(c) (72.87% 16.77%) is higher than that of RUNX3(a) (52.17% 20.72%), and RUNX3(b) (25.83% 27.63%). In the RUNX3(c) region, the average methylation level of cfDNA in CRC cases was lower than that of cfDNA in healthy controls. Methylation of RUNX3(a) and RUNX3(b) was not detectable in the plasma of healthy control cases. There was no statistically significant difference in the methylation levels of RUNX3(a), RUNX3(b), and RUNX3(c) between tumor tissues and paired normal tissues (Fig. 6 and Table 3). ROC analysis showed that the RUNX3(a), RUNX3(b) and RUNX3(c) could not acquire a diagnostic value for discriminating the CRC tissues from their paired normal adjacent tissues (Fig. 7 and Table 5). For RUNX3(a) methylation, the Area Under the Curve was 0.514 ( 0.776) and the optimal cut-off value for hyper-methylation was 68.75% with a sensitivity of 67.1%, a specificity of 40.9%, a positive predictive value of 53.6%, and a negative predictive value of 55.1%. For RUNX3(b) methylation, the Area Under the Curve was 0.508 ( 0.874) and the optimal cut-off value for hyper-methylation was 37.5% with a sensitivity of 52.1%, a specificity of 56.5%, a positive predictive value of 54.5%, and a negative predictive value of 54.2. For RUNX3(c) methylation, the Area Under the Curve was 0.583 ( 0.104) and the optimal cut-off value for hyper-methylation was 86% with a sensitivity of 80.9%, a specificity of 33.3%, a positive predictive value of 56%, and a negative predictive value of 62.5% in the tissue based-assay. There was no statistically significant difference in the methylation levels of RUNX3(a) and RUNX3(b) between normal tissue and matched plasma samples ( 0.05). On the other hand, the methylation level of RUNX3(c) was significantly lower in patients’ plasma than the normal tissues ( 0.05). Also, the methylation level of this region in cfDNA was significantly lower in the CRC patients compared with the healthy controls ( 0.05) (Fig. 6 and Tables 3 and 4). Based on these results, methylation of these regions of RUNX3 promoter in plasma cfDNA could not be used for diagnostic aims.
There was no statistically significant association between the methylation levels of RUNX3 promoter with the tumor location, tumor histology, tumor grade, metastasis and patients’ gender. The methylation level of RUNX3(b) was significantly higher in the tumor tissues of patients aged 50 years compared with those aged 50 years. RUNX3(b) and RUNX3(c) regions showed lower methylation levels of tissue DNA in patients undergone chemotherapy treatment compared with non-treated ones. The methylation level of RUNX3(b) was significantly lower in tumor tissue of patients treated with radiotherapy compared with non-treated ones (Table 8).
SNCA promoter methylation in tissue DNA and plasma cfDNA showed poor diagnostic performance for CRC detection
Using a 12.5% methylation level as cutoff, SNCA(a) was methylated in 73% of tumor tissues, 80% of plasma cfDNA, and 51% of normal tissues. In SNCA(b) region, 79% of tumor tissues, 82% of plasma cfDNA, and 60% of normal tissues showed methylation level equal to or more than 12.5%. SNCA(c) was methylated in 82% of tumor tissues, 86% of plasma cfDNA, and 80% of normal tissues (Fig. 10). The mean methylation level of SNCA(c) (29.15% 23.62%) was higher than that of SNCA(a) (24.12% 17.37%), and SNCA(b) (27.60% 21.07%). In SNCA(b) regions, the average methylation level of tumor tissues and cfDNA of CRC cases was lower than that of cfDNA in healthy controls. Methylation of SNCA(a) and SNCA(c) was not detectable in the plasma of healthy control cases. The methylation levels of SNCA(a), SNCA(b), and SNCA(c) were significantly higher in tumor tissue compared to normal adjacent tissues ( 0.05) (Fig. 6 and Table 3). ROC analysis showed that SNCA(a) and SNCA(c) methylation showed poor diagnostic performance for discriminating the CRC tissues from paired normal adjacent tissues. For SNCA(a) methylation, the Area Under the Curve was 0.679 ( 0.0001) and the optimal cut-off value for hyper-methylation was 25% with a sensitivity of 46.2%, a specificity of 87.6%, a positive predictive value of 79.5%, and a negative predictive value of 61.3%. For SNCA(c) methylation, the Area Under the Curve was 0.670 ( 0.012) and the optimal cut-off value for hyper-methylation was 25% with a sensitivity of 39.2%, a specificity of 89.7%, a positive predictive value of 79.4%, and a negative predictive value of 59.8%. SNCA(b) methylation showed the weak diagnostic value in the tissue-based assays (AUC 0.718, 0.0001) while the optimal cut-off value for hyper-methylation was 25% with a sensitivity of 44.7%, a specificity of 94.2%, a positive predictive value of 88.2%, and a negative predictive value of 63.7% (Fig. 7 and Table 5). There were no statistically significant differences in the methylation levels of SNCA(a) and SNCA(b) between normal tissues and paired plasma samples. Methylation levels of SNCA(b) in the plasma cfDNA were significantly lower in the CRC patients compared with the healthy controls ( 0.05), therefore methylation of SNCA(a) and SNCA(b) regions could not be picked up for diagnostic assays in the plasma cfDNA. The methylation level of SNCA(c) was significantly higher in the patients’ plasma compared with the normal tissues ( 0.05) (Fig. 6 and Tables 3 and 4). SNCA(c) methylation showed poor diagnostic performance for CRC detection in the plasma cfDNA (AUC 0.670, 0.004), and the optimal cut-off value for hyper-methylation was 25% with a sensitivity of 39.3%, a specificity of 89.7%, a positive predictive value of 61.1%, and a negative predictive value of 78.2% (Fig. 8 and Table 5).
There was no statistically significant association between the methylation levels of SNCA promoter with the tumor location, tumor histology, tumor grade, and metastasis. The methylation levels of SNCA(a) and SNCA(c) were significantly higher in the tumor tissues of patients aged 50 years compared with those aged 50 years. The methylation level of SNCA(b) was significantly higher in females compared with males. All three regions of SNCA promoter showed lower methylation levels in tissue DNA of patients undergone chemotherapy compared with non-treated ones. The methylation level of the SNCA(a) region was significantly lower in tumor tissue of patients treated with radiotherapy compared to those not treated (Table 8).
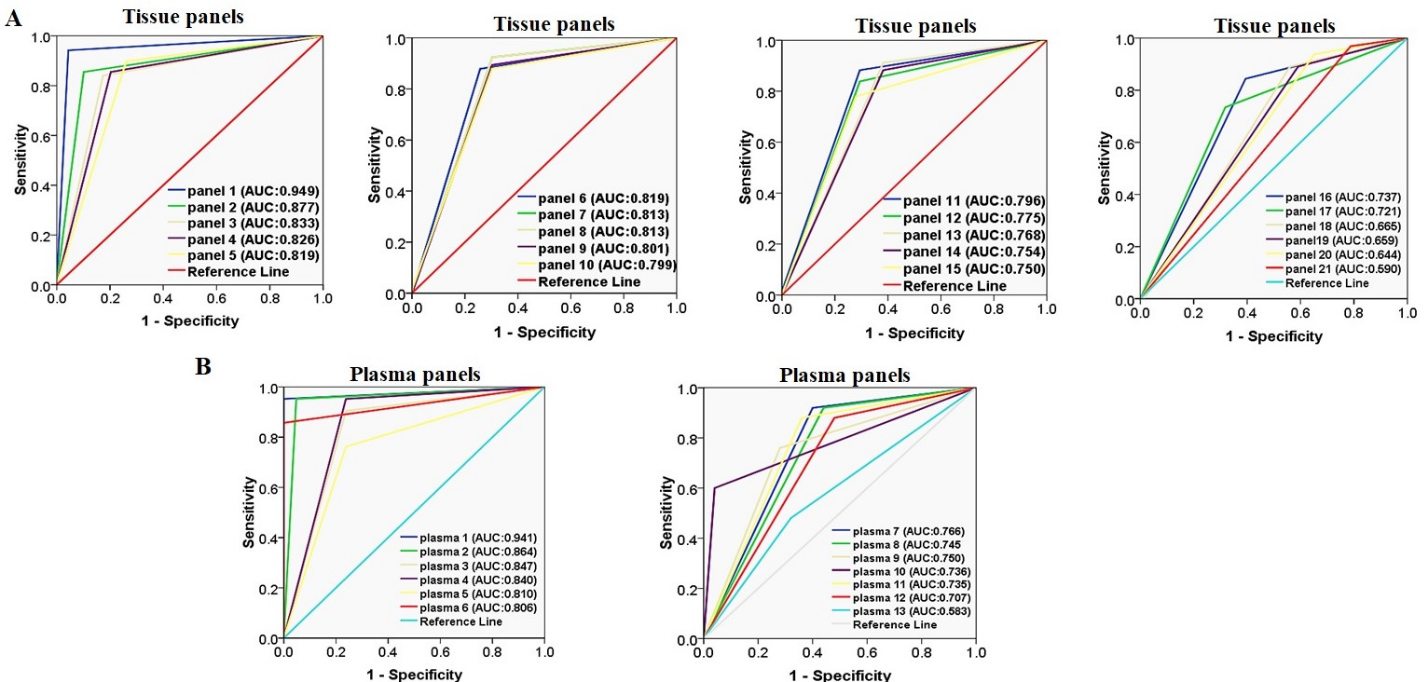
A panel of SPG20, FBN1, and SEPT9 methylation had excellent diagnostic performance for CRC detection in the tissue-based assays however the combination of SPG20, FBN1, SEPT9, ITF2, and MLH1 showed good diagnostic performance too
Considering all targeted promoter regions of each gene, SPG20 methylation was found to be the most sensitive biomarker (sensitivity of 89.9%) and SEPT9 methylation was found to be the most specific one (specificity of 97%) for discriminating the tumor tissues from normal adjacent ones (Table 5). To have an ideal biomarker of CRC diagnosis in the tumor tissues, analysis of multiple DNA biomarkers rather than a single biomarker has been considered. We evaluated different combinations of the selected promoter regions as a panel for discriminating CRC tissues from paired normal adjacent ones. Twenty-one combinations were considered (Table 9). Panel 1 which included SPG20(a), FBN1(a), and SEPT9(a) yielded an excellent diagnostic performance (AUC 0.949, 0.0001) with a sensitivity of 94.2%, a specificity of 95.6%, a positive predictive value of 95.6, and a negative predictive value of 94.3 (Fig. 11 and Table 9). However, panels 2 to 9 which are consisted of different promoter regions of SPG20, FBN1, SEPT9, ITF2, and MLH1 promoter, showed good diagnostic performance (AUC 0.8, 0.0001) in the tissue-based assays. Panel 21 included all selected promoter regions that were significantly higher in tumor tissues compared with the normal adjacent tissues. The diagnostic performance of panel 21 was found to be unsatisfactory (AUC 0.590, 0.001). Accordingly, panel 1 showed the best diagnostic performance amongst other panels, and can be considered as a good diagnostic biomarker for detecting cancer in the tissue-based assay. Logistic regression analysis adjusted for the age, gender, and tumor location showed that there was no significant association between the methylation status of components in this panel with patients’ age, gender, and tumor location (Table 10).
Diagnostic performance of panels from different combinations of multiple genes’ promoter methylation for the CRC detection in tissues
Indicates value less than 0.05. PPV, positive predictive value; NPV, negative predictive value.
The association of methylation status of the best tissue and plasma panels with the tumor location, age, and gender of patients
Panel
Variable
OR
95%CI
value
Tissue panel 1 (SPG20a, FBN1a, SEPT9a)
Age
8.64
0.753 to 99.279
0.083
Gender
3.09
0.262 to 36.60
0.370
Tumor location
0.493
0.0350 to 6.903
0.599
Plasma panel 1(SPG20a, FBN1a)
Age
0.961
0.880 to 1.050
0.384
Gender
1.081
0.060 to 19.313
0.956
Tumor location
1.125
0.117 to 38.482
0.610
A panel of SPG20(a) and FBN1(a) methylation in the plasma cfDNA showed excellent diagnostic performance for discriminating CRC patients from normal healthy controls
As mentioned earlier, the methylation levels of FBN1(a), SPG20(a), SPG20(c), and SNCA(c) were significantly higher in patients’ plasma cfDNA than the matched normal tissues while the SPG20(c) and SNCA(c) methylation showed poor diagnostic performance (AUC 0.7). The methylation level of SEPT9(a) was significantly higher in patients’ plasma cfDNA than in plasma cfDNA of healthy controls but it showed weakly diagnostic value (AUC 0.8) for CRC detection. To achieve higher diagnostic performance, we evaluated different combinations of promoter methylation of FBN1(a), SPG20(a), SPG20(c), SNCA(c), and SEPT9(a) regions in the plasma cfDNA as a panel for CRC detection. Thirteen combinations were considered which are given in Table 11. Plasma panel 1 which consisted of SPG20(a) and FBN1(a) regions yielded an excellent diagnostic performance (AUC 0.941, 0.0001) with a sensitivity of 91.1%, a specificity of 97%, a positive predictive value of 96.9%, and a negative predictive value of 91.7% (Fig. 11 and Table 11). On the other hand, plasma panels 2 to 6 which comprised of different regions of SPG20, FBN1, SEPT9, and SNCA showed good diagnostic performance (AUC 0.8, 0.0001). Panel 13 which entailed SEPT9(a) and SNCA(c) regions failed in diagnostic performance (AUC 0.583, 0.0001). Thus, plasma panel 1 showed the best diagnostic performance among other panels, and can, therefore, be considered for discriminating the colorectal cancer patients from normal healthy persons in the plasma-based assay. Logistic regression analysis adjusted for the age, gender, and tumor location showed that there was no significant association between the methylation status of this panel with patients’ age, gender, and tumor location (Table 10). Agreement between the results of SPG20(a)/FBN1(a) panel in tumor tissue and the matched plasma samples were evaluated using kappa statistics. The result showed kappa value of 0.636 indicating a substantial agreement between this panel of the plasma cfDNA and the tumor tissue DNA. An exact McNemar test determined that there was not a significant difference in the results of FBN1/SPG20 methylation panel between tumor tissues and the matched plasma samples ( 0.500).
Diagnostic performance of panels from different combinations of multiple genes’ promoter in plasma cfDNA for detecting patients affected with CRC from normal healthy patients
Locus
AUC
95% CI
value
Sensitivity (%)
Specificity (%)
PPV (%)
NPV (%)
Panel 1:SPG20a, FBN1a
0.941
0.885–0.997
0.001
91.1
97.0
96.9
91.7
Panel 2:SPG20a, FBN1a, SEPT9a
0.864
0.791–0.936
0.001
84.0
88.6
88.1
84.8
Panel 3:SPG20a, FBN1a, SNCAc
0.847
0.764–0.931
0.001
88.8
80.5
82.1
87.9
Panel 4:SPG20a, SPG20c, FBN1a
0.840
0.756–0.924
0.001
83.7
84.2
83.8
84.2
Panel 5: SPG20c, FBN1a
0.810
0.708–0.913
0.001
79.3
82.7
82.1
80.0
Panel 6:FBN1a, SEPT9a
0.806
0.717–0.859
0.001
69.4
91.6
89.3
75
Panel 7:SPG20a, SPG20c, FBN1a, SNCAc
0.766
0.675–0.849
0.001
90.4
61.9
70.4
86.7
Panel 8:SPG20a, SPG20c, FBN1a, SEPT9a, SNCAc
0.745
0.665–0.828
0.001
87.7
61.2
87.7
61.2
Panel 9: SPG20a, SEPT9, SNCAc
0.750
0.654–0.846
0.001
75.0
75.0
75.0
75.0
Panel 10:SPG20a, SEPT9a
0.736
0.639–0.833
0.001
58.3
88.8
84.0
68.0
Panel 11:SPG20a, SPG20c, FBN1a, SEPT9a
0.735
0.647–0.823
0.001
77.5
69.3
71.7
75.6
Panel 12:SPG20c, FBN1a, SEPT9a, SNCAc
0.707
0.613–0.802
0.001
85.3
56.1
66.0
79.3
Panel 13:SEPT9a, SNCAc
0.583
0.460–0.707
0.001
46.6
70.0
60.0
56.8
Indicates value less than 0.05. PPV, positive predictive value; NPV, negative predictive value.
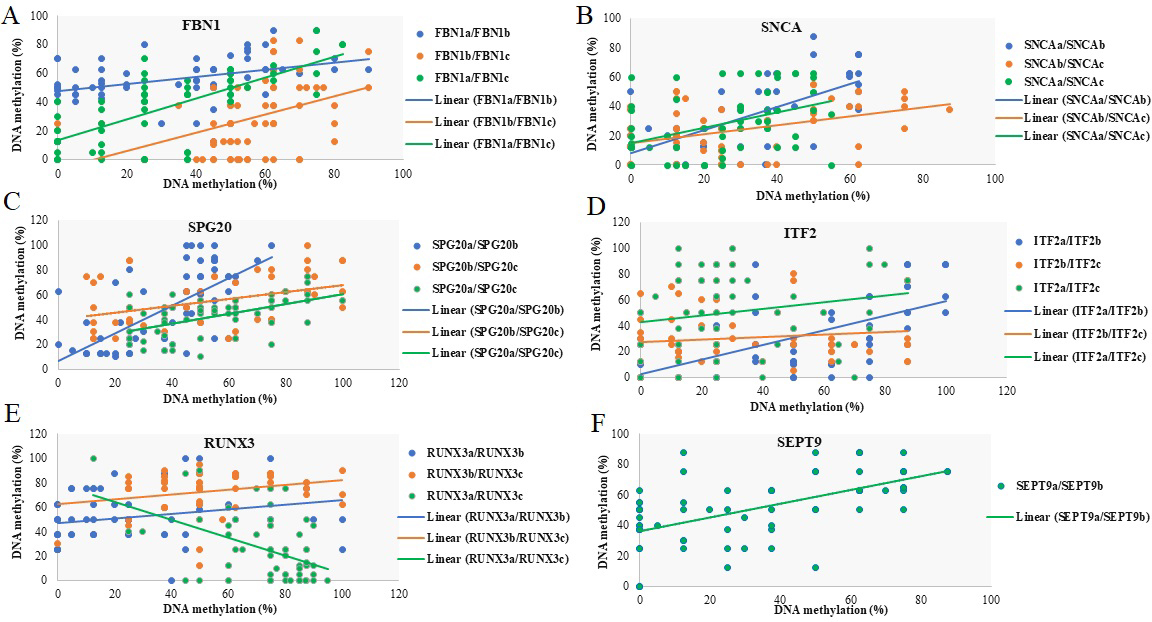
Relationship between DNA methylation at different promoter regions of FBN1, RUNX3, SNCA, ITF2, SPG20, and SEPT9 genes. Scatter plot of DNA methylation in each selected region of a promoter versus another region of that promoter. Lines represent the line of best fit. Points show the methylation levels of two regions in each sample. Except for RUNX3(a)/RUNX3(c), the plots show a positive correlation between the methylation of different regions of each promoter.
Correlation between methylation levels at different promoter regions of FBN1, RUNX3, SNCA, ITF2, SPG20, and SEPT9 genes. Kendall tau rank correlation coefficient () of 1 indicates a perfect correlation of ranks a of zero indicates no correlation between ranks, and a of 1 indicates a perfect negative correlation of ranks
Gene
Location a
Location b
Location c
SPG20
Location a
Correlation coefficient valueN
1.0000 69
0.528 0.00169
0.520 0.00166
Location b
Correlation coefficient valueN
0.528 0.00169
1.0000 69
0.396 0.00166
Location c
Correlation coefficient valueN
0.520 0.00166
0.396 0.00166
1.0000 66
RUNX3
Location a
Correlation coefficient valueN
1.0000 69
0.2360.01267
0.2750.00363
Location b
Correlation coefficient valueN
0.2360.01267
1.0000 67
0.1870.05462
Location c
Correlation coefficient valueN
0.2750.00363
0.1870.05462
1.0000 63
ITF2
Location a
Correlation coefficient valueN
1.0000 69
0.469 0.00169
0.1720.05769
Location b
Correlation coefficient valueN
0.469 0.00169
1.0000 69
0.1210.18169
Location c
Correlation coefficient valueN
0.1720.05769
0.1210.18169
1.0000 69
SNCA
Location a
Correlation coefficient valueN
1.0000 65
0.496 0.00164
0.3230.00162
Location b
Correlation coefficient valueN
0.496 0.00164
1.0000 68
0.2880.00265
Location c
Correlation coefficient valueN
0.3230.00162
0.2880.00265
1.0000 66
FBN1
Location a
Correlation coefficient valueN
1.0000 69
0.357 0.00165
0.556 0.00169
Location b
Correlation coefficient valueN
0.357 0.00165
10 65
0.368 0.00165
Location c
Correlation coefficient valueN
0.556 0.00169
0.368 0.00165
10 69
SEPT9
Location a
Correlation coefficient valueN
1.0000 69
0.466 0.00168
Location b
Correlation coefficient valueN
0.466 0.00168
1.0000 68
Indicates value less than 0.05.
Methylation of different promoter regions of SPG20, SNCA, FBN1, and SEPT9 genes are changed concordantly
Except for RUNX3 and ITF2 promoter regions, there was a significant positive correlation between the methylation of different regions of each promoter ( 0, 0.05). No statistically significant correlation was observed in the methylation of RUNX3(b)/RUNX3(c), ITF2(a)/ITF2(c) and ITF2(b)/ITF2(c) ( 0.05). Interestingly, there was a significant negative correlation between the methylation of RUNX3(a)/RUNX3(c) ( 0, 0.05) (Fig. 12 and Table 12).
Discussion
It is now well confirmed that a wide range of tumor suppressor genes are hyper-methylated in cancers like colorectal cancer and they can be considered as potential biomarkers for noninvasive screening methods [42, 43, 44]. However, successful translation of the candidate biomarkers into clinical practice requires high diagnostic performance [45]. Most methylated candidate genes are not commercialized as diagnostic biomarkers in the cfDNA [46]. The Epi proColon test (SEPT9 gene methylation assay) is the only molecular blood-based test that has been granted FDA approval as a screening method for colorectal cancer [47]. The combination of multiple biomarkers into a panel has become a trend in cancer detection. However, this trend is at its initial stage, and further research is still needed to evaluate the effect of multiple-gene panels for improving the diagnostic accuracy for colorectal cancer [48].
In this study, we evaluated the feasibility of the plasma cfDNA methylation analysis in eighteen promoter regions of SPG20, FBN1, SNCA, ITF2, RUNX3, MLH1, and SEPT9 genes as a noninvasive blood-based assay for identifying CRC patients. To the best of our knowledge, this is the first study investigating the DNA methylation status of FBN1, SNCA, and ITF2 genes in the plasma cfDNA of CRC patients. The results of our study indicated that the methylation level of FBN1, ITF2, SNCA, SPG20, SEPT9, and MLH1 genes were higher in tumor tissues than the paired normal adjacent tissues, emphasizing the potential application of these biomarkers for CRC diagnosis in the tissue DNA. Evaluation of the diagnostic value of every single biomarker showed that the methylation of FBN1(a), FBN1(b), SPG20(a), SPG20(b), SPG20(c), and SEPT9(a) regions showed good diagnostic performance in the tissue DNA analysis (AUC 0.8, 0.01). SPG20 methylation was found to be the most sensitive biomarker (sensitivity of 89.9%) and SEPT9 methylation was found to be the most specific one (specificity of 97%) for discriminating the tumor tissues from normal adjacent ones.
Plasma cfDNA showed higher methylation level of FBN1(a), SEPT9(a), SPG20(a), SPG20(c), SNCA(c) regions compared with the normal tissues or plasma cfDNAs of the healthy controls, highlighting the potential application of these plasma biomarkers for CRC detection.
The methylation levels of all selected regions of ITF2 promoter were higher in patients’ plasma compared with the tumor tissues. Due to these false-positive results, we could not consider ITF2 methylation for the diagnostic assays in the plasma cfDNA. Although ITF2 methylation is not yet studied in the plasma or stool samples, it is shown to be associated with different subtypes of colorectal cancer [33]. Therefore, additional studies are needed to evaluate the significance of its methylation as a noninvasive biomarker for detecting CRC.
Hyper-methylation of RUNX3 promoter is known to be associated with many types of cancer, including colorectal cancer [25, 27] though further investigation is needed to apply it as a noninvasive biomarker [49]. In our study, the RUNX3 gene exhibited hyper-methylation in both tumor tissues and normal adjacent tissues. Contrary to the earlier studies, our data showed that the methylation of RUNX3 promoter cannot effectively discriminate tumor tissues from normal colon tissues (AUC 0.6). Inconsistent results may be due to the different studied promoter regions from previous studies. Therefore, we may need to investigate other regions of RUNX3 promoter in future studies.
In sporadic CRC, MLH1 silencing is commonly due to the promoter methylation but studies on MLH1 promoter methylation have shown inconsistent results [30, 50]. Our results indicated that the methylation level of MLH1 was higher in CRC tissues compared with the normal colon tissues, but its diagnostic performance was ineffective for CRC detection in tissue DNA (AUC 0.6). On the other hand, the methylation levels of MLH1 were not higher in patients’ plasma than the paired normal tissues. Thus, our selected region of MLH1 promoter may not be suitable as a diagnostic assay for CRC in the plasma cfDNA.
Studies have shown that the methylation analysis of SNCA promoter in the stool sample might be a biomarker for CRC detection [51] though methylation of SNCA promoter is not yet studied in plasma cfDNA. In our study, SNCA(c) region showed higher methylation levels in patients’ plasma than the normal tissues, but it showed poor diagnostic performance in both tissue DNA and plasma cfDNA (AUC 0.7). We suggest investigating other regions of SNCA promoter that could reach a greater diagnostic precision for CRC detection.
In this study, evaluation of the diagnostic value of each suitable biomarker in the plasma cfDNA indicated that FBN1(a) and SPG20(a) methylation showed good diagnostic performance (AUC 0.8, 0.01). FBN1 methylation was found to be the most sensitive biomarker (sensitivity of 81.5%) and SEPT9 methylation was found to be the most specific biomarker (specificity of 100%) for CRC detection in the plasma cfDNA. The prevalence of FBN1 promoter methylation in the tumor tissues (74%) was consistent with Guo Qi et al., and Li Wen et al. (78.7% and 77.5% respectively), whereas normal colon tissues were rarely methylated [51, 52]. However, it was not yet studied in plasma cfDNA. To the best of our knowledge, for the first time in this study, it was shown that the FBN1 promoter methylation could be used as a plasma cfDNA biomarker for CRC detection. The optimal cut-off value for hyper-methylation in FBN1(a) was 12.5% with a sensitivity of 81.5% and a specificity of 66.2% (AUC 0.808) in the plasma-based assay. The sensitivity of FBN1 promoter methylation in the plasma cfDNA was better than the sensitivity of stool-based tests (72%), but the observed specificity in our study was lower than the specificity of the stool-based tests (93.3%) in the previous study [52].
Studies have shown that the promoter hyper-methyla-tion of SPG20 is an early event in the process of tumorigenesis in the colorectal cells [53], in spite of several studies about the diagnostic relevance of SPG20 promoter methylation in the stool samples, there is only one study investigating the SPG20 methylation status in the plasma samples [54]. Zhang et al. [14] analyzed SPG20 methylation in tissue and stool samples of CRC patients using the MSP method. Their study showed the sensitivity and specificity of 80.2% and 100% for detecting CRC in the stool samples. Their result in the stool samples is comparable with our results in the plasma cfDNA. The optimal cut-off value for hyper-methylation in SPG20(a) was 37.5% with a sensitivity of 73.3%, a specificity of 94% (AUC 0.819) in plasma cfDNA assay. Results from our study were comparable with Rezvani et al. reports [54], whereby the methylation of SPG20 methylation in the tissue and plasma samples of 37 CRC patients was analyzed by MethyLight method. They demonstrated that the sensitivity and specificity of this marker in the plasma cfDNA are 81.1% and 96.9% respectively. Our study confirmed their findings in a larger sample size. While the cost of MethyLight method can be higher than MS-HRM method [55], and this method can be affected by heterogeneous methylation pattern misleading to the classification of patients as non-methylated, MS-HRM method is designed to bind both methylated and non-methylated DNA, less affected by the heterogeneous pattern of methylation [56]. Therefore, hyper-methylated SPG20 and FBN1 can be considered as suitable noninvasive biomarkers for CRC detection in the plasma cfDNA.
Studies have shown that the methylation analysis of the SEPT9 promoter has good diagnostic performance for the detection of CRC [57]. Our results supported the previous reports that methylated SEPT9 showed good diagnostic performance in tissue DNA analysis (AUC 0.876), with high specificity (95.5%) and moderate sensitivity (75%). However, in the plasma cfDNA analysis, despite its high specificity (100%), the sensitivity was low (58.7%) leading to poor diagnostic performance (AUC 0.763). Wassekort et al. study [58] showed that the hyper-methylation of SEPT9 occurs only in a specific CpG islands of its promoter region which is probably an early event in the process of cancer progression. Sharif et al. [59] also reported higher sensitivity and specificity of the methylation marker in this specific region of SEPT9 promoter compared with another region. This region spans the site (a) that was evaluated in our study. Our results showed that the diagnostic performance of the methylated SEPT9(a) region was higher compared with the SEPT9(b) region in tumor tissues and matched plasma samples. These findings provide further evidence that this region can be a significant informative site for CRC detection. However, combining SEPT9 with other methylation biomarkers to develop a methylation panel will be a good strategy to reach better diagnostic performance.
Since cancer is a heterogeneous disease, no single biomarker can provide 100% sensitivity and specificity [60]. To improve the detection rate, we assessed the performance of the combination of methylated biomarkers as a panel in the tissue and plasma-based assay. We evaluated twenty-one combinations of different promoter regions as panels for CRC detection in tissue. The highest values of diagnostic performance were obtained when the methylation of the SPG20(a), FBN1(a), and SEPT9(a) regions were used in combination. The AUC of this panel was 0.949, while every single biomarker had AUC 0.9. The combined sensitivity and specificity of this panel were 94.2% and 95.6% respectively, while every single biomarker had lower sensitivity or specificity making the diagnostic performance of this panel outstanding. These results demonstrate the potential advantage of combining different methylation biomarkers for CRC diagnostics. Diagnostic performance of SPG20(a), FBN1(a), and SEPT9(a) panel is comparable with the six-gene panel reported by Lind et al. [61] whereby a panel of CNRIP1, FBN1, INA, MAL, SNCA, and SPG20 genes in CRC tumor tissues of CRC reporting to have the sensitivity of 94% and the specificity of 98%. Eight other panels also showed acceptable performance (AUC 0.8), but their diagnostic values were not higher than the individual biomarkers.
To find the best panel of biomarkers for CRC detection in plasma cfDNA, thirteen combinations of suitable plasma biomarkers were evaluated. The highest values of diagnostic performance were obtained in the panel which consisted of SPG20(a) and FBN1(a) regions. Diagnostic values of this panel in plasma cfDNA were greater than that of any biomarker alone. The AUC of this panel was 0.941, while every single biomarker had AUC 0.9. The combined sensitivity and specificity of this panel increased to 91.1% and 97% respectively, while every single biomarker had lower sensitivity or specificity. Five other panels also showed acceptable performance (AUC 0.8), but their diagnostic values were not higher than any individual biomarker. Substantial consistency of the combined methylation analysis of SPG20 and FBN1 between plasma cfDNA and tumor tissue DNA (kappa value 0.636) demonstrates that the methylation analysis of plasma cfDNA is a viable alternative to tissue DNA analysis. Therefore, the methylation panel of SPG20 and FBN1 genes provides a noninvasive effective test for CRC detection in the plasma. Li et al. [51] analyzed FBN1 and SNCA methylation status in the tissue and stool samples in 89 CRC patients. Combination of the methylation status of these genes was found to have the sensitivity and specificity of 84.3% and 93.3%, respectively. In our study, the sensitivity of the FBN1/SPG20 panel in plasma cfDNA was higher than the reported sensitivity of the FBN1/SNCA panel in the stool. In a large cohort, Epi proColon 2.0 (test for methylated SEPT9 in cfDNA) presented a sensitivity of 68% and a specificity of 79% in the plasma-based assay [62]. Our panel showed higher sensitivity (91.1%) and specificity (97%) than Epi proColon 2.0. A recent meta-analysis about diagnostic performance of the methylated SEPT9 reported that the pooled estimated sensitivity of methylated SEPT9 was 69%, while its specificity was 92%, showing an AUC of 0.89 for detecting CRC. Although we observed a similar level of specificity, the observed sensitivity of the FBN1/SPG20 panel was higher than the previous report [63]. This may be due to MS-HRM method which have been used in this study. Also, in our study we have investigated more CpG islands within the promoter region increasing the screening potential of our method. Although methylated SEPT9 was the only molecular blood-based biomarker which is approved by FDA for CRC screening, its sensitivity did not confer any obvious advantage over the fecal immunochemical test (FIT) [48]. A recent systematic review of FITs in CRC screening demonstrated that the FITs sensitivity for detecting CRC fluctuated from 73% to 88% while its specificity ranged from 90% to 96% [64]. Overall, compared with other CRC detection tests, the performance of our two-gene methylation panel in the plasma cfDNA is comparable to that quoted for FOBT, FIT, and serum tumor markers. Although we observed similar specificity to that of three serum tumor markers, the sensitivity of our panel was 91.1%, which was higher than the reported sensitivity for FOBT, FIT, and CEA tests [37, 65].
Choosing the suitable CpG island regions upstream of a gene is a critical step during seeking DNA methylation biomarkers for cancer detection. Emerging evidence suggests that only methylation of some CpG islands in the promoter region and the first exon of genes are biologically and clinically relevant, whereas hyper-methylation of other promoter regions might not have a significant effect on the gene silencing. As a result, the diagnostic performance of methylation biomarkers could vary depending on the location of the studied CpG islands [66, 67]. Therefore, we scanned multiple regions in each gene from the distal promoter regions to the first coding sequence (CDS) to select the regions harboring the most diagnostic potential. Our finding showed that the methylation level of some genes like FBN1, ITF2, SNCA, and RUNX3 increased in CpG islands near CDS. In RUNX3, this result is consistent with Homma et al. study [68] that showed hyper-methylation of RUNX3 gene near the transcription start site is associated with gene silencing, whereas the 5’ and 3’ outskirt regions are more prone for methylation which is not associated with gene silencing [68]. Since the expression of this gene was not investigated in this study, it may not be silenced due to the low methylation level of this site. On the other hand, SEPT9 and SPG20 were more methylated in the upstream CpG islands to start codon.
In our selected biomarkers, methylation at the nearest regions to the transcription start sites showed better diagnostic values. In the SPG20 gene, the hyper-methylated CpG islands located in roughly 20 Kb downstream of the TSS effectively discriminate tumor tissues from normal colon tissues though it is nearer to TSS compared with other studied regions. This observation is consistent with the novel insights about the location of DNA hyper-methylation outside the classical promoter CpG islands [69]. Based on our results, the methylation level of the targeted promoter regions of each gene showed significant positive correlation with each other, suggesting that one molecular defect induced hyper-methylation of multiple CpG islands simultaneously or the positive feedback of methylation in one site on the other regions. The only exceptions were RUNX3 and ITF2 genes, in which the methylation status in different promoter regions was independent from each other.
We also evaluated the association between clinico-pathological features and methylation status of each promoter region. Disease-specific methylation profile is another factor to be considered in the selection of good diagnostic biomarkers. Age and gender-dependent methylation will exclude a biomarker from ideal ones [70]. In this study, in female patients, a higher level of methylation in FBN(b) and SNCA(b) regions was observed. RUNX3(b), SNCA(a), SNCA(c), and SPG20(c) showed a higher level of methylation in patients aged over 50 years. Since proximal and distal colon show heterogeneous clinico-pathological characteristics [71], some genes’ promoters displayed different levels of methylation in different anatomical locations of tumors [70]. Both colonoscopy and stool-based tests detect distal colorectal cancer with higher sensitivity [72, 73]. Therefore, it is essential that a diagnostic methylation biomarker detects tumor-specific methylation independent of its location. Different studied panels in our study were independent on tumor location too. Except for the above-mentioned locations, the performances of our tissue-based and plasma-based panels were independent of the patients’ age and gender, as well as tumor location, histology, and tumor grade.
Studies suggested that neoadjuvant chemo-radiothe- rapy can induce epigenetic changes [74]. Therefore, we examined whether neoadjuvant treatment could affect the methylation levels of our biomarkers. Results revealed that the methylation levels in twelve out of 18 regions were lower in patients undergone previous chemotherapy and two out of 18 regions had lower methylation levels in patients undergone radiotherapy. There have been limited studies of the effect of chemo-radiotherapy on loci-specific DNA methylation, and the processes leading to the aberrant DNA methylation in response to neoadjuvant treatment has not been well described. Decreased expression of DNA methyltransferases 1 (DNMT1) may be a mechanism of DNA hypo-methylation in response to neoadjuvant treatment. Studies suggested that DNA methylation profiling in response to radiotherapy was non-random. Characterization of DNA methylation changes that result from neoadjuvant treatment may lead to new targets for epigenetic therapies [75, 76].
Conclusion
In this study, we demonstrated that the methylation levels of SEPT9, SPG20, FBN1, ITF2, SNCA, and MLH1 genes were higher in CRC tumor tissues than their paired normal adjacent tissues. A panel of FBN1, SPG20, and SEPT9 genes had an excellent diagnostic performance for detecting CRC in the tissue-based assays. Methylation analysis of these genes, either alone or in combination, may serve as a useful biomarker for CRC screening and diagnosis. Combined methylation analysis of FBN1 and SPG20 genes had higher diagnostic performance than any single biomarker in the plasma-based assays. It is suggested that the FBN1 and SPG20 methylation panel might be an excellent combination for CRC detection with high sensitivity and specificity in the plasma cfDNA. Among different selected regions of FBN1 and SPG20 genes, the nearest region to first CDS showed the better diagnostic value in the plasma. Methylation analysis of FBN1/SPG20 panel has shown promise as a noninvasive detection test of colorectal cancer though the application of this panel in the clinical practice requires verification in patients suffering from different stages of colorectal cancer in future.
Ethical approval and consent to participate
This study had been approved by Ethics Committee of Pasteur Institute of Iran (ethical code: IR.PII.REC. 1398.055) in accordance with the relevant guidelines and regulations. All patients had informed about the research and signed the written consent before operation.
Consent for publication
Not applicable (N/A).
Availability of supporting data
The data that support the findings of this study are available from the corresponding author upon reasonable request.
Competing interest
The authors declare that they have no competing interests.
Funding statement
This study was funded as Ph.D. student project by Pasteur Institute of Iran (96/0110/16440) and Pasteur Institute of Iran (Grant Number: 822) and Iranian National Science Foundation (INSF) grant Number: 90001544.
Authors’ contributions
Maryam Alizadeh-Sedigh has contributed to the concept, data collection, data analysis, and writing the draft of the manuscript. Mohammad Sadegh Fazeli has contributed to data collection. Habibollah Mahmoodzadeh has contributed to data collection. Shahin Behrouz-Sharif has contributed to data analysis. Ladan Teimoori-Toolabi has contributed to supervision, fund acquisition, data analysis, and reviewing the draft of the manuscript. All authors reviewed the manuscript.
Footnotes
Acknowledgments
We hereby than the staff of operation room in Imam Khomeini Hospital and Cancer Institute Hospital.
References
1.
SiegelR.L.MillerK.D.Goding SauerA.FedewaS.A.ButterlyL.F.AndersonJ.C. et al., Colorectal cancer statistics, 2020, CA: A Cancer Journal for Clinicians, 2020.
2.
RawlaP.SunkaraT. and BarsoukA., Epidemiology of colorectal cancer: Incidence, mortality, survival, and risk factors, PrzeglaÌœd Gastroenterologiczny4(2) (2019), 89.
3.
SungH.FerlayJ.SiegelR.L.LaversanneM.SoerjomataramI.JemalA. et al., Global cancer statistics 2020: GLOBOCAN estimates of incidence and mortality worldwide for 36 cancers in 185 countries, CA: A Cancer Journal for Clinicians71(3) (2021), 209–249.
4.
ColaceL.BocciaS.De MariaR. and ZeunerA., Colorectal cancer: towards new challenges and concepts of preventive healthcare, ecancermedicalscience, 2017; 11.
5.
BhattD.B. and EmuakhagbonV.-S., Current trends in colorectal cancer screening, Current Colorectal Cancer Reports15(2) (2019), 45–52.
6.
CesaroniM.PowellJ. and SapienzaC., Validation of methylation biomarkers that distinguish normal colon mucosa of cancer patients from normal colon mucosa of patients without cancer, Cancer Prevention Research7(7) (2014), 717–726.
7.
HiraiH.TsoiK.ChanJ.WongS.ChingJ.WongM. et al., Systematic review with meta-analysis: faecal occult blood tests show lower colorectal cancer detection rates in the proximal colon in colonoscopy-verified diagnostic studies, Alimentary Pharmacology & Therapeutics43(7) (2016), 755–764.
8.
ChiuH.M.LeeY.C.TuC.H.ChenC.C.TsengP.H.LiangJ.T. et al., Association between early stage colon neoplasms and false-negative results from the fecal immunochemical test, Clinical Gastroenterology and Hepatology11(7) (2013), 832–838.e2.
9.
SameerA.S.S., Colorectal cancer: Molecular mutations and polymorphisms, Frontiers in Oncology3 (2013), 114.
10.
WongJ.J.L.HawkinsN.J. and WardR.L., Colorectal cancer: A model for epigenetic tumorigenesis, Gut56(1) (2007), 140–148.
11.
NgJ.M.-K. and YuJ., Promoter hypermethylation of tumour suppressor genes as potential biomarkers in colorectal cancer, International Journal of Molecular Sciences16(2) (2015), 2472–2496.
12.
MaM.ZhuH.ZhangC.SunX.GaoX. and ChenG., “Liquid biopsy” – ctDNA detection with great potential and challenges, Annals of Translational Medicine3(16) (2015).
13.
LockeW.J.GuanzonD.MaC.LiewY.J.DuesingK.R.FungK.Y. et al., DNA methylation cancer biomarkers: Translation to the clinic, Frontiers in Genetics, 2019; 10.
14.
ZhangH.SongY.-C. and DangC.-X., Detection of hypermethylated spastic paraplegia-20 in stool samples of patients with colorectal cancer, International Journal of Medical Sciences10(3) (2013), 230.
15.
OsborneJ.WilsonC.MooreV.GregoryT.FlightI. and YoungG., Sample preference for colorectal cancer screening tests: blood or stool? 2012.
16.
Lofton-DayC.ModelF.DeVosT.TetznerR.DistlerJ.SchusterM. et al., DNA methylation biomarkers for blood-based colorectal cancer screening, Clinical Chemistry54(2) (2008), 414–423.
17.
EsteyM.P.KimM.S. and TrimbleW.S., Septins, Current Biology21(10) (2011), R384–R7.
18.
AngelisD. and SpiliotisE.T., Septin mutations in human cancers, Frontiers in Cell and Developmental Biology4 (2016), 122.
19.
ComeglioP.EvansA.BriceG.CoolingR. and ChildA., Identification of FBN1 gene mutations in patients with ectopia lentis and marfanoid habitus, British Journal of Ophthalmology86(12) (2002), 1359–1362.
20.
ZeyerK.A. and ReinhardtD.P., Fibrillin-containing microfibrils are key signal relay stations for cell function, Journal of Cell Communication and Signaling9(4) (2015), 309–325.
21.
SchrenkS.CenziC.BertalotT.ConconiM.T. and Di LiddoR., Structural and functional failure of fibrillin ‑1 in human diseases, International Journal of Molecular Medicine41(3) (2018), 1213–1223.
22.
BakowskaJ.C.JupilleH.FatheddinP.PuertollanoR. and BlackstoneC., Troyer syndrome protein spartin is mono-ubiquitinated and functions in EGF receptor trafficking, Molecular Biology of The Cell18(5) (2007), 1683–1692.
23.
ConnellJ.W.LindonC.LuzioJ.P. and ReidE., Spastin couples microtubule severing to membrane traffic in completion of cytokinesis and secretion, Traffic10(1) (2009), 42–56.
24.
LindG.RaiborgC.DanielsenS.RognumT.Thiis-EvensenE.HoffG. et al., SPG20, a novel biomarker for early detection of colorectal cancer, encodes a regulator of cytokinesis, Oncogene30(37) (2011), 3967–3978.
25.
NishioM.SakakuraC.NagataT.KomiyamaS.MiyashitaA.HamadaT. et al., RUNX3 promoter methylation in colorectal cancer: Its relationship with microsatellite instability and its suitability as a novel serum tumor marker, Anticancer Research30(7) (2010), 2673–2682.
26.
BaeS.-C. and ChoiJ.-K., Tumor suppressor activity of RUNX3, Oncogene23(24) (2004), 4336–4340.
27.
KuJ.-L.KangS.-B.ShinY.-K.KangH.C.HongS.-H.KimI.-J. et al., Promoter hypermethylation downregulates RUNX3 gene expression in colorectal cancer cell lines, Oncogene23(40) (2004), 6736–6742.
28.
LindG.E.DanielsenS.A.AhlquistT.MerokM.A.AndresenK.SkotheimR.I. et al., Identification of an epigenetic biomarker panel with high sensitivity and specificity for colorectal cancer and adenomas, Molecular Cancer10(1) (2011), 85.
29.
JowaedA.SchmittI.KautO. and WüllnerU., Methylation regulates alpha-synuclein expression and is decreased in Parkinson’s disease patients’ brains, Journal of Neuroscience30(18) (2010), 6355–6359.
30.
KaneM.F.LodaM.GaidaG.M.LipmanJ.MishraR.GoldmanH. et al., Methylation of the hMLH1 promoter correlates with lack of expression of hMLH1 in sporadic colon tumors and mismatch repair-defective human tumor cell lines, Cancer Research57(5) (1997), 808–811.
31.
LynchH.T. and De la ChapelleA., Hereditary colorectal cancer, New England Journal of Medicine348(10) (2003), 919–932.
32.
CunninghamJ.M.ChristensenE.R.TesterD.J.KimC.-Y.RocheP.C.BurgartL.J. et al., Hypermethylation of the hMLH1 promoter in colon cancer with microsatellite instability, Cancer Research58(15) (1998), 3455–3460.
33.
SavioA.J.DaftaryD.DicksE.BuchananD.D.ParfreyP.S.YoungJ.P. et al., Promoter methylation of ITF2, but not APC, is associated with microsatellite instability in two populations of colorectal cancer patients, BMC Cancer16(1) (2016), 113.
34.
SeppM.KannikeK.EesmaaA.UrbM. and TimmuskT., Functional diversity of human basic helix-loop-helix transcription factor TCF4 isoforms generated by alternative 5’ exon usage and splicing, PloS One6(7) (2011), e22138.
35.
JonesS., An overview of the basic helix-loop-helix proteins, Genome Biology5(6) (2004), 1–6.
36.
ShinE.J.KimH.J.SonM.W.AhnT.S.LeeH.Y.LimD.R. et al., Epigenetic inactivation of RUNX3 in colorectal cancer, Annals of Surgical Treatment and Research94(1) (2018), 19–25.
37.
WojdaczT.K. and DobrovicA., Methylation-sensitive high resolution melting (MS-HRM): A new approach for sensitive and high-throughput assessment of methylation, Nucleic Acids Research35(6) (2007), e41.
38.
Behrouz SharifS.HashemzadehS.Mousavi ArdehaieR.EftekharsadatA.GhojazadehM.MehrtashA.H. et al., Detection of aberrant methylated SEPT9 and NTRK3 genes in sporadic colorectal cancer patients as a potential diagnostic biomarker, Oncol Lett12(6) (2016), 5335–5343.
39.
AfgarA.Fard-EsfahaniP.MehrtashA.AzadmaneshK.KhodarahmiF.GhadirM. et al., MiR-339 and especially miR-766 reactivate the expression of tumor suppressor genes in colorectal cancer cell lines through DNA methyltransferase 3B gene inhibition, Cancer Biol Ther17(11) (2016), 1126–1138.
40.
KhatamiF.LarijaniB.HeshmatR.NasiriS.Haddadi-AghdamM.Teimoori-ToolabiL. et al., Hypermethylated RASSF1 and SLC5A8 promoters alongside BRAFV600E mutation as biomarkers for papillary thyroid carcinoma, Journal of Cellular Physiology235(10) (2020), 6954–6968.
41.
SheikholeslamiS.AziziF.GhasemiA.AlibakhshiA.ParsaH.TavangarS.M., et al., NOL4 is downregulated and hyper-methylated in papillary thyroid carcinoma suggesting its role as a tumor suppressor gene, International Journal of Endocrinology and Metabolism18(4) (2020).
42.
MitchellS.M.RossJ.P.DrewH.R.HoT.BrownG.S.SaundersN.F. et al., A panel of genes methylated with high frequency in colorectal cancer, BMC Cancer14(1) (2014), 54.
43.
OhT.KimN.MoonY.KimM.S.HoehnB.D.ParkC.H. et al., Genome-wide identification and validation of a novel methylation biomarker, SDC2, for blood-based detection of colorectal cancer, The Journal of Molecular Diagnostics15(4) (2013), 498–507.
44.
KibriyaM.G.RazaM.JasmineF.RoyS.Paul-BrutusR.RahamanR. et al., A genome-wide DNA methylation study in colorectal carcinoma, BMC Medical Genomics4(1) (2011), 50.
45.
SelleckM.J.SenthilM. and WallN.R., Making meaningful clinical use of biomarkers, Biomarker Insights12 (2017), 1177271917715236.
46.
ZhangX.SongY.-F.LuH.-N.WangD.-P.ZhangX.-S.HuangS.-L. et al., Combined detection of plasma GATA5 and SFRP2 methylation is a valid noninvasive biomarker for colorectal cancer and adenomas, World Journal of Gastroenterology: WJG21(9) (2015), 2629.
47.
RutledgeD.RiojasJ.BestC.EisenbergM. and Kam-MorganL., Epi proColon®: Use of a non-invasive SEPT9 gene methylation blood test for colorectal cancer screening: A national laboratory experience, Journal of Clinical Epigenetics4(1) (2018), 7.
48.
ChenY.WangZ.ZhaoG.SunC.MaY.ZhangL. et al., Performance of a novel blood-based early colorectal cancer screening assay in remaining serum after the blood biochemical test, Disease markers, 2019; 2019.
49.
TanS.-H.IdaH.LauQ.-C.GohB.-C.ChiengW.-S.LohM. et al., Detection of promoter hypermethylation in serum samples of cancer patients by methylation-specific polymerase chain reaction for tumour suppressor genes including RUNX3, Oncology Reports18(5) (2007), 1225–1230.
50.
LiX.YaoX.WangY.HuF.WangF.JiangL. et al., MLH1 promoter methylation frequency in colorectal cancer patients and related clinicopathological and molecular features, PloS One8(3) (2013), e59064.
51.
LiW.-h.ZhangH.GuoQ.WuX.-d.XuZ.-s.DangC.-x. et al., Detection of SNCA and FBN1 methylation in the stool as a biomarker for colorectal cancer, Disease markers, 2015; 2015.
52.
GuoQ.SongY.ZhangH.WuX.XiaP. and DangC., Detection of hypermethylated fibrillin-1 in the stool samples of colorectal cancer patients, Medical Oncology30(4) (2013), 695.
53.
LindG.E.RaiborgC.DanielsenS.RognumT.Thiis-EvensenE.HoffG. et al., SPG20, a novel biomarker for early detection of colorectal cancer, encodes a regulator of cytokinesis, Oncogene30(37) (2011), 3967–3978.
54.
RezvaniN.AlibakhshiR.Vaisi‑RayganiA.BashiriH. and SaidijamM., Detection of SPG20 gene promoter-methylated DNA, as a novel epigenetic biomarker, in plasma for colorectal cancer diagnosis using the MethyLight method, Oncology Letters13(5) (2017), 3277–3284.
55.
HernándezH.G.TseM.Y.PangS.C.ArboledaH. and ForeroD.A., Optimizing methodologies for PCR-based DNA methylation analysis, Biotechniques55(4) (2013), 181–197.
56.
QuillienV.LavenuA.Karayan-TaponL.CarpentierC.LabussièreM.LesimpleT. et al., Comparative assessment of 5 methods (methylation-specific polymerase chain reaction, methylight, pyrosequencing, methylation-sensitive high-resolution melting, and immunohistochemistry) to analyze O6-methylguanine-DNA-methyltranferase in a series of 100 glioblastoma patients, Cancer118(17) (2012), 4201–4211.
57.
ChurchT.R.WandellM.Lofton-DayC.MonginS.J.BurgerM.PayneS.R. et al., Prospective evaluation of methylated SEPT9 in plasma for detection of asymptomatic colorectal cancer, Gut63(2) (2014), 317–325.
58.
WasserkortR.KalmarA.ValczG.SpisakS.KrispinM.TothK. et al., Aberrant septin 9 DNA methylation in colorectal cancer is restricted to a single CpG island, BMC Cancer13(1) (2013), 398.
59.
Behrouz SharifS.HashemzadehS.Mousavi ArdehaieR.EftekharsadatA.GhojazadehM.MehrtashA.H. et al., Detection of aberrant methylated SEPT9 and NTRK3 genes in sporadic colorectal cancer patients as a potential diagnostic biomarker, Oncology Letters12(6) (2016), 5335–5343.
60.
MaruvadaP.WangW.WagnerP.D. and SrivastavaS., Biomarkers in molecular medicine: Cancer detection and diagnosis, Biotechniques38(S4) (2005), S9–S15.
61.
LindG.E.DanielsenS.A.AhlquistT.MerokM.A.AndresenK.SkotheimR.I. et al., Identification of an epigenetic biomarker panel with high sensitivity and specificity for colorectal cancer and adenomas, Molecular Cancer10(1) (2011), 1–15.
62.
PotterN.T.HurbanP.WhiteM.N.WhitlockK.D.Lofton-DayC.E.TetznerR. et al., Validation of a real-time PCR-based qualitative assay for the detection of methylated SEPT9 DNA in human plasma, Clinical Chemistry60(9) (2014), 1183–1191.
63.
HariharanR. and JenkinsM., Utility of the methylated SEPT9 test for the early detection of colorectal cancer: a systematic review and meta-analysis of diagnostic test accuracy, BMJ Open Gastroenterology7(1) (2020).
64.
MeklinJ.SyrjänenK. and EskelinenM., Colorectal cancer screening with traditional and new-generation fecal immunochemical tests: A critical review of fecal occult blood tests, Anticancer Research40(2) (2020), 575–581.
65.
ZhongZ.RaoH.WuH.HuangQ.YuZ. and ZhangQ., Clinical Diagnostic Value for Colorectal cancer Based on Serum CEA, CA24-2 and CA19-9, 2020.
66.
Van VlodropI.J.NiessenH.E.DerksS.BaldewijnsM.M.Van CriekingeW.HermanJ.G. et al., Analysis of promoter CpG island hypermethylation in cancer: location, location, location! Clinical Cancer Research17(13) (2011), 4225–4231.
67.
JainS.WojdaczT.K. and SuY.-H., Challenges for the application of DNA methylation biomarkers in molecular diagnostic testing for cancer, Expert Review of Molecular Diagnostics13(3) (2013), 283–294.
68.
HommaN.TamuraG.HondaT.MatsumotoY.NishizukaS.KawataS. et al., Spreading of methylation within RUNX3 CpG island in gastric cancer, Cancer Science97(1) (2006), 51–56.
69.
IrizarryR.A.Ladd-AcostaC.WenB.WuZ.MontanoC.OnyangoP. et al., The human colon cancer methylome shows similar hypo-and hypermethylation at conserved tissue-specific CpG island shores, Nature Genetics41(2) (2009), 178.
70.
MokarramP.KumarK.BrimH.NaghibalhossainiF.Saberi-firooziM.NouraieM. et al., Distinct high-profile methylated genes in colorectal cancer, PloS One4(9) (2009), e7012.
71.
MorettoR.CremoliniC.RossiniD.PietrantonioF.BattaglinF.MennittoA. et al., Location of primary tumor and benefit from anti-epidermal growth factor receptor monoclonal antibodies in patients with RAS and BRAF wild-type metastatic colorectal cancer, The Oncologist21(8) (2016), 988.
72.
BaxterN.N.GoldwasserM.A.PaszatL.F.SaskinR.UrbachD.R. and RabeneckL., Association of colonoscopy and death from colorectal cancer, Annals of Internal Medicine150(1) (2009), 1–8.
73.
HaugU.KuntzK.M.KnudsenA.HundtS. and BrennerH., Sensitivity of immunochemical faecal occult blood testing for detecting left-vs right-sided colorectal neoplasia, British Journal of Cancer104(11) (2011), 1779–1785.
74.
Cabrera-MuleroA.CrujeirasA.B.IzquierdoA.G.TorresE.AyersD.CasanuevaF.F. et al., Novel SFRP2 DNA methylation profile following neoadjuvant therapy in colorectal cancer patients with different grades of BMI, Journal of Clinical Medicine8(7) (2019), 1041.
75.
HsuP.-C.KadlubarS.A.SiegelE.R.RogersL.J.TodorovaV.K.SuL.J. et al., Genome-wide DNA methylation signatures to predict pathologic complete response from combined neoadjuvant chemotherapy with bevacizumab in breast cancer, Plos One15(4) (2020), e0230248.
76.
AntwihD.A.GabbaraK.M.LancasterW.D.RudenD.M. and ZielskeS.P., Radiation-induced epigenetic DNA methylation modification of radiation-response pathways, Epigenetics8(8) (2013), 839–848.