
Abstract
BACKGROUND:
Image-based biomarkers could have translational implications by characterizing tumor behavior of lung cancers diagnosed during lung cancer screening. In this study, peritumoral and intratumoral radiomics and volume doubling time (VDT) were used to identify high-risk subsets of lung patients diagnosed in lung cancer screening that are associated with poor survival outcomes.
METHODS:
Data and images were acquired from the National Lung Screening Trial. VDT was calculated between two consequent screening intervals approximately 1 year apart; peritumoral and intratumoral radiomics were extracted from the baseline screen. Overall survival (OS) was the main endpoint. Classification and Regression Tree analyses identified the most predictive covariates to classify patient outcomes.
RESULTS:
Decision tree analysis stratified patients into three risk-groups (low, intermediate, and high) based on VDT and one radiomic feature (compactness). High-risk patients had extremely poor survival outcomes (hazard ratio [HR]
CONCLUSION:
We utilized peritumoral and intratumoral radiomic features and VDT to generate a model that identify a high-risk group of screen-detected lung cancers associated with poor survival outcomes. These vulnerable subset of screen-detected lung cancers may be candidates for more aggressive surveillance/follow-up and treatment, such as adjuvant therapy.
Introduction
Four randomized clinical trials demonstrated that screening and early detection of lung cancer by low-dose helical computed tomography (LDCT) reduces overall and lung cancer-specific mortality [1, 2, 6, 11, 33]. However, despite the benefits of early detection, cancer screening can result in overdiagnosis which is the detection of asymptomatic cancers that are non-growing or slow-growing and unlikely fatal if left untreated [10]. Overdiagnosis of pulmonary nodules can result in unnecessary diagnostic procedures that are often invasive, associated with increased costs, and associated with added stress for patients and their families [52]. In the US National Lung Screening Trial (NLST), 10 to 27% lung cancers were overdiagnosed in the LDCT arm of the study [27, 34, 41, 42, 43]. As such, biomarkers that can discriminate between the variability in growth rates and lethal potential [42] of lung cancers diagnosed in lung cancer screening would have important clinical translational implications.
Radiomics is the conversion of medical images into structured, mineable data that can subsequently be utilized for statistical analysis and modeling [9, 12, 13, 17, 25, 28, 29, 44]. Radiomic features have shown to provide rapid and accurate noninvasive biomarkers for lung cancer risk prediction, diagnostics, prognosis, treatment response monitoring, and tumor biology [15, 45, 47]. Radiomics have many advantages over tissue-based biomarkers as they are generated from standard-of-care imaging and they reflect the pathophysiology of the entire imaged tumor or region-of-interest (e.g., screen-detected nodule) and not just the portion of the tumor that was assayed in the case for tissue-based biomarkers.
Volume doubling time (VDT) of a pulmonary nodule, defined as the number of days in which the nodule doubles in volume, is a clinically relevant metric in lung cancer screening. VDT has clinical utility in discriminating between nodules that are infectious/inflammatory, malignant, and benign [30, 46, 51]. Generally, nodules that are of an infectious or inflammatory pathophysiology have a VDT of less than 20 days, a VDT of less than 400 days (and greater than 20 days) represents a high likelihood of malignancy, and a VDT above 500 days is likely a benign nodule [23, 24]. To date, there have been few studies analyzing VDT, a delta-radiomic, as a potential biomarker to evaluate lethal potential of lung cancers diagnosed in lung cancer screening. Thus, using publicly available data and LDCT images from the NLST, we generated radiomic features to determine if we can discriminate between indolent, slow, and aggressive incidentally diagnosed lung cancers. Radiomic features describing size, shape, volume, growth rate (i.e., VDT), and textural characteristics were calculated from the intratumoral region (area within the tumor) and from the peritumoral region (area surrounding the tumor parenchyma). The overarching goal of this study was to utilize radiomics biomarkers to generate parsimonious models to predict lung cancer outcomes in the lung cancer screening setting.
Materials and methods
NLST study population
Deidentified LDCT images and data were obtained from the National Cancer Institute (NCI) Cancer Data Access System (CDAS) [14]. The NLST study design and main findings have been described previously [1, 2]. NLST eligibility criteria included current and former smokers aged 55–74 years with a minimum 30 pack-years smoking history and former smokers had to have quit within the past 15 years.
The present study used a subset of lung cancers diagnosed in the LDCT-arm of the NLST and has been described elsewhere [38]. Briefly, we identified 314 screen-detected, incident lung cancer patients who were not diagnosed with lung cancer at baseline screening (T0) but were subsequently diagnosed with lung cancer either at the first follow-up screening (T1) or second follow-up screening (T2). However, participants were excluded due to several reasons: unavailable complete volumetric images sets, nodules at baseline that could not be identified, and nodules where it was difficult to contour the tumor. Lung cancer patients who had multiple nodules at time of their diagnosis were excluded (
The final analytical cohort included 94 participants who had a negative or positive baseline LDCT screening. Based on NLST criteria, positive screens were defined as abnormalities on baseline screens or at follow-up screens that were new, stable or evolved that resulted as one or more non-calcified masses measuring
Schema for identification of patients diagnosed with cancer at two different timepoints in the NLST.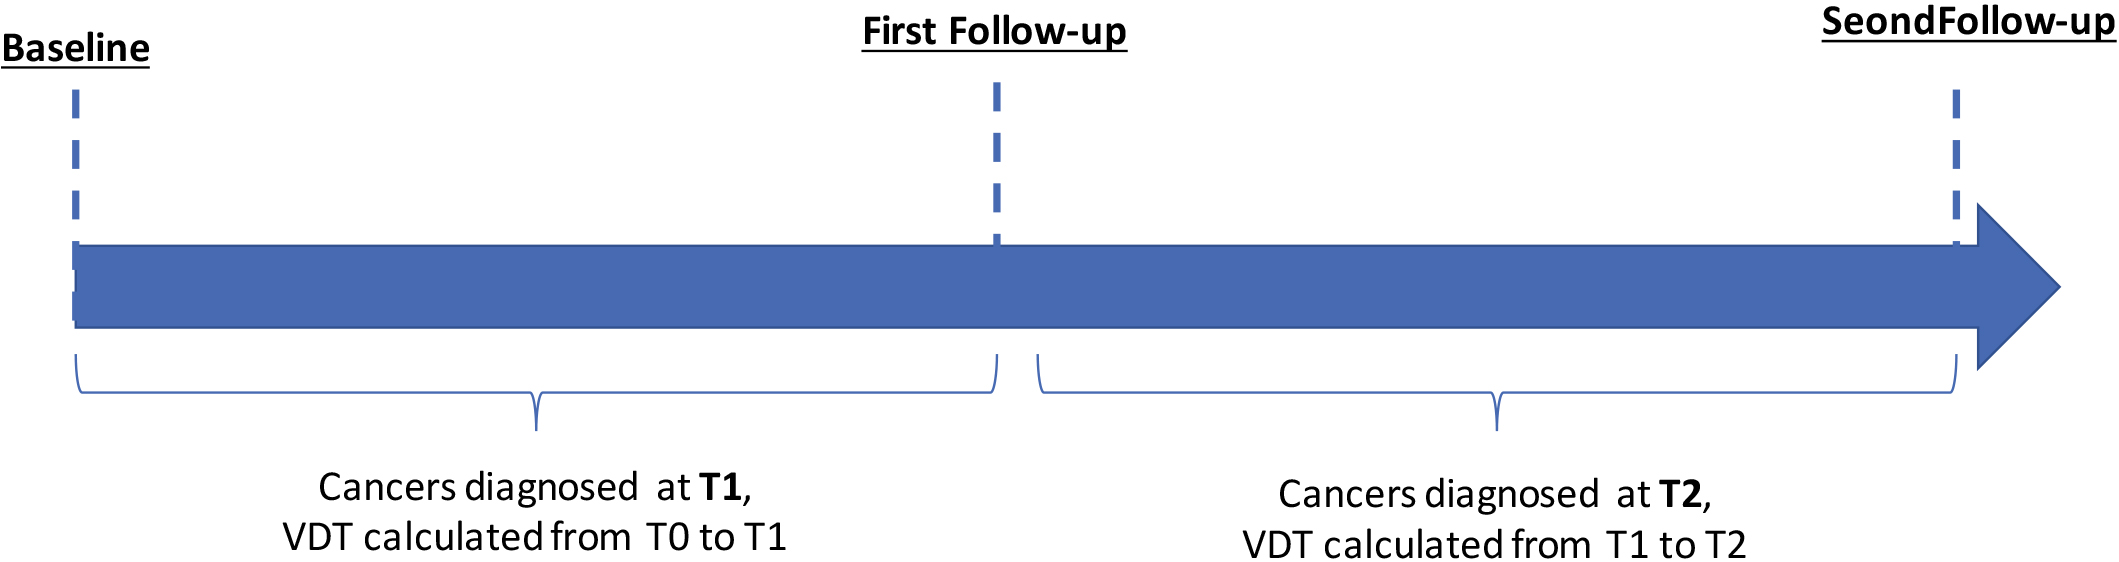
Nodule identification and tumor segmentation has been described in detail elsewhere [17]. Briefly, the tumor mask images (i.e., tumor delineations) were imported into in-house radiomic feature extraction toolboxes created in MATLAB
Using standardized radiomic algorithms from the Image Biomarker Standardization Initiative (IBSI) v5 [56], a total of 264 radiomic features were extracted from the semi-automatically segmented intratumoral region (
Volume doubling time was calculated for the screening interval from T0 to T1 and for the screening interval from T1 to T2 (Fig. 1). Below is the equation for VDT where Ti is the time interval between two LDCT imaging studies,
Radiogenomics analysis
A previously described dataset [39] of surgically resected adenocarcinoma lung cancers who had pre-surgery CTs and gene expression data was used to identify potential biological underpinnings of the most informative radiomic features identified in our analyses. The gene probesets were filtered and determined as significant using the following criteria based on a Student’s
Statistical analysis
Statistical analyses were performed using Stata/MP 14.2 (StataCorp LP, College Station TX), R Project for Statistical Computing (version 3.5.2), and R Studio (version 1.1.463).
Overall survival (OS) and progression-free survival (PFS) were the main endpoints and were assessed from date of lung cancer diagnosis to the date of an event or last follow up. For OS, an event was defined as death and for PFS an event was established as death or progression of cancer. All survival data were right censored at 5-years.
To generate a parsimonious model, the 65 stable radiomic features and VDT were subjected to Classification and Regression Tree (CART) analysis, adapted for survival analysis, to stratify patients into risk groups. The risk groups were analyzed by Cox regression models, Kaplan-Meier survival curves, and log-rank tests. The most informative radiomic features identified in the CART analysis were internally cross-validated using R package “rms” [16]. The Harrell’s concordance index (C-index) was used to evaluate the performance of the multivariable Cox regression models. Backward logistic regression model was used to identify radiomics features significantly associated with VDT dichotomized.
Results
Patient characteristics
The demographics of the lung cancer patients are provided in Table 1. Mean age of enrollment into the NLST was 64.3 years, 58.5% participants were male, 58.5% were current smokers, 55.3% were diagnosed with adenocarcinoma, and 80.8% had an early-stage lung cancer (stage I or II).
Patient characteristics
Patient characteristics
Abbreviations: sd
Risk-groups associated with overall survival for all patients and among early-stage patients diagnosed in the screening interval T0 to T1. (A) Schema identifying patients diagnosed in the screening interval T0 to T1. (B) The tree structure from the classification and regression tree (CART) analysis identified four risk groups based on two radiomics features and VDT. VDT was statistically significant different between very-high, high, and intermediate when compared to low-risk group. (C) Overall survival for VDT dichotomized by 234 days. Overall survival for the risk patient risk groups among all patients (D) and for early-stage (E), and for late-stage patients (F).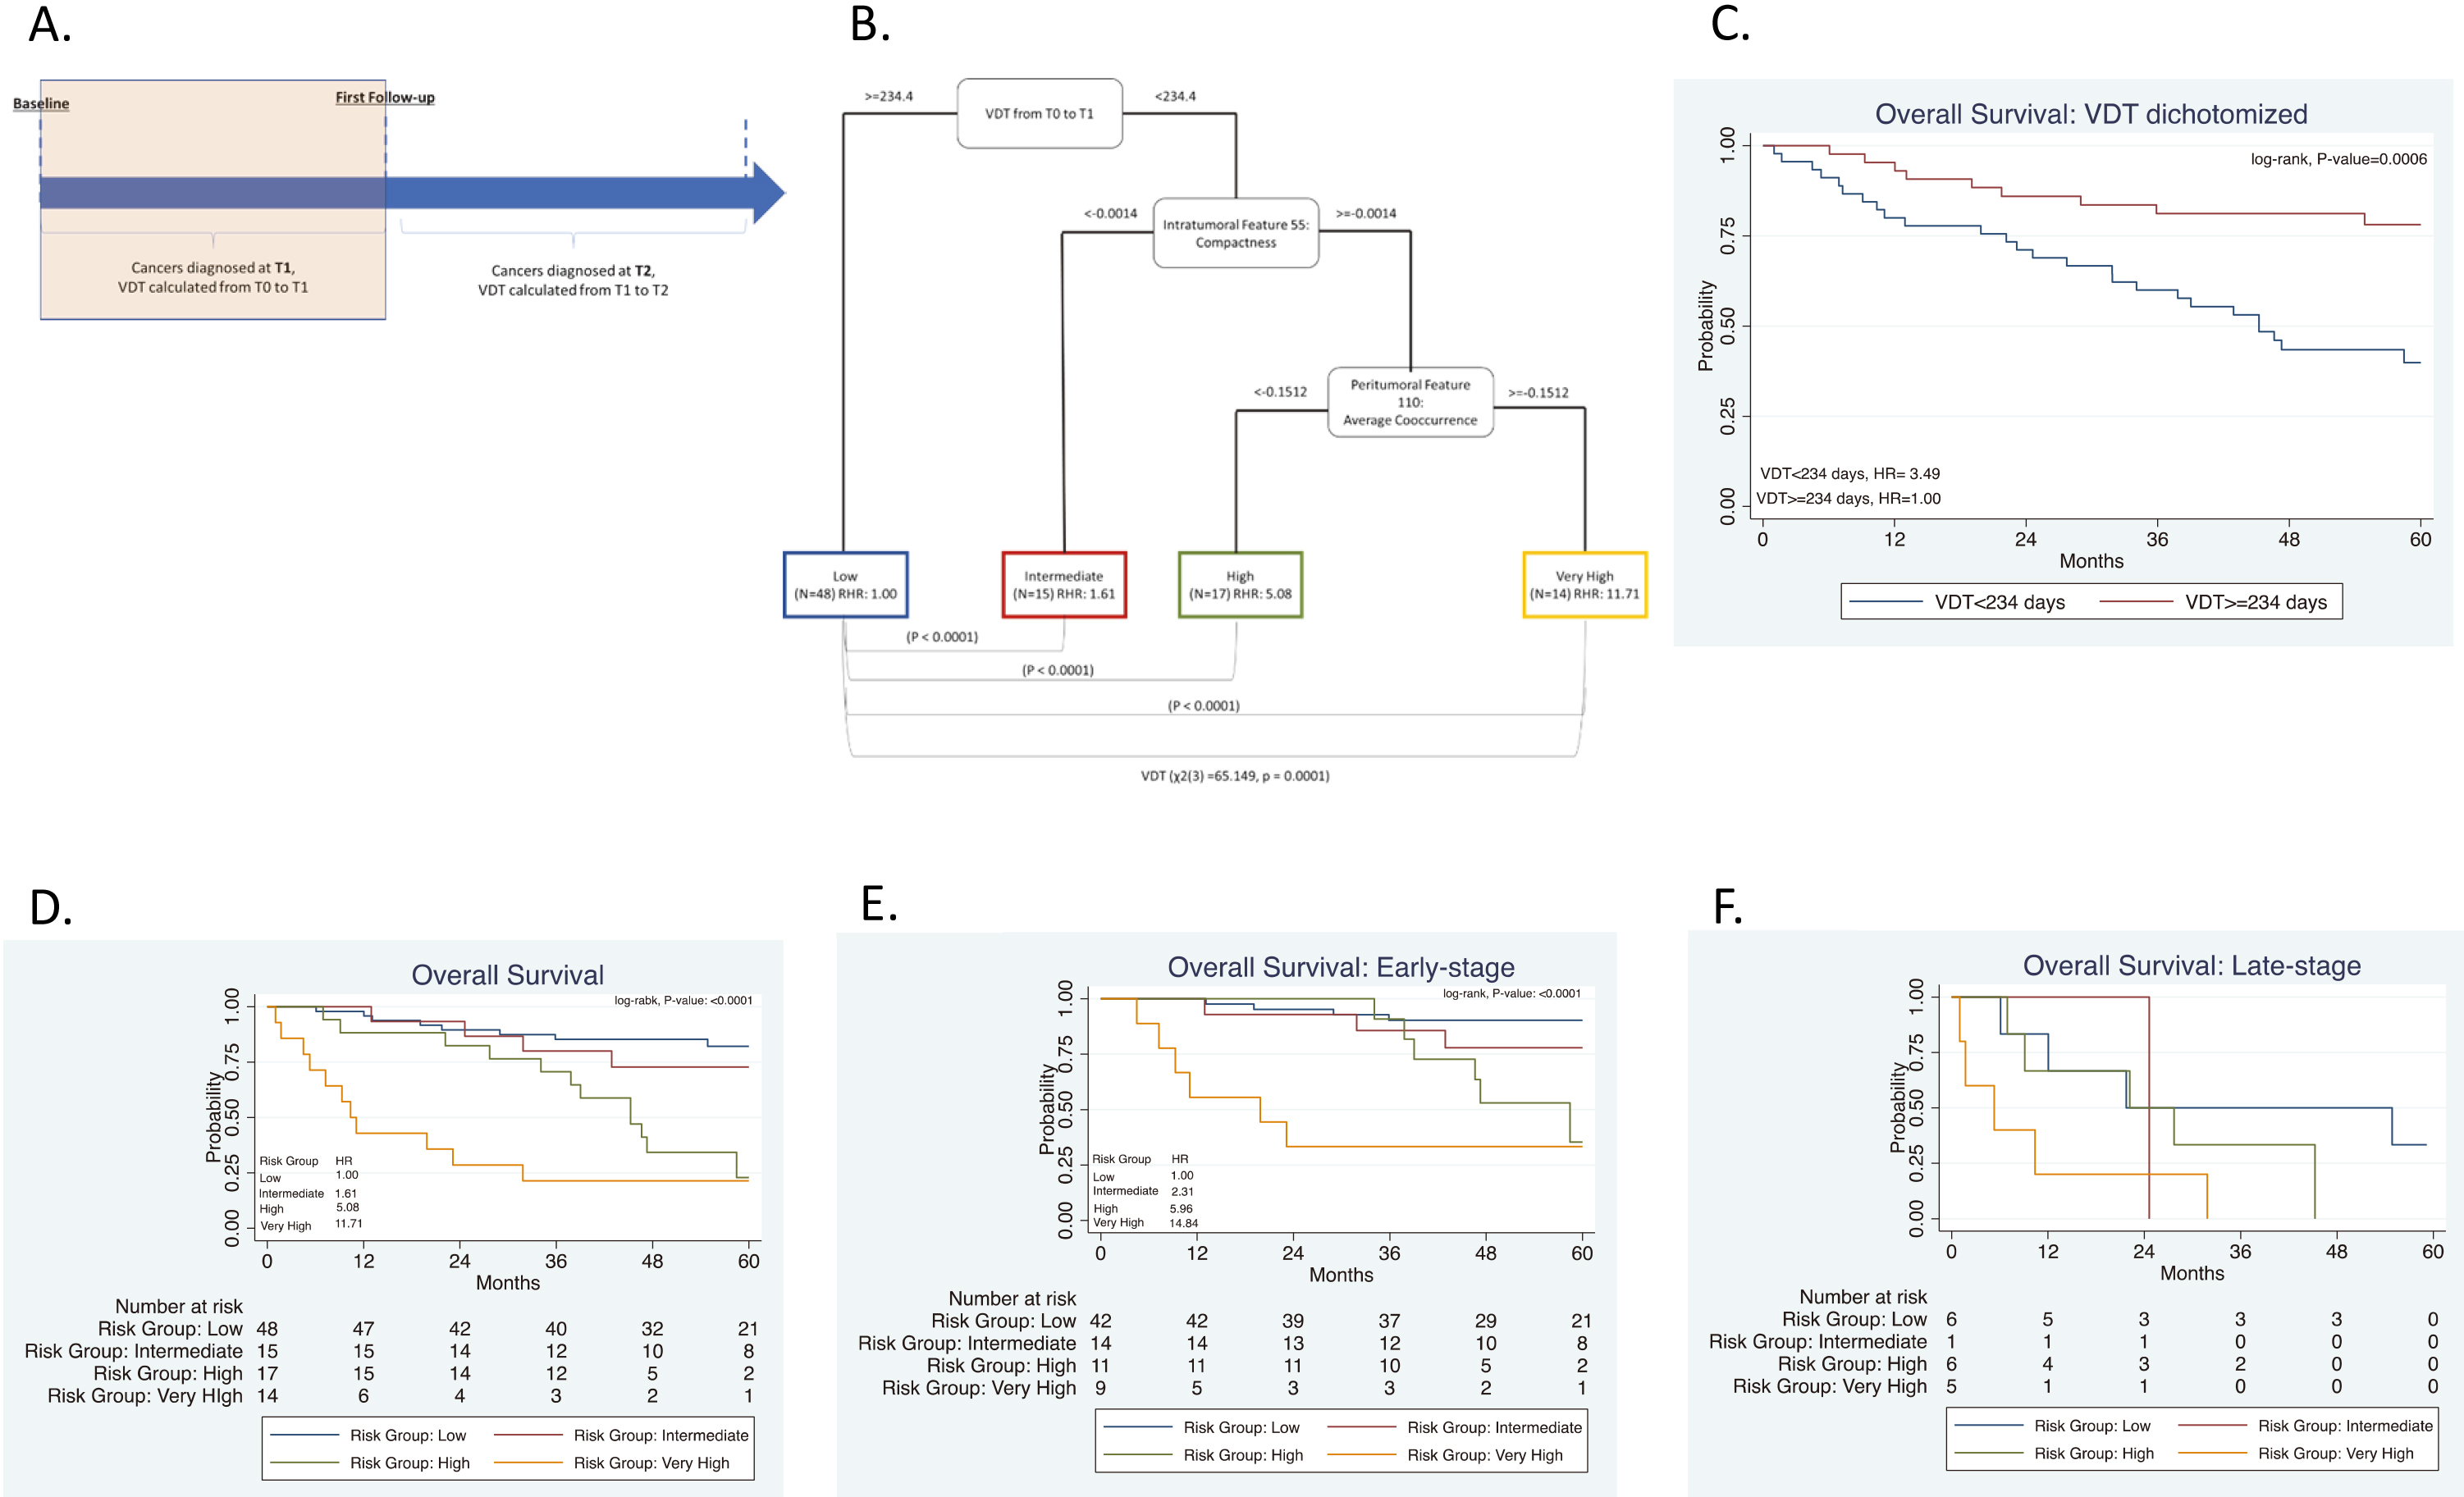
Risk-groups associated with overall survival for all patients and among early-stage patients diagnosed in the screening interval T0 to T1 or T1 to T2. (A) Schema including patients diagnosed in the screening interval T1 to T2. (B) The tree structure from the classification and regression tree analysis (CART) identified three risk groups based on one radiomics feature and VDT. VDT was statistically significant different between high- and intermediate risk groups when compared to low-risk group. (C) Overall survival for VDT dichotomized by 279 days. Overall survival for the risk patient risk groups among all patients (D) and for early-stage (E), and for late-stage patients (F).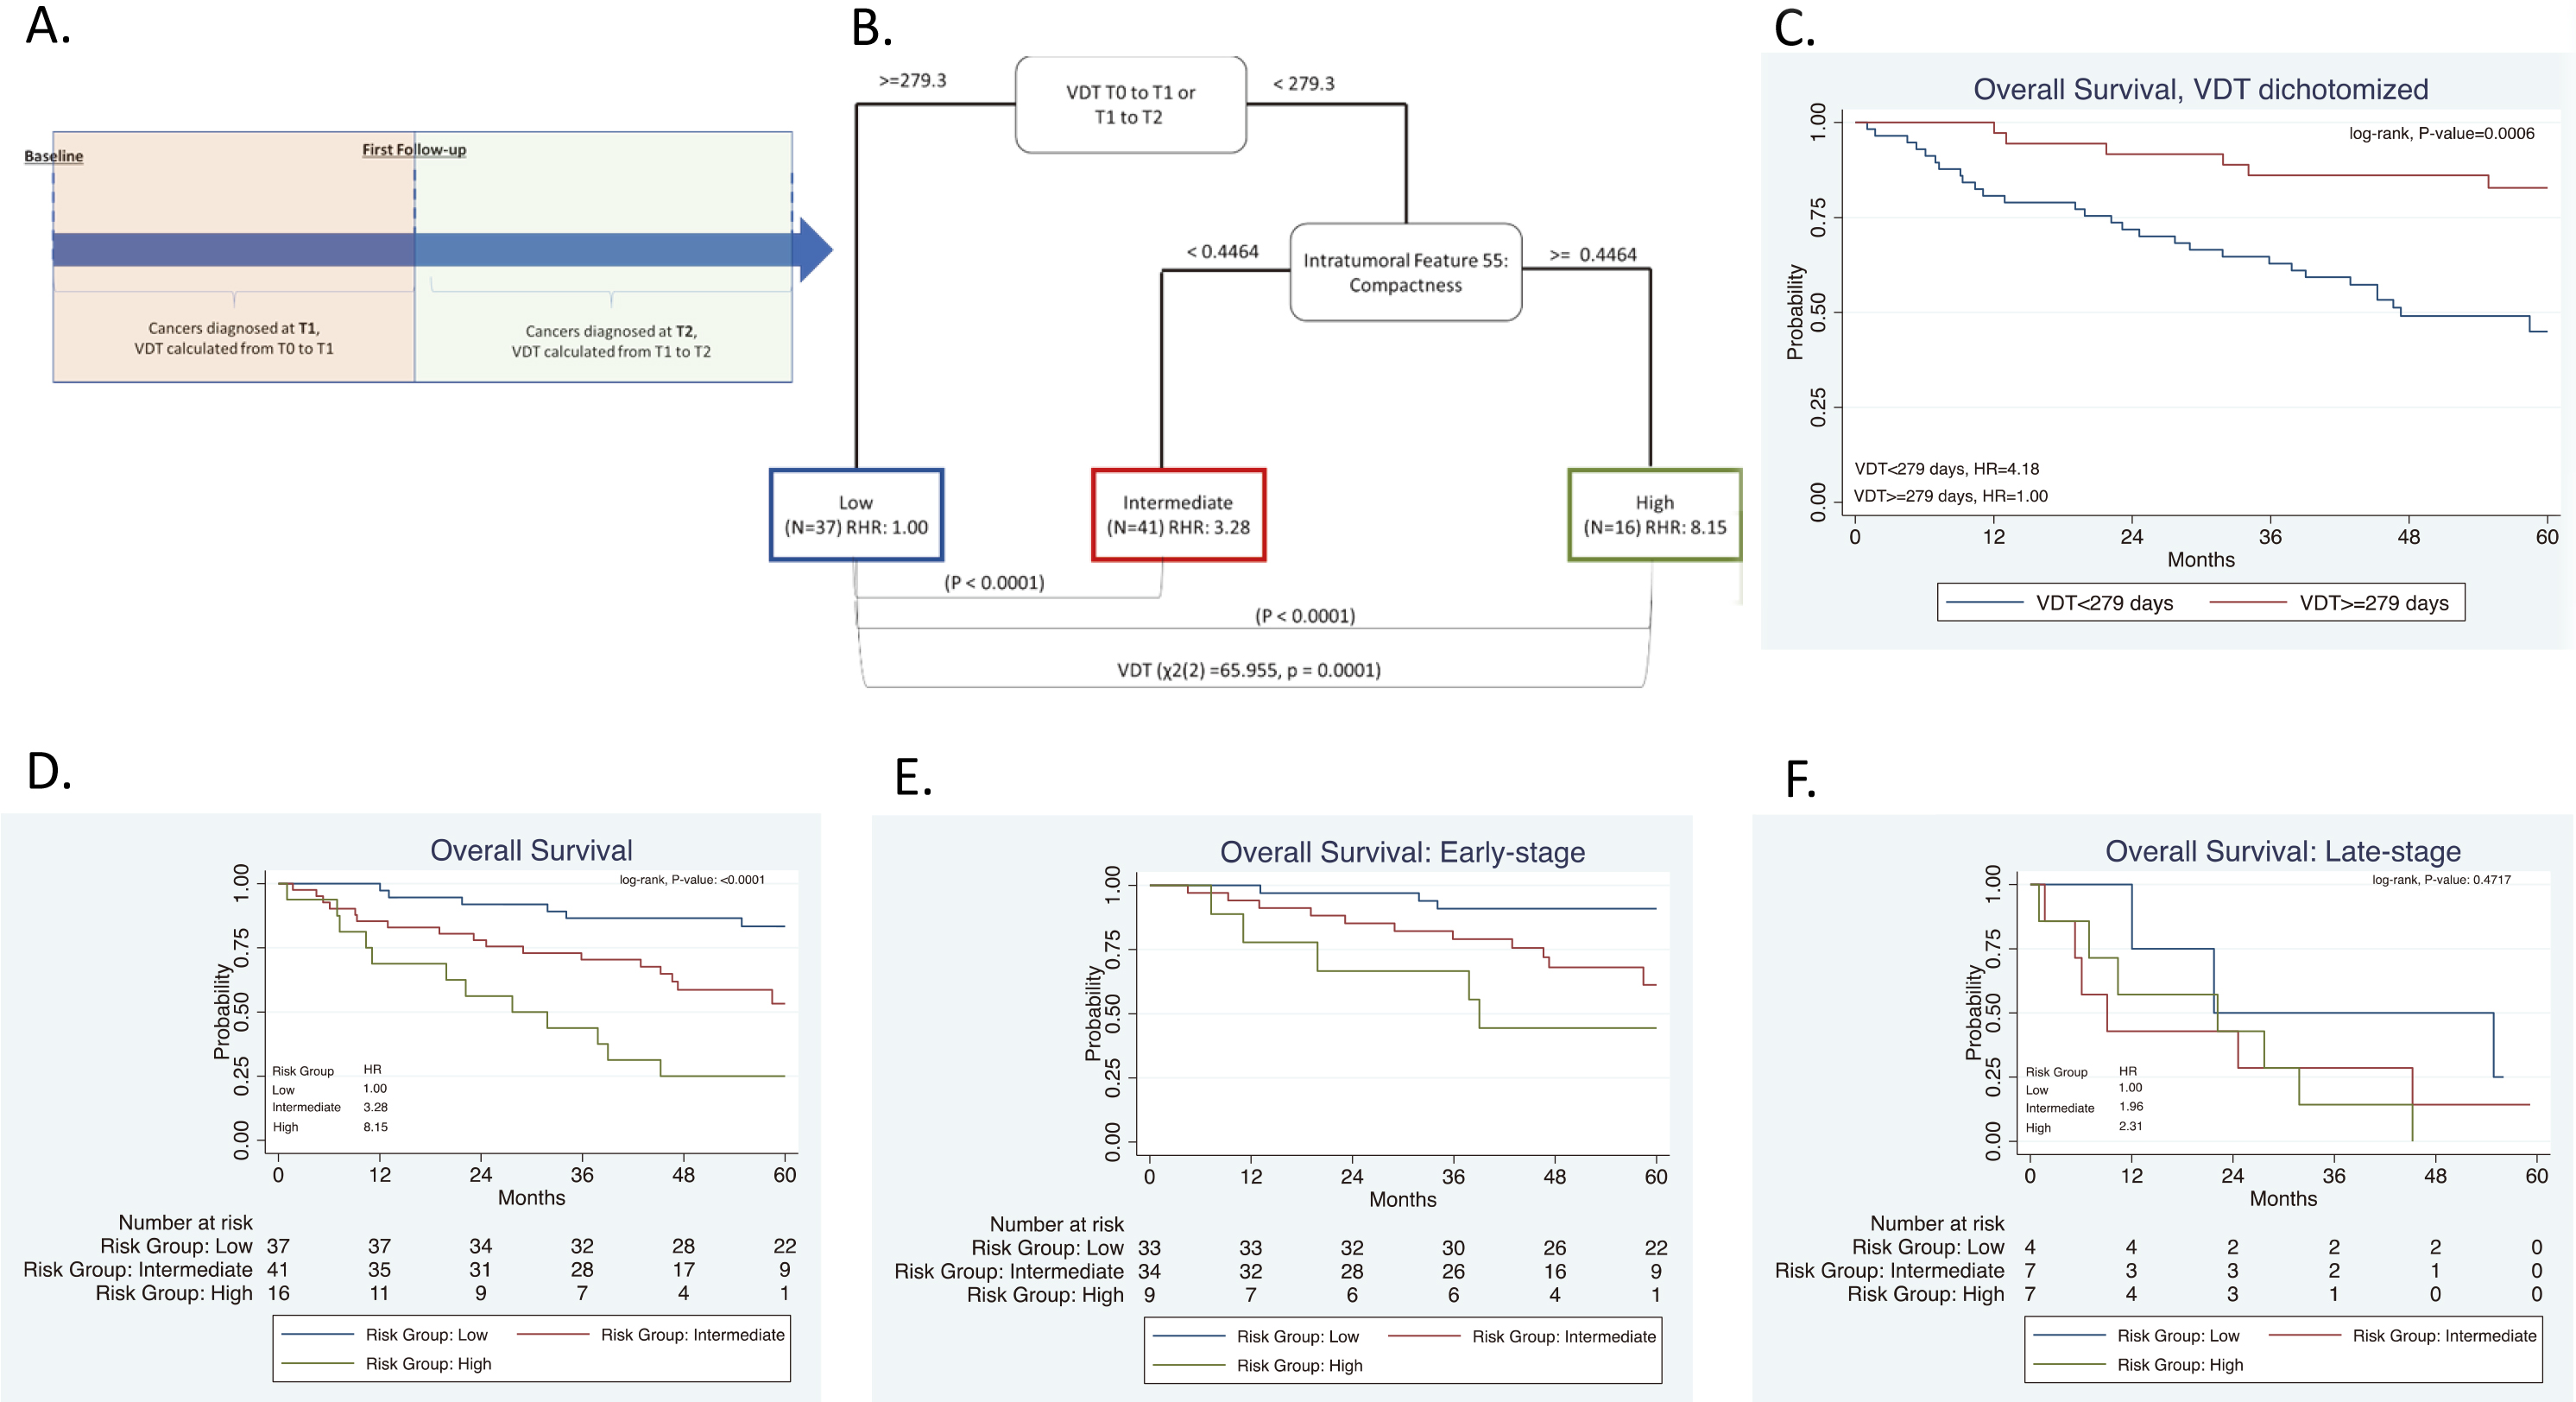
Radiomics were calculated from LDCT images at T0 and VDT was calculated from T0 to T1 as seen in Fig. 2A. The mean number of days between T0 and T1 was 369 days (range: 282 to 620 days). VDT was not significantly correlated to intratumoral or peritumoral features. VDT and the 65 radiomic features that we identified as stable and reproducible were included as inputs into CART analysis and subsequent decision tree revealed four risk groups as terminal nodes: low-risk, intermediate-risk, high-risk, and very-high-risk (Fig. 2B). The decision tree structure included VDT and two radiomic features (intratumoral feature compactness and peritumoral feature average co-occurrence). There are differences in VDT across the four risk-groups. The very-high risk group has a lower VDT (median VDT: 108.56) between T0 to T1 when compared to the high, intermediate, and low risk group (median VDT: 114.6, 143.2, and 499.2, respectively). From T0 to T1, Kruskal-Wallis test revealed that there is a statistically significant difference in VDT between the four risk groups (
There were no statistically significant differences between the four risk groups by age, smoking status, number of pack-years smoked, baseline screening, and family history of lung cancer (Table 2). However, there were statistically significant differences across the risk groups for sex (
Screening intervals from T0 to T1 and T1 to T2
For this analysis, we utilized the data from Section 3.2 above and included participants who were diagnosed with lung cancer at T2. Radiomics were calculated from T0 and VDT was calculated from T0 to T1 and between T1 to T2, as seen in Fig. 3A. The mean number of days between T1 and T2 was 370 days (range: 287 to 480 days). The same stable radiomic features were combined with VDT and subjected to CART analysis and revealed three risk groups: low-risk, intermediate-risk, high-risk (Fig. 3B). Due to the addition of participants who were diagnosed with lung cancer at T2, a new decision tree structure was identified. The decision tree structure included one radiomic feature (intratumoral feature compactness) and VDT. There are differences in VDT across the three risk-groups. The high-risk group has a lower VDT (median VDT: 104.58) between T0 to T1 and from T1 to T2 when compared to the intermediate, and low risk group (median VDT: 132.53 and 459.23, respectively) (
There were no statistically significant differences between the three risk groups by age, smoking status, number of pack-years smoked, treatment, baseline screening, and family history of lung cancer (Table 2). However, there were statistically significant differences across the risk groups for sex (
Predicting VDT using T0 radiomics features
When dichotomizing VDT by the novel threshold of 279 days, backward logistic regression identified the intratumoral radiomic feature compactness as the most informative radiomic feature (OR: 2.54; 95% CI 0.91, 7.12]). Compactness 2, a morphological feature, is a measure of how compact the shape of the region-of-interest is relative to a sphere (most compact) [3]. Compactness 2 was extracted from the semi-automatically segmented intratumoral region and peritumoral 3 mm outside of tumor boundary. Intratumoral Compactness 2 was identified as a stable and reproducible radiomic feature [48].
Patient characteristics by risk group
Patient characteristics by risk group
Abbreviations: sd
Multivariable Cox proportional hazards models for overall survival
According to Aerts et al. [3] the formula is:
To identify a potential prognostic threshold, compactness was included into CART to identify the most informative cutpoint associated with OS (Fig. 4A). A VDT
Intratumoral feature Compactness and VDT have similar prognosis capabilities. (A) The tree structure of the classification and regression tree analysis (CART) which identified the survival cutpoint of compactness. (B) Overall Survival for VDT dichotomized at 279 days and Compactness dichotomized at 0.60. Abbreviations: RHR 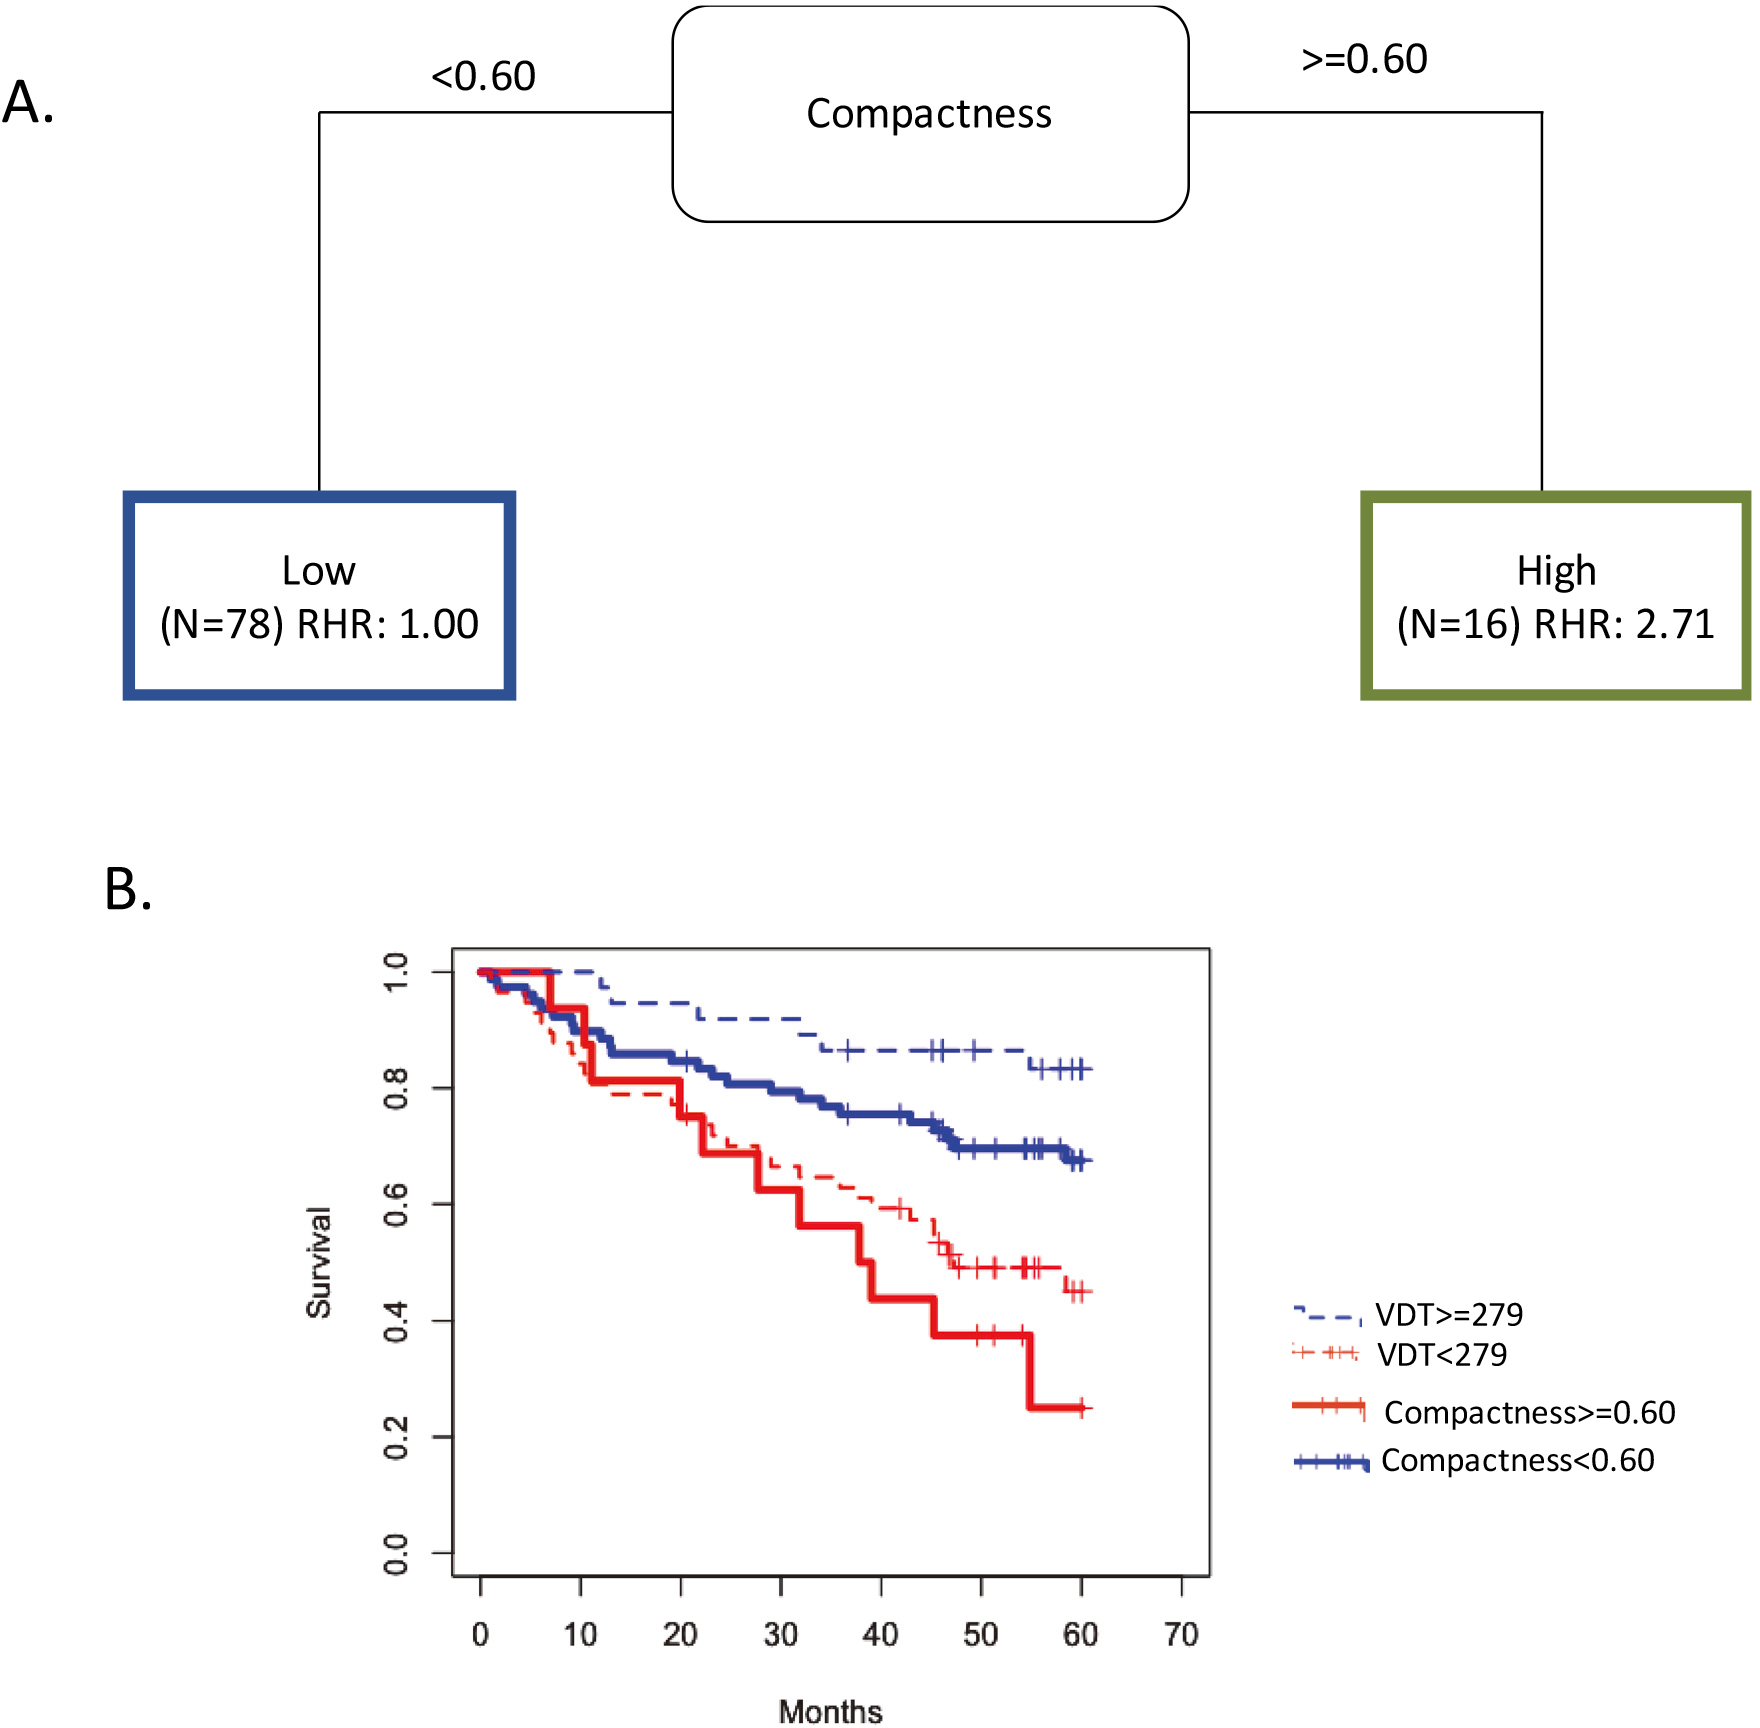
To reduce false positives in the radiogenomics analysis, we utilized a very high
Association between radiomics and gene expression. MIR34A expression by dichotomizing Compactness at the median.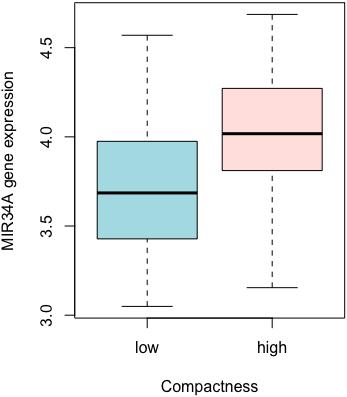
Overdiagnosis is a serious adverse effect of cancer screening and early detection. A recent meta-analysis of randomized trials on overdiagnosis of lung cancer with LDCT [7] estimated that 49% of the LDCT screen-detected cancers may be overdiagnosed. Though the authors conclude, “there is great uncertainty about the degree of overdiagnosis in lung cancer screening due to the heterogeneity” of screening trials, there is substantial evidence [7, 11, 18, 35, 42] that overdiagnosis is a real world problem and robust biomarkers such as radiomics could have translational implications by risk stratifying screen-detected lung cancer. To that end, we utilized VDT and peritumoral and intratumoral radiomic features to identify high-risk screen-detected lung cancers associated with poor survival outcomes. Among patients diagnosed with lung cancer at the first screening interval (T1), very-high risk patients had extremely poor survival outcomes (HR
VDT has been largely utilized as a diagnostic biomarker to discriminate malignant and benign nodules [8, 31, 53]; however, the thresholds to discriminate between malignant and benign pulmonary nodules are inconsistent. Additionally, prior studies utilized VDT as a biomarker to differentiate between indolent and aggressive lung cancers diagnosed [5, 21, 36, 50, 51] and have also utilized VDT as a prognostic factor [32, 40, 49]. For example, a VDT of less than 400 days was found to be an independent risk factor for poor disease-free survival [32]. In a study based on chest x-rays, the 5-year survival rate of fast-growing nodules with a VDT of
While prior studies by group have utilized radiomic features only [37] and the combination of radiomics and an a priori VDT threshold [29] (i.e.,
We acknowledge some limitations of this study. First, the sample size is modest because we utilized lung cancer cases with specific inclusion and exclusion criteria from the NLST. However, we utilized bootstrapping for internal validation which revealed the models were well calibrated. Hopefully other lung cancer screening trials, such as NELSON [11], LUSI [6], and MILD [33], will make their images and data public so that independent validation analyses can be performed. Additional research is also needed to validate the biological underpinnings of the gene identified in the radiogenomics analysis.
The results from our analyses revealed that radiomics combined with VDT can identify a vulnerable subset of screen-detected lung cancers that are associated with poor survival outcome suggesting such patients may need more aggressive treatment, such as adjuvant therapies, and more aggressive surveillance/follow-up. Further research is needed to validate these findings in other lung cancer screening trials and programs and to fully elucidate the biological underpinnings of these radiomic features and VDT.
Author contributions
Conception: J.P-M, R.J.G, M.B.S
Interpretation or analysis of data: J.P-M, H.L, W.M, I.T,T.K, S.A.E, M.B.S
Preparation of the manuscript: J.P-M, H.L, W.M, I.T, T.K, S.A.E, Y.B, R.J.G, M.B.S
Revision for important intellectual content: J.P-M, H.L, W.M, I.T, T.K, S.A.E, Y.B, R.J.G, M.B.S
Supervision: M.B.S and R.J.G
Supplementary data
The supplementary files are available to download from http://dx.doi.org/10.3233/CBM-210194.
sj-docx-1-cbm-10.3233_CBM-210194.docx - Supplemental material
Supplemental material, sj-docx-1-cbm-10.3233_CBM-210194.docx
Footnotes
Acknowledgments
Funding support from U54-CA163068, U54-CA1630 71, P20 CA202920, U01-CA143062, and U01-CA2004 64. None of the authors are affiliated with the National Cancer Institute. The authors thank the NCI for access to NCI’s data collected by the National Lung Screening Trial. The statements contained herein are solely those of the authors and do not represent or imply concurrence or endorsement by the NCI.
Conflict of interest
R.J.G is a consultant for HealthMyne Imaging Systems. J.P-M, H.L, W.M, I.T, T.K, S.A.E, Y.B, R.J.G, and M.B.S. declare no competing interests.