CD133 (prominin-1) is the most commonly used molecular marker of the cancer stem cells (CSCs) that maintain tumor progression and recurrence in colorectal cancer. However, the proteome of CSCs directly isolated from colorectal tumors based on CD133 expression has never been investigated.
OBJECTIVE:
To reveal biomarkers of CD133-positive colorectal CSCs.
METHODS:
Thirty colorectal tumor samples were collected from patients undergoing bowel resection. CD133-positive and CD133-negative cells were isolated by FACS. Comparative proteomic profiling was performed by LC-MS/MS analysis combined with label-free quantification. Verification of differentially expressed proteins was performed by flow cytometry or ELISA. CD133-knockout Caco-2 and HT-29 cell lines were generated using CRISPR-Cas9 gene editing.
RESULTS:
LC-MS/MS analysis identified 29 proteins with at least 2.5-fold higher expression in CD133-positive cells versus CD133-negative cells. Flow cytometry confirmed CEACAM5 overexpression in CD133-positive cells in all clinical samples analyzed. S100A8, S100A9, and DEFA1 were differentially expressed in only a proportion of the samples. CD133 knockout in the colon cancer cell lines Caco-2 and HT-29 did not affect the median level of CEACAM5 expression, but led to higher variance of the percentage of CEACAM5-positive cells.
CONCLUSIONS:
High CEACAM5 expression in colorectal cancer cells is firmly associated with the CD133-positive colorectal CSC phenotype, but it is unlikely that CD133 directly regulates CEACAM5 expression.
Malignant tumors are characterized by high cell heterogeneity [1]. They comprise a subpopulation of cells with a specific phenotype and unique proliferative, clonogenic, and tumorigenic properties, named cancer stem cells (CSCs). The term was introduced in 1959 by Makino [2] to denote the cells responsible for tumor relapse. Since then, Makino’s hypothesis on the existence of special tumor-initiating cells has been supported by a wealth of experimental evidence, and the term CSC has become widely adopted. At present, CSCs are broadly assumed to be responsible for tumor initiation, growth, metastasis, and recurrence [3, 4]. There is compelling evidence for the presence of CSCs in most hematological and solid tumors, including colorectal cancer [5, 6, 7]. Numerous studies are ongoing to provide an in-depth understanding of the molecular machinery and pathobiology of CSCs. CSCs express specific CD markers that distinguish them from other malignant cells within the tumor, but these markers vary by cancer type and among patients with histologically similar tumors. Fluorescence-activated cell sorting (FACS) allows the isolation of highly purified cells, and it is widely used to produce purportedly uncontaminated CSCs and other subpopulations of cancer cells. Various molecular markers, including CD133, CD44, CD166, EphB2, CD54, and ALDH1, have been used to enrich colorectal CSCs by FACS. Among them, CD133 is the most commonly used [7, 8].
In relapsing tumors, including colorectal tumors, the percentage of cells expressing CSC markers is increased after chemotherapy [9, 10, 11], indicating that CSCs can evade anticancer treatment. Moreover, CSCs, in contrast to non-stem colorectal cancer cells, initiate tumor growth in immunodeficient NOD/SCID mice [12], suggesting their crucial role in tumor initiation and, possibly, metastasis. Further studies on the specific molecular features of CSCs isolated from colorectal carcinomas, including comparative proteomic profiling of CSCs and non-stem cancer cells, are needed to better characterize these cells and reveal novel candidate therapeutic targets or prognostic markers [13].
Comparative proteomic analysis of microsphere cultures enriched with CSCs and adherent non-stem cancer cells, both isolated from the SW1116 human colon cancer cell line, was performed using 2D gel electrophoresis coupled with tandem mass spectrometry. This analysis revealed 10 differentially expressed proteins, including proteins related to cell proliferation and differentiation and involved in the ubiquitin-fusion degradation pathway [14]. Proteins associated with energy metabolism and the Wnt pathway were expressed in CD133-positive [CD133()] CSCs but not in CD133-negative [CD133()] cells of Caco-2 and HCT-116 colorectal cancer cell lines [15].
The use of colorectal cancer sphere cultures is a convenient approach to isolating CSCs from clinical material [16, 17]. Colonosphere and non-stem cell cultures derived from three tumor samples were compared using mass spectrometry, followed by label-free quantification that revealed 32 up-regulated proteins in the colonosphere. Knockdown of BIRC6, one of the up-regulated proteins, has been shown to affect the sensitivity of CSCs to platinum-based chemotherapy [18]. Since prolonged colonosphere culturing can lead to changes in protein expression, a proteomic analysis of CSCs and other cancer cells isolated from fresh biopsies is likely to provide more reliable results. However, the proteome of CSCs directly isolated from colorectal cancer samples based on CD133 expression has yet to be studied.
Here, we investigated the proteomes of CD133() CSCs and CD133() cancer cells isolated from clinical samples of colon tumors and the colon-cancer-derived Caco-2 cell line. An established cell line was included in the study to assess the relevance of cells subjected to prolonged cultivation as a model for CSC research. In an attempt to improve our poor understanding of the role of CD133 in colon cancer cell biology, we studied the effects of CD133 knockout on the Caco-2 and HT-29 colon cancer cells.
Materials and methods
Tumor specimens
Tumor specimens were collected from patients undergoing bowel resection for treatment of colorectal cancer in the abdominal department of the P. Hertsen Moscow Oncology Research Institute. Ethical approval according to the Declaration of Helsinki was obtained from the Institutional Ethics Committee (Approval Code: 366; date: October 3, 2016). Written informed consent was obtained from all participants. One tumor tissue sample was collected immediately after resection from each of 30 patients with a confirmed diagnosis of colorectal adenocarcinoma. The specimens, 1–2 cm in size, were placed in sterile tubes with Hank’s balanced salt solution (HBSS; PanEco, Russia) supplemented with 2 antibiotic-antimycotic solution (Gibco, USA). The specimens were transferred to the laboratory within 2 h of the resection. The samples that contained at least 1% of CD133() cells within the epithelial cell adhesion molecule (EpCAM)-positive population, as shown by flow cytometry, were used in the study.
Preparation of tumor cell suspensions
The resection specimens were washed extensively with phosphate-buffered saline (PBS; PanEco) containing 5 antibiotic-antimycotic and then placed in a Petri dish with HBSS containing 2 antibiotic-antimycotic. Necrotic, connective, and adipose tissues were removed aseptically with a scalpel. Next, the tumor tissue was mechanically dissociated to yield small fragments (1–2 mm). Enzymatic digestion was performed using 100 U/ml collagenase IV (Gibco) and 0.2 g/ml DNase I (Roche, USA) diluted in DMEM/F12 (PanEco) containing 1 antibiotic-antimycotic for 2 h at 37C with constant stirring at 100 rpm. The obtained suspension was then filtered through a 70-m pore size nylon cell strainer (Corning, USA) and centrifuged at 300 g for 5 min. The pellet was resuspended in DMEM/F12 supplemented with 2% fetal bovine serum (FBS; Gibco, USA).
Cell lines
The human colorectal adenocarcinoma cell lines Caco-2 and HT-29 were provided by Cell Bank of the Institute of Biomedical Chemistry (Moscow). Cell line authentication was performed using short tandem repeat (STR) analysis. The cells were maintained in DMEM/F12 supplemented with 10% FBS and incubated in a 5% CO atmosphere at 37C. The cell lines were passaged using a 1:1 mix of 0.25 % trypsin and Versene (0.48 mM EDTA) solutions (PanEco) at no more than 80%–90% confluence to prevent potential cell differentiation at full confluence.
Flow cytometry and FACS
The following fluorochrome-conjugated monoclonal antibodies (MAbs) were used in this study: anti-CD133/1-APC (Miltenyi Biotec, USA), anti-EpCAM-PE (BD Biosciences, USA), anti-CEACAM5-AF488 (R&D Systems, USA), anti-S100A8-FITC, and anti-S100A9-FITC (both Miltenyi Biotec). For immunostaining, 10 cells, suspended in 100 l of PBS supplemented with 2% FBS, were treated with MAbs according to the manufacturer’s instructions. Intracellular staining with anti-S100A8 and anti-S100A9 MAbs was performed after the fixing the cells with Cytofix (BD Biosciences), permeabilizing with 0.1% Triton-X100, and washing with 0.01% Tween-20 solution. After staining, cells were resuspended in an appropriate amount of cell wash buffer (BD Biosciences) and filtered into Falcon tubes with a 35-m strainer (Corning, USA) to exclude clumps of cells. SYTOX Blue dead-cell stain (Life Technologies, USA) at a concentration of 1 l/ml was added 3 min before analyzing or sorting non-fixed cells.
The flow cytometric analysis and FACS were conducted on a FACSAria III flow cytometer (BD Biosciences). The following sorting parameters were used: chamber temperature, 4C sort regimen, “Purity” (low yield but high accuracy); nozzle size, 100 m; pressure, 20 psi. Cell subpopulations were sorted into polypropylene tubes containing DMEM/F12 then washed at 300 g for 4 min in PBS, and were either cultured or frozen at 70C for further proteomic analysis.
Peptide sample preparation for LC-MS/MS analysis
CD133() and CD133() samples were incubated in 200 l of lysis buffer (100 mM Tris-HCl pH 7.4, 4% SDS) for 30 min on ice, followed by centrifugation at 4C for 10 min at 10,000 g. Digestion of extracted proteins was performed according to a filter-aided sample preparation protocol [19]. In brief, the supernatants were transferred to a Microcon filter unit (YM-30 membrane, Millipore) and centrifuged at 4C for 15 min at 14,000 g. The samples were reduced in 100 l of buffer (100 mM Tris-HCl, pH 8.5, 100 mM DTT) at 56C for 20 min, followed by centrifugation at 20C for 15 min at 14,000 g. The samples were washed twice with 8 M urea, followed by protein alkylation with 50 mM iodoacetamide in 8 M urea for 20 min in the dark. Then the samples were washed twice with 8 M urea and twice with 50 mM triethylammonium bicarbonate buffer. The samples were incubated overnight at 37C with 50 l of 50 mM triethylammonium bicarbonate buffer and trypsin (Promega, USA); the protein/trypsin mass ratio was 100:1. The following day, another aliquot of trypsin was added to each sample, followed by incubation for 2 h. The peptides samples were collected by centrifugation at 20C for 15 min at 14,000 g and washed with 5% formic acid. The samples were dried in a Speed-Vac Concentrator and in the case of CD133() samples, resuspended in 30 l of 0.1% formic acid (solvent A). CD133() sample volumes were adjusted, taking into account the CD133(/CD133() cell count ratio determined by FACS.
LC-MS/MS analysis
The peptides of CD133() and CD133() samples were analyzed using the Agilent 1100 Series HPLC system (Agilent Technologies, USA) connected to a hybrid linear ion-trap LTQ Orbitrap Velos mass spectrometer (Thermo Fisher Scientific, USA), equipped with a nanoelectrospray ion source (Thermo Scientific). Peptides were loaded onto a Zorbax 300SB-C18 trap column (C 5 m, 0.3 mm inner diameter, 5 mm length; Agilent Technologies) and washed with solvent A for 5 min at a flow rate of 3 l/min. Peptide separation was performed on a Zorbax 300SB-C18 RP-HPLC column (C 3.5 m, 75 m inner diameter, 150 mm length; Agilent Technologies) using a linear gradient from 5% to 60% of solvent B (0.1% formic acid, 80% acetonitrile) over 85 min at a flow rate of 0.3 l/min. Two types of mass spectrometric experiments were performed, both in the positive-ion mode. To perform label-free quantification based on precursor signal intensity, only survey MS data were obtained in at least three technical replicates using the Orbitrap analyzer with a resolution of 30,000 (/ 400). The automatic gain control target value was set at 1 10 with a maximum injection time of 500 ms. LC-MS/MS experiments in data-dependent acquisition mode were performed to identify proteins. The resolution was set at 30,000 (/ 400) for MS and 7,500 (/ 400) for MS/MS scans. A survey MS scan was followed by MS/MS spectrum acquisition of the five most abundant precursors. For peptide fragmentation, higher-energy collisional dissociation (HCD) was used. The signal threshold was set to 5,000 for an isolation window of 2 /, and the first mass of the HCD spectrum was set to 300 /. The collision energy was set to 35 eV. Fragmented precursors were dynamically excluded from targeting for 60 s. Singly charged ions and ions with no defined charge state were excluded from triggering MS/MS scans. The automatic gain control target value was set at 1 10 with a maximum injection time of 500 ms and at 1 10 with a maximum injection time of 100 ms for MS and MS/MS scans, respectively.
Label-free quantification in Progenesis LC-MS software
The mass spectrometry data were imported into Progenesis LC-MS (version 2.5, Newcastle, UK) separately for each patient and the Caco-2 cell line. LC-MS and LC-MS/MS runs were time-aligned between CD133() and CD133() samples. The reference run was selected automatically. Peptide intensities were normalized against an auto-selected reference run and differences in protein expression and associated one-way ANOVA -values between MS data were calculated in Progenesis LC-MS. Spectral data for each CD133() and CD133() sample pair were transformed into MGF files with Progenesis LC-MS and exported for peptide identification using the Mascot search engine (version 2.4.1, Matrix Science, London, UK) against neXtProt (2016-08-08 release) and 248 common contaminant sequence databases (2016-01-29 release). Search parameters were set to a precursor mass tolerance of 10 ppm and a fragment mass tolerance of 0.1 Da. Two missed tryptic cleavages were permitted. Carbamidomethylation (cysteine) was set as a fixed modification and oxidation (methionine) set as a variable modification. The Mascot search results were further processed using the machine learning algorithm Percolator. The false discovery rate (FDR) was less than 1%. Identified peptides with a score of less than 15 were discarded at the “Refine identification” step. For quantification, the total cumulative abundance of each protein was calculated by summing the abundances of all peptides allocated to this respective protein. Proteins with fold change (FC) 2.5 (-value 0.01) and at least two peptides used for quantification were considered differentially expressed proteins (DEPs). The mass spectrometry data were deposited to the ProteomeXchange Consortium via the PRIDE partner repository (PXD005108).
Enzyme-linked immunosorbent assay (ELISA)
Cell suspensions prepared from tumor samples of several patients were sorted into CD133() and CD133() subpopulations according to the procedure used for the LC-MS/MS analysis. Protein extracts were prepared in PBS by subjecting cells to three freeze-thaw cycles. The total protein concentration was measured with a NanoDrop 1000 spectrophotometer (Thermo Scientific, USA) at 280 nm. PBS was added to each sample in appropriate amounts to ensure the same final concentration of protein. The human HNP1-3 (neutrophil defensins) ELISA kit (Hycult Biotech, Netherlands) was used according to the manufacturer’s instructions. 100 g of total protein from each sample was applied. Optical density was measured at 450 nm on an Infinite 200 Pro multifunctional plate reader (Tecan, USA) in duplicate using two serial 10-fold dilutions.
Generation of CD133-knockout Caco-2 and HT-29 cell lines using CRISPR-Cas9
To generate CD133-knockout single-cell colonies using CRISPR-Cas9 gene editing, guide RNA (gRNA) sequences were designated with the “CHOPCHOP” online tool [20]. If a sequence did not start with G, an extra G nucleotide was added upstream to the gRNA sequence to optimize transcription starting from the U6 promoter. All targeted sequences (printed in bold type) were located within the first exon (NCBI Reference Sequence: NM_006017.3), as shown below: ATGGCCCTCGTACTCGGCTCCCTGTTGCTGCTGGGGCTGTGCGGGAACTCCTTTTCAGGAGGGCAGCCTTCATCCACAGATGCTCCTAAGGCTTGGAATTATGAATTGCCTGCAACAAATTATGAGACCCAAGACTCCCATAAAGCTGGACCCATTGGCATTCTCTTTGAACTAGTGCATATCTTTCTCTATGTGGTACAGCCGCGTGATTTCCCAGA.
The oligonucleotides corresponding to both strands of the targeted sequence with cloning sites included were synthesized by Eurogen (Russia). Complementary oligonucleotides were annealed, and each duplex was cloned separately into the pSpCas9(BB)-2A-GFP (PX458) plasmid vector from Addgene (plasmid #48138). Caco-2 or HT-29 cells were either co-transfected with CD133-targeted plasmids or transfected with a scrambled-sequence gRNA plasmid using Genjector-U (Molecta, Russia). After two days in culture, the cells were sorted using FACS to isolate those expressing the GFP reporter gene included in the plasmid vector. GFP-positive cells were plated in a 96-well plate in complete medium at a final concentration of 1 cell per well. The cells were cultured for 14 days to form single-cell colonies, which were transferred to 24-well plates for further expansion. CD133 knockout was confirmed by flow cytometry.
Statistics
All mass spectrometric measurements were performed in at least three technical replicates. The primary analysis of mass spectrometry and flow cytometry data was carried out using statistical algorithms (ANOVA, descriptive statistics) integrated into specialized software (Progenesis LC-MS, FACSDiva). To statistically examine the difference in the median values of fluorescence intensity a non-parametric Mann-Whitney U-test was used. Levene’s test was applied to assess the equivalence of variations. For both tests, -values of less than 0.05 were regarded to indicate statistical significance.
Results
Comparative proteomic profiling of CD133() and CD133() subpopulations of colorectal cancer cells
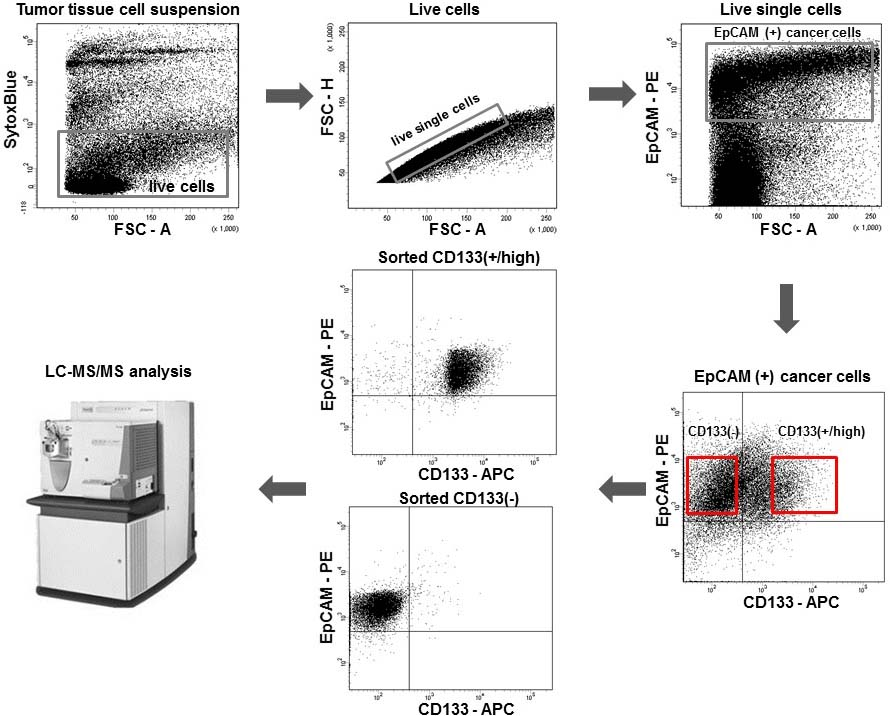
Colorectal adenocarcinoma tissue specimens were taken from freshly resected primary tumors of five Caucasian patients not previously subjected to chemo- or radiotherapy (Table 1, patients #1–#5). The cell suspensions were stained with a viability dye to exclude dead cells from analysis. EpCAM was used as a cancer cell marker to discriminate them from tumor stromal cells. Sorting of cancer cell suspensions yielded CD133() and CD133() cell subpopulations. The FACS gating strategy is shown in Fig. 1. At least 5 10 sorted cells were used in LC-MS/MS experiments. Using this workflow, we identified 2,084 unique proteins across all clinical samples and 1,392 proteins in the Caco-2 cell line (Mascot FDR 1%).
Gating strategy of CD133-positive and CD133-negative colorectal cancer cell isolation from tumor tissue cell suspensions by FACS. Top-left: exclusion of dead cells by SytoxBlue staining; top-middle: exclusion of doublets and cell aggregates; top-right: cancer cell gating by the expression of the EpCAM epithelial marker; bottom-right: separation of tumor cells according to the level of CD133 expression; bottom-middle: control analysis of the sorted subpopulations. The quadrant gates define the maximum fluorescence intensities of the isotype controls. Sorting gates are shown in red.
To evaluate the differences in the proteomes of CD133() and CD133() subpopulations, we applied label-free quantification based on precursor signal intensity. A pair-wise comparison of CD133() and CD133() subpopulations using Progenesis LC-MS software resulted in the detection of between 7 and 86 DEPs, depending on the sample pair. In total, 175 unique DEPs in clinical samples and 35 DEPs in Caco-2 cells were identified. Table 2 shows a list of the 29 proteins that showed a 2.5 or greater fold difference in expression by CD133() and CD133() cells in at least two samples. Notably, only two identical DEPs were shared by clinical samples and Caco-2 cells: keratin, type II cytoskeletal 1, and annexin A6.
Differentially expressed proteins in CD133() and CD133() colorectal cancer cells (fold change 2.5 at least in two samples)
Protein ID
Gene symbol
Protein name
Number of samples with DEPs
Fold change of protein expression in CD133() compared to CD133() cells
Patient #1
Patient #2
Patient #3
Patient #4
Patient #5
Caco-2
P06731
CEACAM5
Carcinoembryonic antigen-related cell
5
8.3
32.6
13.3
8.2
3.4
–
adhesion molecule 5
P04264
KRT1
Keratin, type II cytoskeletal 1
4
4.4
–
–
4.8
3.8
2.6
P05109
S100A8
Protein S100-A8
4
–
2.9
4.8
3.0
3.8
–
P06702
S100A9
Protein S100-A9
4
–
3.3
4.1
4.7
4.2
–
P59665
DEFA1
Neutrophil defensin 1
4
–
4.1
5.0
7.7
3.8
–
P13645
KRT10
Keratin, type I cytoskeletal 10
3
2.6
–
–
4.7
3.4
–
P24158
PRTN3
Myeloblastin
3
4.1
–
5.0
–
3.7
–
P35527
KRT9
Keratin, type I cytoskeletal 9
3
8.0
–
–
5.3
5.7
–
P35908
KRT2
Keratin, type II cytoskeletal 2 epidermal
3
–
–
3.3
5.1
3.1
–
P41218
MNDA
Myeloid cell nuclear differentiation antigen
3
11.0
–
3.4
–
3.1
–
P61626
LYZ
Lysozyme C isoform
3
6.5
–
2.6
4.1
–
–
P02533
KRT14
Keratin, type I cytoskeletal 14
2
5.4
–
–
4.1
–
–
P04083
ANXA1
Annexin A1
2
–
–
–
3.7
2.8
–
P05164
MPO
Myeloperoxidase
2
–
–
4.2
–
3.8
–
P05387
RPLP2
60S acidic ribosomal protein
2
11.2
–
7.2
–
–
–
P08133
ANXA6
Annexin A6
2
–
–
3.2
–
–
3.2
P08670
VIM
Vimentin
2
–
–
3.4
10.6
–
–
P12273
PIP
Prolactin-inducible protein
2
–
–
4.3
13.3
–
–
P16444
DPEP1
Dipeptidase 1
2
4.1
10.4
–
–
–
P19075
TSPAN8
Tetraspanin-8
2
–
–
3.0
2.9
–
–
P31146
CORO1A
Coronin-1A
2
–
–
3.1
–
2.9
–
P68431
HIST1H3
Histone H3.1
2
–
–
4.1
14.5
–
–
P80188
LCN2
Neutrophil gelatinase-associated lipocalin
2
–
–
2.9
3.4
–
–
Q01628
IFITM3
Interferon-induced transmembrane protein 3
2
3.2
2.7
–
–
–
–
Q09666
AHNAK
Neuroblast differentiation-associated protein
2
–
–
–
2.6
3.2
–
Q13263
TRIM28
Transcription intermediary factor 1-beta
2
6.9
–
2.9
–
–
–
Q5SSJ5
HP1BP3
Heterochromatin protein 1-binding protein 3
2
–
–
2.9
3.1
–
–
Q71DI3
HIST2H3
Histone H3.2
2
–
–
5.4
46.8
–
–
Q92621
NUP205
Nuclear pore complex protein
2
–
–
2.5
5.1
–
–
UniProtKB (https://www.uniprot.org).
Surprisingly, the DEPs detected in at least four of the five clinical samples (CEACAM5, S100A8, S100A9, DEFA1) are routinely used or prospective cancer biomarkers. Carcinoembryonic antigen-related cell adhesion molecule 5 (CEACAM5) is a conventional biomarker widely used to assess the progression of colorectal cancer. CEACAM5 was overexpressed in CD133() cells from all five clinical samples, with fold differences in expression ranging from 3.4 to 32.6 compared to CD133() cells. CEACAM5 is a cell membrane glycoprotein adhesion molecule expressed in adenocarcinomas derived from the digestive tract epithelium of endodermal lineage and fetal colon. Its levels in serum is one of the best predictors of outcome for patients undergoing liver resection for colorectal cancer metastases [21].
According to the LC-MS/MS analysis, calcium-binding proteins S100A8 (average fold change 3.625) and S100A9 (average fold change 4.075) were overexpressed in CD133() cells isolated from four clinical samples. These proteins belong to the S100 family comprising several proteins with similar structures and functions that can be used as biomarkers for melanoma and other neuroectodermal and myeloid tumors [22]. An association between S100A8 and S100A9 serum levels and clinical features of colorectal cancers has also been demonstrated [23]. The two proteins have both intracellular and extracellular functions. Secreted S100A8 and S100A9 can form a heterodimer that affects colorectal cell proliferation, survival, and migration through the Wnt/b-catenin pathway [24].
Neutrophil defensin 1 (DEFA1) was present in greater amounts in CD133() cells isolated from four clinical samples with an average fold change in expression of 5.15. DEFA1 is generally regarded as a host defense protein specific to neutrophils. DEFA5 and DEFA6, expressed by specialized epithelial Paneth cells of the small intestine, are more common in the intestinal tissue [25]. Despite their localization to the small intestine, in a clinical setup, based on the quantitative real-time PCR of normal, adenoma, and tumor tissues, both proteins are considered as potential prognostic and predictive biomarkers in colon cancer [26]. DEFA1 might also have prognostic value in colorectal cancer as quantitative proteomic analysis has revealed DEFA1 to be among the proteins differentially expressed between paired colorectal cancer and non-tumor tissues from clinical samples [27].
In our analysis, several keratins were identified as DEPs. Although contamination of samples with keratins is a common problem in proteomic profiling, the keratins on our list of top-ranked DEPs were not among the 248 common contaminants in the sequence database searched by Mascot. Furthermore, evidence has been reported of their expression in internal organs and carcinomas [28]. Our data on the expression of keratins are consistent with these previous findings.
Targeted assessment of the principal DEPs by alternative methods of protein expression analysis
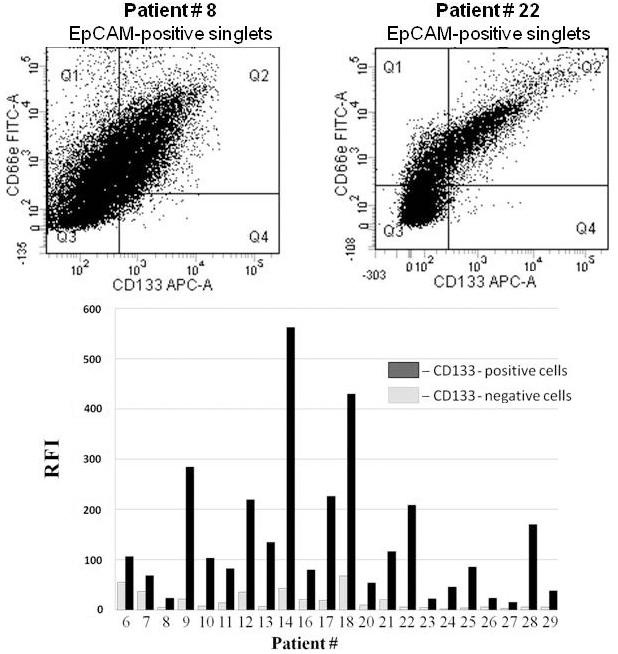
To verify our list of the principal DEPs, we performed flow cytometric and ELISA analysis of additional colorectal cancer samples with varying histological features isolated from patients at various stages of the disease (Table 1, patients #6–#29). Tumor cell suspensions derived from 25 samples were stained with fluorochrome-conjugated MAbs against EpCAM, CD133, and CEACAM5. One sample did not contain CD133() cells and was excluded from further analysis. The expression of CEACAM5 within the CD133() and CD133() subpopulations was assessed by flow cytometry. Significantly higher expression of CEACAM5 was detected on CD133() cells compared to CD133() cells in all the samples (Fig. 2). Thus, our proteome profiling data concerning CEACAM5 were confirmed by flow cytometry on a larger patient group.
Expression of CEACAM5 (a.k.a. CD66e) on CD133-positive and CD133-negative colorectal cancer cells. Expression was evaluated by flow cytometry after staining with fluorochrome-conjugated monoclonal antibodies against EpCAM, CD133, and CEACAM5. SytoxBlue was used to exclude dead cells. Two typical dot plots (upper panel) and processed data analysis of samples from 22 patients (bottom panel) are presented. The relative fluorescence intensity (RFI) was calculated as the ratio of fluorescence intensity of the experimental samples to the fluorescence intensity of the isotype controls. The quadrant gates define the maximum fluorescence levels of the isotype controls. The coefficient of variation (CV) was in the range 0.10–3.16.
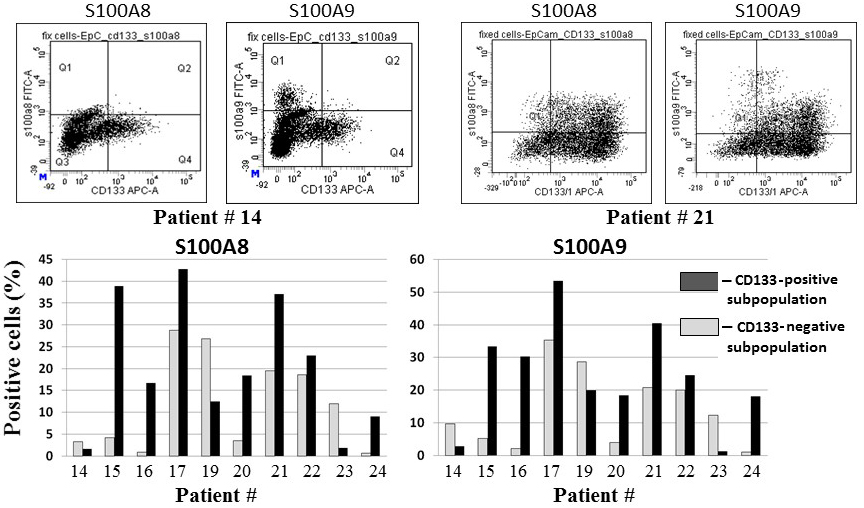
Expression of S100A8 and S100A9 in CD133-positive and CD133-negative colorectal cancer cells. The percentage of S100A8 and S100A9 positive cells within the CD133() and CD133() subpopulations was measured by flow cytometry. Typical dot plots (upper panel) and processed data on samples from 10 patients (bottom panel) are shown. Colorectal cancer cells samples were stained with fluorochrome-conjugated monoclonal antibodies against EpCAM, CD133, and S100A8 or S100A9. The staining of S100A8 and S100A9 was intracellular. The quadrant gates define the maximum fluorescence intensities of the isotype controls.
The expression of S100A8 and S100A9 proteins was evaluated in 10 clinical samples in a similar way (Table 1). Since these proteins are predominantly localized to the cytoplasm, intracellular staining with specific MAbs was performed after cell membrane permeabilization. Both proteins showed a very similar quantitative distribution among the samples (Fig. 3), which is likely a consequence of their tendency to act together [24]. However, unlike for CEACAM5, we found no reliable association of their expression with CSC phenotype: the CD133() subpopulation had a significantly greater number (more than twofold) of cells expressing these proteins in four samples, whereas a higher number of S100-positive cells in the CD133() subpopulation was found for three samples.
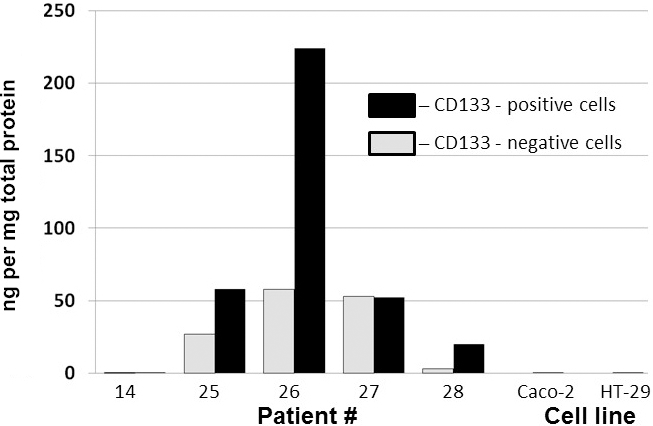
To assess the possible association of DEFA1 with CSC phenotype, tumor cells from five patients were separated into CD133() and CD133() subpopulations by FACS. Protein extracts isolated from the cells were subjected to ELISA analysis to determine the content of neutrophil defensins. Greater neutrophil defensins content in the CD133() cells was found in three out of the five samples (Fig. 4). One sample appeared to completely lack neutrophil defensins. The colorectal cancer cell lines Caco-2 and HT-29 also did not contain detectable amounts of these proteins, which supports the assumption that the neutrophil defensins on tumor cells isolated from patients is exogenous in origin.
Evaluation of DEFA1 expression in CD133-positive and CD133-negative colorectal cancer cells and cell lines by ELISA. Protein extracts were prepared from colorectal cancer cells isolated from five patients and two cell lines. Cell suspensions from the clinical samples were first separated into CD133() and CD133() cells by FACS. The vertical axis represents the neutrophil defensins content (in nanograms) in 1 mg of the total protein extract.
Evaluation of CD133 knockout effect on CEACAM5 expression in Caco-2 and HT-29 colon cancer cell lines
The data presented above suggest that CEACAM5 overexpression is closely associated with the CD133() phenotype of colorectal cancer cells. This raises the question of whether the CD133 glycoprotein molecule is just a “bystander” in CEACAM5-overexpressing cells or if it directly regulates its expression. The latter hypothesis is supported by recent findings implicating CD133 in signal cascades associated with cell proliferation, invasion, migration, and other attributes of malignancy [29, 30].
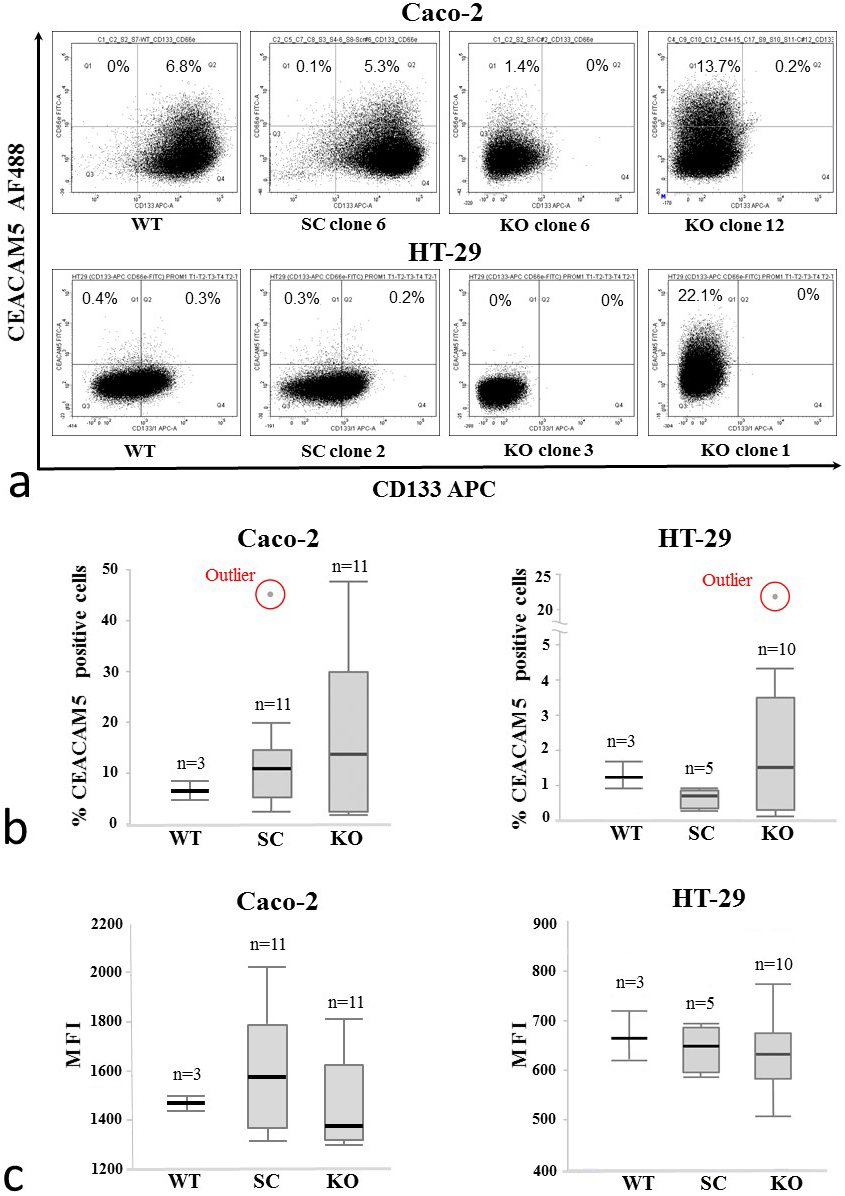
To investigate the possible role of CD133 in CEACAM5 regulation, we used CRISPR-Cas9 gene editing to produce CD133 knockout in colon cancer cell lines abundantly expressing CD133. Caco-2 and HT-29 cell lines were transfected with plasmids encoding either gRNA targeting the CD133 gene or scrambled gRNA that does not recognize any sequence in the human genome. Successfully transfected cells were selected by FACS based on expression of the GFP reporter gene and subjected to single-cell cloning. In the case of Caco-2, 11 clones out of 16 analyzed by flow cytometry lost their CD133 expression. Furthermore, 10 HT-29 colonies lacking CD133 were identified out of 12 analyzed. Flow cytometric analysis did not provide uniform results showing either decrease or unexpected increase in the expression of CEACAM5 in some of the analyzed knockout clones (Fig. 5a). A statistical analysis did not reveal significant differences in the average number of CEACAM5-positive cells between the knockout and scrambled control clones of both Caco-2 (-value 0.698) and HT-29 (-value 0.348) cells (Fig. 5b). There was also no change in the level of CEACAM5 expression in the CEACAM5-positive cells of genome-edited colonies derived from Caco-2 (-value 0.190) and HT-29 (-value 0.780) cell lines (Fig. 5c). These results suggest that CD133 is not involved in regulating CEACAM5 expression in the studied colon carcinoma cell lines. However, statistical analysis revealed a significantly higher variance of the number of CEACAM5-positive cells in knockout clones compared to scrambled control clones grown from either Caco-2 (-value 0.015) or HT-29 (-value 0.047) cell lines.
CEACAM5 expression in CD133-knockout single-cell colonies of Caco-2 and HT-29 colon adenocarcinoma cell lines. WT, untransfected cell line (wildtype); SC, single-cell colonies arising after transfection with the scrambled gRNA encoding vector; KO, CD133-knockout single-cell colonies verified by flow cytometry; MFI, median fluorescence intensity. (a) The percentage of CEACAM5-positive cells measured by flow cytometry (typical dot plots are shown). The quadrant gates define the maximum fluorescence intensities of the isotype controls. (b, c) Aggregated data from all samples. The boxes represent the 25th to 75th percentile range and horizontal lines within the box show median values. The whiskers indicate the lowest and highest values. There is no statistically significant difference in the average number of CEACAM5-positive cells between SC and KO clones of either Caco-2 (-value 0.698) or HT-29 (-value 0.348) cell lines (b). No difference in the expression level of CEACAM5 was found between the SC and KO colonies of either Caco-2 ( 0.190) or HT-29 ( 0.780) cell lines (c). A non-parametric Mann-Whitney U-test was used. The analysis of the equality of variances using Levene’s test showed a significantly higher variability in the numbers of CEACAM5-positive cells in KO colonies in both Caco-2 ( 0.015) and HT-29 ( 0.047) cell lines. , number of colonies in the group.
Discussion
Comparative proteomic profiling of CD133() and CD133() colorectal cancer cells carried out by high-resolution mass spectrometry revealed 29 proteins with distinctly different expression profiles. Further research involving a larger patient group was focused on the four most abundant of these 29 proteins among the samples derived from the initial patient group, i.e. CEACAM5, S100A8, S100A9, DEFA1. Of those four DEPs, only CEACAM5 was robustly overexpressed by the CD133() cells in all clinical samples. This result is consistent with the study of Fang et al., who used mass spectrometry to show that colorectal CSCs maintained in long-term spheroid 3D cultures contained 3.8 times more CEACAM5 compared to their differentiated progeny grown in a 2D culture [31]. However, another study reported that CEACAM5 was not overexpressed in CSCs compared to more differentiated cancer cells in colonospheres derived from colorectal metastases into the liver [18].
CEACAM5 is a crucial member of the CEACAM family that comprises 11 other proteins. Its primary function in the embryonic intestine and colon tumors is facilitating adhesion between epithelial cells [32]. Also, it plays a significant role in the inhibition of differentiation [33] and apoptosis [34] in colon cells. In the literature, CEACAM5 is often synonymous with cancer embryonic antigen (CEA), a well-known biomarker of many types of malignancies, colorectal cancer in the first place [21].
Initially, CEA was positioned as a predictor of colorectal cancer recurrence [35], whereas its expression in primary tumors was thought to have no predictive value [36]. Although attempts to use CEA for diagnostics of primary tumors are ongoing, especially in combination with other biomarkers [37, 38], CEA is still generally considered the best indicator of local cancer recurrence and distant metastasis [21, 39]. It is known that the proportion of CSCs in a tumor cell population is increased in cases of cancer relapse and particularly after chemotherapy [9, 10]. Moreover, in colorectal cancer patients, CD133() cells are abundant among circulating tumor cells [40] and may cause tumor relapse and distant metastasis. In our study, the share of the CD133() subpopulation was substantially above average in the samples of locally relapsing tumors (Table 1, patients #26 and #29). Both patients had primary tumors surgically removed and were subjected to polychemotherapeutic treatment two years before inclusion in the current study. Because of the high percentage of CD133() cells in the relapsing tumors and the prevalence of CEACAM5 expression in CD133() cells, this test may work even if the relapsing tumor’s volume is small. Therefore, the correlation we found between the CD133() phenotype and elevated CEACAM5 expression are consistent with data on the higher prognostic value of CEACAM5 specifically in recurrent tumors. In this regard, studies aimed at identifying the relationship between the blood serum levels of CEACAM5 and the volume of CD133() subpopulation are required.
In our present study, the differential expression of CEACAM5 in CD133() and CD133() cells across all patient samples was not confirmed in the Caco-2 colorectal adenocarcinoma cell line. Moreover, of all DEPs detected in clinical samples, only annexin A6 was synchronously up-regulated in CD133() subpopulations of both Caco-2 cells and one of the patient samples. Our data are in agreement with the results of a similar comparative proteomic study of CD133() and CD133() subpopulations of Caco-2 cells carried out by Corbo et al. [15], who also failed to find CEACAM5 among the DEPs. The degree to which a cancer cell line is relevant as a tumor model is often debated, and it is reported that results obtained in cell lines might be inconsistent with clinical data [41, 42]. Since a cell’s adjustment to the in vitro environment can alter its protein expression profile, the question of relevance should be considered in each particular case. Previously, we have shown that the CD133() subpopulation of the Caco-2 and HT-29 colon cancer cell lines display enhanced colony formation potential, proliferative activity, and Ki67 cell proliferation marker expression [43]. Cultured CD133() cells can undergo positive selection yielding cell populations with a high content of CD133() cells. For instance, the Caco-2 and HT-29 cell lines used in our experiments contained more than 90% and approximately 40% CD133() cells, respectively, whereas CEACAM5 was expressed by only approximately 7% of Caco-2 cells and about 1% of HT-29 (Fig. 5a and b). In contrast, in clinical samples, cell subpopulations expressing CEACAM5 are more abundant than CD133() subpopulations. Furthermore, our cytometric analysis of the cell lines did not reveal any correlation between expression levels of CD133 and CEACAM5, whereas such a correlation was evident in all clinical samples analyzed (Fig. 2).
Gene knockout is a powerful tool used to decode the function of gene. Gene editing in clinical material from solid tumors is problematic and subject to chance. Therefore, we performed CD133 knockout in cell lines under the assumption that the basic mechanisms of CEACAM5 expression are similar to those in tumor cells from clinical samples. CD133 was knocked out in Caco-2 and HT-29 colorectal adenocarcinoma cells using a commercially available CRISPR/Cas-9 gene-editing system. The flow cytometric analysis of knockout clones of both cell lines did not show statistically significant changes of CEACAM5 expression compared to control clones transfected with a scrambled gRNA plasmid. Therefore, direct involvement of the CD133 glycoprotein in the regulation of CEACAM5 expression in the two cell lines seems unlikely. However, it is worth noting that clonal variability in the number of CEACAM5-expressing cells was significantly higher among the knockout clones. Such diversity might occur for a number of reasons, including off-target effects. The interactions of CD133 and CEACAM5 on the cell surface are poorly understood. CD133 plays a significant role in the topological organization of stem cell membranes because of its association with plasma membrane protrusions, including microvilli [44]. CD133, as a cholesterol-binding protein, participates in the formation of lipid rafts [30]. In turn, CEACAM5 has a role in signaling by activating the integrin-mediated pathway in lipid rafts [45]. It is possible that CD133 can influence CEACAM5 distribution on the cell surface through plasmalemma remodeling. Interestingly, CD133 participates in the stabilization of EGFR in hepatocellular carcinoma [46].
Our results are not sufficient evidence of the differential expression of S100A8, S100A9, and DEFA1. S100A8 and S100A9 expression levels were close to each other in every individual sample. Whereas the formation of heterodimeric structures at the cell surface can explain the LC-MS/MS data, flow cytometry clearly revealed two separate intracellular proteins. In eight out of 15 samples analyzed altogether, CD133() cells contained substantially more S100 proteins compared to CD133() cells. Preferential expression of S100A8 and S100A9 possibly exists in some CSCs but is confined to specific subtypes of colorectal cancer [47]. The differences in the presence of neutrophil defensin 1 among the samples might be due to the immunological features of the tumor in this disease. This protein probably originates from the immune cells that infiltrate the tumor. In several samples, its concentration was much higher in CD133() cells. Interestingly, neutrophils – the primary source of defensin 1 – might be involved in cross-talk with CSCs that stimulates tumor progression [48]. Furthermore, as an element of the tumor niche, neutrophils can direct non-stem cancer cells to the CSC phenotype [49].
Conclusions
High expression of CEACAM5 in colorectal cancer is firmly associated with CD133() cells, which represent the subpopulation of CSCs responsible for progression and recurrence of the disease. This finding indicates the significance of directing targeted therapies or cell-based immunotherapy against this protein for preventing the relapse of colorectal cancer. CD133 knockout in the colon cancer cell lines Caco-2 and HT-29 did not affect the average level of CEACAM5 expression, suggesting no direct involvement of CD133 in the regulation of CEACAM5. However, CD133 knockout led to a higher variance in the percentage of CEACAM5-positive cells. This might be explained by CD133 altering the distribution of CEACAM5 on the cell surface through plasmalemma remodeling. S100A8, S100A9, and DEFA1 are overexpressed in CD133() cells only in a proportion of tumor samples taken from colorectal cancer patients, suggesting their possible prognostic value in some subtypes of colorectal cancer.
Footnotes
Acknowledgments
This work was supported by the Russian Science Foundation, grant number 18-15-00360. Mass spectrometry and cell sorting were performed using equipment belonging to the “Human Proteome” Core Facility of the Institute of Biomedical Chemistry, which is supported by the Ministry of Education and Science of the Russian Federation (agreement 14.621.21.0017, unique ID RFMEFI62117X0017).
Conflict of interest
The authors have no conflicts of interest to declare.
Author contributions
Conception: Alisa Gisina, Alexey Lupatov.
Interpretation or analysis of data: Alisa Gisina, Svetlana Novikova, Yan Kim, Stanislav Bykasov.
Preparation of the manuscript: Alisa Gisina, Svetlana Novikova, Dmitry Sidorov, Stanislav Bykasov, Konstantin Yarygin, Alexey Lupatov.
Revision for important intellectual content: Dmitry Sidorov, Nadezhda Volchenko, Victor Zgoda, Konstantin Yarygin.
Supervision: Andrey Kaprin, Konstantin Yarygin.
References
1.
HeppnerG.H., Tumor Heterogeneity, Cancer Res44 (1984), 2259–2265.
2.
MakinoS., The role of tumor stem-cells in regrowth of the tumor following drastic applications, Acta – Unio Int Contra Cancrum15 (1959), 196–198.
3.
ReyaT.MorrisonS.J.ClarkeM.F. and WeissmanI.L., Stem cells, cancer, and cancer stem cells, Nature414 (2001), 105–111.
4.
MageeJ.A.PiskounovaE. and MorrisonS.J., Cancer stem cells: impact, heterogeneity, and uncertainty, Cancer Cell21 (2012), 283–296.
5.
ChoR.W. and ClarkeM.F., Recent advances in cancer stem cells, Curr Opin Genet Dev18 (2008), 48–53.
6.
VisvaderJ.E. and LindemanG.J., Cancer stem cells in solid tumours: accumulating evidence and unresolved questions, Nat Rev Cancer8 (2008), 755–768.
7.
KimY.S.KaidinaA.M.ChiangJ.H.YaryginK.N. and LupatovA.Y., Molecular markers of cancer stem cells verified in vivo, Biomeditsinskaia Khimiia62 (2016), 228–238.
8.
SuvorovR.E.KimY.S.GisinaA.M.ChiangJ.H.YaryginK.N. and LupatovA.Y., Surface molecular markers of cancer stem cells: computation analysis of full-text scientific articles, Bull Exp Biol Med166 (2018), 135–140.
9.
ZhangQ.ShiS.YenY.BrownJ.TaJ.Q. and LeA.D., A subpopulation of CD133(+) cancer stem-like cells characterized in human oral squamous cell carcinoma confer resistance to chemotherapy, Cancer Lett289 (2010), 151–160.
10.
TaneiT.MorimotoK.ShimazuK.KimS.J.TanjiY.TaguchiT. et al., Association of breast cancer stem cells identified by aldehyde dehydrogenase 1 expression with resistance to sequential paclitaxel and epirubicin-based chemotherapy for breast cancers, Clin Cancer Res Off J Am Assoc Cancer Res15 (2009), 4234–4241.
11.
DyllaS.J.BevigliaL.ParkI.-K.ChartierC.RavalJ.NganL. et al., Colorectal cancer stem cells are enriched in xenogeneic tumors following chemotherapy, PloS One3 (2008), e2428.
12.
O’BrienC.A.PollettA.GallingerS. and DickJ.E., A human colon cancer cell capable of initiating tumour growth in immunodeficient mice, Nature445 (2007), 106–110.
13.
ScatenaR.BottoniP.PontoglioA. and GiardinaB., The proteomics of cancer stem cells: potential clinical applications for innovative research in oncology, Proteomics Clin Appl5 (2011), 590–602.
14.
ZouJ.YuX.-F.BaoZ.-J. and DongJ., Proteome of human colon cancer stem cells: a comparative analysis, World J Gastroenterol17 (2011), 1276–1285.
15.
CorboC.OrrùS.GemeiM.NotoR.D.MirabelliP.ImperliniE. et al., Protein cross-talk in CD133+ colon cancer cells indicates activation of the Wnt pathway and upregulation of SRp20 that is potentially involved in tumorigenicity, Proteomics12 (2012), 2045–2059.
16.
Ricci-VitianiL.LombardiD.G.PilozziE.BiffoniM.TodaroM.PeschleC. et al., Identification and expansion of human colon-cancer-initiating cells, Nature445 (2007), 111–115.
17.
VermeulenL.TodaroM.de Sousa MelloF.SprickM.R.KemperK.Perez AleaM. et al., Single-cell cloning of colon cancer stem cells reveals a multi-lineage differentiation capacity, Proc Natl Acad Sci U S A105 (2008), 13427–13432.
18.
Van HoudtW.J.EmminkB.L.PhamT.V.PiersmaS.R.VerheemA.VriesR.G. et al., Comparative proteomics of colon cancer stem cells and differentiated tumor cells identifies BIRC6 as a potential therapeutic target, Mol Cell Proteomics10 (2011), M111011353..
19.
WiśniewskiJ.R.ZougmanA.NagarajN. and MannM., Universal sample preparation method for proteome analysis, Nat Methods6 (2009), 359–362.
20.
LabunK.MontagueT.G.KrauseM.Torres CleurenY.N.TjeldnesH. and ValenE., CHOPCHOP v3: expanding the CRISPR web toolbox beyond genome editing, Nucleic Acids Res47 (2019), W171–174.
21.
BeaucheminN. and ArabzadehA., Carcinoembryonic antigen-related cell adhesion molecules (CEACAMs) in cancer progression and metastasis, Cancer Metastasis Rev32 (2013), 643–671.
22.
NonakaD.ChiribogaL. and RubinB.P., Differential expression of S100 protein subtypes in malignant melanoma, and benign and malignant peripheral nerve sheath tumors, J Cutan Pathol35 (2008), 1014–1019.
23.
KimH.-J.KangH.J.LeeH.LeeS.-T.YuM.-H.KimH. et al., Identification of S100A8 and S100A9 as serological markers for colorectal cancer, J Proteome Res8 (2009), 1368–1379.
24.
DuanL.WuR.YeL.WangH.YangX.ZhangY. et al., S100A8 and S100A9 are associated with colorectal carcinoma progression and contribute to colorectal carcinoma cell survival and migration via Wnt/β-catenin pathway, PloS One8 (2013), e62092.
25.
WilsonS.S.WiensM.E. and SmithJ.G., Antiviral mechanisms of human defensins, J Mol Biol425 (2013), 4965–4980.
26.
NastaseA.PâslaruL.NiculescuA.M.IonescuM.DumitraşcuT.HerleaV. et al., Prognostic and predictive potential molecular biomarkers in colon cancer, Chir Bucur106 (2011), 177–185.
27.
SethiM.K.Thaysen-AndersenM.KimH.ParkC.K.BakerM.S.PackerN.H. et al., Quantitative proteomic analysis of paired colorectal cancer and non-tumorigenic tissues reveals signature proteins and perturbed pathways involved in CRC progression and metastasis, J Proteomics126 (2015), 54–67.
28.
Expression of KRT1 in cancer – Summary – The Human Protein Atlas [Internet]. [cited 2020 Oct 12]. Available from: https://www.proteinatlas.org/ENSG00000167768-KRT1/pathology.
29.
LiouG.-Y., CD133 as a regulator of cancer metastasis through the cancer stem cells, Int J Biochem Cell Biol106 (2019), 1–7.
30.
JangJ.-W.SongY.KimS.-H.KimJ. and SeoH.R., Potential mechanisms of CD133 in cancer stem cells, Life Sci184 (2017), 25–29.
31.
FangD.D.KimY.J.LeeC.N.AggarwalS.McKinnonK.MesmerD. et al., Expansion of CD133(+) colon cancer cultures retaining stem cell properties to enable cancer stem cell target discovery, Br J Cancer102 (2010), 1265–1275.
32.
BenchimolS.FuksA.JothyS.BeaucheminN.ShirotaK. and StannersC.P., Carcinoembryonic antigen, a human tumor marker, functions as an intercellular adhesion molecule, Cell57 (1989), 327–334.
33.
IlantzisC.DeMarteL.ScreatonR.A. and StannersC.P., Deregulated expression of the human tumor marker CEA and CEA family member CEACAM6 disrupts tissue architecture and blocks colonocyte differentiation, Neoplasia4 (2002), 151–163.
34.
OrdoñezC.ScreatonR.A.IlantzisC. and StannersC.P., Human carcinoembryonic antigen functions as a general inhibitor of anoikis, Cancer Res60 (2000), 3419–3424.
35.
SorokinJ.J.SugarbakerP.H.ZamcheckN.PisickM.KupchikH.Z. and MooreF.D., Serial carcinoembryonic antigen assays. Use in detection of cancer recurrence, JAMA228 (1974), 49–53.
36.
JantscheffP.TerraccianoL.LowyA.Glatz-KriegerK.GrunertF.MicheelB. et al., Expression of CEACAM6 in resectable colorectal cancer: a factor of independent prognostic significance, J Clin Oncol Off J Am Soc Clin Oncol21 (2003), 3638–3646.
37.
LuoH.ShenK.LiB.LiR.WangZ. and XieZ., Clinical significance and diagnostic value of serum NSE, CEA, CA19-9, CA125 and CA242 levels in colorectal cancer, Oncol Lett20 (2020), 742–750.
38.
XuZ.WangH.GaoL.ZhangH. and WangX., YAP levels combined with plasma CEA levels are prognostic biomarkers for early-clinical-stage patients of colorectal cancer, BioMed Research International2019 (2019), e2170830.
39.
RamphalW.BoedingJ.R.E.van IwaardenM.SchreinemakersJ.M.J.RuttenH.J.T.CrollaR.M.P.H. et al., Serum carcinoembryonic antigen to predict recurrence in the follow-up of patients with colorectal cancer, Int J Biol Markers34 (2019), 60–68.
40.
ShimadaR.IinumaH.AkahaneT.HoriuchiA. and WatanabeT., Prognostic significance of CTCs and CSCs of tumor drainage vein blood in Dukes’ stage B and C colorectal cancer patients, Oncol Rep27 (2012), 947–953.
41.
GilletJ.-P.VarmaS. and GottesmanM.M., The clinical relevance of cancer cell lines, J Natl Cancer Inst105 (2013), 452–458.
42.
GaiserT.CampsJ.MeinhardtS.WangsaD.NguyenQ.T.VarmaS. et al., Genome and transcriptome profiles of CD133-positive colorectal cancer cells, Am J Pathol178 (2011), 1478–1488.
43.
GisinaA.M.KimY.S.PotashnikovaD.M.TvorogovaA.V.YaryginK.N. and LupatovA.Y., Proliferative activity of colorectal cancer cells with different levels of CD133 expression, Bull Exp Biol Med167 (2019), 541–545.
44.
ThammK.ŠimaitėD.KarbanováJ.BermúdezV.ReichertD.MorgensternA. et al., Prominin-1 (CD133) modulates the architecture and dynamics of microvilli, Traffic Cph Den20 (2019), 39–60.
45.
Camacho-LealP.ZhaiA.B.StannersC.P., A co-clustering model involving alpha5beta1 integrin for the biological effects of GPI-anchored human carcinoembryonic antigen (CEA), J Cell Physiol211 (2007), 791–802.
46.
JangJ.-W.SongY.KimS.-H.KimJ.-S.KimK.M.ChoiE.K. et al., CD133 confers cancer stem-like cell properties by stabilizing EGFR-AKT signaling in hepatocellular carcinoma, Cancer Lett389 (2017), 1–10.
47.
Ten HoornS.TrinhA.de JongJ.KoensL. and VermeulenL., Classification of colorectal cancer in molecular subtypes by immunohistochemistry, Methods Mol Biol1765(2018), 179–191.
48.
HwangW.-L.LanH.-Y.ChengW.-C.HuangS.-C. and YangM.-H., Tumor stem-like cell-derived exosomal RNAs prime neutrophils for facilitating tumorigenesis of colon cancer, J Hematol Oncol12 (2019), 10.
49.
ZhouS.-L.YinD.HuZ.-Q.LuoC.-B.ZhouZ.-J.XinH.-Y. et al., A positive feedback loop between cancer stem-like cells and tumor-associated neutrophils controls hepatocellular carcinoma progression, Hepatol Baltim Md70 (2019), 1214–1230.