
Abstract
OBJECTIVE:
N6-methyladenosine (m6A) is a common RNA modification on eukaryotic mRNA and some of the m6A regulatory proteins play a crucial role in breast cancer. However, the copy number variations for m6A regulatory proteins and their role in clinicopathological characteristics and survival in breast cancer remain unclear.
METHODS:
In this study, we screened the m6A related genes alterations in breast cancer by analyzing the Molecular Taxonomy of Breast Cancer International Consortium and The Cancer Genome Atlas database, and further analyzed the clinical prognostic value of YTHDF1 amplification.
RESULTS:
The YTH domain family (YTHDF3 and YTHDF1) amplification exhibited higher alteration rates among 10 m6A regulatory genes. YTHDF1 and YTHDF3 amplification resulted in higher mRNA expression (
CONCLUSIONS:
We found significant worse clinical characteristics and lower immune infiltrates in patients with YTHDF1 amplification. The findings indicate that YTHDF1 amplification may be a potential target for the treatment of breast cancer.
Abbreviations
Introduction
Breast cancer is the most common type of cancer with the second highest mortality rate worldwide, affecting a large number of women. In 2017,
RNA modification has attracted broad interest due to its potential to regulate genes at the post-transcriptional level. N6-methyladenosine (m6A) is the most prevalent type of RNA modification on eukaryotic mRNA [9]. The important roles of m6A in mRNA translation efficiency [10], regulation of gene expression [11, 12], and other biological processes, thereby causing diseases in humans, were recently reported [13]. The regulatory proteins of m6A include “writer” and “eraser” acting as methyltransferase and demethylase, respectively [13, 14], and “reader” which recognizes m6A-modified mRNA [14]. Several m6A “writer”, “eraser” and “reader” proteins have been reported [12, 15, 16, 17, 18]. The members of the YTH domain family 1–3 (YTHDF1, YTHDF2, YTHDF3) are important m6A cytoplasmic readers. YTHDF1 and YTHDF3 promote the translation of m6A-methylated mRNA by recruiting translation initiation factors [17]. Although the members of the YTH domain family are closely related to pathogenesis, there is limited knowledge regarding their role in the correlations with breast cancer.
In the present study, we sought to characterize the copy number variations (CNVs) of m6A RNA regulatory genes in cohorts of patients with breast cancer, and further evaluate the association between YTHDF1 and YTHDF3 amplification with clinicopathologic characterization and survival. Furthermore, we also analyzed the associated molecular pathway and underlying mechanism in patients with YTHDF1 amplification.
Material and methods
Cohort data collection
We extracted the clinical, somatic CNV data and mRNA expression data from the Molecular Taxonomy of Breast Cancer International Consortium (METABRIC) and The Cancer Genome Atlas (TCGA) data from cBioPortal (
Kaplan-Meier plotter
To analyze the prognostic value of YTHDF1 and YTHDF3, survival analysis was performed on KM plotter (
Gene set enrichment analysis (GSEA)
GSEA was performed with the TCGA data set using the GSEA v4.0.1 software (Broad Institute, UT, USA) [23, 24]. Patients were classified into an YTHDF1 amplification group and wild-type group. Enrichment of gene sets for YTHDF1 amplification and non-altered groups was computed with the form of “h” versus “l” and the permutation number of 1,000. Hallmark and immune signature gene data sets were downloaded through the GSEA software. Gene data sets were considered to be significantly enriched with a false discovery rate
UALCAN and clinical proteomic tumor analysis consortium (CPTAC)
We observed YTHDF1 and YTHDF3 protein expression profiles from clinical proteomic tumor analysis consortium (CPTAC) on UALCAN (
Immune cell infiltration analysis
Tumor Immune Estimation Resource (TIMER) is a public web server for the analysis of immune cell infiltration across all major types of cancer [27, 28]. Six types of immune cells were included (i.e., B cells, CD4+ T cells, CD8+ T cells, macrophages, neutrophils, and dendritic cells). We used the somatic copy number alteration (SCNA) module and expression level to investigate the extend of infiltration of these six immune cells. The SCNAs were classified according to GISTIC 2.0 (Genomic Identification of Significant Targets in Cancer) [29]. The comparison of immune cell infiltration between two groups was performed using a two-sided Wilcoxon rank-sum test.
Association between YTHDF1 amplification status and clinicopathological characteristics
Association between YTHDF1 amplification status and clinicopathological characteristics
HR, hormone receptor; WT, wild type; MUT, mutant; Pos, possitive; Neg, negative; AMP, amplification.
MDA-MB-231 and MCF-7 cells were obtained from the Cell Bank of Type Culture Collection (Chinese Academy of Sciences, Shanghai, China). Cells were cultured in Dulbecco’s Modified Eagle’s Medium (DMEM, Gibco, Grand Island, USA) containing 10% fetal bovine serum (Gibco) at 37
For each sample, mRNA expression was normalized to GAPDH. Relative fold changes were calculated utilizing the 2-
Wound healing assay
To examine the migratory ability, MDA-MB-231 and MCF-7 cells were incubated in 6-wells overnight. Then cells were transfected with psi-LVRU6GP vector, shRNA-1 and shRNA-2 plasmids. Three straight scratches across each well were created in the cell layer by a pipette tip after transfected with indicated plasmids. Then cells were cultured with the medium containing 2% FBS for 48 h. Wound closure was observed under a microscope after 48 h of incubation. The migratory activity was assessed by measuring the distance of migration into the scratches in each well and the migration rate was calculated as the ratio of the relative migration distance in the shRNA group to the relative migration distance in the vector group.
Characterization of m6A regulatory gene alteration in breast cancer patients. (A) Percentages of CNVs of ten m6A regulators and three oncogenes in breast cancer patients based on METABRIC cohort. (B) OncoPrint of ten m6A and three oncogenes regulators in breast cancer patients based on METABRIC cohort. The data were obtained and visualized by cBioPortal database [19, 20] using the METABRIC Breast Invasive Carcinoma dataset with modifications.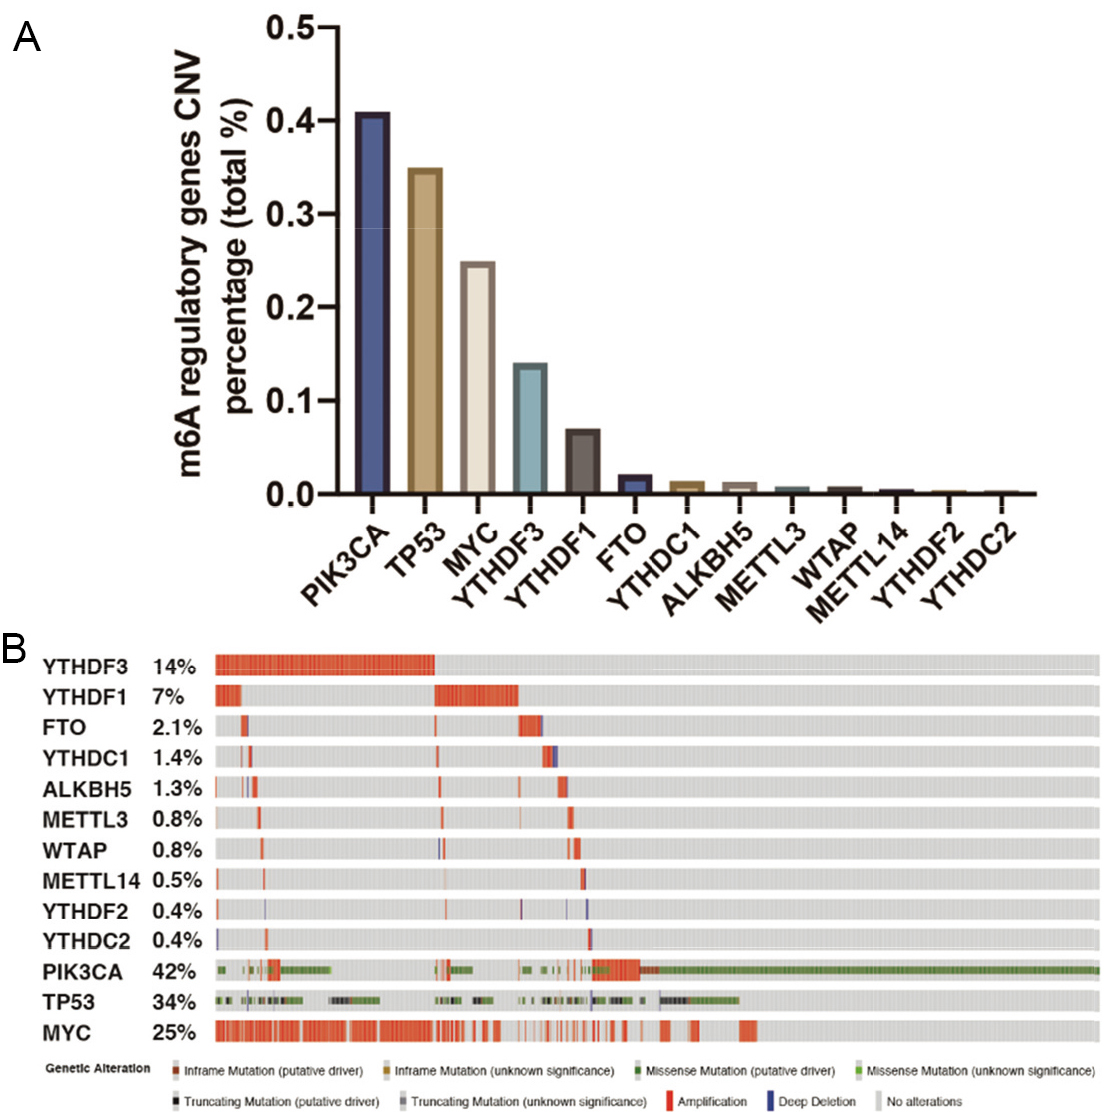
MDA-MB-231 and MCF-7 cells were incubated in 6-well plates and allowed to attach overnight. MDA-MB-231 and MCF-7 cells were transfected with psi-LVRU6GP vector, shRNA-1 and shRNA-2 plasmids by Lipofectamine 2000 Transfection Reagent according to the manufacturer’s protocol. Then cells were digested and suspended in starvation medium. Cells were counted by 0.4% Trypan Blue, 1
Association between YTHDF3 amplification status and clinicopathological characteristics
Association between YTHDF3 amplification status and clinicopathological characteristics
HR, hormone receptor; WT, wild type; MUT, mutant; Pos, positive; Neg, negative; AMP, amplification.
Pearson’s chi-squared test, Fisher’s exact test,
Results
CNVs of m6A regulatory genes in patients with breast cancer
Firstly, we targeted 10 m6A regulatory genes, namely YTHDF3, YTHDF1, FTO, YTHDC1, ALKBH5, METTL3, WTAP, METTL14, YTHDF2, and YTHDC2. Most frequently altered genes, including PIK3CA, TP53, and MYC, were also analyzed for comparison with the above 10 genes.
The CNVs of m6A regulatory genes in 2,173 patients of the METABRIC cohort are described in Fig. 1A. Among them, the m6A reader genes YTHDF3 and YTHDF1 ranked the highest in alteration rate (14% and 7%, respectively). In contrast, we found only a small proportion of gene alterations among the other eight genes. An oncoprint spectrum of 10 m6A regulatory genes and three genes with frequent alterations from cBioPortal [19, 20] is shown in Fig. 1B, in which individual samples and genes are represented as columns and rows, respectively. Obviously, amplification accounted for the majority of gene alterations. In addition, deep deletion in CNVs was observed in a relatively small proportion of patients. Alterations of m6A regulatory genes in breast cancer were partially overlapped with those of the three frequently altered genes (Fig. 1B and Tables 1 and 2).
YTHDF1 and YTHDF3 amplification were associated with higher expression
Next, the effects of YTHDF1 and YTHDF3 amplification on gene expression were analyzed. As expected, the mRNA levels of YTHDF1 and YTHDF3 were significantly higher in the amplification group in both YTHDF1 and YTHDF3 groups (Figs 2A and B). Moreover, the protein expression of YTHDF1 and YTHDF3 were higher than normal tissue (Figs 3A and B). Analysis of the TCGA pan-cancer cohorts [26] showed that YTHDF1 also presented high expression in breast cancer tumors across 24 types of cancer (Supplementary Fig. 1).
Correlation between mRNA expression levels according to gene amplification. (A) YTHDF1 expression levels comparison between YTHDF1 amplification YTHDF1 wild type. (B) YTHDF3 expression levels comparison between YTHDF3 amplification and YTHDF3 wild type. WT, wild type. 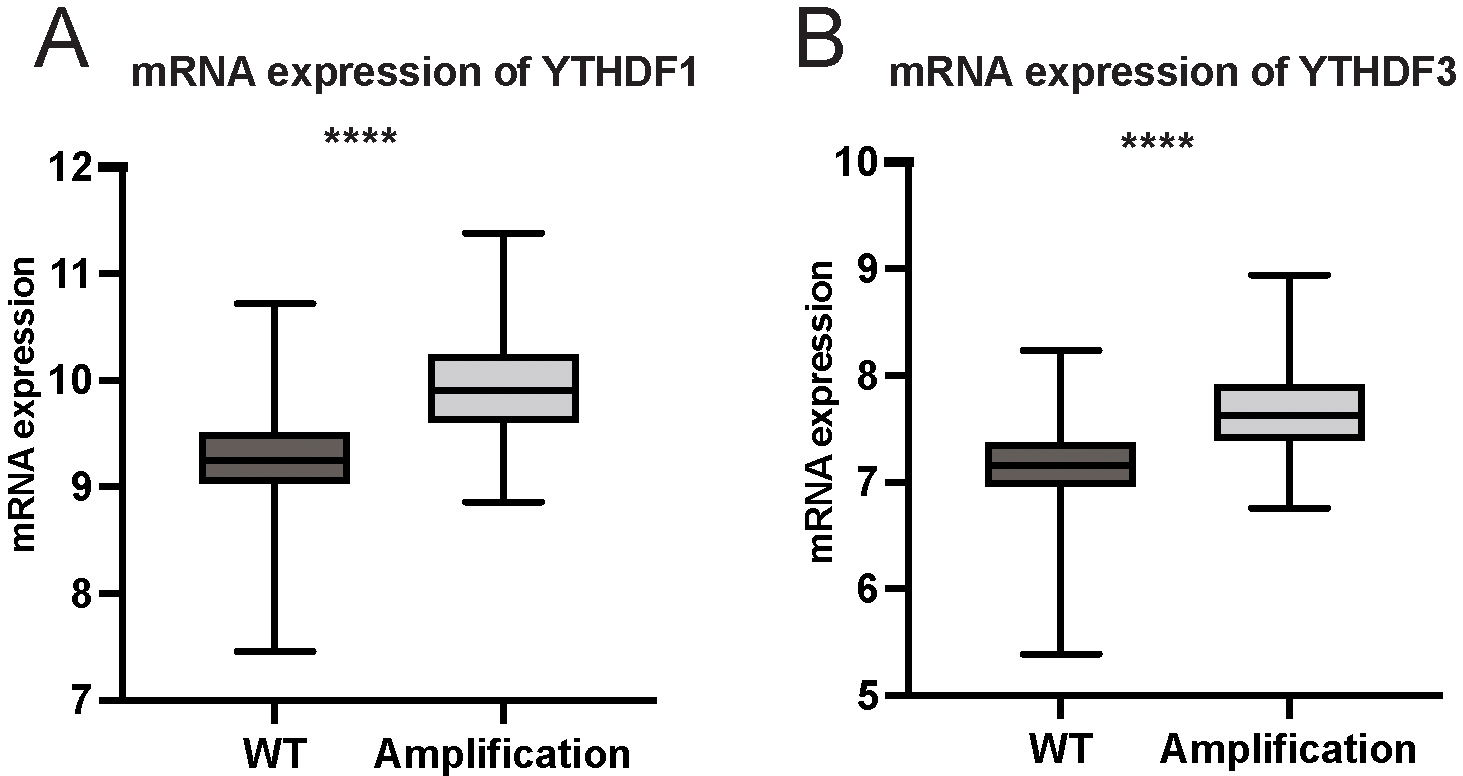
Comparison between protein expression of YTHDF1 (A) and YTHDF3 (B) between breast cancer and normal tissue. 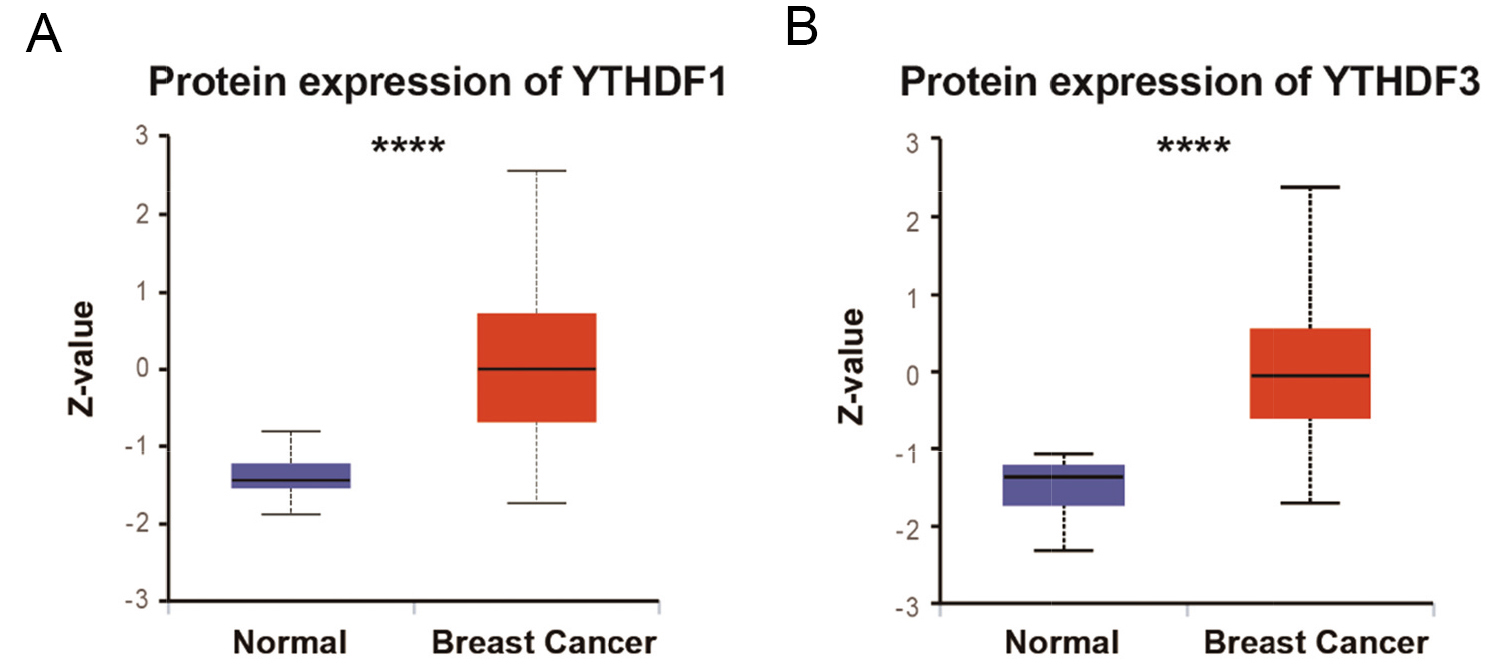
YTHDF1 and YTHDF3 exhibited a higher incidence of amplifications in patients with breast cancer. Therefore, we assessed the relationship between the YTHDF1 or YTHDF3 amplification status and clinicopathological characteristics of patients with breast cancer using the METABRIC data set. We observed a higher proportion of lymph node metastasis, progesterone receptor negative rate, human epidermal growth factor receptor 2 (HER2) positive rate, and PAM50 subtype in both the YTHDF1 (Table 1) and YTHDF3 (Table 2) amplification groups.
PIK3CA, TP53, MYC are the most frequently altered genes and play important roles in breast cancer. Hence, we also assessed the relationship between YTHDF1, YTHDF3, and those three frequently mutated genes. As expected, YTHDF1 amplification had a high correlation with PIK3CA mutation, TP53 mutation, and MYC amplification (Table 1 and Fig. 1B), while YTHDF3 amplification was only correlated with PIK3CA mutation (Table 2).
Association between YTHDF1 and YTHDF3 amplification and survival of patients with breast cancer
We further estimated the effect of CNV on overall survival (OS), especially YTHDF1 and YTHDF3 amplification, to evaluate the prognostic value of m6A regulatory gene CNVs.
Univariate and multivariate Cox proportional hazard analysis for 10-year overall survival
Univariate and multivariate Cox proportional hazard analysis for 10-year overall survival
HR, hazards ratio; CI, confidence intervals; ER, Estrogen receptor; PR, Progesteron receptor.
Kaplan-Meier estimates of overall survival (OS) are shown according to YTHDF1 and YTHDF3 amplification status. (A) Kaplan-Meier (K-M) curves of OS according to YTHDF1 amplification status in METABRIC cohort. (B) K-M curves of OS according to YTHDF3 amplification status. OS, overall survival; K-M, Kaplan-Meier.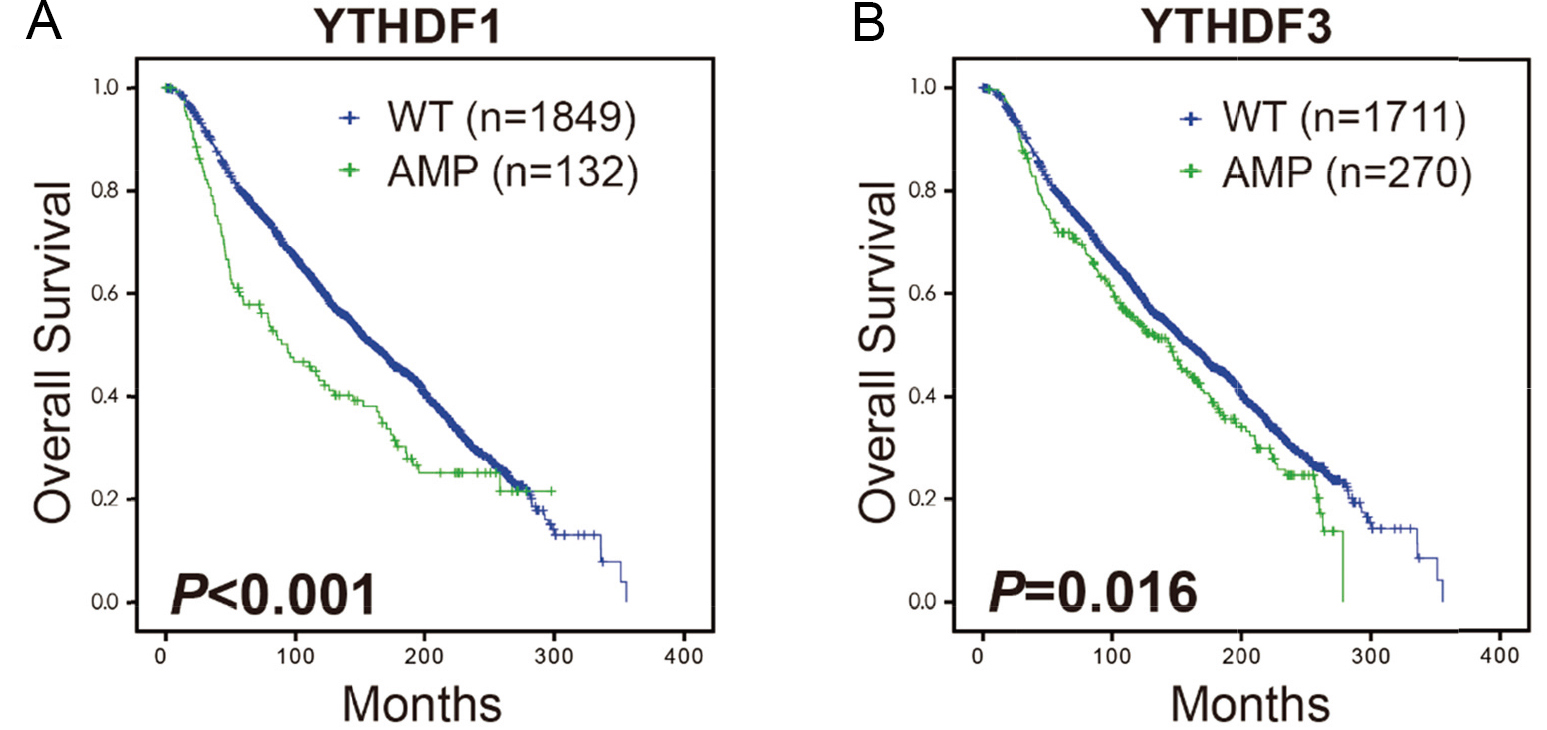
Subsequently, we focused on the prognostic effect of YTHDF1 and YTHDF3 on OS in the METABRIC breast cancer cohort. Patients with YTHDF1 amplification had significantly lower OS those with YTHDF1 non-amplification (
Kaplan-Meier estimates of survival are shown according to YTHDF1 and YTHDF3 mRNA expression. (A) Kaplan-Meier curves of overall survival (OS) are shown according to YTHDF1 expression. (B) Kaplan-Meier curves of OS are shown according to YTHDF3 expression. (C) Kaplan-Meier curves of relapse free survival (RFS) are shown according to YTHDF1 expression. (D) Kaplan-Meier curves of RFS are shown according to YTHDF3 expression. (E) Kaplan-Meier curves of distance metastasis free survival (DMFS) are shown according to YTHDF1 expression. (F) Kaplan-Meier curves of DMFS are shown according to YTHDF3 expression. OS, overall survival; K-M, Kaplan-Meier; RFS, relapse free survival; DMFS, distance metastasis free survival.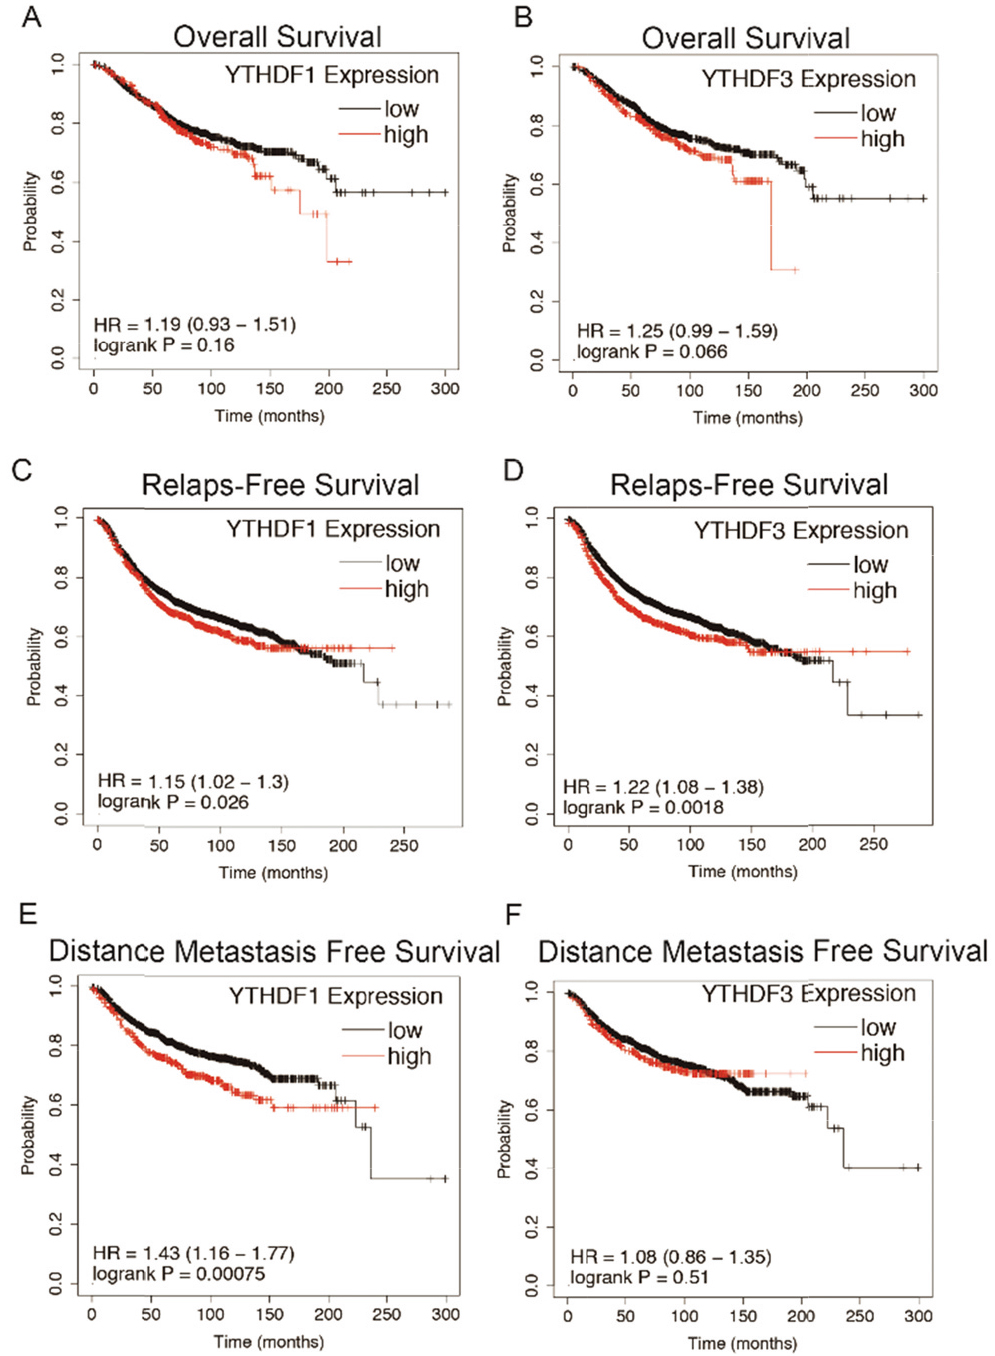
GSEA results of YTHDF1 amplification status. Gene set enrichment plots of G2M checkpoint (A), E2F targets (B), MYC targets (C) and DNA repair (D) correlated to YTHDF1 amplification in breast cancer of TCGA data set. 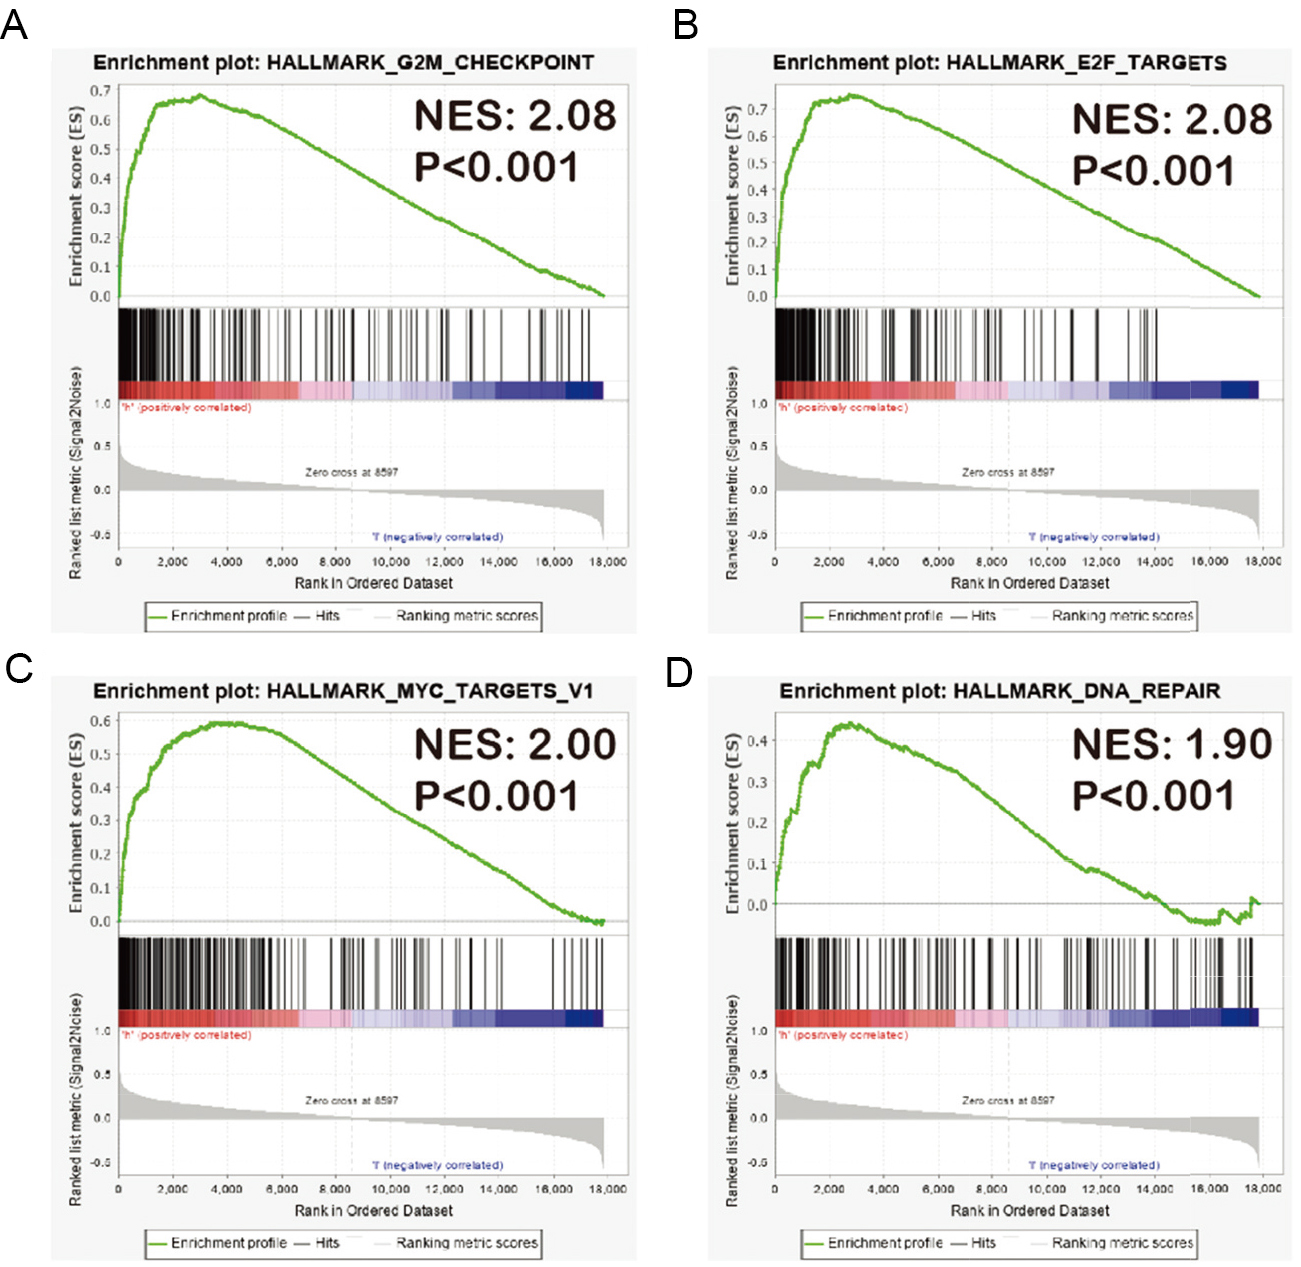
YTHDF1 and YTHDF3 amplification resulted in higher mRNA expression. Thus, we further confirmed the correlation between YTHDF1 and YTHDF3 expression and survival. After analyzing on KM plotter [22], we observed that the YTHDF1 high expression group (upper quarter) was associated with a significant lower relapse free survival (RFS) (
Enrichment analysis of YTHDF1 amplification
On the basis of the role of YTHDF1 in m6A methylation and the above results, we further evaluated the enriched gene sets in samples with and without amplification of YTHDF1. The GSEA analysis revealed that YTHDF1 amplification significantly enriched biological pathways, including the G2/M checkpoint (Fig. 6A), cell cycle-related targets of E2F transcription (Fig. 6B), MYC regulation (Fig. 6C), and DNA repair regulation (Fig. 6D). This finding indicated the important function of YTHDF1 in cell cycle regulation, in line with previous studies [17, 30]. We also performed GSEA with immunologic signatures gene sets, observing a high enrichment in the polarization of T-cell differentiation (Supplementary Fig. 2). The regulation of downstream genes by YTHDF1 remains under investigation.
Effect of YTHDF1 amplification on the infiltration of immune cells in breast cancer
We applied the DNA SCNA in TIMER server (cistrome.shinyapps.io/timer) to illustrate the infiltration of immune cells in breast cancer patients with YTHDF1 amplification [27, 28]. Six tumor infiltration immune cells, including dendritic cells, macrophages, neutrophils, CD4+ T cells, CD8+ T cells, and B cells, were analyzed in the TCGA breast cancer cohort with genomic data. CD4+ T cells, macrophages, dendritic cells, and B cells were diminished in patients with YTHDF1 amplification versus diploid/normal patients (Fig. 7A). As expected, immune infiltrates in YTHDF1 high expression were lower than those in YTHDF1 low expression group (Fig. 7B). Given the GSEA result of enrichment in T-cell differentiation, these data showed the potential function of YTHDF1 in the regulation of immune cells by affecting the modification of m6A.
Tumor-infiltrating immune cell comparison according to YTHDF1 status. (A) Abundance of tumor-infiltrating immune cell for YTHDF1 copy number status in breast cancer in The Cancer Genome Atlas (TCGA). (B) Abundance of tumor-infiltrating immune cell for YTHDF1 expression status in breast cancer in TCGA. The abundance of six tumor-infiltrating immune cell types (B cells, CD4+ T cells, CD8+ T cells, neutrophils, macrophages, and dendritic cells) in TCGA are shown. Box plots are presented to show the distributions of each tumor-infiltrating immune cell subset for selected group. 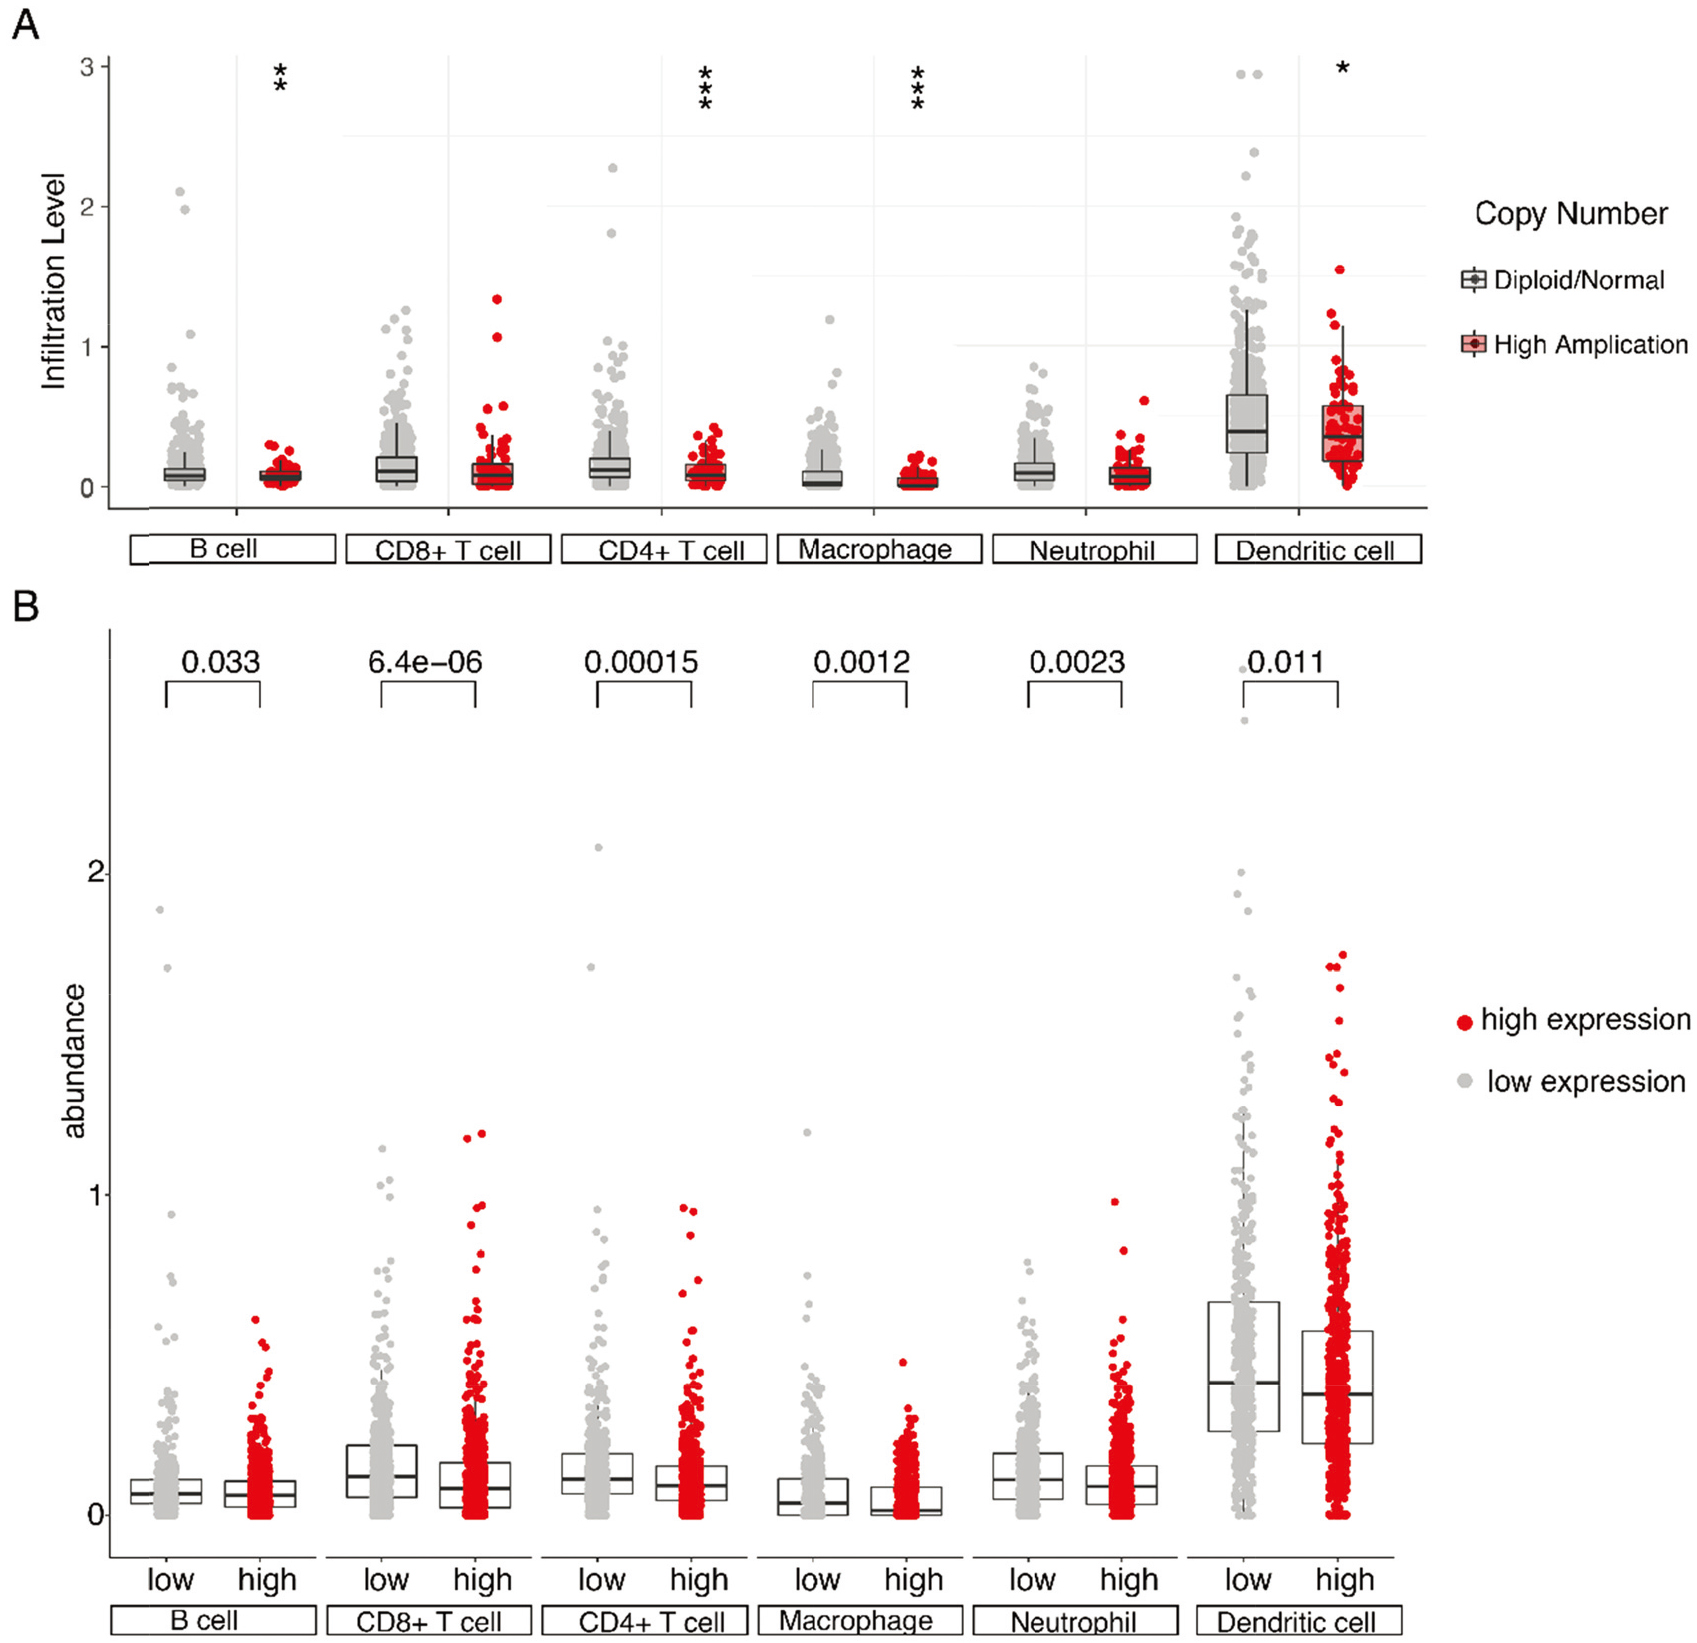
Effects of YTHDF1 down-regulation on MDA-MB-231 and MCF-7 cell proliferation, migration and invasion. (A) YTHDF1 mRNA expressions were detected in MDA-MB-231 and MCF-7 cells after transfected with psi-LVRU6GP vector, shRNA-1 and shRNA-2 plasmids. (B) CCK8 assays showed the cell proliferation of MDA-MB-231 and MCF-7 cells after transfected with psi-LVRU6GP vector, shRNA-1 and shRNA-2 plasmids. The survival cells were detected on day 0, 1, 2, 3, 5. (C) Wound healing assays revealed the migration ability of psi-LVRU6GP vector, shRNA-1 and shRNA-2 plasmids transfected MDA-MB-231 and MCF-7 cells. Upper: Representative micrographs of wound healing assay. Below: The quantification data for migration rates are shown in histograms. (D) Transwell assays showed the migration ability and invasion ability of MDA-MB-231 and MCF-7 cells after transfected with psi-LVRU6GP vector, shRNA-1 and shRNA-2 plasmids. Left: Representative micrographs of transwell migration assays. Right: Representative micrographs of matrigel invasion assays. The quantification data for migration and invasion numbers are shown in histograms. All data are the means 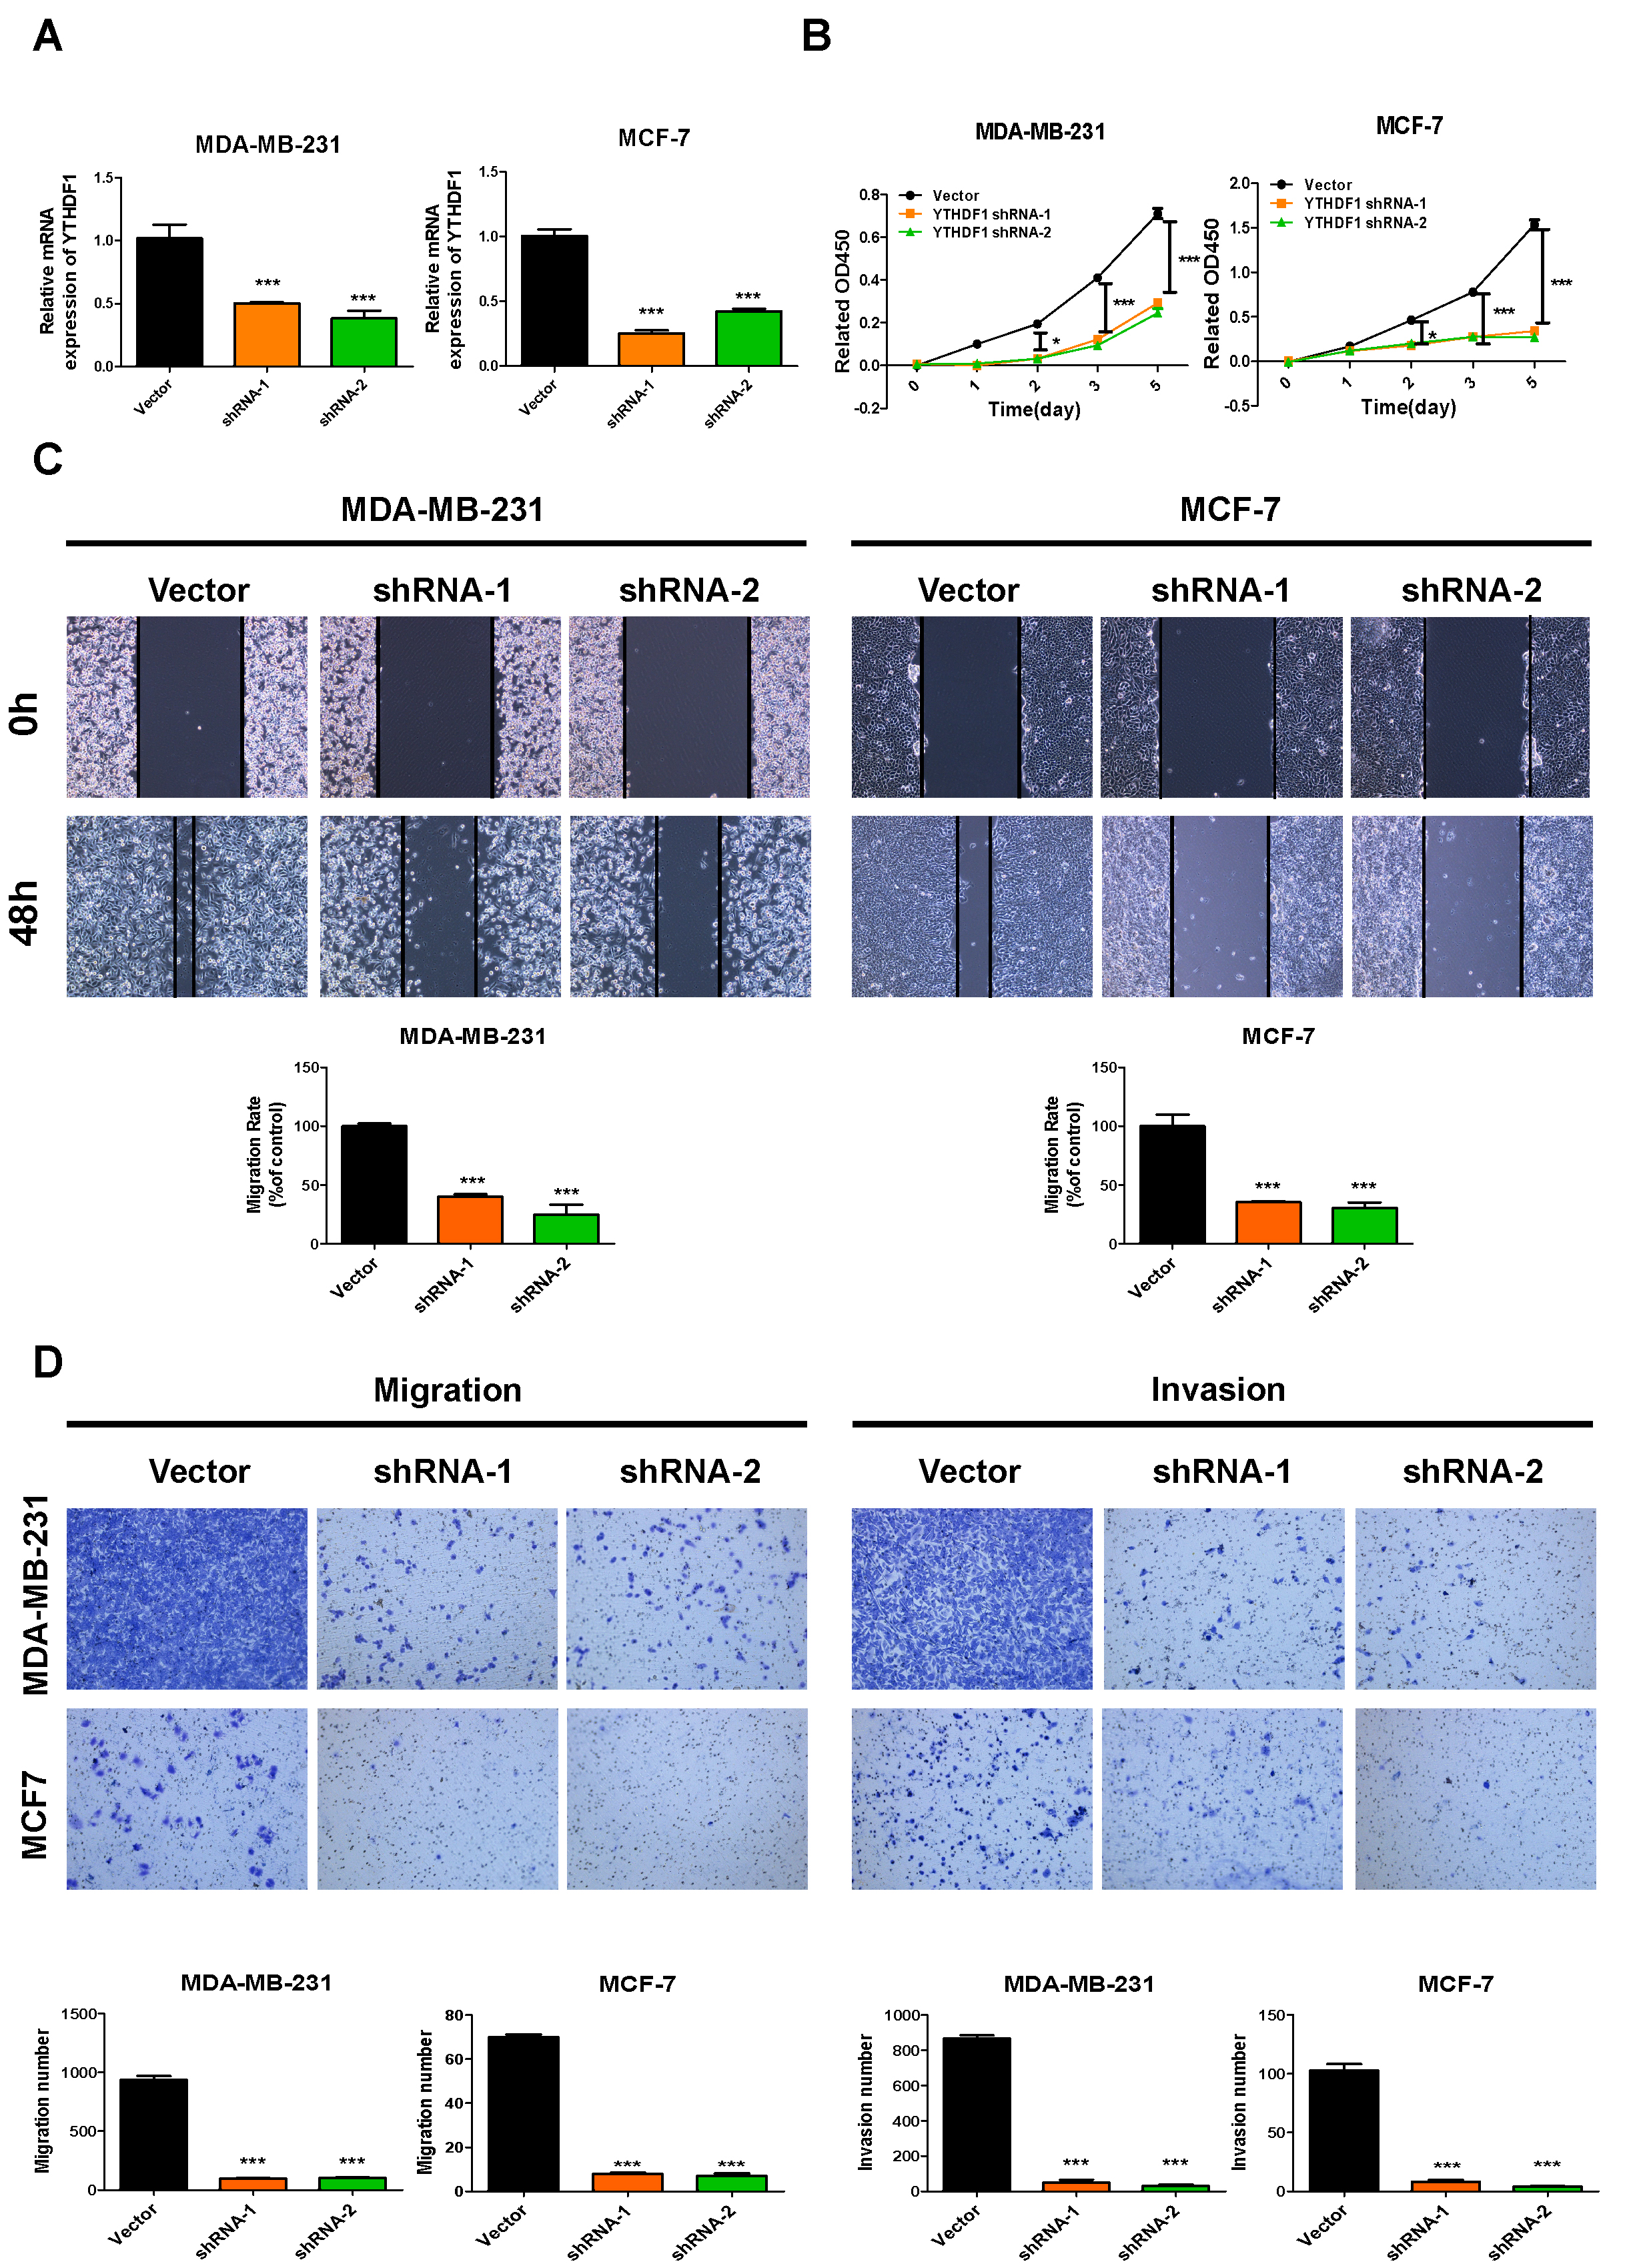
To explore the loss of function of YTHDF1 in breast cancer cell, we transfected two breast cancer cell lines, MDA-MB-231 and MCF-7, with two independent shRNAs targeted YTHDF1 mRNA. YTHDF1 mRNA expression were confirmed down-regulated in shRNA-1 and shRNA-2 groups in both MDA-MB-231 and MCF-7 cells (Fig. 8A). After transfected with shRNA-1 and shRNA-2, MDA-MB-231 and MCF-7 cells showed lower proliferation in CCK8 assays (Fig. 8B). The wound healing assays indicated the migration ability were inhibited by shRNA-1 and shRNA-2 in both MDA-MB-231 and MCF-7 cells (Fig. 8C). The transwell assays revealed the migration and invasion were restrained by knockdown of YTHDF1 (Fig. 8D).
Discussion
Large-scale, next-generation sequencing allows us to understand the biogenesis of breast cancer in a convenient manner to determine the mutation landscape of breast cancer. Thus, copy number alterations (e.g., ERBB2 amplification [2], MYC amplification [31], FGFR1 amplification [32], and CCND1 amplification [33]) offer great potential for the development of gene-targeted therapy. Molecular profiling has revealed that breast cancer is heterogeneous, and an increasing number of CNVs in driver genes and targetable genes have been identified [7]. In a recent study of clear cell renal cell carcinoma (ccRCC), YTHDF2 showed a high alteration rate (55.11%), followed by METTL3 (30.11%) [18]. Although changes in the expression of m6A regulatory genes have been investigated, CNVs in breast cancer remain unclear. For this reason, we performed the first investigation of CNVs of m6A regulatory genes in patients with breast cancer.
The frequency of CNVs among the 10 m6A regulatory genes examined was relatively lower than those reported in ccRCC [18] and acute myeloid leukemia (AML) [34]. More importantly, other CNVs types (e.g., deep deletion, shallow deletion, and copy number gain) were more likely to occur in ccRCC and AML rather than the predominant amplification observed in our cohorts. Notably, the frequency of YTHDF1 (22.73%) in ccRCC was also higher than that recorded in our METABRIC results (14%). Compare to the low frequency of CNVs in breast cancer in TCGA, the frequency of CNVs in METABRIC was higher. Hence, we performed a clinicopathologic correlation analysis with METABRIC. Moreover, it is also worth noting that the 10 m6A regulatory genes exhibited a low concurrent alteration rate, except the YTHDF1 and YTHDF3 overlap. This result indicated that CNVs in regulatory genes may function independently.
In addition to the high frequency of CNVs, the functions of YTHDF1 and YTHDF3 show a great potential in the pathogenesis of breast cancer. YTH domain family genes interplay with hundreds of mutual targets. In the cytoplasm, m6A-binding protein YTHDF1 recruits m6A-modified mRNA to accelerate the recruitment of translation initiation factors and ribosomes, thereby increasing the efficiency of translation [10]. Shi et al. described that YTHDF3 interplays with YTHDF1 and modulates the translation of target cellular mRNA in HeLa cells [17]. Thus, we estimated the effect of YTHDF1 and YTHDF3 in the survival of patients with breast cancer. Since there are few events of amplification and shorter follow-up period in TCGA cohort, we finally used METABRIC to perform survival and Cox regression analysis. According to our results, YTHDF1 and YTHDF3 were significantly related to OS. Obviously, YTHDF1 exerted a more profound effect on OS, considering that patients with YTHDF1 amplification were associated with a poor outcome. The prognostic effects were also confirmed by Cox regression analysis. Similar to our results, CNVs in ccRCC [18] and AML [34] also predicted worse survival. Because recurrence data was unknown in METATRIC, RFS and DMFS were not compared. In addiction, with the use of KM-plotter, we confirmed the effect of YTHDF1 and YTHDF3 expression on survival including OS, RFS and DMFS with a larger cohort.
YTHDF3, the third member of the YTH family, shares
Amplification of the YTHDF1 and YTHDF3 m6A regulatory genes caused an increase in mRNA expression. The effect of YTHDF1 and YTHDF3 amplification in prognosis may be closely related to high mRNA expression; however, such evidence has not been previously reported. The mRNA expression in m6A “writer” genes (WTAP, METTL3 and METTL14) was lower in breast cancer tumors than in normal tissues [35]. In addition, the m6A “eraser” gene FTO showed high expression in breast cancer tumors, causing BNIP3 m6A demethylation and subsequent progression of breast cancer [36]. m6A “reader” genes, including YTHDF1 and YTHDF3, were not well investigated in the above two reports. Herein, we reported for the first time that YTHDF1 and YTHDF3 may be novel targets of m6A regulation in breast cancer.
A more recent study revealed that antigen-specific CD8+ T cell antitumor immune response was elevated in YTHDF1-knockout mice [37]. Lysosomal proteases encoding m6A-modified mRNA binds with YTHDF1 in dendritic cells, and subsequently suppresses the cross-priming of CD8+ T cells and cross-presentation of tumor antigens. More interestingly, the effect of anti-PD-L1 therapy in YTHDF1-knockout mice is elevated, showing the potential of YTHDF1 as a target for checkpoint inhibition therapy. We found that macrophages, dendritic cells, and B cells were reduced in patients with YTHDF1 amplification, prompting that YTHDF1 may regulate the infiltration of immune cells. They also confirmed that colon cancer patients with low YTHDF1 expression present lower CD8+ T cell infiltration; however, this result was not confirmed in breast cancer. In the current study, we found that CD4+ T cells, macrophages, dendritic cells, and B cells exhibited less infiltration in patients with YTHDF1 amplification. Nevertheless, the mechanism through which YTHDF1 influences the tumor microenvironment by affecting m6A modification in breast cancer remains unclear. Moreover, highly enriched gene sets in polarization of T-cell differentiation were found in the YTHDF1 amplification group, indicating that YTHDF1 may regulate T-cell differentiation through m6A modification. Hence, YTHDF1 appears to be a novel target for immune checkpoint therapy.
Of note,
In conclusion, the present analysis illustrated the genetic alterations of m6A regulatory genes in breast cancer. The findings revealed a significant correlation between clinical characteristics and YTHDF1 amplification. YTHDF1 amplification confers a poorer outcome and is an independent risk factor for 10-year OS in patients with breast cancer. Moreover, YTHDF1 amplification resulted in less infiltration of immune cells. The potential regulator/downstream targets of YTHDF1 in the pathogenesis and progression of breast cancer may be the MYC signaling pathway and T-cell differentiation. YTHDF1 down-regulation inhibits proliferation, migration and invasion in breast cancer cells in vitro. However, the oncogenic effect of YTHDF1 still requires further mechanistic studies.
Author contributions
For every author, his or her contribution to the manuscript needs to be provided using the following categories:
Conception: Ning Liao; Cheukfai Li; Chuanzhao Zhang.
Interpretation or analysis of data: Cheukfai Li; Chuanzhao Zhang.
Preparation of the manuscript: Cheukfai Li; Chuanzhao Zhang.
Revision for important intellectual content: Guochun Zhang; Bo Chen; Xuerui Li; Kai Li; Chongyang Ren; Lingzhu Wen; Ning Liao.
Supervision: Ning Liao.
Supplementary data
The supplementary files are available to download from http://dx.doi.org/10.3233/CBM-203103.
sj-docx-1-cbm-10.3233_CBM-203103.docx - Supplemental material
Supplemental material, sj-docx-1-cbm-10.3233_CBM-203103.docx
Footnotes
Acknowledgments
This study was supported by funding from Guangdong Basic and Applied Basic Research Foundation (2021A1515111003), Research Funds from Guangzhou Municipal Science and Technology Project (202102020 195), Project of Administration of Traditional Chinese Medicine of Guangdong Province of China (20221002) and Project of Doctor scientific research from Guangdong Provincial People’s Hospital (2020bq12).