
Abstract
BACKGROUND:
Alimentary tract cancers (ATCs) are the most malignant cancers in the world. Numerous studies have revealed the tumorigenesis, diagnosis and treatment of ATCs, but many mechanisms remain to be explored.
METHODS:
To identify the key genes of ATCs, microarray datasets of oesophageal cancer, gastric cancer and colorectal cancer were obtained from the Gene Expression Omnibus (GEO) database. In total, 207 differentially expressed genes (DEGs) were screened. KEGG and GO function enrichment analyses were conducted, and a protein-protein interaction (PPI) network was generated and gene modules analysis was performed using STRING and Cytoscape.
RESULTS:
Five hub genes were screened, and the associated biological processes indicated that these genes were mainly enriched in cellular processes, protein binding and metabolic processes. Clinical survival analysis showed that COL10A1 and KIF14 may be significantly associated with the tumorigenesis or pathology grade of ATCs. In addition, relative human ATC cell lines along with blood samples and tumour tissues of ATC patients were obtained. The data proved that high expression of COL10A1 and KIF14 was associated with tumorigenesis and could be detected in blood.
CONCLUSION:
In conclusion, the identification of hub genes in the present study helped us to elucidate the molecular mechanisms of tumorigenesis and identify potential diagnostic indicators and targeted treatment for ATCs.
Keywords
Introduction
Alimentary tract cancers (ATCs) encompass a group of gastrointestinal cancers (GICs), including oesopha-geal cancer (ESC), gastric cancer (GC) and colorectal cancer (CRC), which have high malignancy and poor prognoses worldwide. According to Cancer Statistics, 2019 [1], among three ATCs, CRC is in the top three in terms of both new cases and deaths. Additionally, data from The Global Burden of Cancer 2013 [2] show that oesophageal malignancy ranks sixth among cancer-related deaths worldwide, while GC ranks as the fifth most common cancer and the third leading cause of cancer-related deaths worldwide based on GLOBOCAN data [3].
The complexity and heterogeneity of ATCs emerge from multiple interactions of genetic, environmental, immune and host factors. Smoking, alcohol consumption and obesity are common cancer-related factors [4]. Moreover, previous studies have demonstrated that aberrant expression of genes is involved in the tumorigenesis of ATCs [5]. Several genes and pathways, specifically HER2, E-cadherin, FGFR (fibroblast growth factor receptor)/EGFR (human epidermal growth factor receptor), mTOR (mammalian target of rapamycin), PD-L1, and MMPs (matrix metalloproteinases), and a large number of noncoding RNAs have been identified as biomarkers of ESC, GC and CRC [5, 6, 7]. However, due to the ambiguous symptoms and the lack of specialized diagnostic indicators at the early stage of the disease, the mortality rate of ATCs is still rising. Thus, it is essential to understand the precise mechanisms related to the carcinogenesis, progression and recurrence of ATCs and explore effective predictive biomarkers for diagnosis and therapy.
Due to the success of the Human Genome Project (HGP), technology for high-throughput gene sequencing has been rapidly developed and has been extensively utilized to screen differentially expressed genes (DEGs) at the genome level. In the present study, we collected several of the latest microarray datasets from an online database and utilized bioinformatic analysis to identify the DEGs and biological processes and pathways related to the tumorigenesis, invasion and metastasis of ATCs. However, statistical deviation in a single microarray series obviously contributes to unreliable results. Thus, 6 mRNA microarray datasets (2 each for ESC, GC and CRC) from GEO were obtained to screen DEGs between tumour tissues and paracancerous tissues. Subsequently, Kyoto Encyclopedia of Genes and Genomes (KEGG) pathway and Gene Ontology (GO) enrichment analyses were performed. Protein-protein interaction (PPI) network analyses were performed to explore further mechanisms. By determining the correlations between patient characteristics, prognosis, and pathological grade and the expression of key genes with Gene Expression Profiling Interactive Analysis (GEPIA), University of California Santa Cruz (UCSC) Genome Browser and cBioPortal, we identified 2 hub genes as specialized biomarkers for ATCs.
Materials and methods
Microarray acquirement
Microarray datasets of ESC (GSE75241 [8]) and GSE100942 [9]), GC (GSE118916 [10] and GSE26 942 [11]) and CRC (GSE113513 and GSE128449) were downloaded from GEO (
Basic information of microarray datasets of ATCs
Basic information of microarray datasets of ATCs
The DEGs between tumour and normal tissues were identified using GEO2R (
KEGG and GO enrichment analyses
DAVID (Database for Annotation, Visualization and Integrated Discovery;
PPI network construction
The PPI network was constructed using STRING (
Module analysis
Cytoscape (version 3.6.0) is an open-sourcing platform of bioinformatics software that provides visual interactive molecular networks [17]. Molecular Complex Detection (MCODE, version 1.5.1), a plugin of Cytoscape, is a specialized tool for clustering primary networks based on topology to find close linked regions and module genes [18]. The related networks were plotted by Cytoscape based on the STRING database, and the most significant module genes were identified by MCODE (screening principles: MCODE score
Identification and analysis of hub genes
The hub genes were extracted from the networks plotted by the MCODE plugin of Cytoscape (degree
Venn diagram, PPI network and the most significant module of DEGs. (A) DEGs are selected with a fold change 
Human ATC cell lines (oesophageal cancer: EC109; gastric cancer: SGC7901; and colorectal cancer: SW480) were purchased from the Cell Resource Center of Shanghai Institute of Biochemistry and Cell Biology (Shanghai, China). Cells were cultured in RPMI-1640 supplemented with 10% foetal bovine serum (both from Gibco; Thermo Fisher Scientific, Inc., Waltham, MA, USA). Thirty patients diagnosed with early-stage ATCs (10 each for ESC, GC and CRC) were selected for this study and underwent operations in the affiliated Changzhou No. 2 People’s Hospital of Nanjing Medical University and Haimen People’s Hospital from March 2018 to May 2019. Blood samples were obtained from patients on the first day to avoid the interference of drug treatment. Plasma of all blood samples was extracted within 20 minutes and stored at
RT-qPCR measurement
Cell lines, blood and tissues were preprocessed to extract total RNA. cDNA was synthesized using a Prime Script RT reagent kit (TaKaRa, Dalian, China). Quantitative PCR was carried out with a 7500 real-time PCR system (ABI, Waltham, MA, USA). PCR primers were synthesized by and purchased from Sangon Biotech (Shanghai, China). COL10A: forward: TTCTGGGATGCCGCTTGTC, reverse: TCGTAGGCGTGCCGTTCTT; KIF14: forward: TTCAGAACACCTCTGCAGGA, reverse: ACTCATGAAGACTACCTGGG. Actin served as an internal control, and fold changes were calculated with the 2
Interaction network and biological process analysis of the hub genes. (A) The biological process analysis of hub genes is constructed using BiNGO. The nodes in yellow refer to the main biological processes. (B) Hub genes and their co-expression genes are formed using cBioPortal. Nodes with bold black outline represent hub genes. Nodes with thin black outline represent the co-expression genes. 5 hub genes are sorted out and listed. The colour depth of nodes refers to the corrected P-value of ontologies. The size of nodes refers to the numbers of genes that are involved in the ontologies. (C) (D) 5 hub genes are enriched using KEEG and GO function analysis. Numbers of each enriched terms are displayed with length of bars. 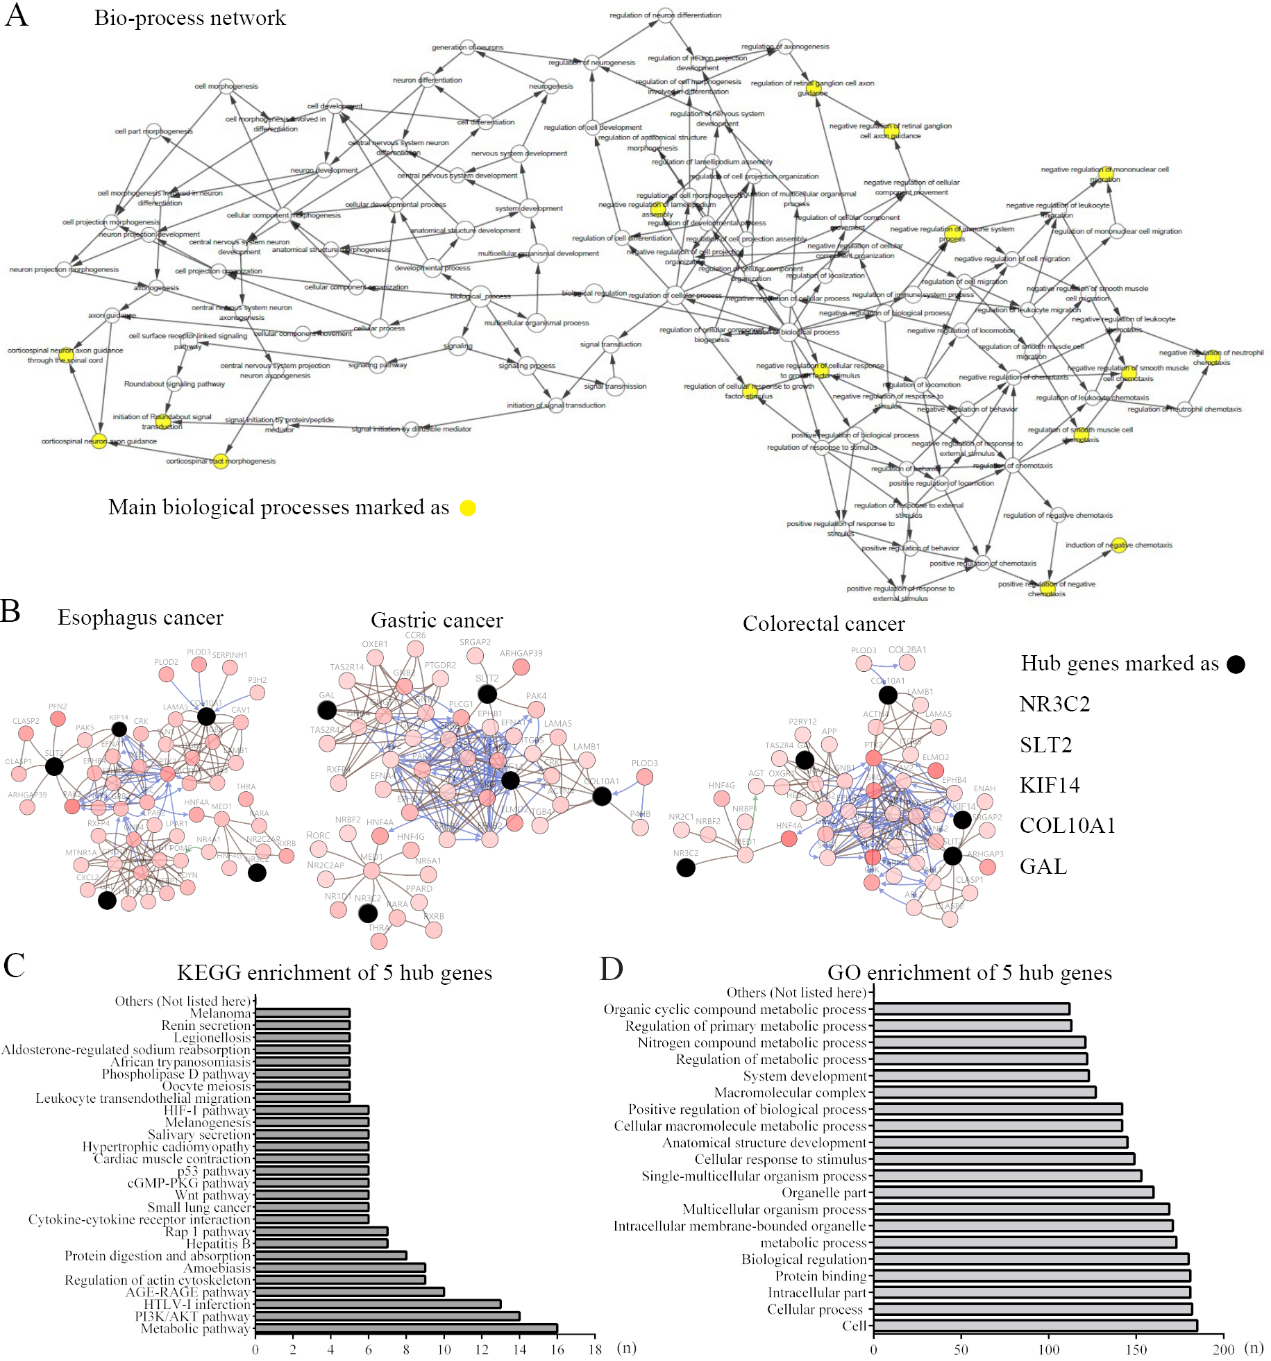
Expression of hub genes in TCGA and meta-analysis. (A) (B) (C) Expression of hub genes are obtained from The Cancer Genome Atlas (TCGA) and shown in boxplots. Overall gene expressions of COL10A1 and KIF14 in human body are displayed in body maps (D) (F) and charts (E) (G). (H) (J) Overall COL10A1 and KIF14 gene expression from projects are shown in boxplots. (I)(K) Meta-analysis with projects of COL10A1 and KIF14 gene expression are made. High-expression in tumour tissues compared with normal tissues are displayed in boxes in red. On the contrary, boxes are marked in blue. 
Association of prognostic and pathological grades with two genes and experimental verification. Overall survival and disease-free survival analyses of COL10A1 (A) and KIF14 (B) are performed using cBioPortal online platform. (C) (D) Association between the expression of COL10A1 and KIF14 and tumor grade is displayed. mRNA levels of COL10A1 (E) and KIF14 (F) in cell lines, blood samples and tumor tissues are detected and demonstrated in scatter diagrams. P<0.05 is considered statistically significant. 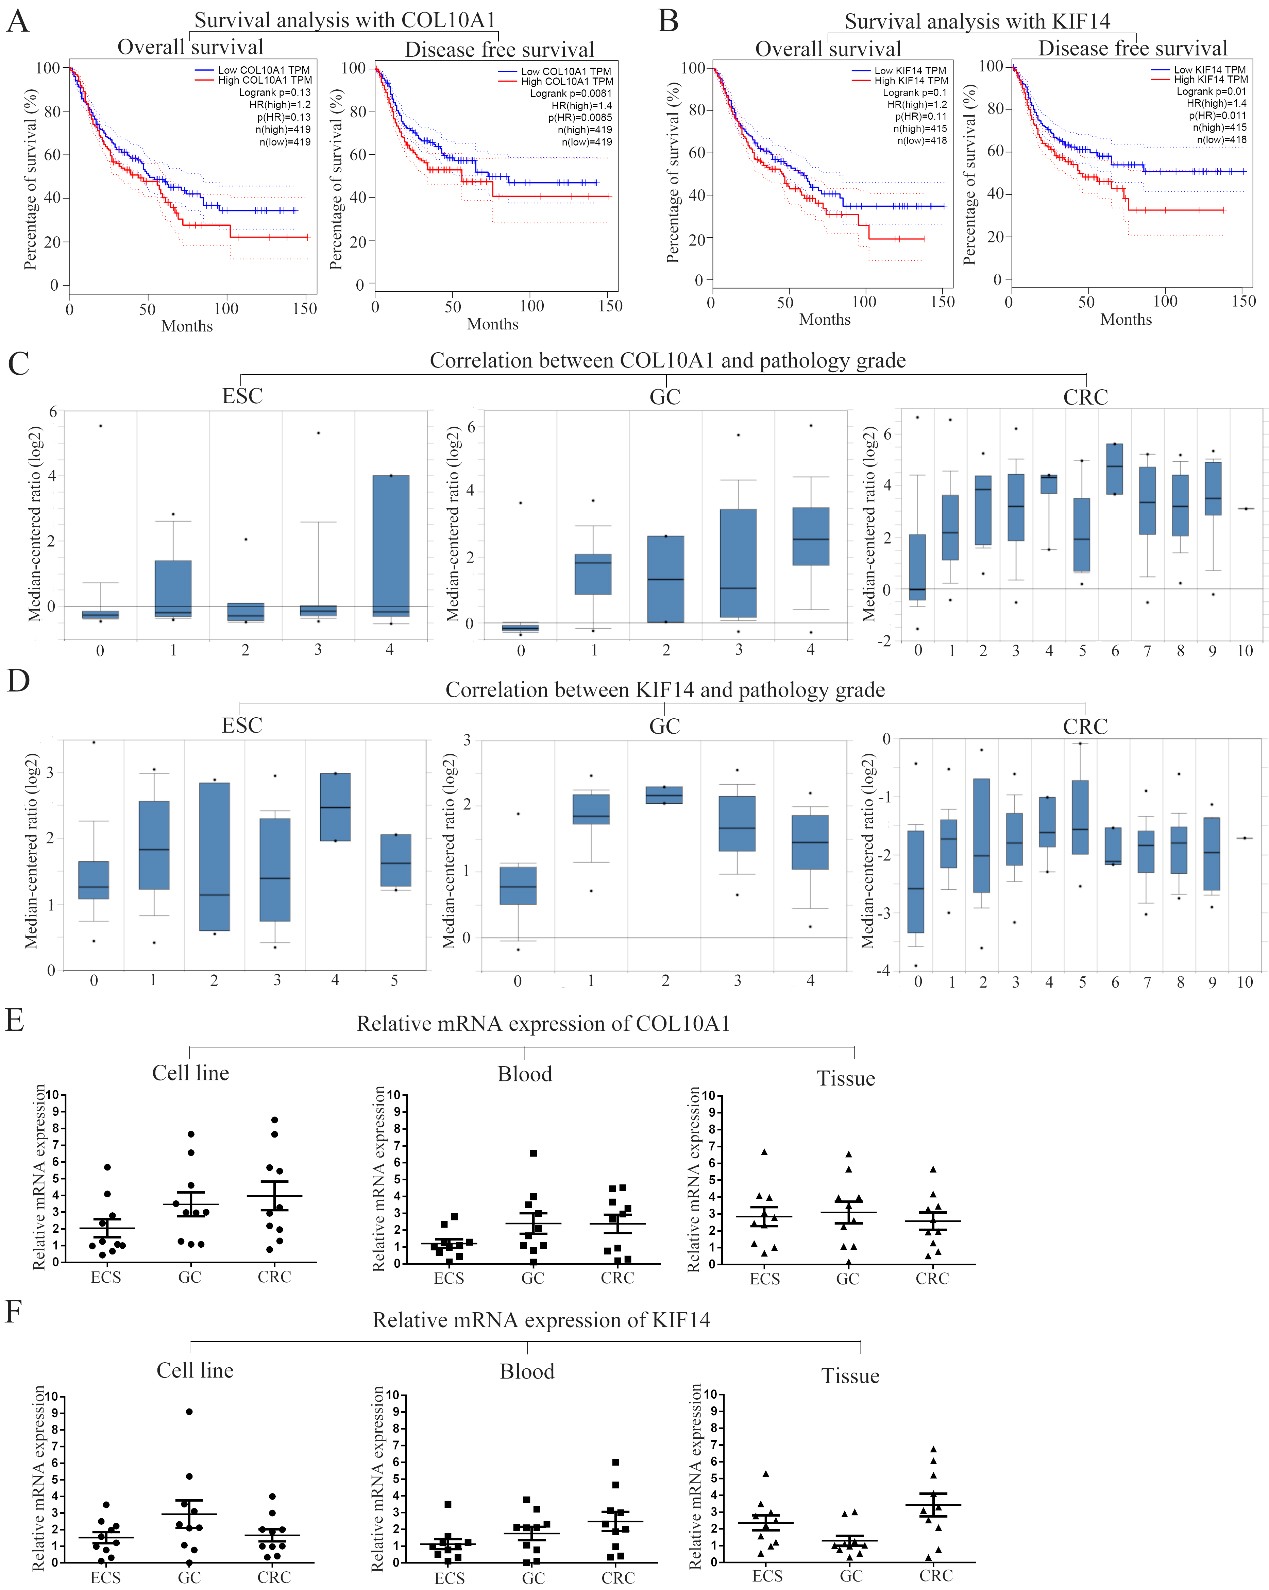
Full names and functional roles of 5 hub genes with degree
In the present study, statistical analyses were conducted using one-way analysis of variance. Data are expressed and displayed as the mean
Results
Identification of DEGs in ATCs
After standardization and processing, DEGs (2,391 in ESC datasets, 2,070 in GC datasets and 3,875 in CRC datasets) were selected from microarrays. There were 207 overlapping genes among the 3 cancers, as shown in the Venn diagram (Fig. 1A).
PPI network and module analyses
To illustrate the mutual effects of overlapping genes, a PPI network of DEGs was constructed (Fig. 1B). Cytoscape was used to plot the PPI network, and the most essential module was obtained from the MCODE plugin with 5 nodes and 272 edges (Fig. 1C). The biological process interaction analyses of the hub genes were performed using the cBioPortal online database, and the results are shown in Fig. 2A. Then, networks of the hub genes and coexpressed genes were analysed, and the results are shown in Fig. 2B. In addition, 5 hub genes (NR3C2, SLT2, KIF14, COL10A1, and GAL) were identified. The functional and pathway enrichment analyses of hub genes was performed with DAVID to analyse biological classification. The compiled analysis of overlapping genes is shown. The KEGG analysis results showed that metabolic pathways and the PI3K-Akt pathway were significantly enriched (Fig. 2C). Moreover, GO analysis results showed that the DEGs were significantly enriched in cellular processes related to protein binding, metabolic processes and others (Fig. 2D).
Hub gene analysis and biological enrichment analyses of DEGs
A total of 5 genes were selected as hub genes with MCODE (degrees
Conclusion
The digestive tract (DT) consists of the oesophagus, stomach and colon and is unique in its direct contact with food. DT is one of most essential organs in the digestive system and is associated with diverse diseases. ATCs, including oesophageal cancer, gastric cancer, and colorectal cancer, are a series of malignant diseases with high incidence and morbidity rates. Among ATCs, oesophageal cancer ranks eighth in prevalence worldwide, and colorectal cancer ranks as the third most prevalent cancer worldwide. In addition, the incidence of gastric cancer is much higher in Asia than in other regions. The prognosis of ATCs is favourable only in the very early stages. Squamous cell carcinoma antigen (SCC Ag), carcinoembryonic antigen (CEA), cancer antigen 199 (CA199), cancer antigen 72-4 (CA72-4), and cancer antigen 50 (CA50) are generally used to predict ATCs in clinical practice [22, 23, 24]. Meanwhile, endoscopic examination is the gold standard for identifying tumours. Due to their low specificity and precision, they are not reliable indictors for early diagnosis. Generally, ATCs in early stages are operable by surgery, while patients in the middle stages are recommended to receive surgical intervention by neoadjuvant chemotherapy. For more advanced stages, chemotherapy or chemoradiotherapy is selected. In terms of chemotherapy, 5-FU, platinum and paclitaxel are usually used for broad ATC treatment [25]. However, the high incidences of side effects and chemoresistance greatly reduce their value. Although molecular targeted drugs have been approved to treat patients with ATCs in advanced stages in recent decades, more effective diagnostic indictors and therapeutic targets are needed. Prominent advances in microarray technology and bioinformatic analysis have conferred further advantages.
In the present study, 6 microarray datasets were downloaded to identify DEGs between cancer tissues and noncancerous tissues of ATCs, among which a total of 207 DEGs were identified. To explore the interactions of DEGs, GO and KEGG enrichment analyses were performed. The DEGs were mainly enriched in cellular processes, protein binding, and metabolic processes, and metabolic pathways and the PI3K-Akt pathway were significantly enriched. Previous studies have reported that dysregulation of the cell cycle and DNA damage plays an essential role in the carcinogenesis and progression of ATCs [26, 27, 28, 29, 30]. In addition, recent studies have proposed a tumour-promoting role for autophagy activation [31]. Moreover, diabetic inflammatory activity often plays a major role and is frequently altered in tumours [32, 33]. In sum, all these theories are consistent with our results (Supplementary Fig. 1).
Next, we selected 5 DEGs (COL10A1, KIF14, NR3C2, GAL, and SLIT2) as hub genes with degrees
Thirty patients diagnosed with early-stage ATCs (10 each for ESC, GC and CRC) were selected for our prospective study, and blood samples and tumour tissues were obtained from these patients at the affiliated Changzhou No. 2. People’s Hospital of Nanjing Medical University and Haimen People’s Hospital. The mRNA levels of COL10A1 and KIF14 were measured with PCR. The data showed that high expression of both genes was found in cell lines and tumour tissues among ATCs, which proved the relationship between gene expression and tumorigenesis. However, although in blood samples, the expression of COL10A1 and KIF14 was upregulated in GC and CRC samples, it was not significantly changed in ESC samples. Regardless, overall, high expression of COL10A1 and KIF14 can be prospectively considered a potential indicator of early-stage ATC, especially GC and CRC.
In conclusion, the present study identified significant DEGs that may be involved in the carcinogenesis or progression of ATCs, among which 2 hub genes (COL10A1 and KIF14) may be regarded as diagnostic and prognostic biomarkers for ATCs. However, more evidence is needed to elaborate the translational function of these 2 genes in ATC treatment.
Ethics approval and consent to participate
The authors declare that this study is approved by the Ethics Committee of the Affiliated Changzhou No. 2 People’s Hospital of Nanjing Medical University and Haimen People’s Hospital. In addition, the authors declare that all blood samples and tissues involved in this study are permitted by patients. However, no other clinical trials were involved in this study, we didn’t provide the committee’s reference number according to national regulations.
Availability of data and material
The datasets generated and analyzed during the curr- ent study are available in the Gene Expression Omnibus (GEO) database (
Funding
The expenditure of this whole study was funded by research grants from the Jiangsu Natural Science Foundation (grant no. BK20181155), the Nanjing Medical University (grant no. 2017NJMU043), the Changzhou Department of Health (grant no. QN201711) and the Changzhou NO. 2 People’s Hospital (grant no. 2018K003).
Footnotes
Conflict of interest
The authors declare no competing interests.
Abbreviation
Supplementary data
Prisma flow of data selection and analysis.