
Abstract
BACKGROUND:
An increasing number of studies are indicating that the stemness phenotype is a critical determinant of the Lung adenocarcinoma (LUAD) patient’s response. Thus, it is crucial to identify novel biomarkers for stemness determination.
OBJECTIVE:
Here, we aim to develop a robust LncRNAs based prognostic signature with a stemness association for the LUAD patients.
METHODS:
RNA-seq and clinical data were downloaded from the existing database. The data were analysed using Cox regression, KM-plot, GSEA, and
RESULTS:
Initially, we used the TCGA dataset to characterize the stemness phenotype in LUAD. The commonly expressed LncRNAs in TCGA and MCTP cohort were then used as input for the Cox-regression analysis. The top three LncRNAs were selected to build a prognostic model, which was the best prognosticator in multivariate analysis with stage and previously published prognosticators. The characterization of poor surviving patients using various analysis showed high stemness properties and low expression of differentiation markers. Furthermore, we validated the prognostic score in an independent MCTP cohort of patients. In the MCTP cohort, prognostic score significantly predicted survival independent of stage and previous prognosticators.
CONCLUSION:
Taken together, in this study, we have developed and validated a new prognostic score associated with the stemness phenotype.
Introduction
Lung adenocarcinoma (LUAD) is one of the most common causes of cancer-related deaths in the world [1, 2]. According to a recent study, there will be more than 228,000 cases of lung cancer in the United States alone, and a significant portion of these cases will be lung adenocarcinoma [1]. Although lung cancer accounts for more deaths than combined deaths caused by breast, colorectal, and prostate cancer together, recently, a decline in the incidence rate of lung cancer has been noticed [1, 3]. The decline could be associated with behavioural changes in smoking patterns and advances in diagnosis and treatment protocol [3]. However, most patients treated with radiation and chemotherapy generate resistance and show recurrence [4]. This observation underscores the need to identify high-risk patients with the aggressive disease for better management of lung cancer, including LUAD.
Clinical characteristics of patients in TCGA and MCTP cohort of samples
Clinical characteristics of patients in TCGA and MCTP cohort of samples
An increasing amount of evidence is suggesting that cancer cells exhibit gene expression, renewal, and proliferation properties of stem cells [5]. The stem cell phenotype of the cell is referred to as “stemness” [6]. The stemness hypothesis provides a much-needed explanation for the clinical observation of dormancy, metastasis, etc. [6, 7]. However, the origin of stemness is still under debate, and it is unclear that stemness is caused by the presence of cancer stem cells or by cancer cells co-opting the stemness program [8]. Regardless of the origin, stemness has emerged as a significant determinant of disease outcome. Recently, Malta et al. have used a machine learning method to combine the various genetic and epigenetic markers to derive the stemness index for each TCGA cancer patient, including LUAD patients [9]. The stemness index was associated with patients’ survival in many tumor types like glioma. However, in LUAD, the stemness index was not associated with survival. These observations pose an open question to identify novel prognostic biomarkers that determine the stemness and predict the survival.
LncRNAs are an interesting candidate for the development of biomarkers due to their tumor and tissue-specific expression pattern [10, 11, 12]. In this study, firstly, we have defined the stemness characteristic in LUAD patients and showed that poor prognostic groups of LUAD patients, as identified by novel LncRNA based prognostic signature show higher stemness characteristics. Further, we validated the prognostic signature in an independent set of LUAD patients.
Patients’ data download and analysis
In the current study,
Development of prognostic score
A univariate Cox-regression analysis was performed using the LncRNAs with high expression (average FPKM
Prognostic formula for patient X
Development of prognostic score for previously published signature
We also compared the prognostic strength of our prognostic score with previously published gene signatures [15, 16, 17]. To re-derive the previous prognostic signature, we performed the Cox-regression analysis with the signature genes and used the following equation to calculate the risk scores
Where
Comparison with existing subgroups
To check the enrichment in subgroups obtained using the prognostic score proposed in this study, we downloaded the reference data from Chen et al. (PMID: 27775076) [18]. In their study, the authors have used Cluster-of-Cluster analysis to divide the non-small cell lung cancer patients into 7 sub-groups with majority of the squamous cell carcinoma patient falling into SQ.1 and SQ.2 subgroups and majority of adenocarcinoma patients falling into 5 subgroups AD.1 to AD.5. We compared our subgroups with AD.1 to AD.5 as these subgroups comprised the adenocarcinoma patients.
Survival analysis
To determine the prognostic capabilities of prognostic signature, univariate and multivariate Cox-regression analysis was performed in the survival package of R with the default parameters. The survival difference in various groups was visualized using the Kaplan-Meier plot (KM) in Graph Pad 8.3 (San Diago, CA). Mantel-Cox method was used for computation of hazard ratio (HR) and
Differential expression analysis, gene set enrichment analysis, and pathway analysis
The
To verify if the gene sets are enriched in a group of patients, GSEA was performed with default parameters. To identify the enriched pathways and GO terms Metascape and ShinyGO v0.61 were used [19, 20].
LUAD stemness characteristics: A) A Venn diagram showing the commonly expressed genes in TCGA and MCTP cohort of samples. An expression cut off 0.1 FPKM is used to select the expressed LncRNAs. B) A volcano plot showing the differentially expressed LncRNAs in TCGA LUAD and normal samples. C) A volcano plot showing the differentially expressed LncRNA in MCTP LUAD and normal samples. D) The stemness index of each TCGA-LUAD patient was taken from Malta et al. and plotted to show the difference in the stemness score of LUAD patients with the top 100 and bottom 100 stemness index. E, F, G) GSEA results showing the enrichment of stem cell-associated gene sets in high stemness index LUAD patients. H) An XY plot showing the enrichment of the cell proliferation-associated gene sets in high stemness index patients. I) Bar plots showing the total number, overexpressed and underexpressed PcGs, lincRNA, and asRNA in high vs. low stemness index patients. J) Volcano plot showing the differentially expressed LncRNAs in high vs. low stemness index patients. K) Heatmap of all LncRNAs five-fold differentially expressed between high stemness and low stemness index patients. L) Bar diagram showing the enriched pathways identified using the PcGs with the highest correlation with differentially expressed LncRNAs in high vs. low stemness index patients.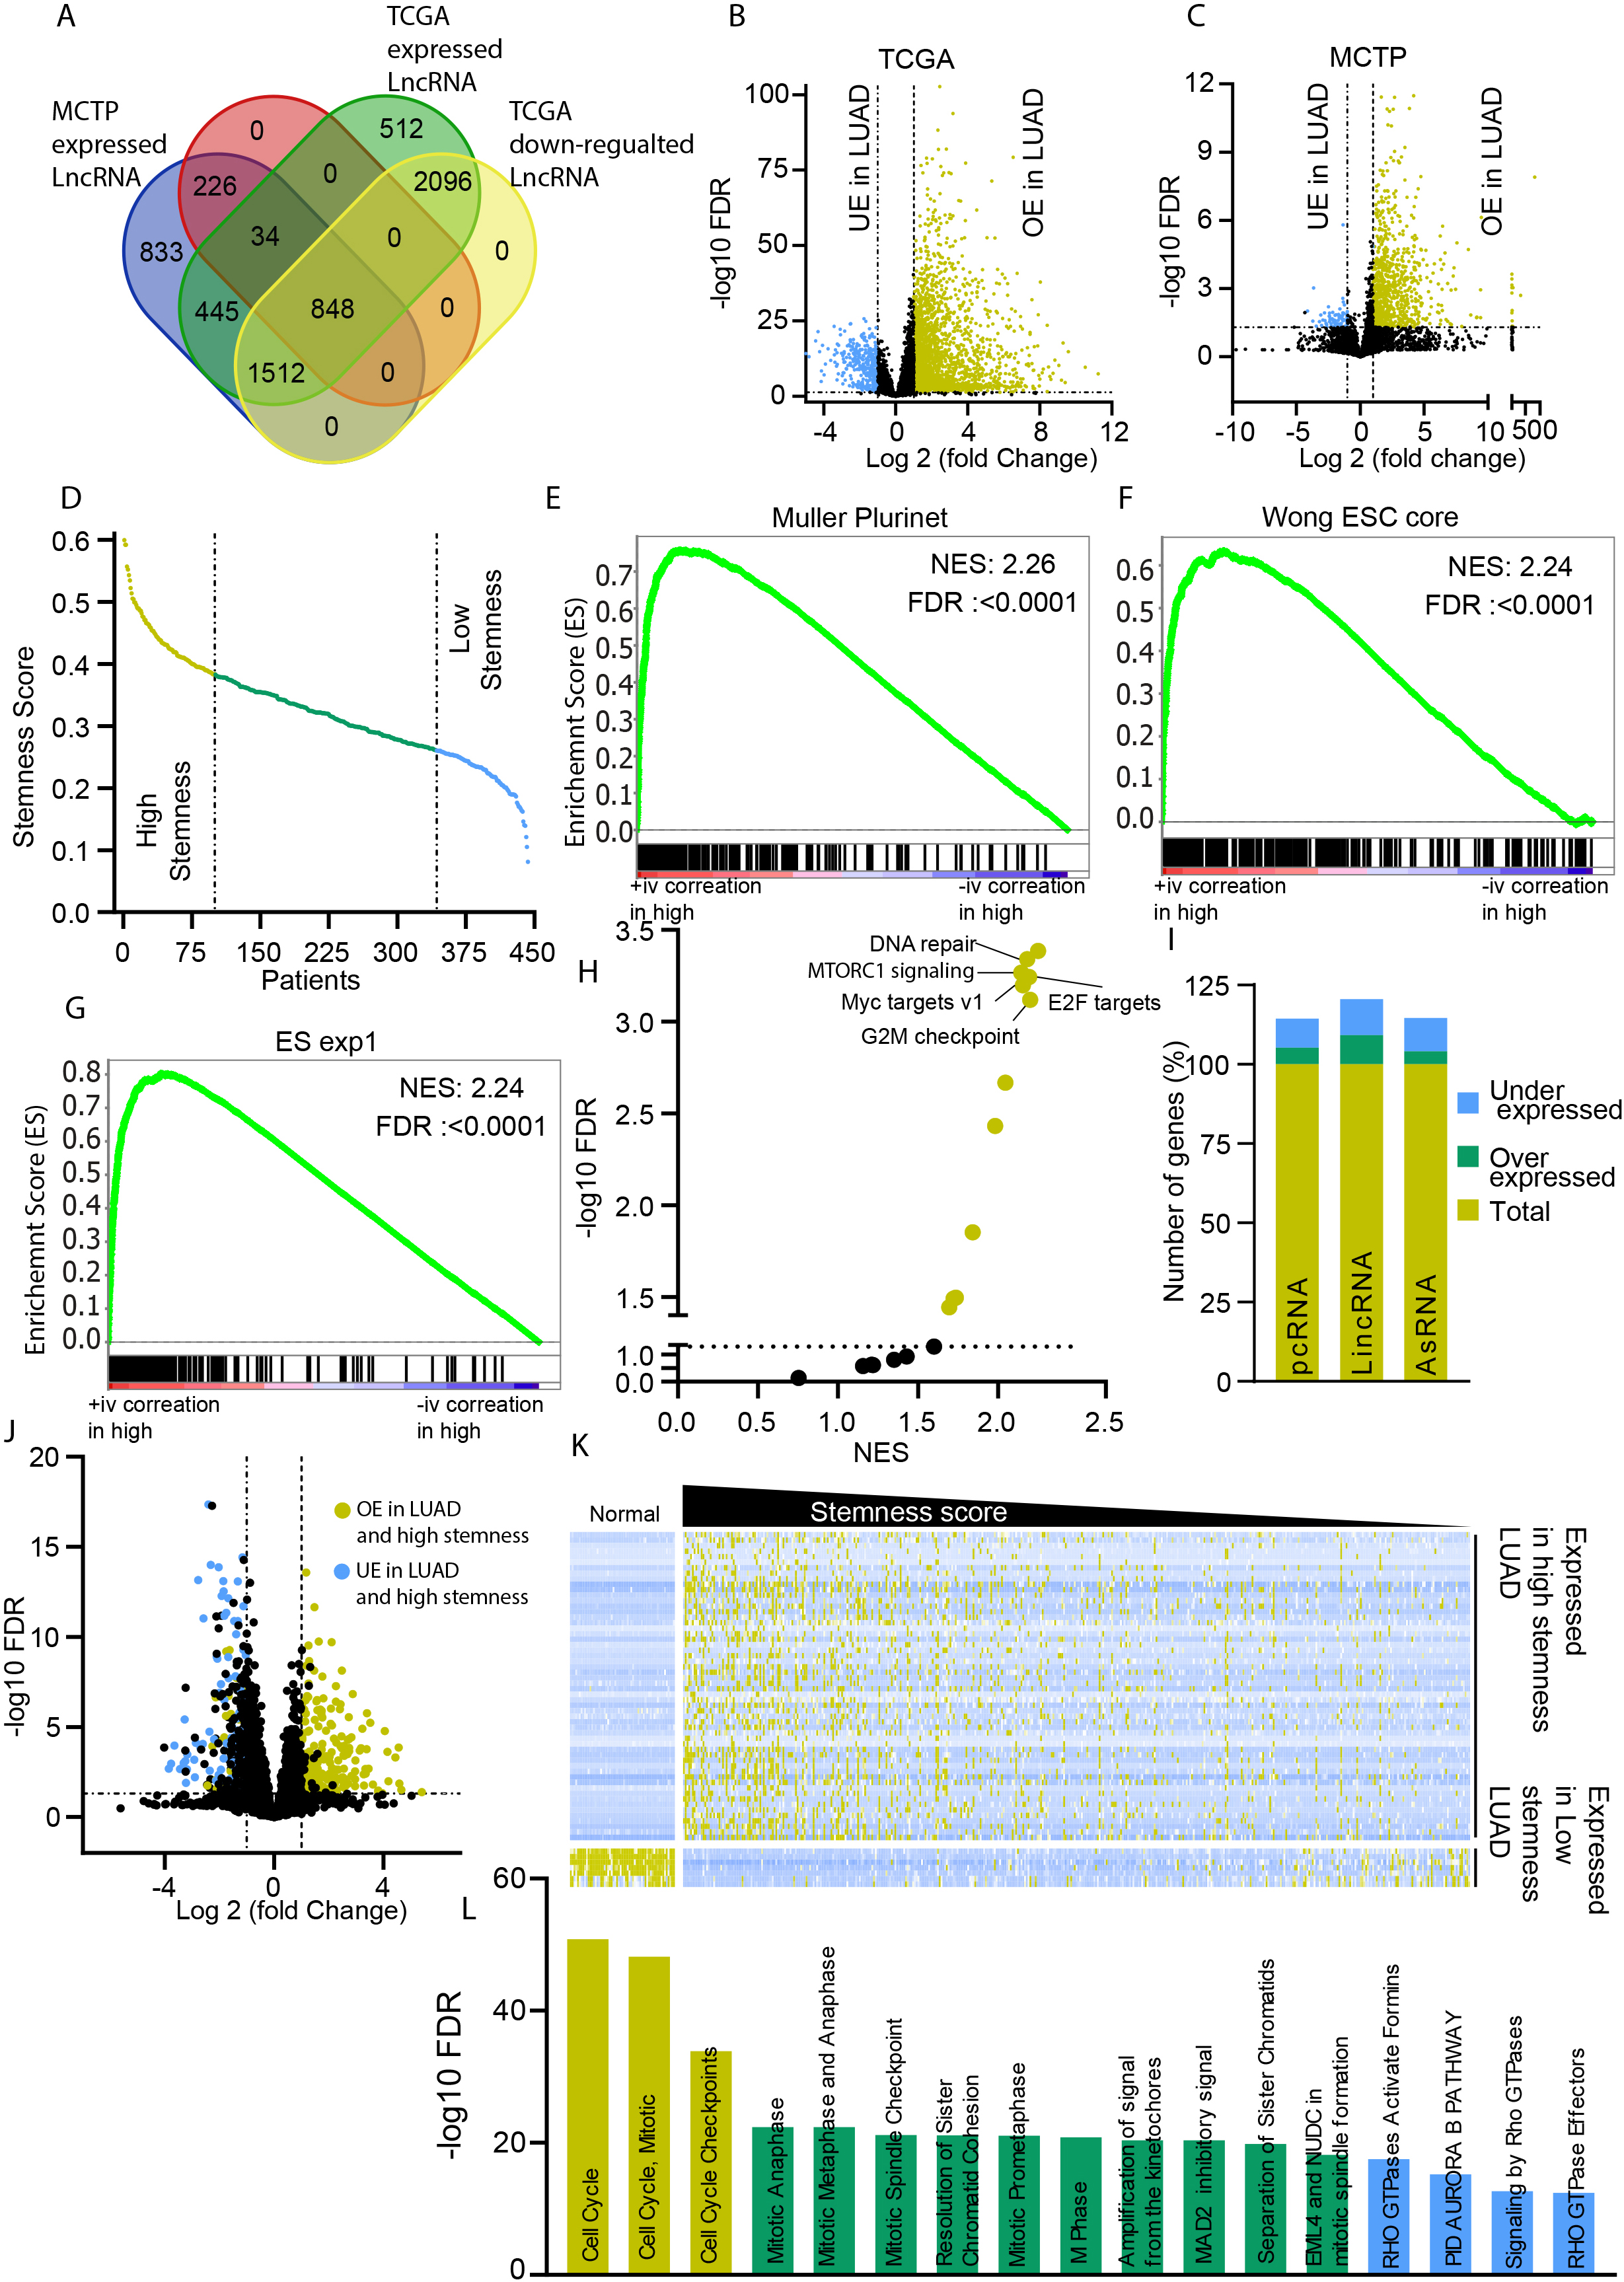
Identification of commonly expressed LncRNAs in two independent cohorts of LUAD patients
Two independent cohorts (TCGA and MCTP) of LUAD patients with clinical and RNA-seq based expression data were downloaded and analyzed, as described in the material and methods section (Table 1). The expression of LncRNAs varies depending upon the tissue types [12]. Thus, to identify the LncRNA consistently expressed in LUAD patients, we used a cut-off of 0.1 FPKM average expressions across LUAD samples in TCGA and MCTP cohorts. This analysis identified 2836 LncRNAs with consistent expression in TCGA and MCTP cohort patients (Fig. 1A, Supplementary Table 1). Further, we performed a
LUAD stemness phenotype is associated with ESC features and higher cell cycle rates
LncRNAs play an essential role in all aspects of cell biology, including stemness determination [21, 22]. To identify the LncRNAs associated with stemness, we used a newly developed stemness index. Recently, Malta et al. have used a machine learning method to combine genetic and epigenetic data to calculate the stemness scores [9]. We used the mRNA stemness index to divide the LUAD patients into high and low stemness groups (Fig. 1D). Firstly, we performed GSEA analysis to confirm the enrichment of the stemness phenotype in high stemness LUAD compared to low stemness LUAD. As expected, high stemness LUAD samples showed enrichment of stem cells associated gene sets Muller PluriNet, Wong ESC core, and ES exp1 (Fig. 1E–G). A GSEA analysis using Hallmark gene sets showed enrichment of gene sets associated with mTOR signaling, E2F target, DNA repair, G2M checkpoint, etc.(Supplementary Table 3), suggesting stemness phenotype is also associated with cell proliferation and division signaling (Fig. 1H). To further confirm that the LUAD stemness phenotypes are associated with the cell proliferation and cell division signaling, we compared the expression status of all the genes between high and low stemness LUAD samples. Interestingly, only a small fraction of the total expressed genes showed significant differential expression in high stemness LUAD compared to low stemness LUAD samples (Fig. 1I). Furthermore, among differentially expressed genes, a higher percentage of lincRNAs were differentially expressed compared to PcGs or antisense LncRNAs (Fig. 1I). Further expression analysis also identified 63 LncRNAs with at least five-fold expression differences in high and low stemness LUAD samples (Fig. 1J and K). These LncRNAs showed high expression in samples with high stemness and low expression in low stemness LUAD and healthy lung tissue, confirming the association of these highly selective 63 LncRNAs in stemness of LUAD (Fig. 1K). Further, to understand that these LncRNAs are indeed associated with similar signaling pathways as of high stemness LUAD identified in Fig. 1E–G, we computed the correlation score of all the 63 LncRNAs with PcGs using a GEPIA2 webserver. A pathways analysis using the genes which had a high correlation with 63 LncRNAs showed enrichment of the cell cycle and cell division related pathways (Fig. 1L).
These observations confirm that high stemness associated LUAD samples are enriched in stem cells associated with phenotype and cell proliferation (Fig. 1E–L).
Identification of prognostic LncRNAs with high association with stemness
In previous results, we have shown that LUAD stemness is associated with stem cell characteristics and high proliferative signaling. Next, we wanted to identify the LncRNAs with high prognostic potential and stemness association. We performed an unbiased univariate Cox-regression analysis using the LncRNAs with
Development of prognostic score: A) Volcano plot showing the hazard ratio and 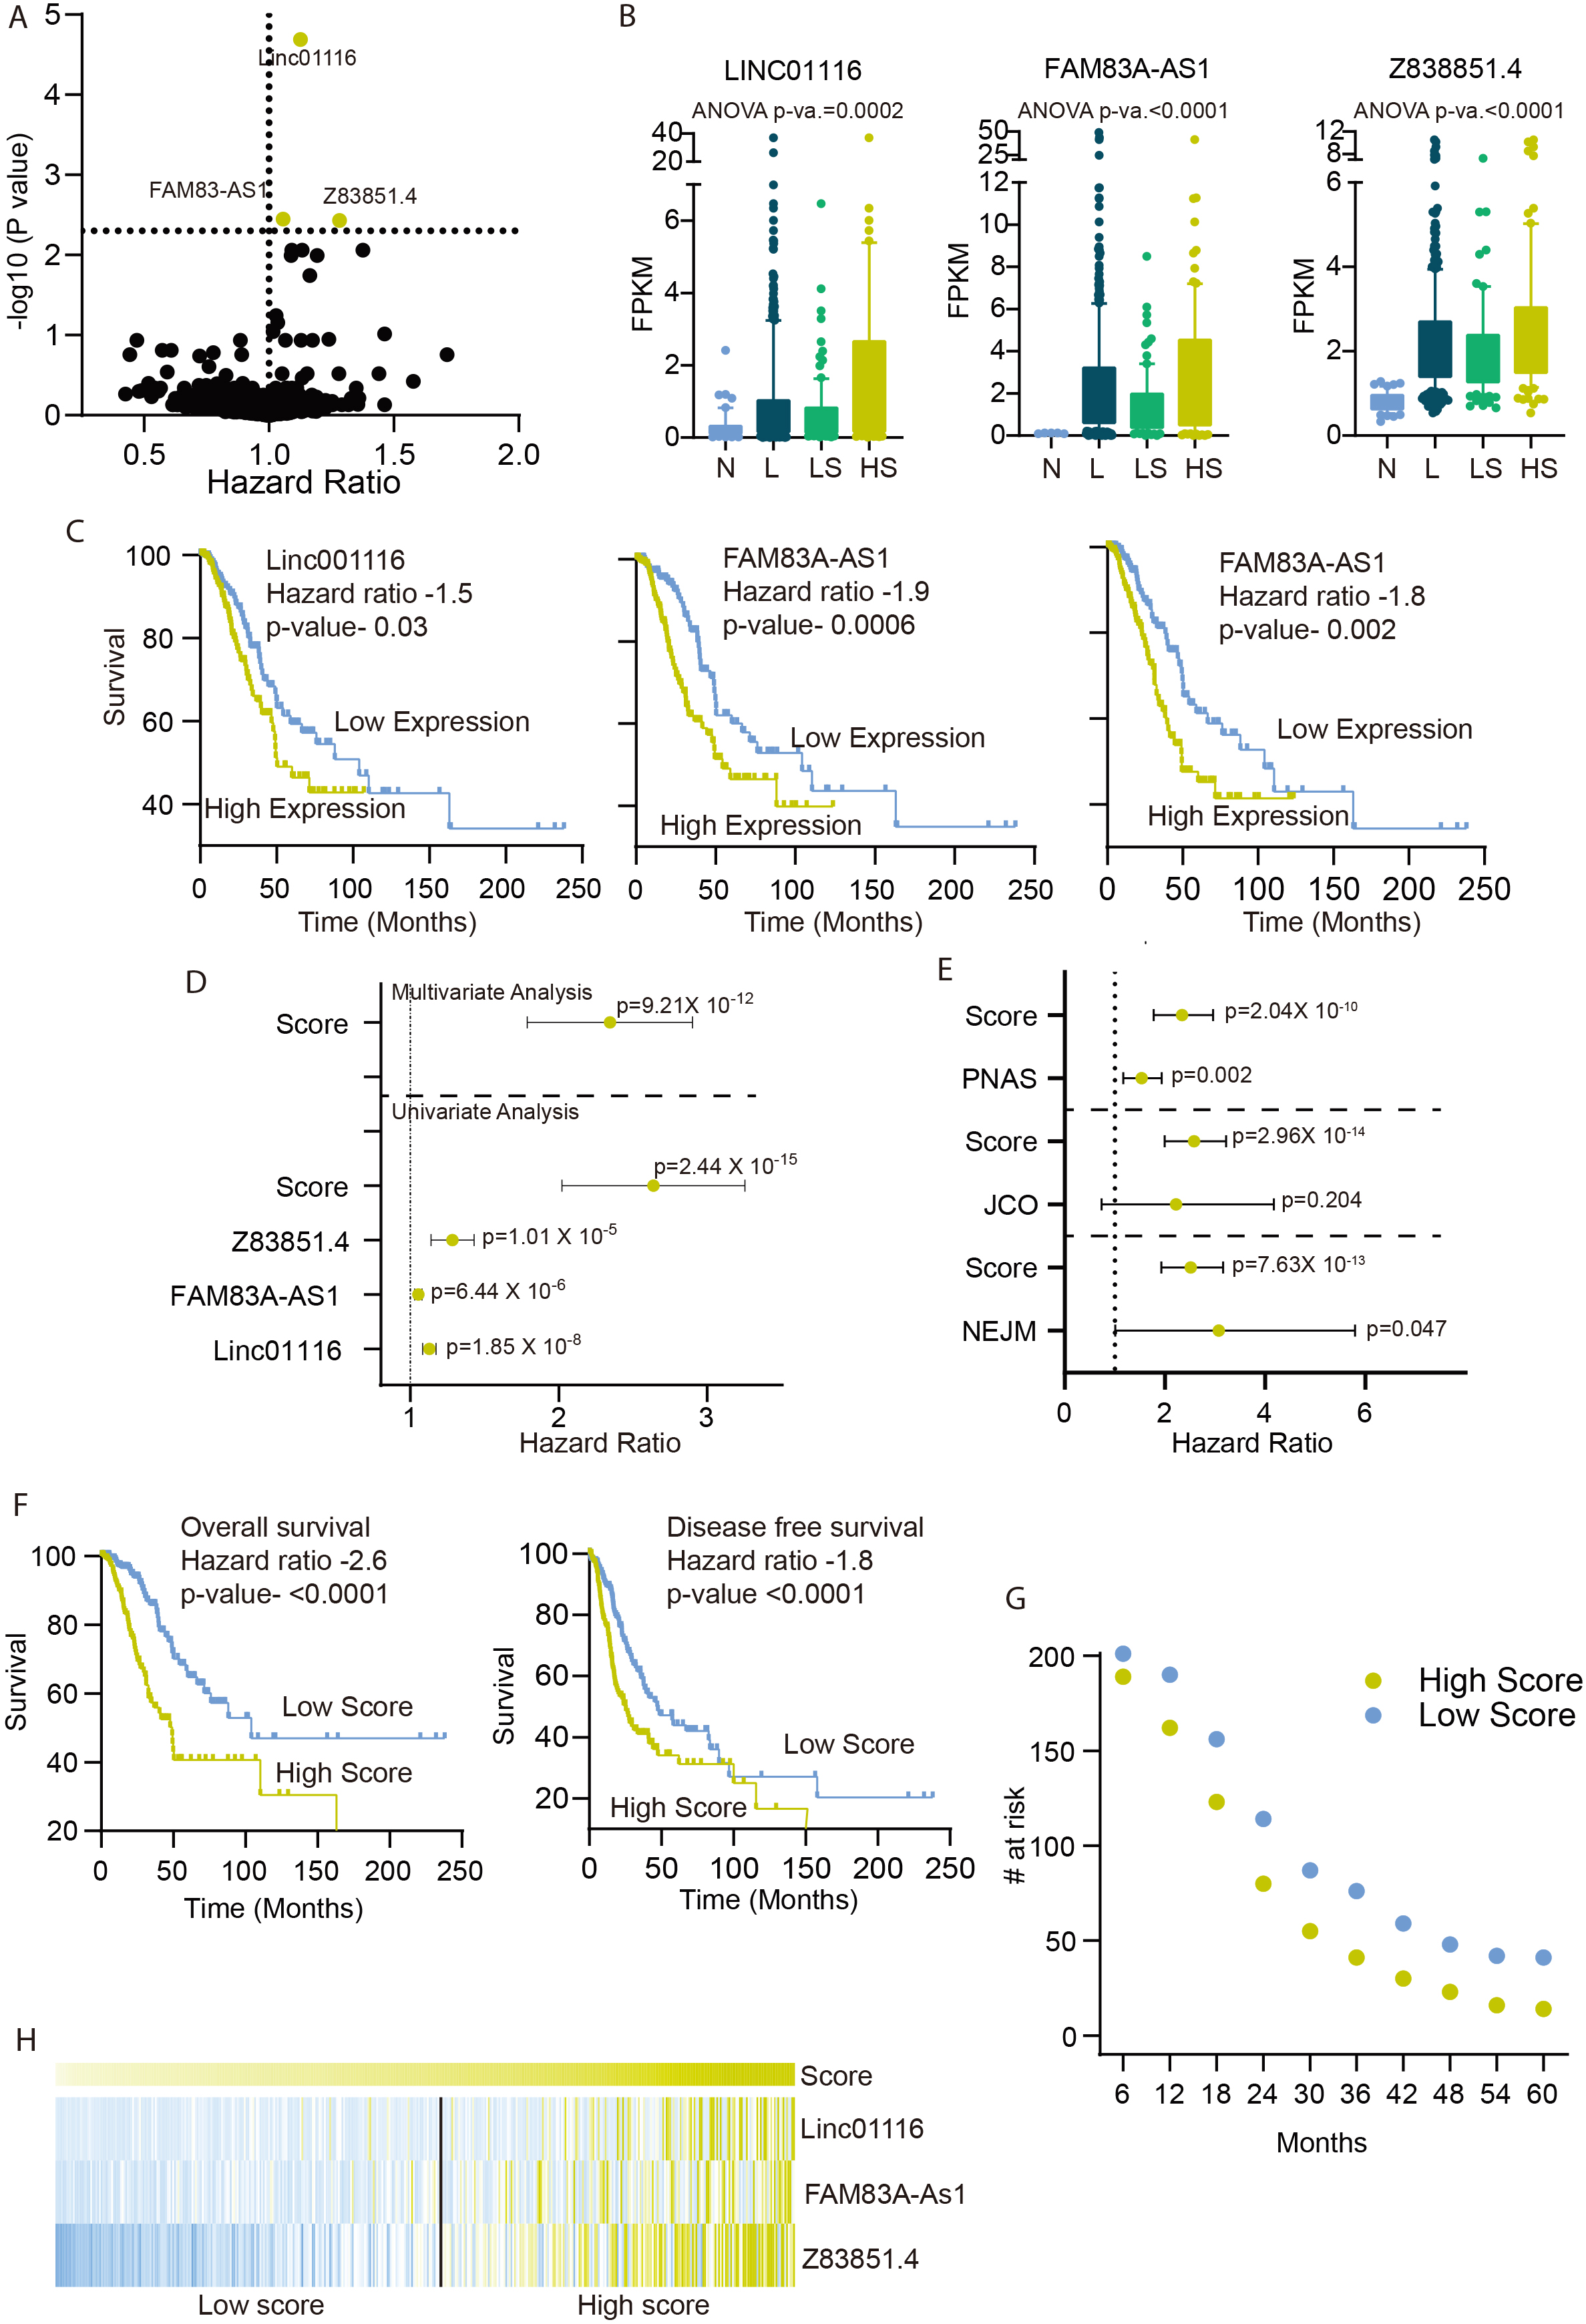
LUAD patients with high prognostic score are associated with high stemness phenotype: A) The percentage of patients in the high and low prognostic scores were calculated in given molecular subtypes as identified by Chen et al. A Fisher exact test was done to obtain the 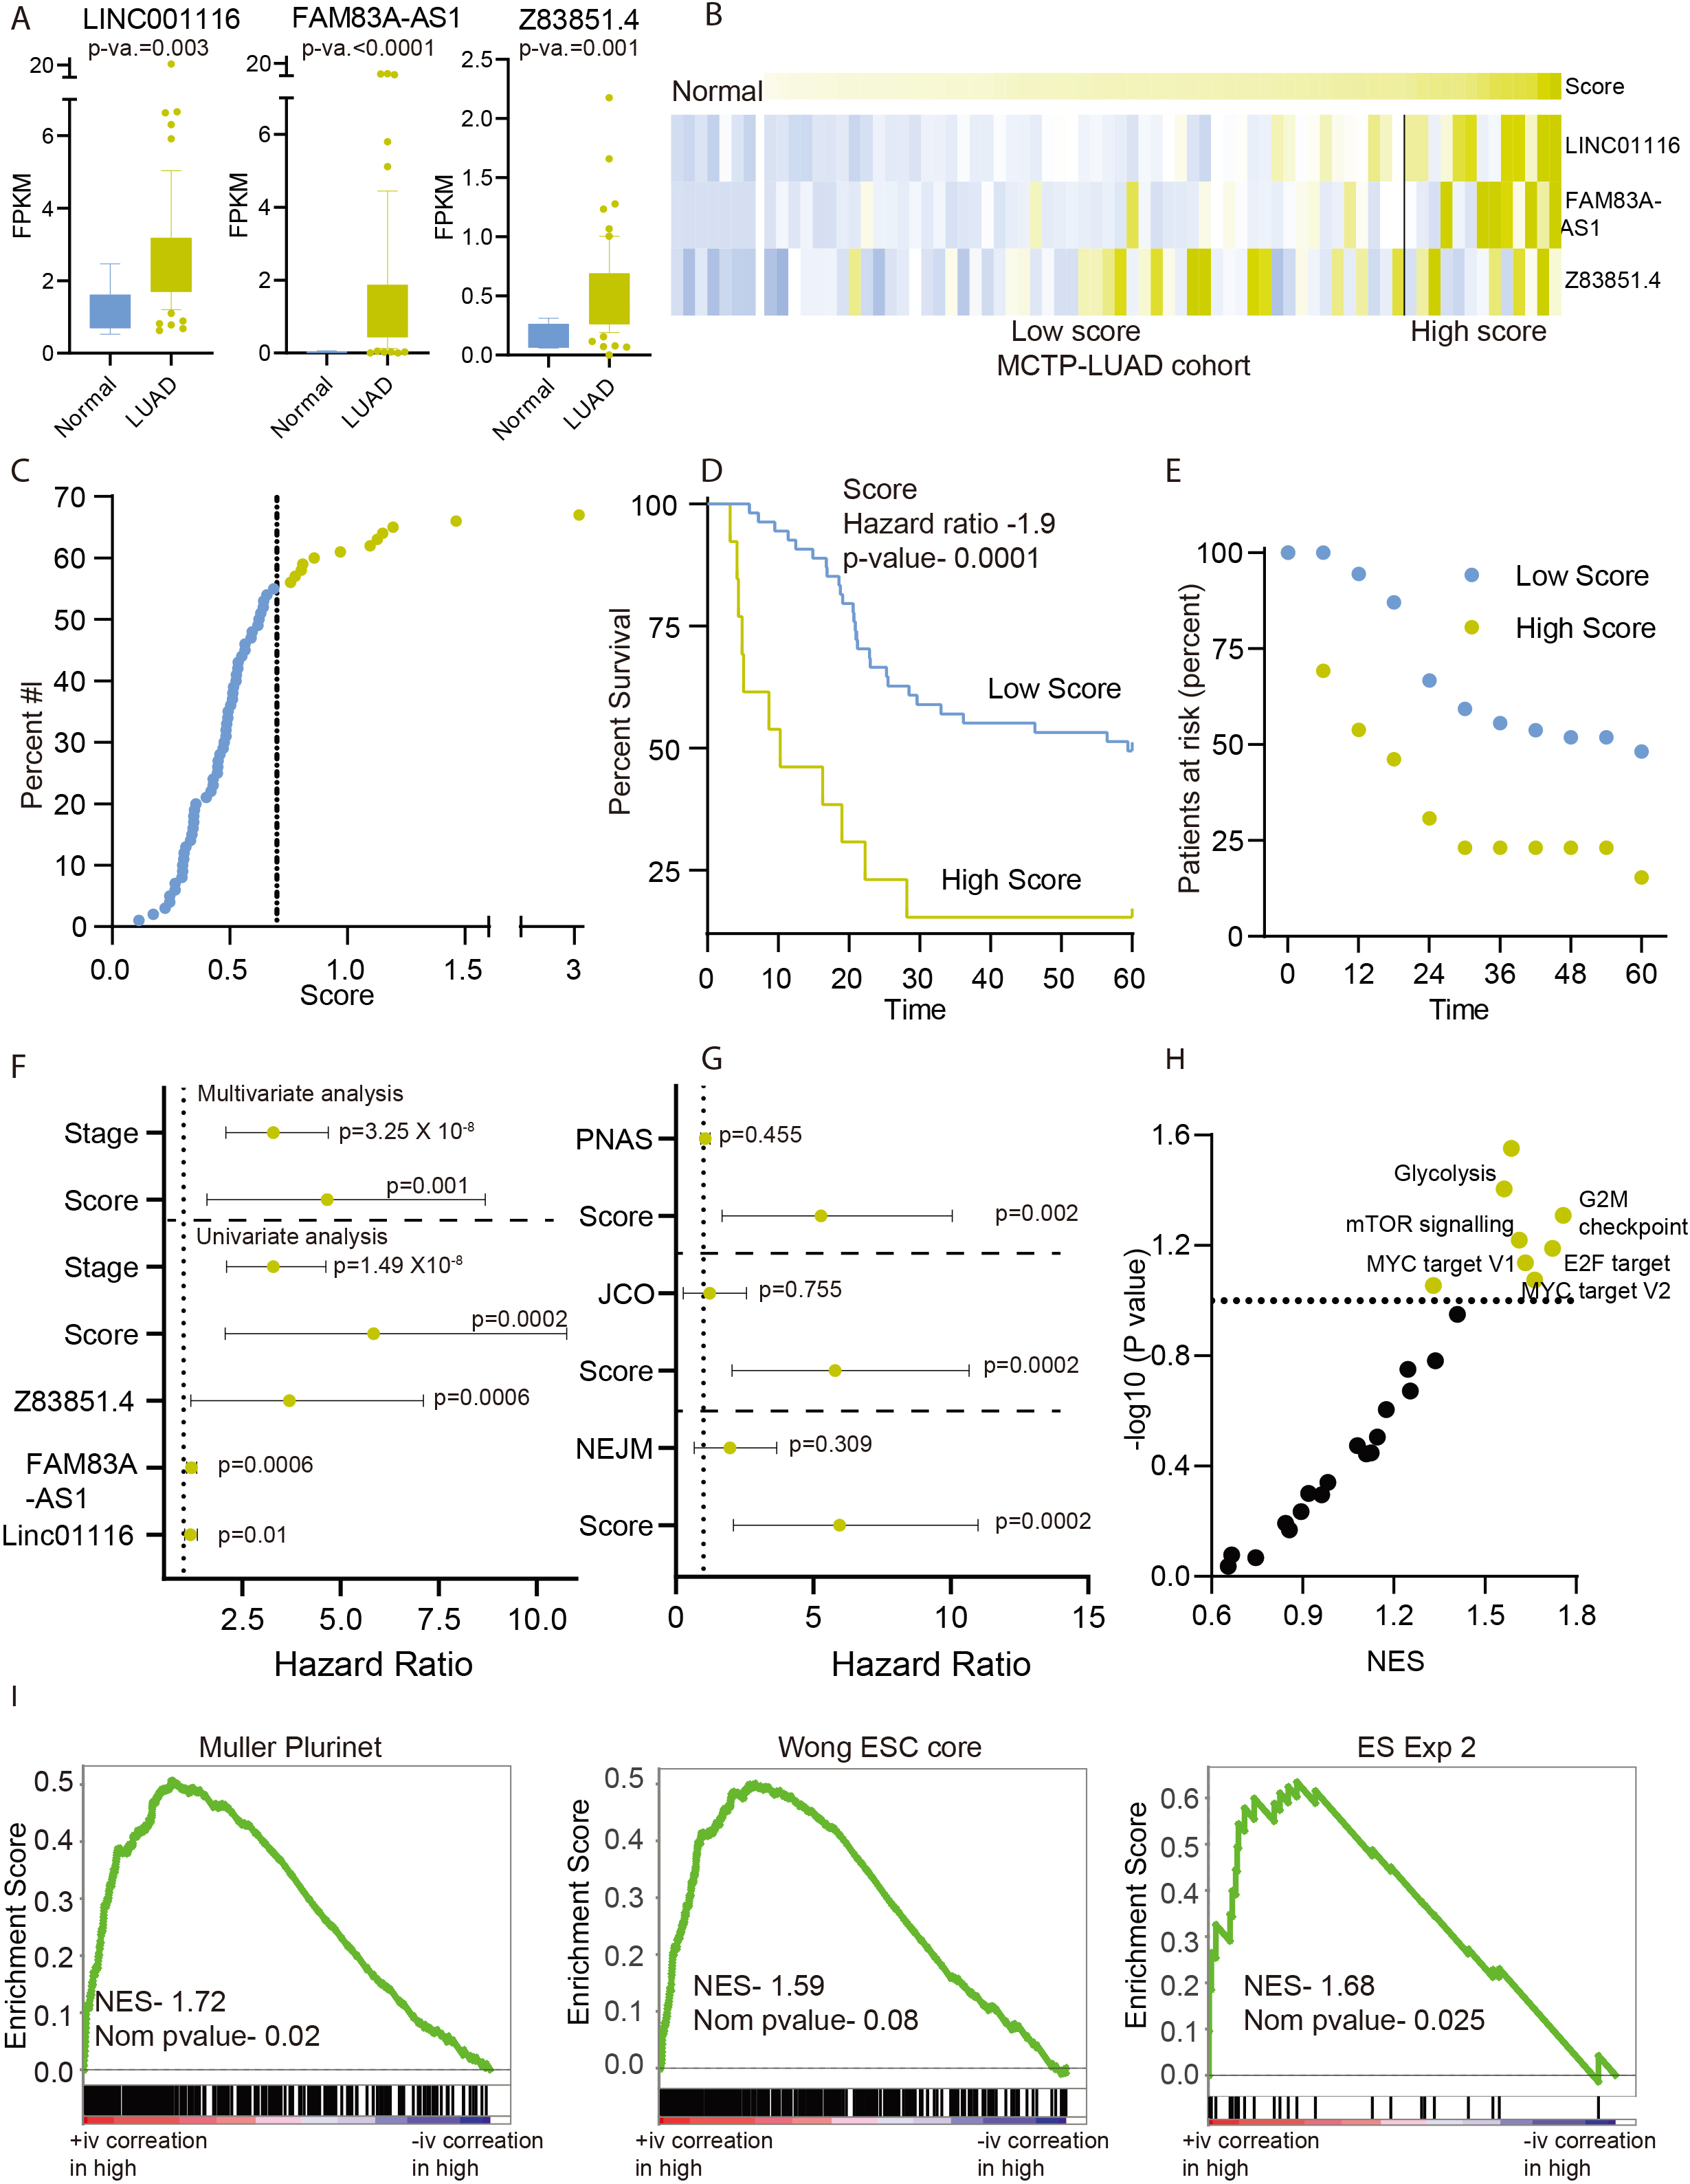
Validation of prognostic score in an independent cohort of samples: A) Expression of three prognostic score LncRNAs in LUAD and normal lung samples of the MCTP cohort. The 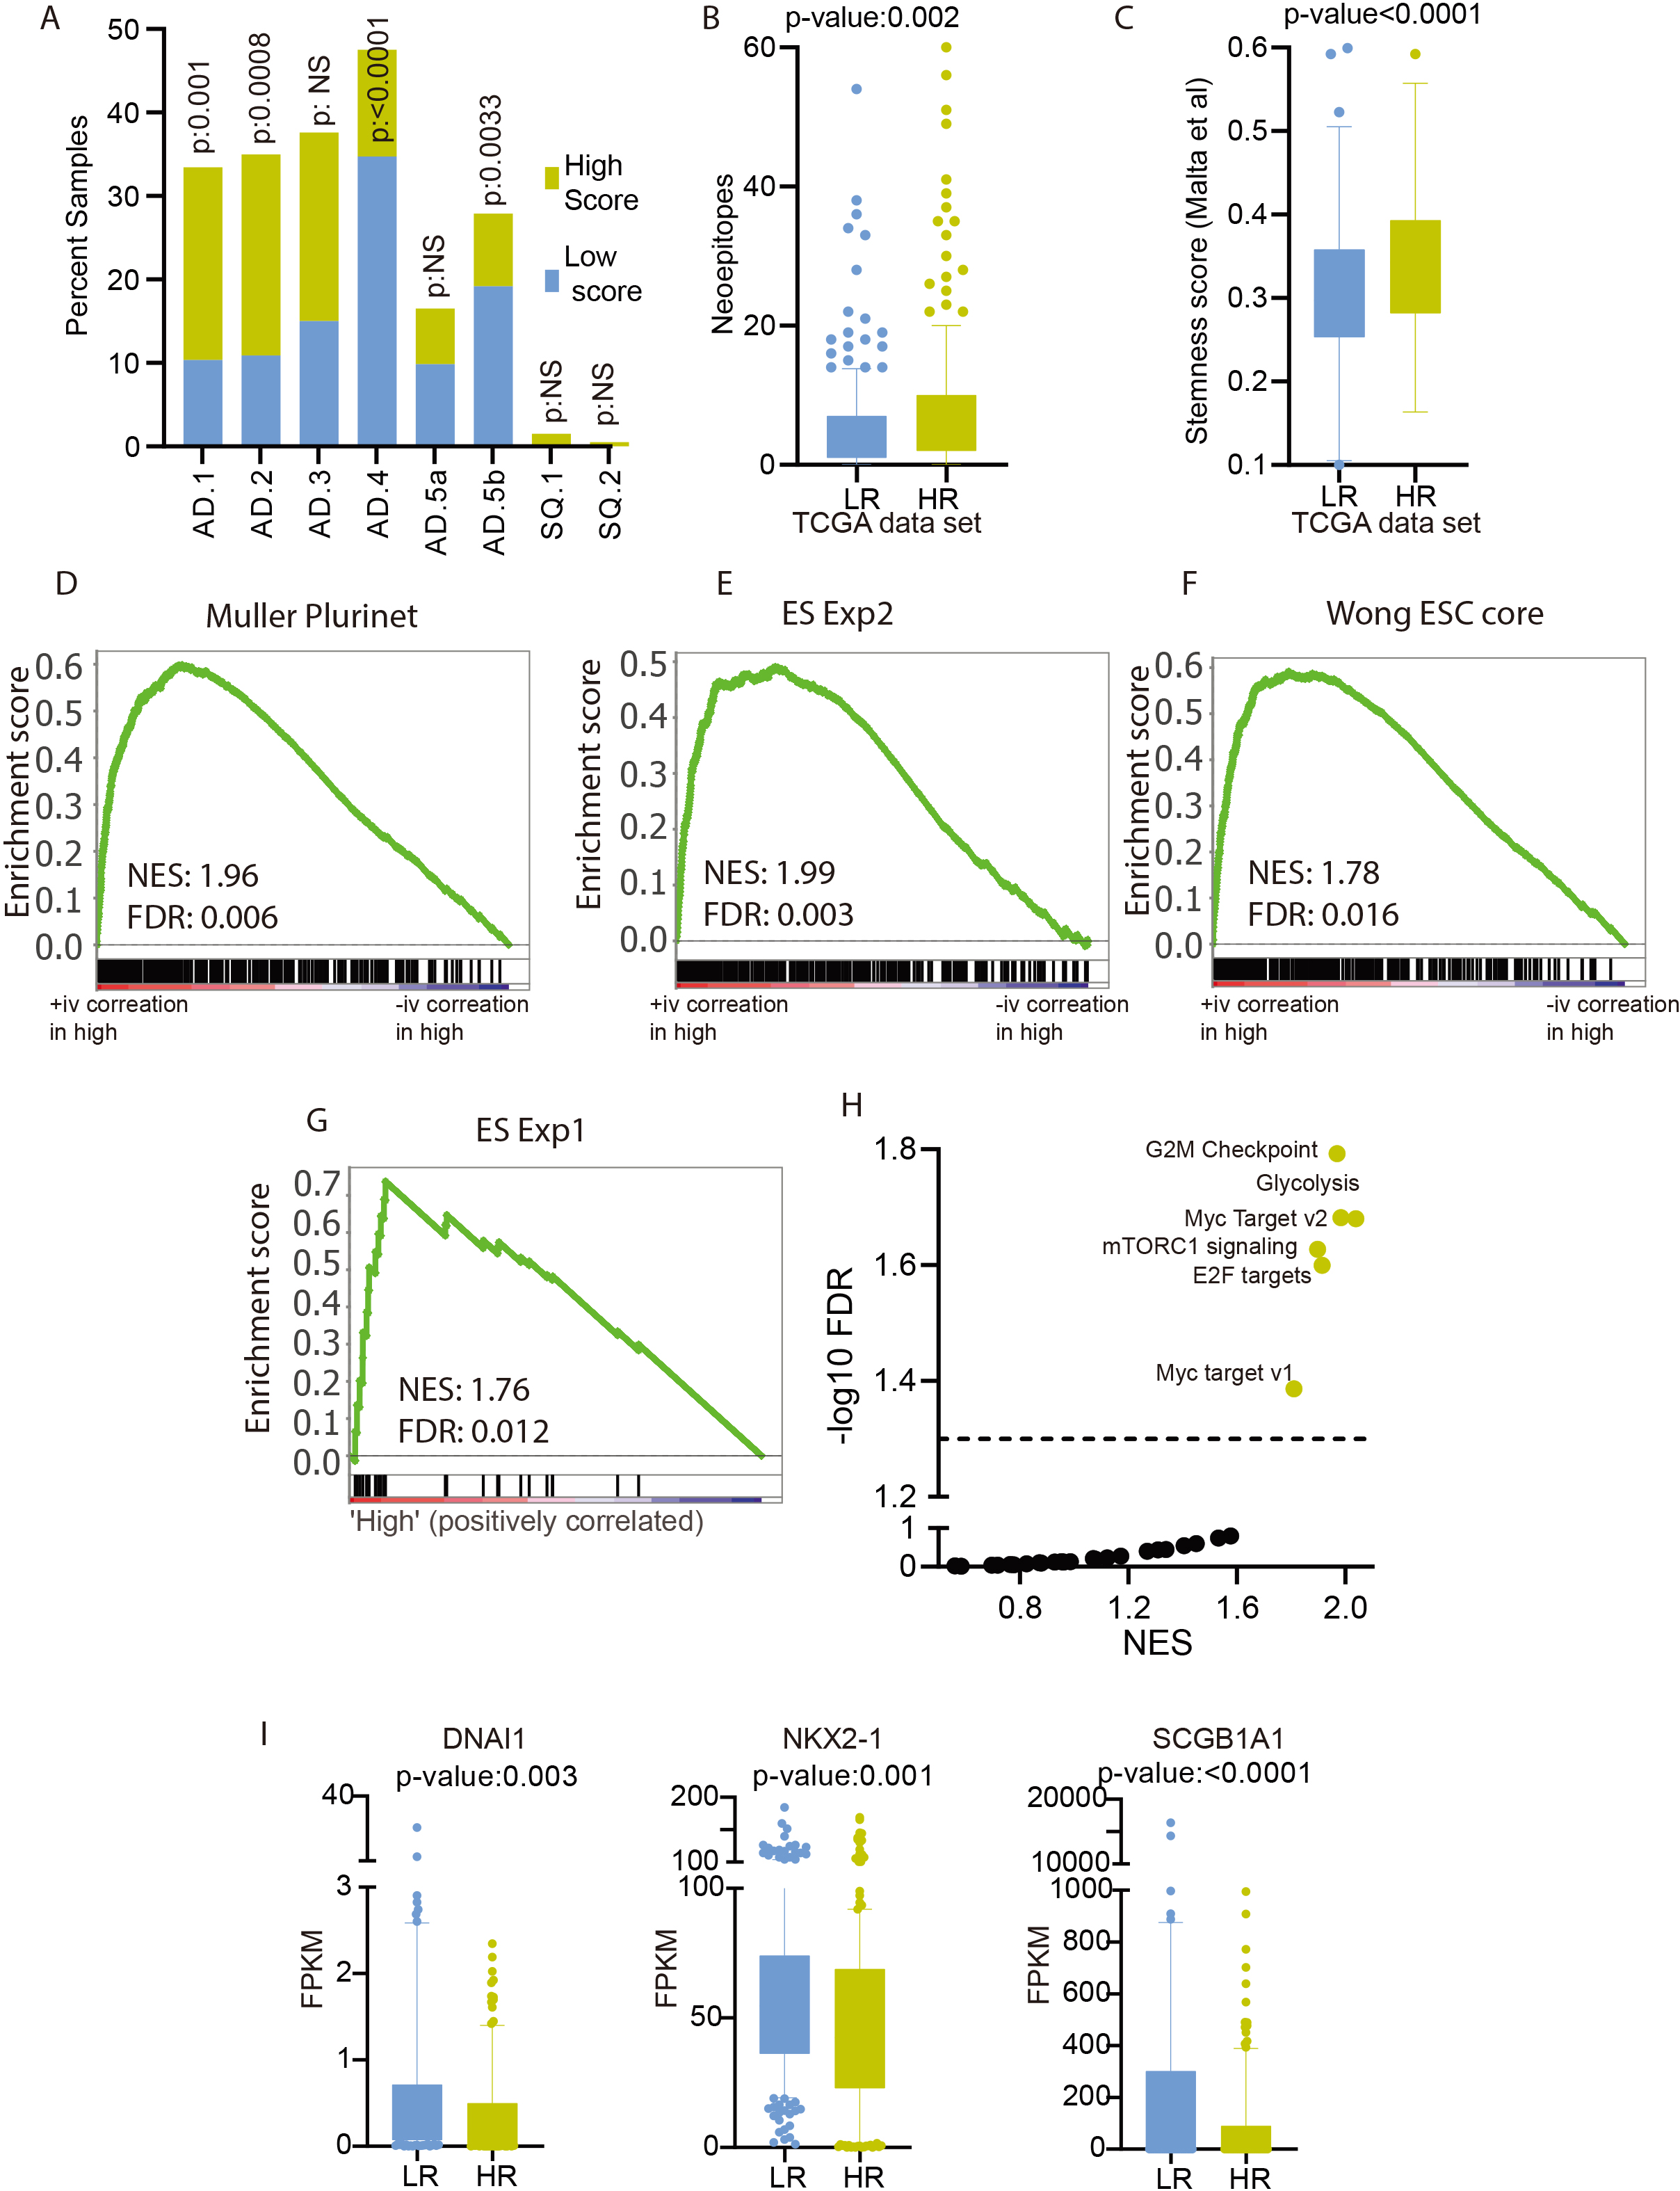
Next, we derived a prognostic score by combining the expression of all the three LncRNAs using the equation given in the method section. We performed a univariate analysis of Linc01116, FAM83A-AS1, Z83851.4, prognostic score, and LUAD stage and showed that prognostic score outperformed all the other factors (Fig. 2D and Table 2). Furthermore, we used multivariate analysis to show that the prognostic score is an independent predictor of survival (Fig. 2D and Table 2). We also compared the strength of prognostic score with other well-established signatures. As these signatures were derived using different expression platforms, we re-calculated the model for these studies using the gene list from each of the studies. The multivariate analysis with these signatures showed that our current prognostic score is an independent and better survival predictor (Fig. 2E).
Results of Cox regression analysis in training and testing cohorts
Further, we performed the KM analysis by dividing the patients into high and low risk at the median. The KM analysis showed that patients with a high score had significantly poor overall and disease-free survival (Fig. 2F, Table 1). We also calculated the survival proportion of high and low score patients at different time points, and showed that each time point low score patients survived better than the high score patients (Fig. 2G). Further, the expression of prognostic score member LncRNAs was higher in the high score patients compared to the low score patients (Fig. 2H).
In the previous experiment, we have developed a prognostic signature based on the expression of a group of three LncRNAs, which shows significantly high expression in LUAD with higher stemness index. We hypothesized that a patient belonging to the poor survival group (high prognostic score) with a higher expression of three prognostic LncRNAs should also show the higher stemness associated phenotype. Recently, Chen et al. identified eight subtypes of lung cancer using cluster-of-cluster analysis [18]. We checked the enrichment of poor and good prognostic groups of LUAD patients, as identified by the current prognostic signature, in eight molecular subtypes. Interestingly, patients with high prognostic scores were enriched in poorly differentiated AD.1 and AD.2 subtypes (Fisher exact test
In Fig. 1E–H, we had shown that LUAD patients with high stemness index were enriched with stem cell-associated gene-sets and cell proliferation signaling pathways. Thus, we performed GSEA analysis between patients with high and low prognostic scores to see the enrichment of stem cells associated pathways. Interestingly, GSEA identified significant enrichment of stem cells associated gene sets (Fig. 3D–G) and cell proliferation genes sets in high prognostic score patients’ groups (Fig. 3H). Furthermore, stemness is also known to be associated with poor differentiation. The DNAI1, NKX2-1, and SCGB1A1 are the differentiation markers for the lung cells. Hence, we checked the expression of these genes in patients with high and low prognosis groups. The expression of these genes is lower in high prognostic score patients suggesting the poor differentiation of tumors in these patients (Fig. 3I).
Validation of prognostic signature in an independent MCTP cohort of patients
We developed a prognostic score in TCGA patients and showed its predictive value using univariate and multivariate Cox-regression analysis and KM plots. However, it is crucial to validate the prognostic capability of the score in an independent cohort of patients. We performed the validation of prognostic scores in the MCTP cohort of patients. First, we showed that like the TCGA cohort, the expression of Linc01116, FAM83A-AS1, and Z83851.4 was significantly higher in LUAD compared to healthy lung tissue (Fig. 4A). Next, we calculated the prognostic score for each of the MCTP cohort patients using the same coefficient and formula used for score calculation for TCGA patients. For further analysis, we divided the MCTP cohort patients at the same prognostic score used for the TCGA cohort patients (median prognostic score of TCGA patients, 0.7) (Fig. 4B). The expression of prognostic score constituent LncRNA was higher in high prognostic score patients compared to low prognostic score patients (Fig. 4C). Next, we performed the KM analysis and showed that MCTP cohort patients with high prognostic scores survived significantly lower than patients with the low prognostic score (Fig. 4D). We also showed that the survival proportion of low prognostic score patients was higher at every time point compared to high prognostic score patients (Fig. 4E).
Next, we performed univariate Cox-regression analysis and showed that individual LncRNA members of prognostic signature were the significant predictors of survival. However, the prognostic score derived from combining the weighted expression of these LncRNA outperformed them in survival prediction (Fig. 4F). The stage of the disease is a reliable and crucial prognostic indicator of LUAD patients, which was validated in the MCTP cohort (Fig. 4F and Table 1). Next, we performed a multivariate Cox regression analysis of patients with prognostic score and stage as the variable. The analysis identified the prognostic score as an independent predictor of survival in the MCTP cohort as well (Fig. 4F and Table 2). Further, we compared the current prognostic score with previously developed prognostic scores. Multivariate analysis showed that the prognostic strength of the current signature is independent and significantly better than all the three previous signatures (Fig. 4G). Furthermore, we performed the GSEA analysis to check the enrichment of gene sets associated with the LUAD stemness phenotype. Interestingly, GSEA analysis between high vs. low prognostic groups showed near significant enrichment of genes sets associated with cell proliferation (Fig. 4H). More importantly, the gene sets directly associated with stemness phenotypes were significantly enriched in the high prognostic score group (Fig. 4I).
These analyses have confirmed that the prognostic score developed in this work is an independent and robust prognosticator of patients. Also, patients with higher prognostic scores show poor differentiation and higher stemness.
Discussion
Stemness has emerged as an essential factor in the determination of aggressiveness and drug resistance in cancer [23]. The reason for the stemness in cancer tissue could be due to increased cancer stem cells (CSCs) or plasticity of bulk cancer cells [8]. Notwithstanding the cause, stemness is a crucial factor in the prognosis of the disease [24, 25]. Here in this study, we have used the stemness index (Malta et al., 2018) to show the molecular characteristics of LUAD patients with high stemness. We have shown that higher stemness of LUAD patients is associated with increased mTOR signaling, cell cycle, and DNA repair suggesting the higher proliferative potential of cells of these tumors. This finding also suggests that LUAD tumors with higher stemness should have increased cellular proliferation rates.
Further, we have used LncRNAs with high average expression to identify the novel prognostic markers associated with stemness. The analysis identified Linc01116, FAM83A-AS1, and Z83851.4 as the most significantly prognosis associated LncRNAs. Interestingly, we have found that all the three prognostic LncRNAs had significantly higher expression in tumors with high stemness. Individually, Linc01116 is a well-established LncRNA involved in the regulation of cell proliferation and migration. In non-small cell lung cancer, Linc01116 contributes to gefitinib resistance by regulating IFI44 [26]. Linc01116 is also known to regulate crucial stemness related transcription factor MYC in nasopharyngeal carcinoma [27]. Similarly, Linc01116 is a vital regulator of epithelial-mesenchymal transition and cell proliferation in head and neck cancers, glioma osteosarcoma, and hepatocellular carcinoma [28, 29, 30, 31]. FAM83A-AS1 is another well studied LncRNA in multiple tumor types. In lung adenocarcinoma, FAM83A-AS1 promotes cell migration by targeting miR-150-5p [32]. FAM83A-AS1 regulates cell growth by increasing the stability of FAM83 mRNA in hepatocellular carcinoma and lung cancer [33, 34]. Interestingly, Z83851.4 is a novel LncRNA with hitherto unknown function. This is the first study to identify Z83851.4 as a prognostic marker in LUAD.
A combination of prognostic markers could emerge to be a better predictor compared to individual markers. Thus, we have used the correlation coefficient as the weight to each LncRNAs and calculated a prognostic score. In Cox-regression analysis, we showed that prognostic score outperformed all the individual LncRNAs and stage, the most robust LUAD prognosticator. We have also used median cut off to show that patients with higher prognostic scores have poor overall and disease-free survival. Since stemness is a major determining factor for the outcome of the cancers, we checked for the association of the poor surviving group with stemness. Chen et al. have identified multiple molecular sub-types of LUAD and shown that the AD.1 subtype has a higher expression of CT antigen, poor differentiation, and reduced survival [18]. Interestingly, we have found that patients with higher prognostic scores were significantly enriched in the AD.1 subtype of LUAD, validating the poor differentiation of these patients. Furthermore, patients with higher prognostic scores had lower expression of differentiation markers like DNAI1, NKX2-1, and SCGB1A1 [35]. All these observations indicated that patients with higher prognostic scores have poor differentiation and higher stemness.
Validation of a prognostic model using a completely independent group of patients is a crucial step for confirming the aptness of the model. Hence, we have used a set of 67 patients from the MCTP cohort to validate the prognostic score using univariate and multivariate Cox regression analysis. Interestingly, the prognostic score proved to be a strong and independent predictor of survival in the MCTP cohort of patients. We have also compared the prognostic strength of previously developed prognostic models with the current prognostic score. As these models were developed using microarray and real-time PCR based studies, we re-derived the prognostic score of these models in the TCGA cohort. The comparison of prognostic strength of each model with the current prognostic score using multivariate Cox regression established the current prognostic model a better and independent predictor of survival.
Thus, we have developed and validated an independent and robust prognostic score. LUAD patients with high prognostic scores showed poor survival and higher stemness characteristics.
Author contribution
Conception: SKS
Interpretation and analysis of data: SKS, AC and SK
Preparation of manuscript: SKS and AC
Supervision: SKS
Supplementary data
The supplementary files are available to download from http://dx.doi.org/10.3233/CBM-200687.
sj-xlsx-1-cbm-10.3233_CBM-200687.xlsx - Supplemental material
Supplemental material, sj-xlsx-1-cbm-10.3233_CBM-200687.xlsx
Footnotes
Acknowledgments
TCGA is acknowledged for the dataset. The department of biotechnology, Govt of India, and DST-SERB, Govt. of India, CCIR, Govt of India and ICMR, Govt of the India are acknowledged for the funding.
Conflict of interest
None to declare.