
Abstract
BACKGROUND:
Minimal invasive blood-based molecular markers are evaluated as promising biomarkers in malignant diseases these days.
OBJECTIVE:
In this pilot study, we investigated the potential of cell-free DNA (cfDNA) concentration and cell-free DNA Integrity (cfDI) as blood-based diagnostic markers for ovarian cancer patients in a retrospective study cohort.
METHODS:
cfDNA concentration and cfDI were determined in the plasma of 37 ovarian cancer patients and 28 healthy controls, by measuring ALU and LINE1 repetitive DNA elements using quantitative real-time PCR.
RESULTS:
A high correlation was observed between the results of ALU and LINE1. The correlated co-efficiency between the values of cfDNA concentration and cfDI was 0.86 and 0.71. As for the results between cases and controls, no or just borderline significant difference was observed in cfDI after age adjustment (
CONCLUSIONS:
cfDNA variables might be potentially diagnostic biomarkers in ovarian cancer, in combination with additional molecular markers. However, further studies are needed to confirm the diagnostic ability of cfDNA variables (cfDNA concentration and cfDI).
Introduction
Ovarian cancer (OC) has a high mortality and morbidity rate among gynecological cancers with more than 22280 new cases estimated to be diagnosed and 14240 estimated number of deaths in the United States in 2016 alone [1]. Overall, it accounts for an estimated 239,000 new cases and 152,000 deaths worldwide annually [2]. As a heterogeneous disease, the origins of ovarian cancer are complex. Basically it can be generally categorized into three types according to its initial origins: epithelial, stromal and germ cell [3]. Epithelial ovarian cancer is the most common type of ovarian cancer with the proportion of 90% [4].
The survival rate of ovarian cancer patients is low, the 5-year relative survival rate is around 49% in general [5]. In stage I ovarian cancer patients where the cancer has not spread outside of the ovary, the 5-year survival rate is 90%. However, only 15% of all ovarian cancers can be identified at this early stage as the symptoms are not noticeable. The current screening measurements, including ultrasound and serum cancer antigen 125 (CA125) test, are used widely nowadays [6]. Ultrasound, especially transvaginal ultrasound can help to find abnormalities in the ovary, however, it cannot confirm whether these abnormalities are benign or malignant. CA125 is at the moment the most extensively studied serum biomarker for possible use in the early detection of OC while its sensitivity and specificity are limited [7]. So there is an urgent need of new non-invasive diagnostic markers for early stage ovarian cancer diagnosis to increase survival rates and benefit patient’s prognosis.
Recently, liquid biopsy has gained increasing importance as circulating molecular biomarkers in the peripheral blood hold the advantages of easy accessibility, reproducibility and early detection [8]. Circulating DNA, microRNAs and circulating tumor cells have been investigated for the diagnosis and prognosis of different type of cancers [9, 10, 11, 12, 13, 14].
Circulating DNA is characterized as cell-free DNA (cfDNA) observed in serum or plasma [15, 16]. Elevated cfDNA concentrations have been observed in serveral types of cancer [17]. cfDNA integrity (cfDI) is one measure defining the fragmentation of cfDNA. It is calculated as the ratio of longer DNA fragment concentrations to shorter ones of the same specific genetic locus. As the most abundant classes of repetitive DNA elements, ALU and LINE1 cover approximately 10% and 17% of the genome [18]. Studies have been conducted to evaluate the potential application of cfDI from ALU and LINE1 variables as a diagnostic biomarker in many different types of cancer like breast or prostate cancer [19].
Until now, there are limited studies regarding the difference of cfDNA concentration and cfDI between ovarian cancer patients and healthy controls. Here, we compare the difference of these cfDNA variables between the two groups. In addition, the potential diagnostic ability of cfDNA variables was also measured as the main purpose of this pilot study.
Methods and materials
Study subjects
This study was approved by the Ethical Committee of the University of Heidelberg (Heidelberg, Germany). All subjects were females and of Caucasian origin. Ovarian cancer patients with a primary tumor diagnosed between April 2010 and April 2014 were enrolled in the study. Patients’ blood was collected at the time point of the enrollment. Healthy controls were verified not to have ovarian disease, autoimmune diseases or inflammation diseases at the time of blood collection. In total, 37 ovarian cancer patients and 28 healthy controls were included in this study. All subjects’ demographic and clinical data are presented in Table 1.
Distribution of clinical features of healthy controls and ovarian cancer patients
Distribution of clinical features of healthy controls and ovarian cancer patients
Mean and median cfDNA concentration and cfDI in ovarian cancer patients and healthy controls calculated from ALU and LINE1 variables, and
Peripheral blood was collected from all patients in 9 ml EDTA tubes (S-Monovette R, Sarstedt, Nümbrecht, Germany). Blood was centrifuged at 1300 g for 20 min at 10
Measurement of cfDI and cfDNA concentration
Concentration and integrity of cfDNA in blood plasma were analyzed by measuring the abundances of short and long fragments of two repetitive DNA elements, ALU (ALU-111bp, ALU-260bp) and LINE1 (LINE1-97bp, LINE1-266bp) as described before [11, 20]. All primer sequences and amplicon lengths are given in Table 1S as described before [11]. The fragment concentrations were measured in triplicates by quantitative PCR using ABsolute qPCR SYBR Green Mix (Thermo Scientific, Carlsbad, USA) and the LightCycler480 system (Roche Diagnostics, Mannheim, Germany). The cfDNA eluate was diluted 1:20 before use to achieve optimal PCR efficiency. Concentrations of the long and short fragments were calculated using the absolute quantification method according to the Light Cylcer 480 software instructions by a standard curve from five different dilutions with known DNA concentrations in each PCR plate. cfDI was calculated as the ratio of long divided by short fragments concentrations for each of the elements: ALU-260/111, LINE1-266/97. As short amplicons were nested within the long fragments, cfDI ranged from 0 to 1. Short fragment concentrations were regarded as overall cfDNA concentrations.
Statistical analysis
All statistical analyses were carried out using the PASW Statistics 23.0 (SPSS, Chicago, IL, USA) package. cfDNA concentrations were log
Results
Clinical characteristics of the study
The clinical characteristics of ovarian cancer patients are described in Table 1. The range of age is 30–63 in control group and 37–80 in ovarian cancer patients group. We observed that age distributions between healthy controls and ovarian cancer patients were not similar (Median: 47 vs. 62, range: 30–63 vs. 37–80) because of our strict inclusion criteria. The mean
-values of logistic regression analysis for age-adjusted comparisons of cfDI and cfDNA concentrations between ovarian cancer patients and healthy controls
Area under curve (AUC) using cell-free DNA variables calculated from ALU and LINE1 targets, to estimate the strength of the model to discriminate two groups revealed by receiver operating characteristic (ROC)
Correlation of (a) cell-free DNA concentration and (b) cell-free DNA integrity (cfDI) estimated from ALU and LINE1 repetitive elements.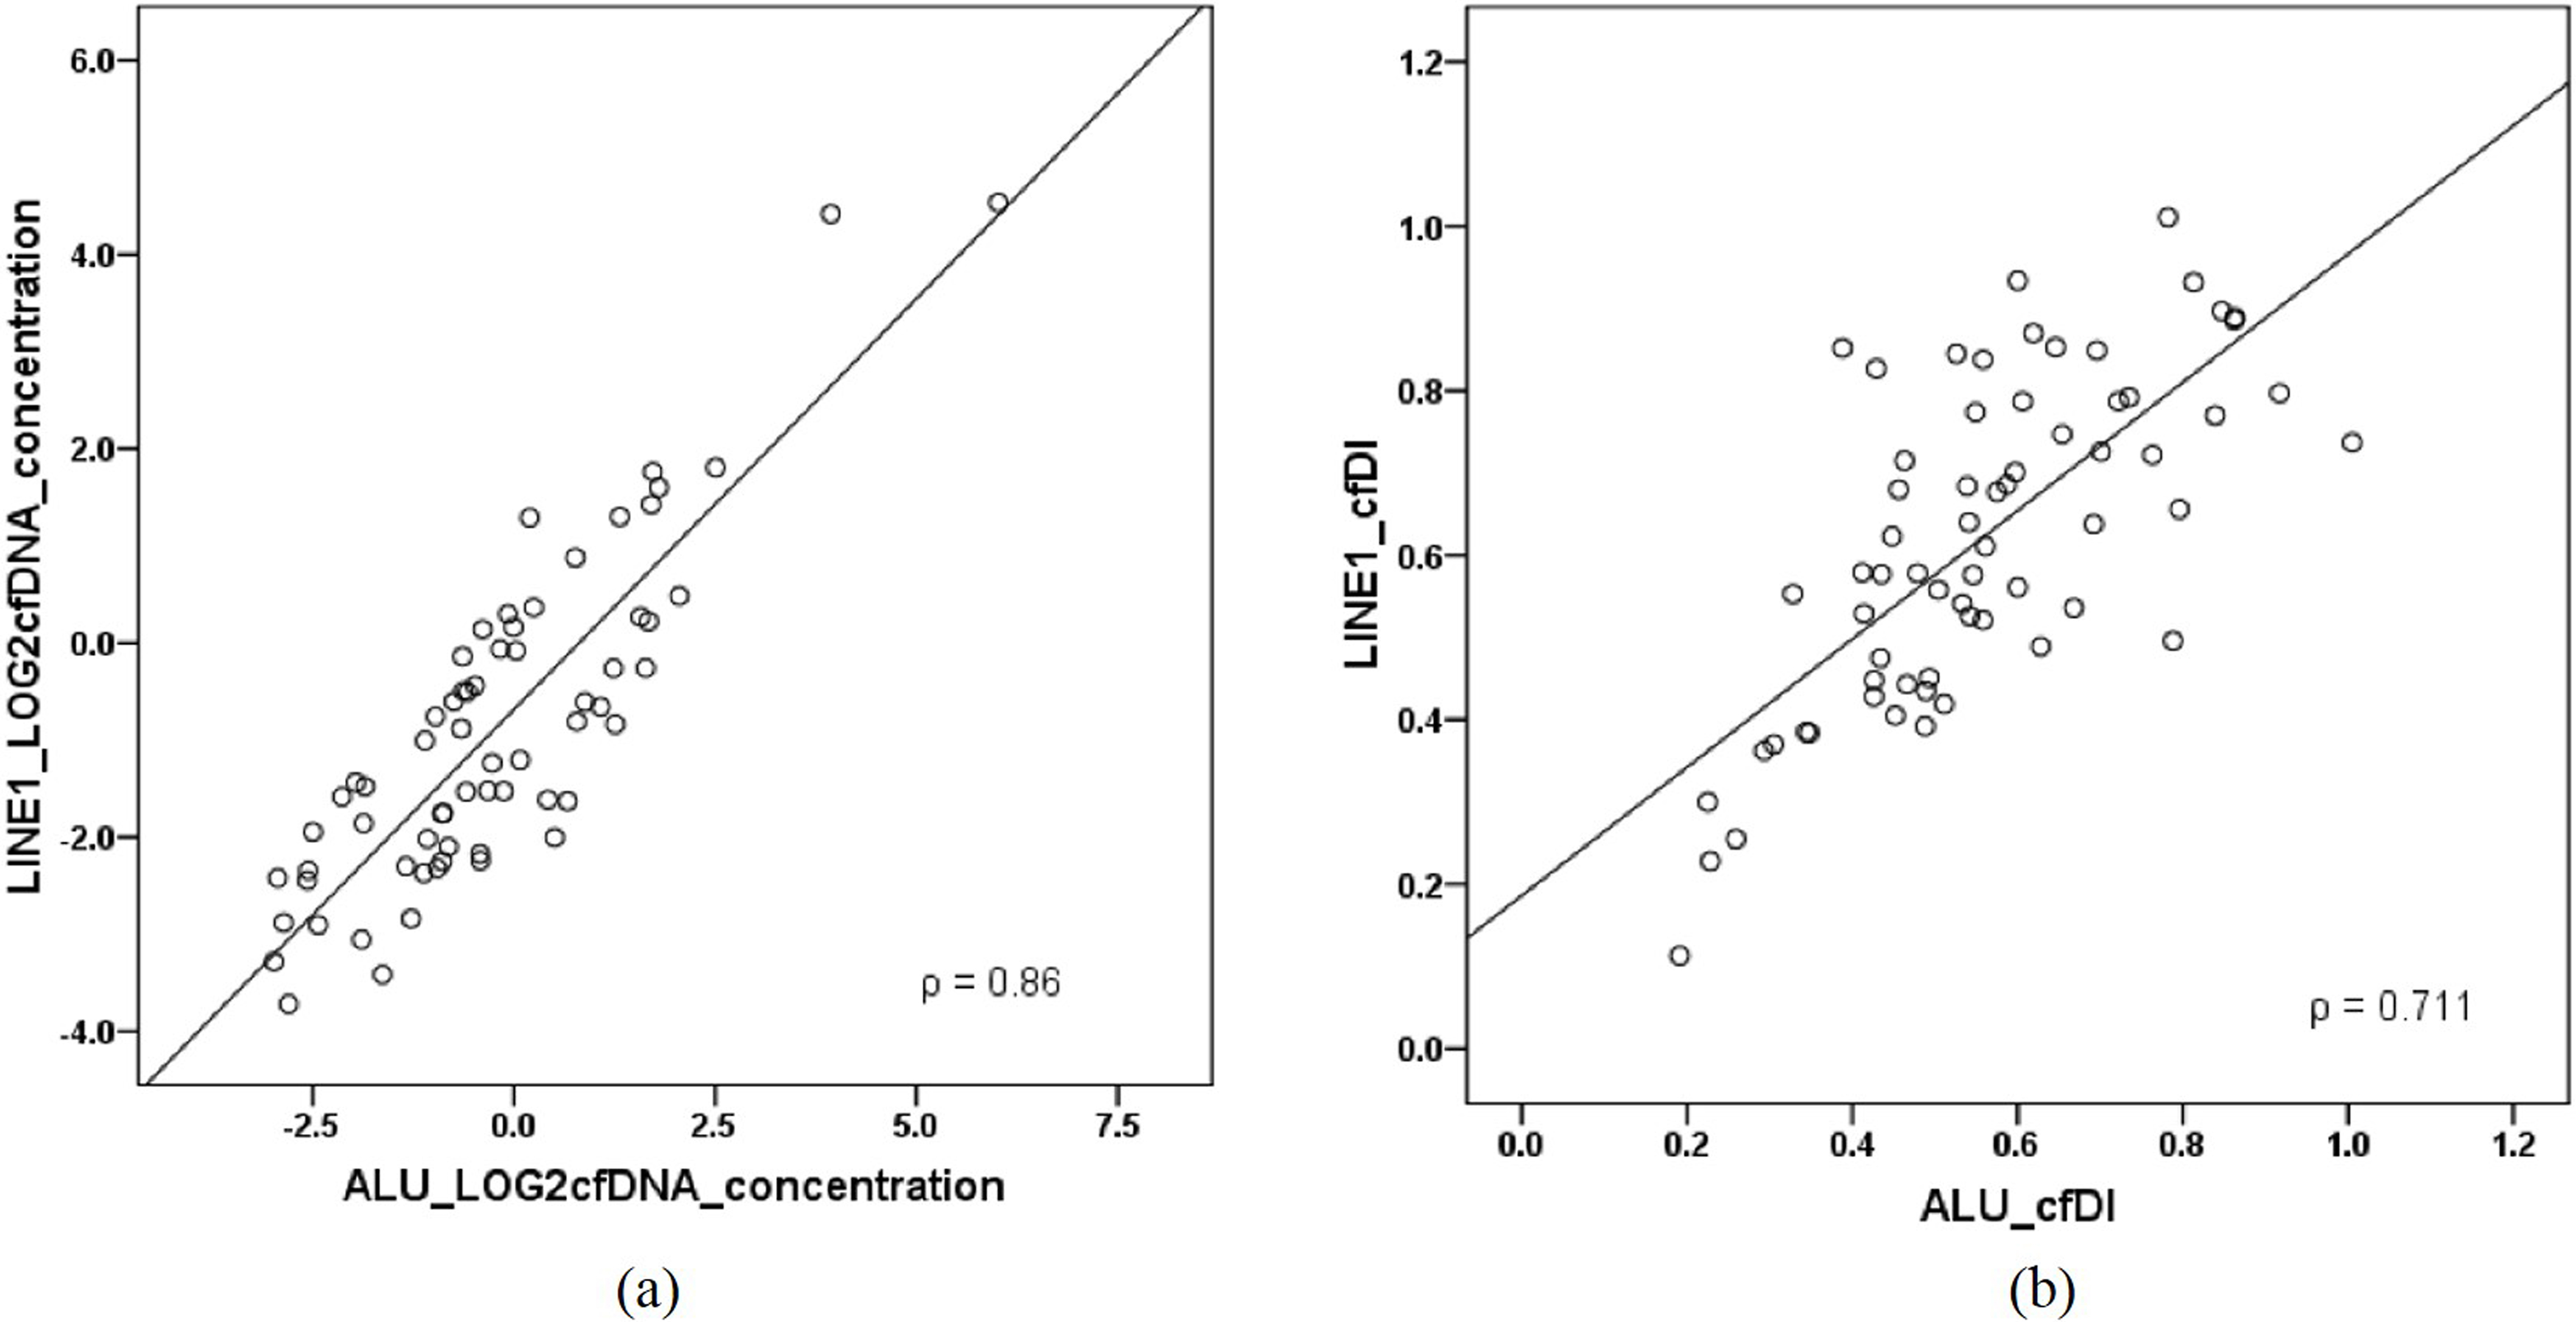
In ovarian cancer patients, we observed a significantly higher cfDNA concentration compared to healthy controls as described in Table 2 and Fig. 1. In detail, the concentrations (mean
The
Consistency of cfDI and cfDNA concentration of ALU and LINE1 repetitive results
In order to test the consistency of the ALU and LINE1 repetitive results, Spearman’s rank correlation method was applied. The results between the independently measured ALU and LINE1 elements were consistent with high correlation both for log
Box and whisker plots of cell-free DNA concentration between controls and ovarian cancer patients estimated from ALU and LINE1 targets.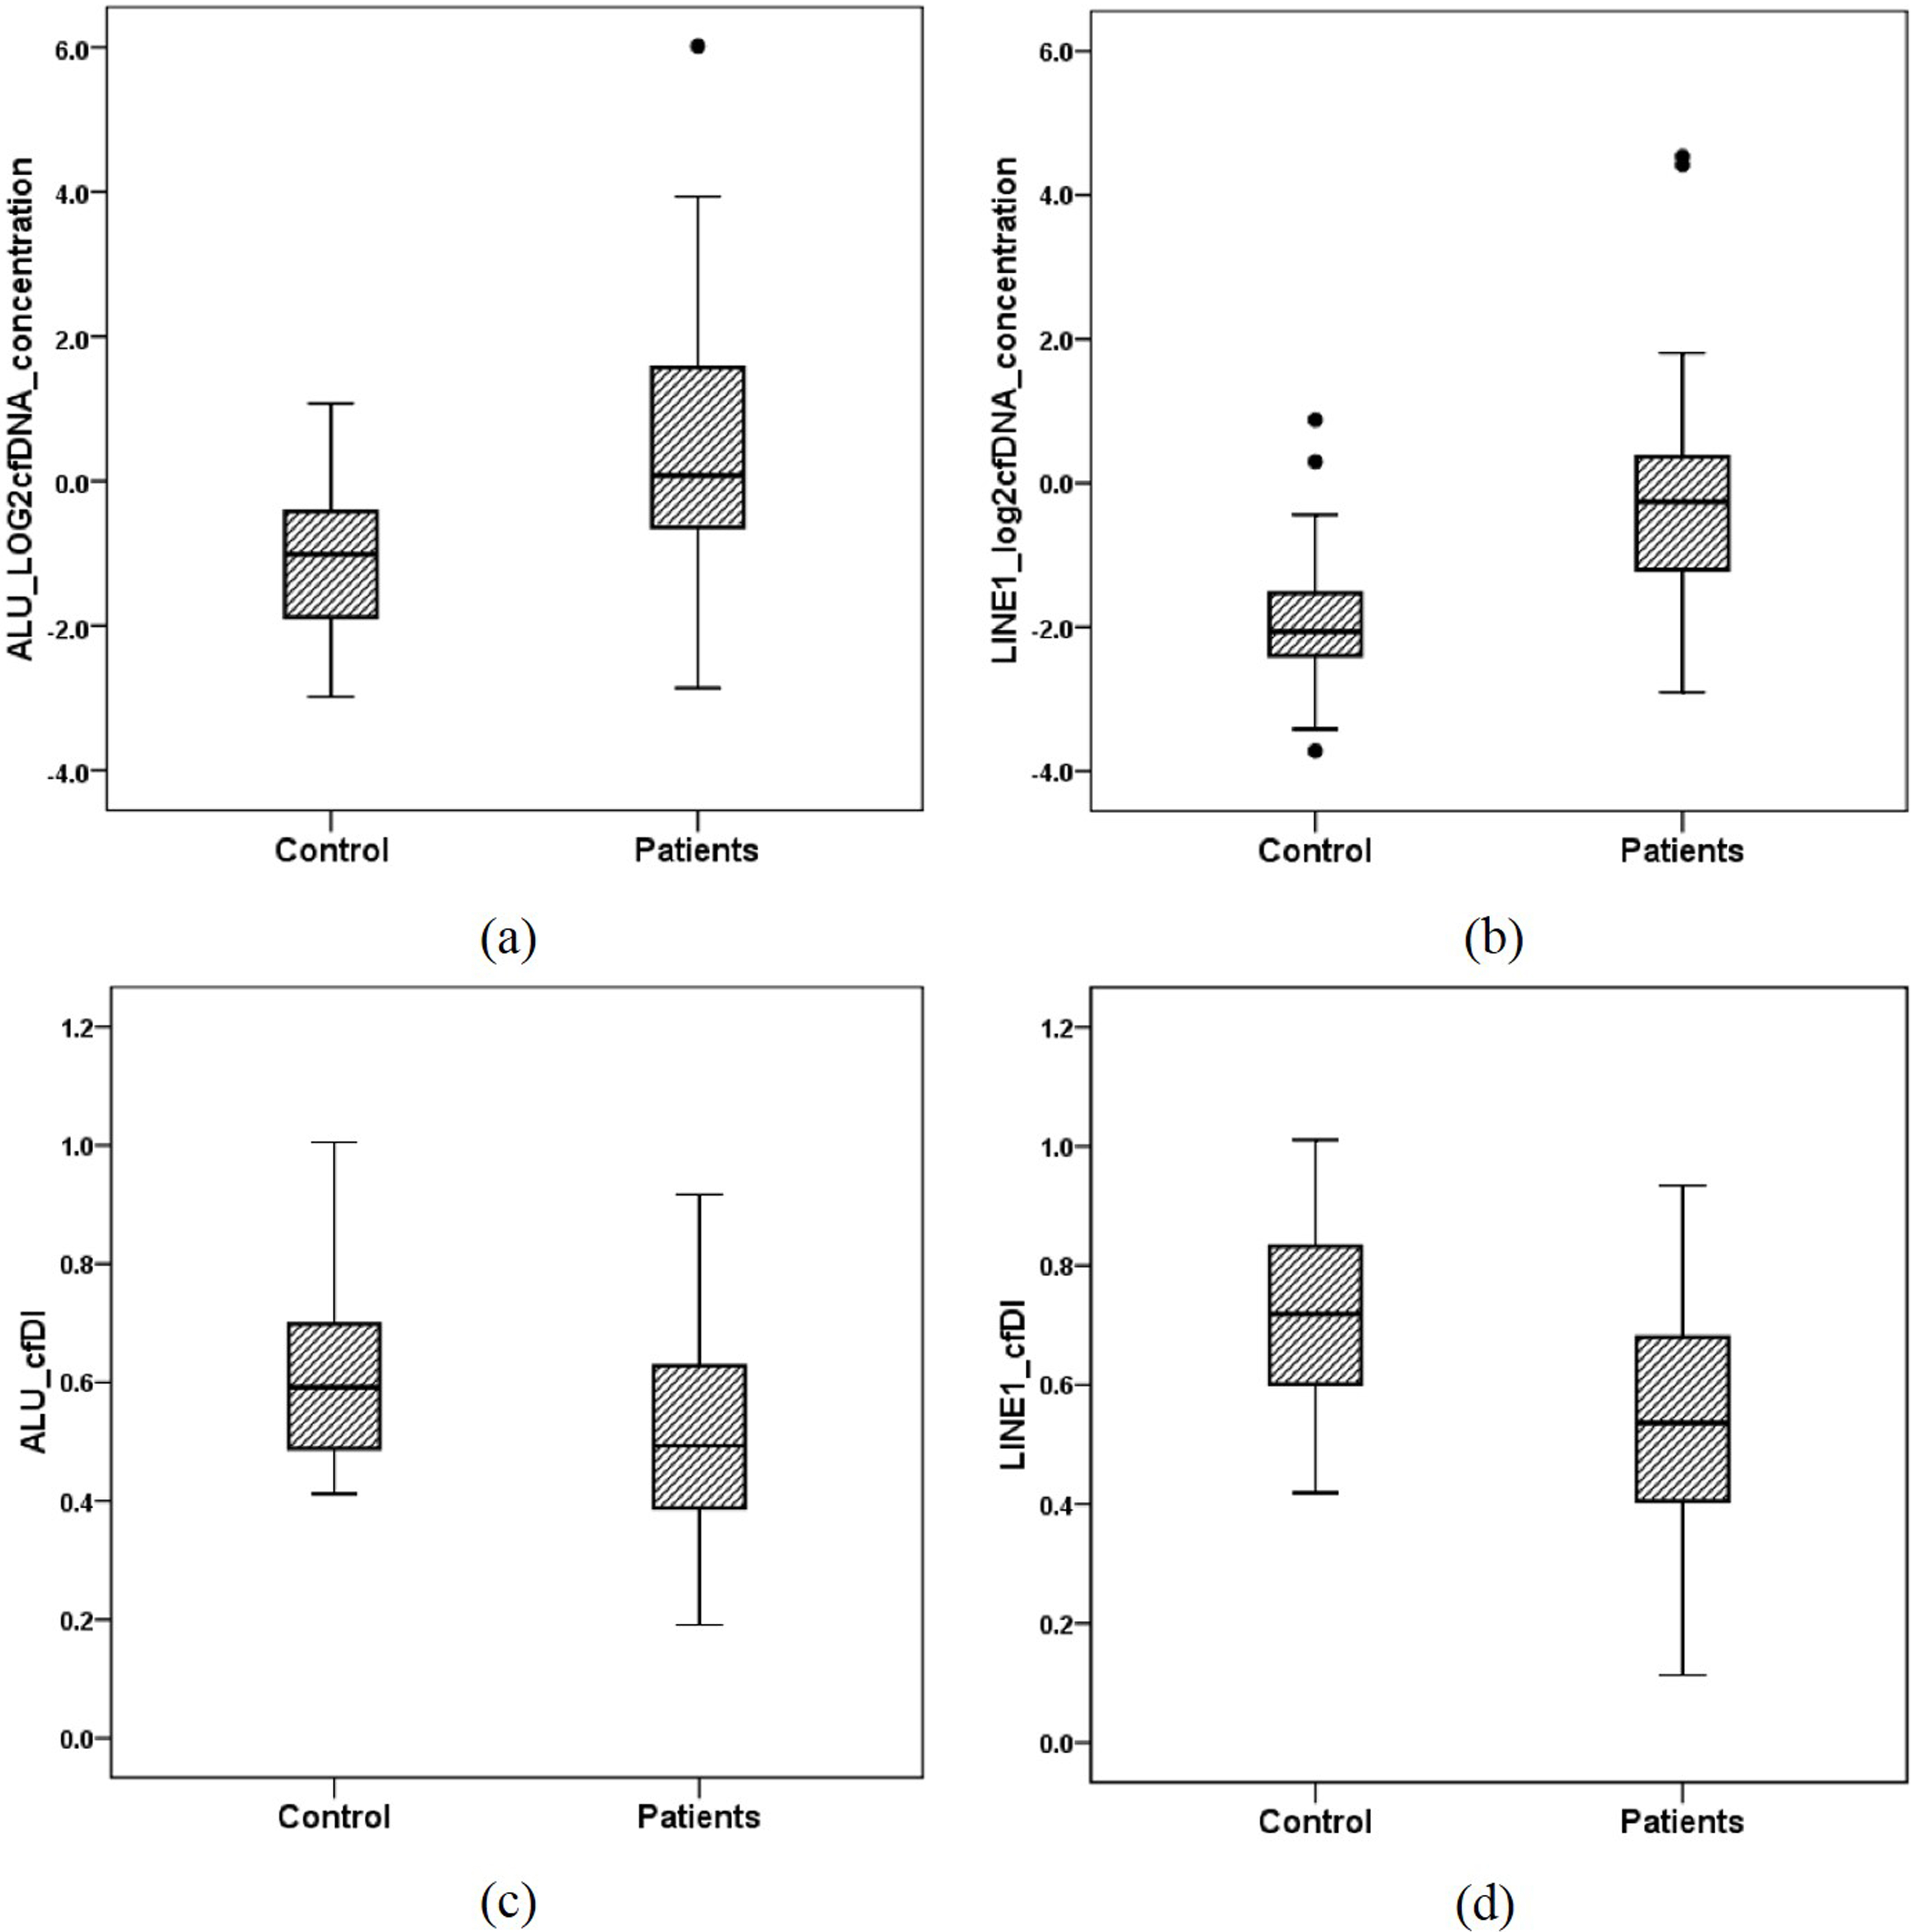
Since the age distributions between ovarian cancer patients and healthy controls were not similar, we assessed the correlation between age and cfDNA variables by Spearman correlation analysis. In ALU repetitive DNA elements, the spearman’s
Receiver operating characteristic (ROC) analysis using cell-free DNA concentration and cell-free DNA integrity calculated from ALU and LINE1 targets, to estimate the strength of the model to discriminate between OC patients and healthy controls, along with area under the curve (AUC) after age adjustment.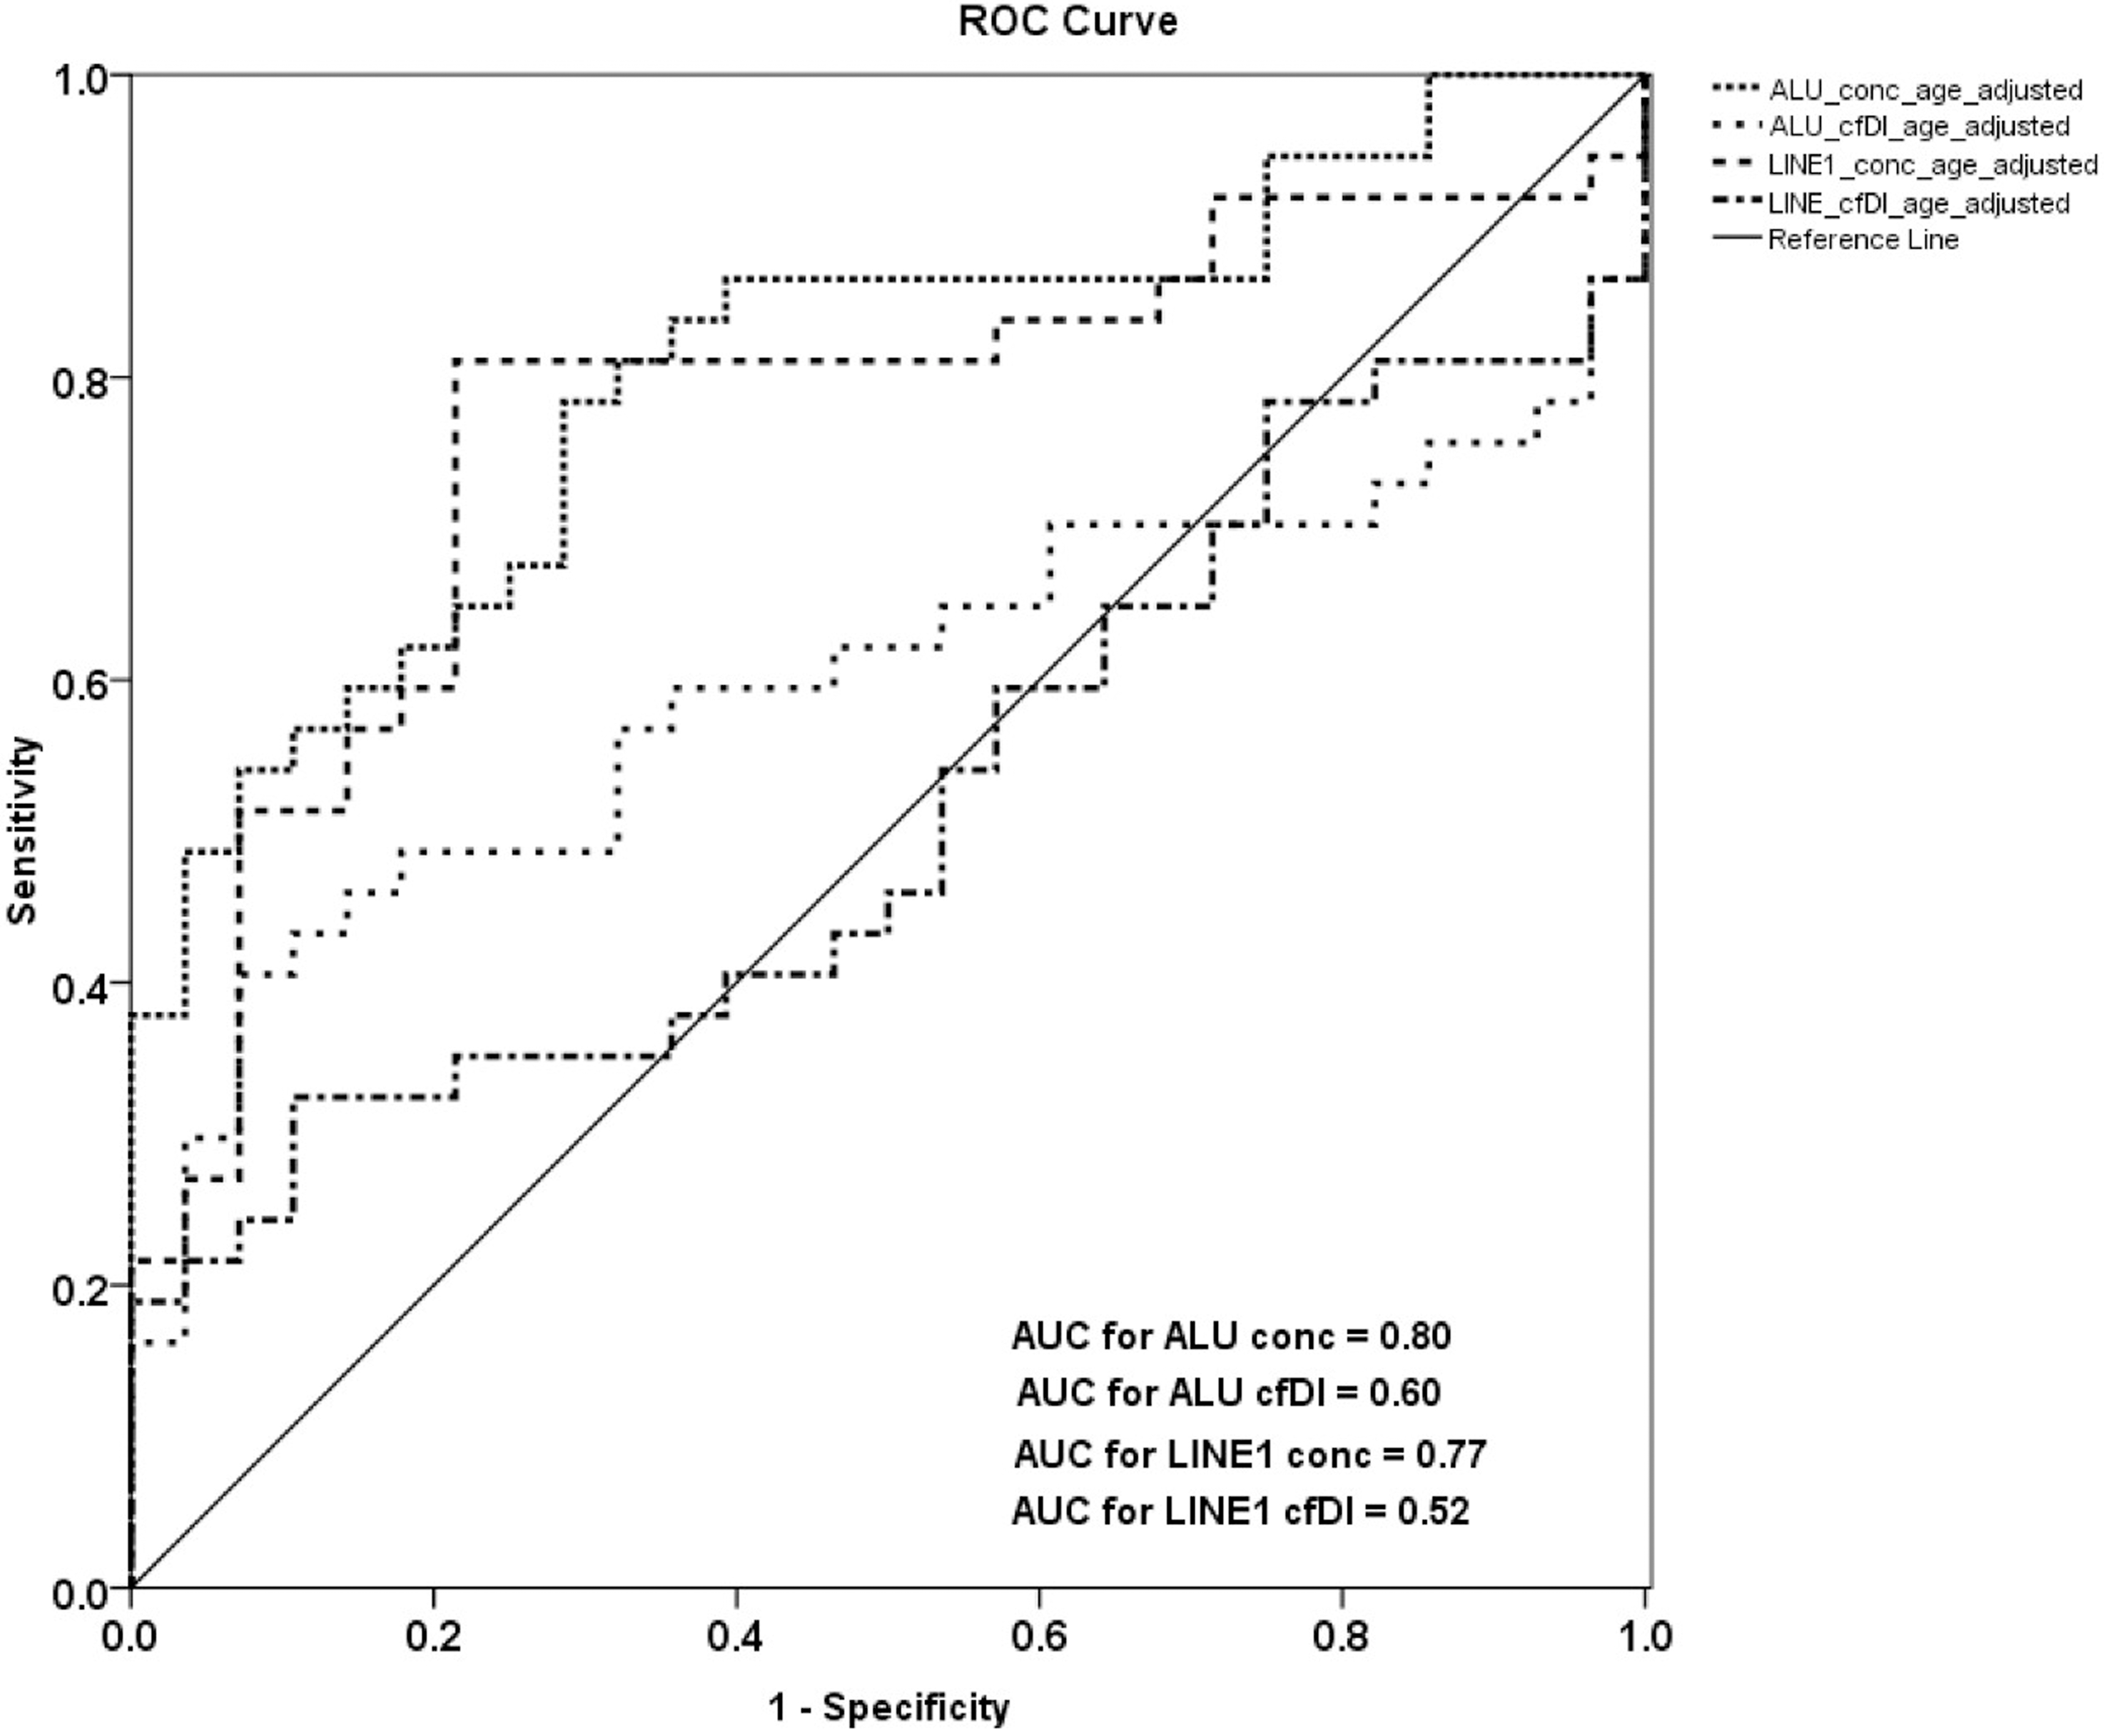
Receiver operating characteristic (ROC) analysis using cell-free DNA concentration and cell-free DNA integrity, calculated from ALU and LINE1 variables in combination, to estimate the strength of the model to discriminate between OC patients and healthy controls, along with area under the curve (AUC) after age adjustment.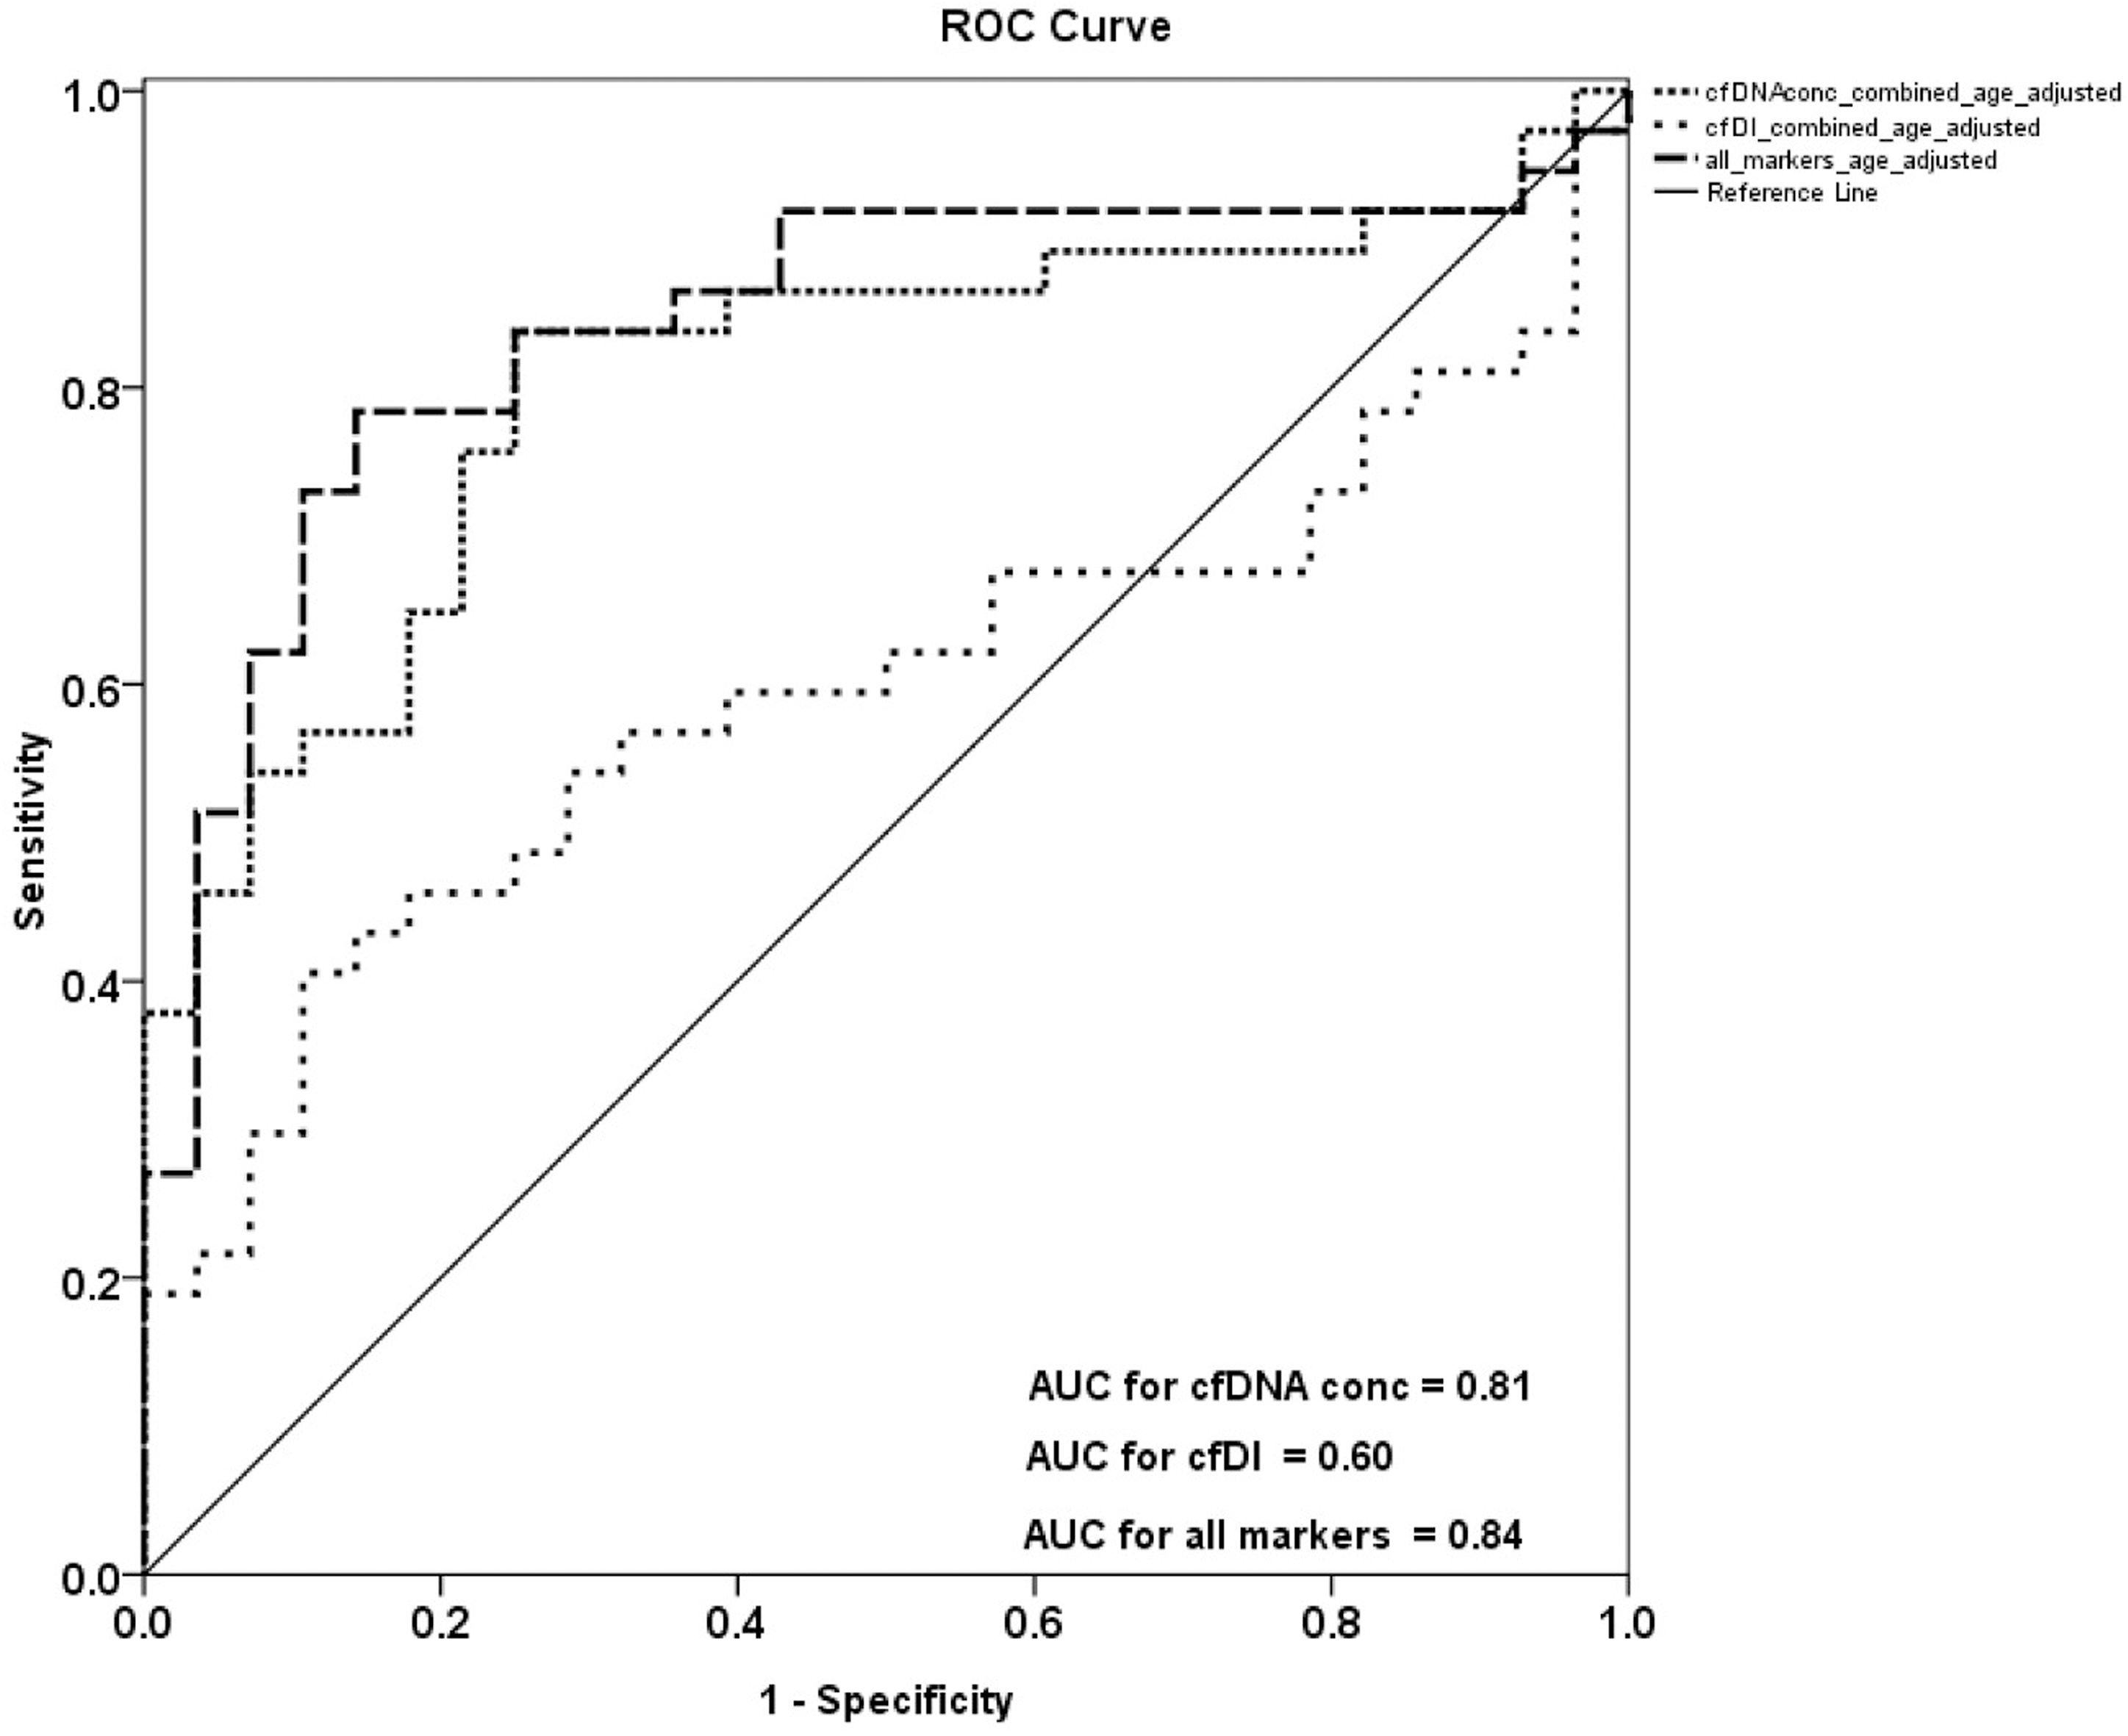
The discriminatory power of cfDNA concentration and cfDI was examined by receiver operating characteristic analysis (Table 4). ROC analysis revealed that cfDI can distinguish patients from healthy controls with an AUC of only 0.65 for ALU and only 0.72 for LINE1(Supplemental Fig. 9). cfDNA concentration can distinguish patients from healthy controls with an AUC of 0.77 for ALU and 0.84 for LINE1(Supplemental Fig. 10). Combining ALU and LINE1 data for cfDI, a discriminatory power with an AUC of 0.72 was reached (Supplemental Fig. 11). The combination of ALU and LINE1 cfDNA concentration and integrity resulted in an AUC of 0.87 which indicates a promising biomarker for ovarian cancer diagnosis indicated that the measurement of these repetitive DNA elements parameters might be promising biomarker for ovarian cancer diagnosis (Supplemental Fig. 12).
After age adjustment ROC analysis revealed that cfDI can distinguish patients from healthy controls (but not as strong as cfDNA concentration) with an AUC of only 0.60 for ALU and only 0.52 for LINE1 (Fig. 3). ROC analysis fort cfDNA concentration can distinguish patients from healthy controls with an AUC of 0.80 for ALU and 0.77 for LINE1 (Fig. 3). Combining ALU and LINE1 data for cfDI, discriminatory power with an AUC of 0.60 was reached and for cfDNA concentration an AUC of 0.81 (Fig. 4). Using the combination of both repetitive elements (ALU and LINE1) with both measured characteristics, cfDNA concentration and integrity, the AUC can reach 0.84 which indicates a promising biomarker for ovarian cancer diagnosis (Fig. 4).
Discussion
In this study, we identified an elevated level of cfDNA concentration and a decreased level of cfDI of the two repetitive elements ALU and LINE1 in OC patients in comparison to healthy controls. After age-adjustment, only cfDNA concentration between different groups was a significant marker while cfDI was not significant any more. By using ROC analysis, we identified that the combination of cfDI and cfDNA concentration of both repetitive elements can be a diagnostic biomarkers in ovarian cancer patients with large potential.
Liquid biopsy is becoming more and more important in precision medicine [21]. Many traditional biomarkers, such as microRNA, circulating DNA, circulating tumor cells have been investigated as diagnostic or prognostic markers in various kind of tumors. cfDNA concentration and cfDI are two prominent biomarkers among them. Overall cancer patients have higher cell-free DNA concentration levels than healthy controls and also showed a much wide range of values [8]. As to cfDI, several studies have identified an altered integrity of cfDNA in malignant cancer patients compared to healthy controls [22]. However these results are heterogeneous. Some studies observed a reduced cfDI in cancer patients [23, 24, 25], while others reported an increased cfDI [26, 27].
Results of this study, showing a higher cfDNA concentration in OC patients compared to healthy controls (age-adjust
As to cfDI, only a few studies focus on the cfDI in ovarian cancer so far. In Wang’s research about cfDI in malignant gynecological neoplasms, no detailed cfDI results were shown between ovarian cancer patients and controls [32]. In our results we observed a significant decreased level of cfDI in ovarian cancer patients in comparison to healthy controls. The results we obtained were similar to other studies in breast cancer, reported from our group before [11, 20]. However, the differences of cfDI were not significant while only LINE1 cfDI showed a borderline significance (
In order to detect potential clinical-used biomarkers, it is of great importance to apply a standardized sample processing protocol with all samples. Many factors during the process can influence the outcome of cfDNA results [35]. In our study we conducted a protocol which has been validated many times before in other studies of our group [11, 20, 36]. Very important handling steps are the processing of blood within 2 hours after withdrawal and a two-step centrifugation process for the plasma purification, including a high-speed centrifugation step in order to remove cell debris of all plasma samples were thawed only once directly before use. Using this standardized procedure, we observed a good correlation from results between ALU and LINE1. Our concordant observations from independent cfDI measurements of these two elements minimize the possibility of false-positive results. In addition, cfDI shows values between 0 to 1 in contrast to cfDNA concentration that can vary a lot more and sometimes be extremely low and therefore hard to detect.
However, also the biggest limitation of this study should also be noted here. Because of the strict inclusion and exclusion criteria, the sample size of the study is very small which resulted insufficient power of the study. Nevertheless, it is not reasonable to analyze cfDNA related variables in different clinical subgroups of OC. Also depending on the strict inclusion criteria, the age distribution was not matched between the OC patients and the healthy controls. We also observed that age was correlated with cfDNA variables. Nevertheless, it would be worthwhile to investigate cfDNA variables combined with other blood-based biomarker in further prospective studies with excellent plasma material in a larger cohort. In addition, it would be interesting to evaluate if cfDNA variables can also contribute to the discrimination of different stages of OC patients.
In summary, our study shows increased cfDNA concentrations and decreased cfDI in ovarian cancer patients compared to healthy controls. After age adjustment, only cfDNA concentrations showed a significant difference while cfDI were not significantly different. Combining all markers, the best diagnostic power was reached. More studies are needed to confirm the putative diagnostic value of cfDNA variables in ovarian cancer patients, especially as part of a molecular, blood-based multi-marker assay.
Footnotes
Acknowledgments
We thank Sabine Serick, Katharina Cuk, Sarah Schott, Frederik Marme, Christof Sohn and all clinical colleagues and patients for their contribution to this sample collection.
Conflict of interest
The authors declare that they have no conflict of interest.
Supplementary data
The supplementary files are available to download from http://dx.doi.org/10.3233/CBM-191018.