
Abstract
BACKGROUND:
Effective prognostic biomarkers and powerful target-therapeutic drugs are needed for improving the treatment of Hepatocellular carcinoma (HCC).
OBJECTIVE:
This study aimed to evaluate the expression of FOXM1 and Aurora-A and their prognostic value in HCC.
METHODS:
We determined the differentially expressed genes signature in HCC using the Gene Set Enrichment Analysis (GSEA), and then evaluated the expression of FOXM1 and Aurora-A in TCGA and KMUH cohort. Associations between co-expression of FOXM1 and Aurora-A and clinical variables were calculated. Overall survival (OS) and recurrence-free survival (RFS) were estimated with different FOXM1 and Aurora-A expression status.
RESULTS:
FOXM1-related gene sets were mostly associated with cell cycle regulation in HCC tissues. We found a positive correlation between the expression of FOXM1 and Aurora-A. Overexpression of FOXM1 and Aurora-A was associated with larger tumor size, advanced stage, higher grade, and double-positive for HBV and HCV. The coordinated overexpression of FOXM1 and Aurora-A was the most significant independent prognostic factor for OS and RFS. Furthermore, the concomitant high expression of FOXM1 and Aurora-A predicted the worst OS of sorafenib-treated patients with HCC.
CONCLUSIONS:
The co-expression of FOXM1 and Aurora-A could be a reliable biomarker to predict the sorafenib response and prognosis of HCC patients.
Introduction
Hepatocellular carcinoma (HCC) usually results in a high mortality rate, especially in South-Eastern Asia [1]. Some therapeutic strategies such as curative resection, liver transplantation, and target therapy may be promising for the treatment of HCC, whereas its prognosis remains unsatisfactory due to frequent recurrence and metastasis rates. HCC is a highly heterogeneous malignancy with robust clinical and molecular diversities. Many HCC patients are diagnosed with advanced-stage due to the lack of precise early diagnosis and effective treatment [2]. HCC treatment failures are primarily caused by frequent recurrence and lead to poor prognosis. New reliable biomarkers for survival prognosis and prediction of drug response are needed because they are crucial for developing more effective diagnostic and therapeutic strategies.
Many genome-wide expression profiling studies have revealed genetic alterations during tumorigenesis in the past decade. The combination of transcriptome sequencing and bioinformatics analysis has allowed the identification of differentially expressed genes involved in the development and progression of HCC. Although serum alfa-fetoprotein (AFP) can be a diagnostic marker to detect HCC, normal AFP levels are present in 30% of patients at the time of diagnosis, even with advanced HCC [3, 4]. However, there is still no reliable biomarker to predict the survival prognosis of HCC by liver biopsy in clinical practice. Thus, it is essential to find new putative biomarkers that may predict the prognosis of HCC and guide personalized therapy for HCC patients.
Forkhead box protein M1 (FOXM1) plays an important role in regulating cell cycle progression, differentiation of cancer, and drug resistance [5]. Recent studies demonstrated that FOXM1 is a key transcription factor associated with HCC [6] and that elevated FOXM1 expression is associated with poor prognosis of HCC [7], colorectal cancer [8] and lung cancer [9]. FOXM1 also is related to drug resistance in breast and lung cancer [10, 11]. These results clearly show the critical role of FOXM1 in tumorigenesis and therapeutic response to chemotherapy. Although FOXM1 is upregulated in numerous cancers, it is unclear whether the differentially expressed genes signature, including FOXM1, can be prognostic biomarkers and whether they contribute to alternative signaling pathways for the tumor progression of HCC.
Here, we identify specific genes that are significantly co-deregulated with FOXM1 in HCC. We analyzed the expression data of the HCC cohort from The Cancer Genome Atlas (TCGA) and a validation (KMUH) cohort and evaluated an association between the gene expression signature and clinicopathological characteristics, including patient’s survival. FOXM1 can predict the worst overall survival (OS) of sorafenib-treated patients with HCC. This work will provide further insight into developing prognostic biomarkers and potential molecular targets for new therapeutic direction.
Materials and methods
The Cancer Genome Atlas (TCGA) dataset
We downloaded TCGA Liver Cancer (LIHC) level 3 processed mRNA expression data and clinicopathological data from the UCSC Xena (
Clinical variables of the HCC patients
Clinical variables of the HCC patients
Gene sets enrichment of FOXM1-related GO biological process gene sets in 341 HCC from TCGA dataset
ES, enrichment score; NES, normalized enrichment score; NOM, nominal; FDR, false discovery rate.
A total of 40 diagnosed HCC specimens with adjacent non-cancerous tissues were used according to the ethical guidelines of the Declaration of Helsinki and was approved by the Institutional Review Board (IRB) of Kaohsiung Medical University Hospital (KMUHIRB-F(I)-20170093). The median age of the patients was 60 years (range, 38 to 80 years). The follow-up period was from 45 to 2,402 days, with a median of 1,572 days.
Gene set enrichment analysis (GSEA)
For Gene Ontology (GO) biological process gene sets rank analysis, we used the Gene Set Expression Analysis (GSEA) tool [13, 14] to estimate the difference of FOXM1-related gene sets between all primary HCC and adjacent tissues. Each gene set would get an enrichment score (ES) that represented the degree of the overexpressed gene set. The nominal (NOM)
Effect of FOXM1 knockdown on the expression of cell cycle-regulating proteins in HCC cells. HepG2 and Hep3B cells were transfected with control siRNA or with FOXM1 siRNA. The expression of the indicated cell cycle-regulating proteins was analyzed by western blotting.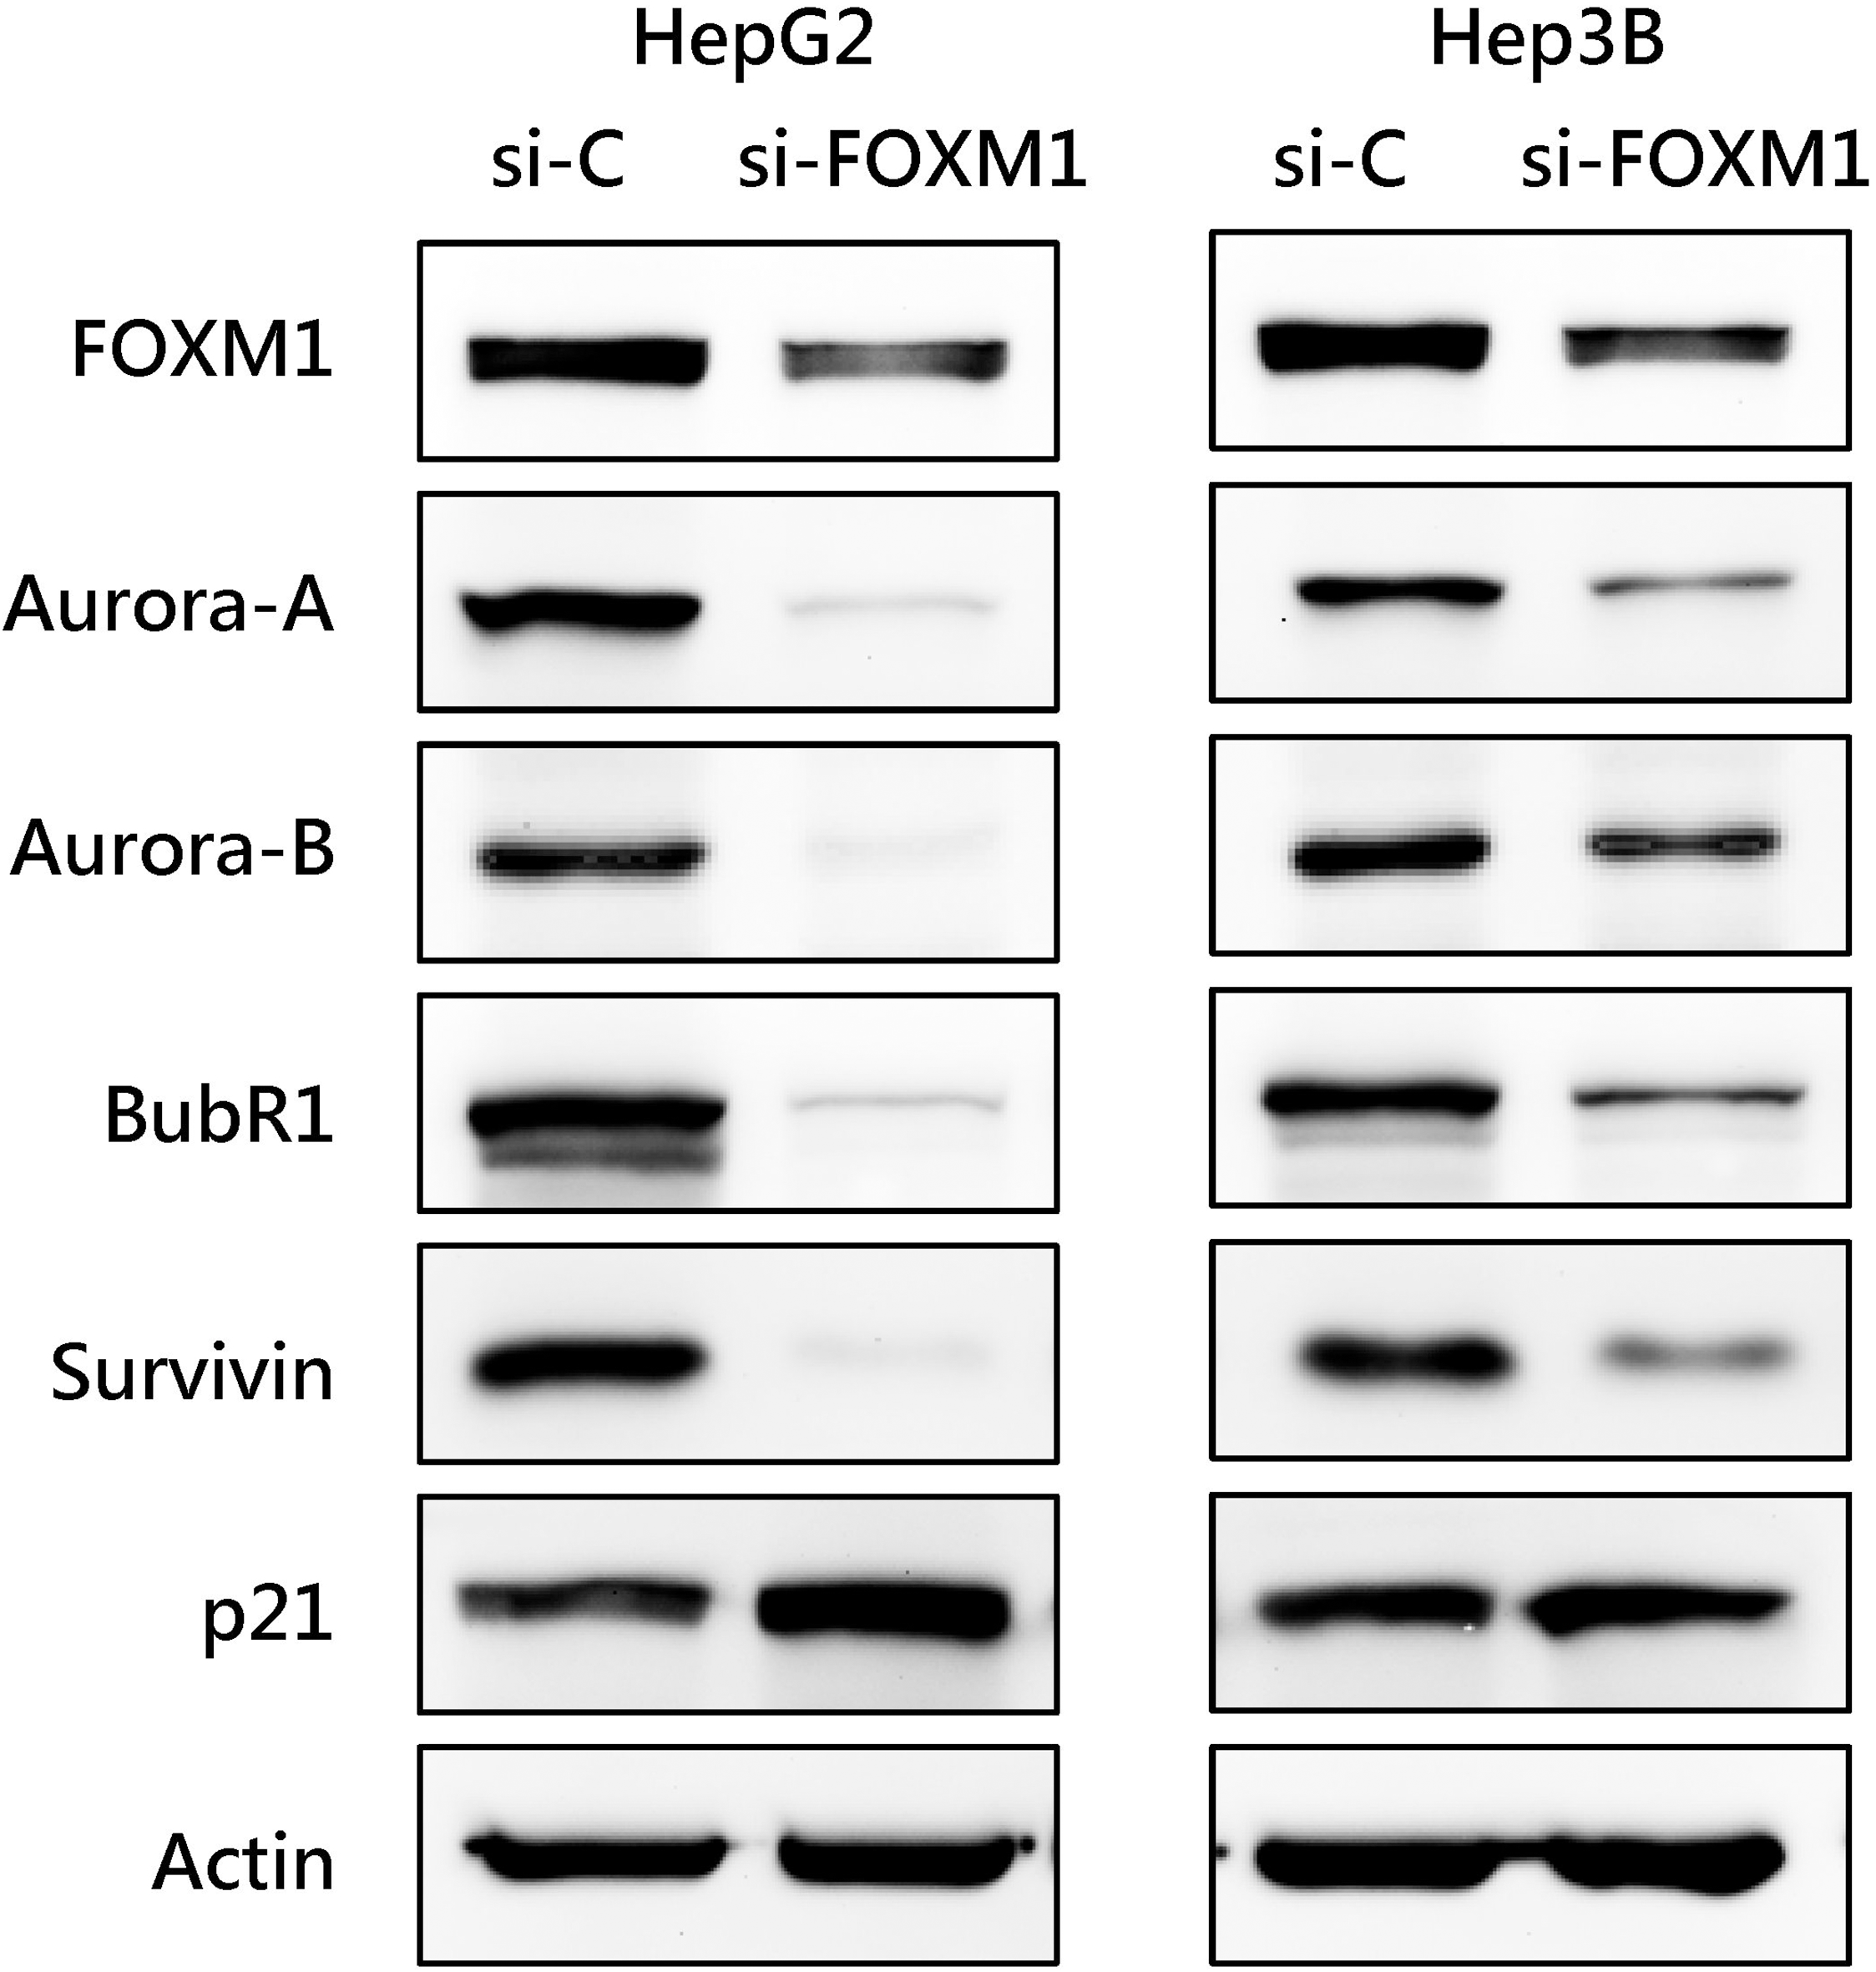
FOXM1 expression is positively correlated with Aurora-A expression in human HCC. (a) The expression of FOXM1 and Aurora-A in HCC and adjacent liver tissues by transcriptome sequencing from the TCGA dataset (Left). The expression levels of the FOXM1 and Aurora-A mRNAs were validated in 40 paired HCC from KMUH using RT-qPCR (Right). The horizontal lines depict the mean 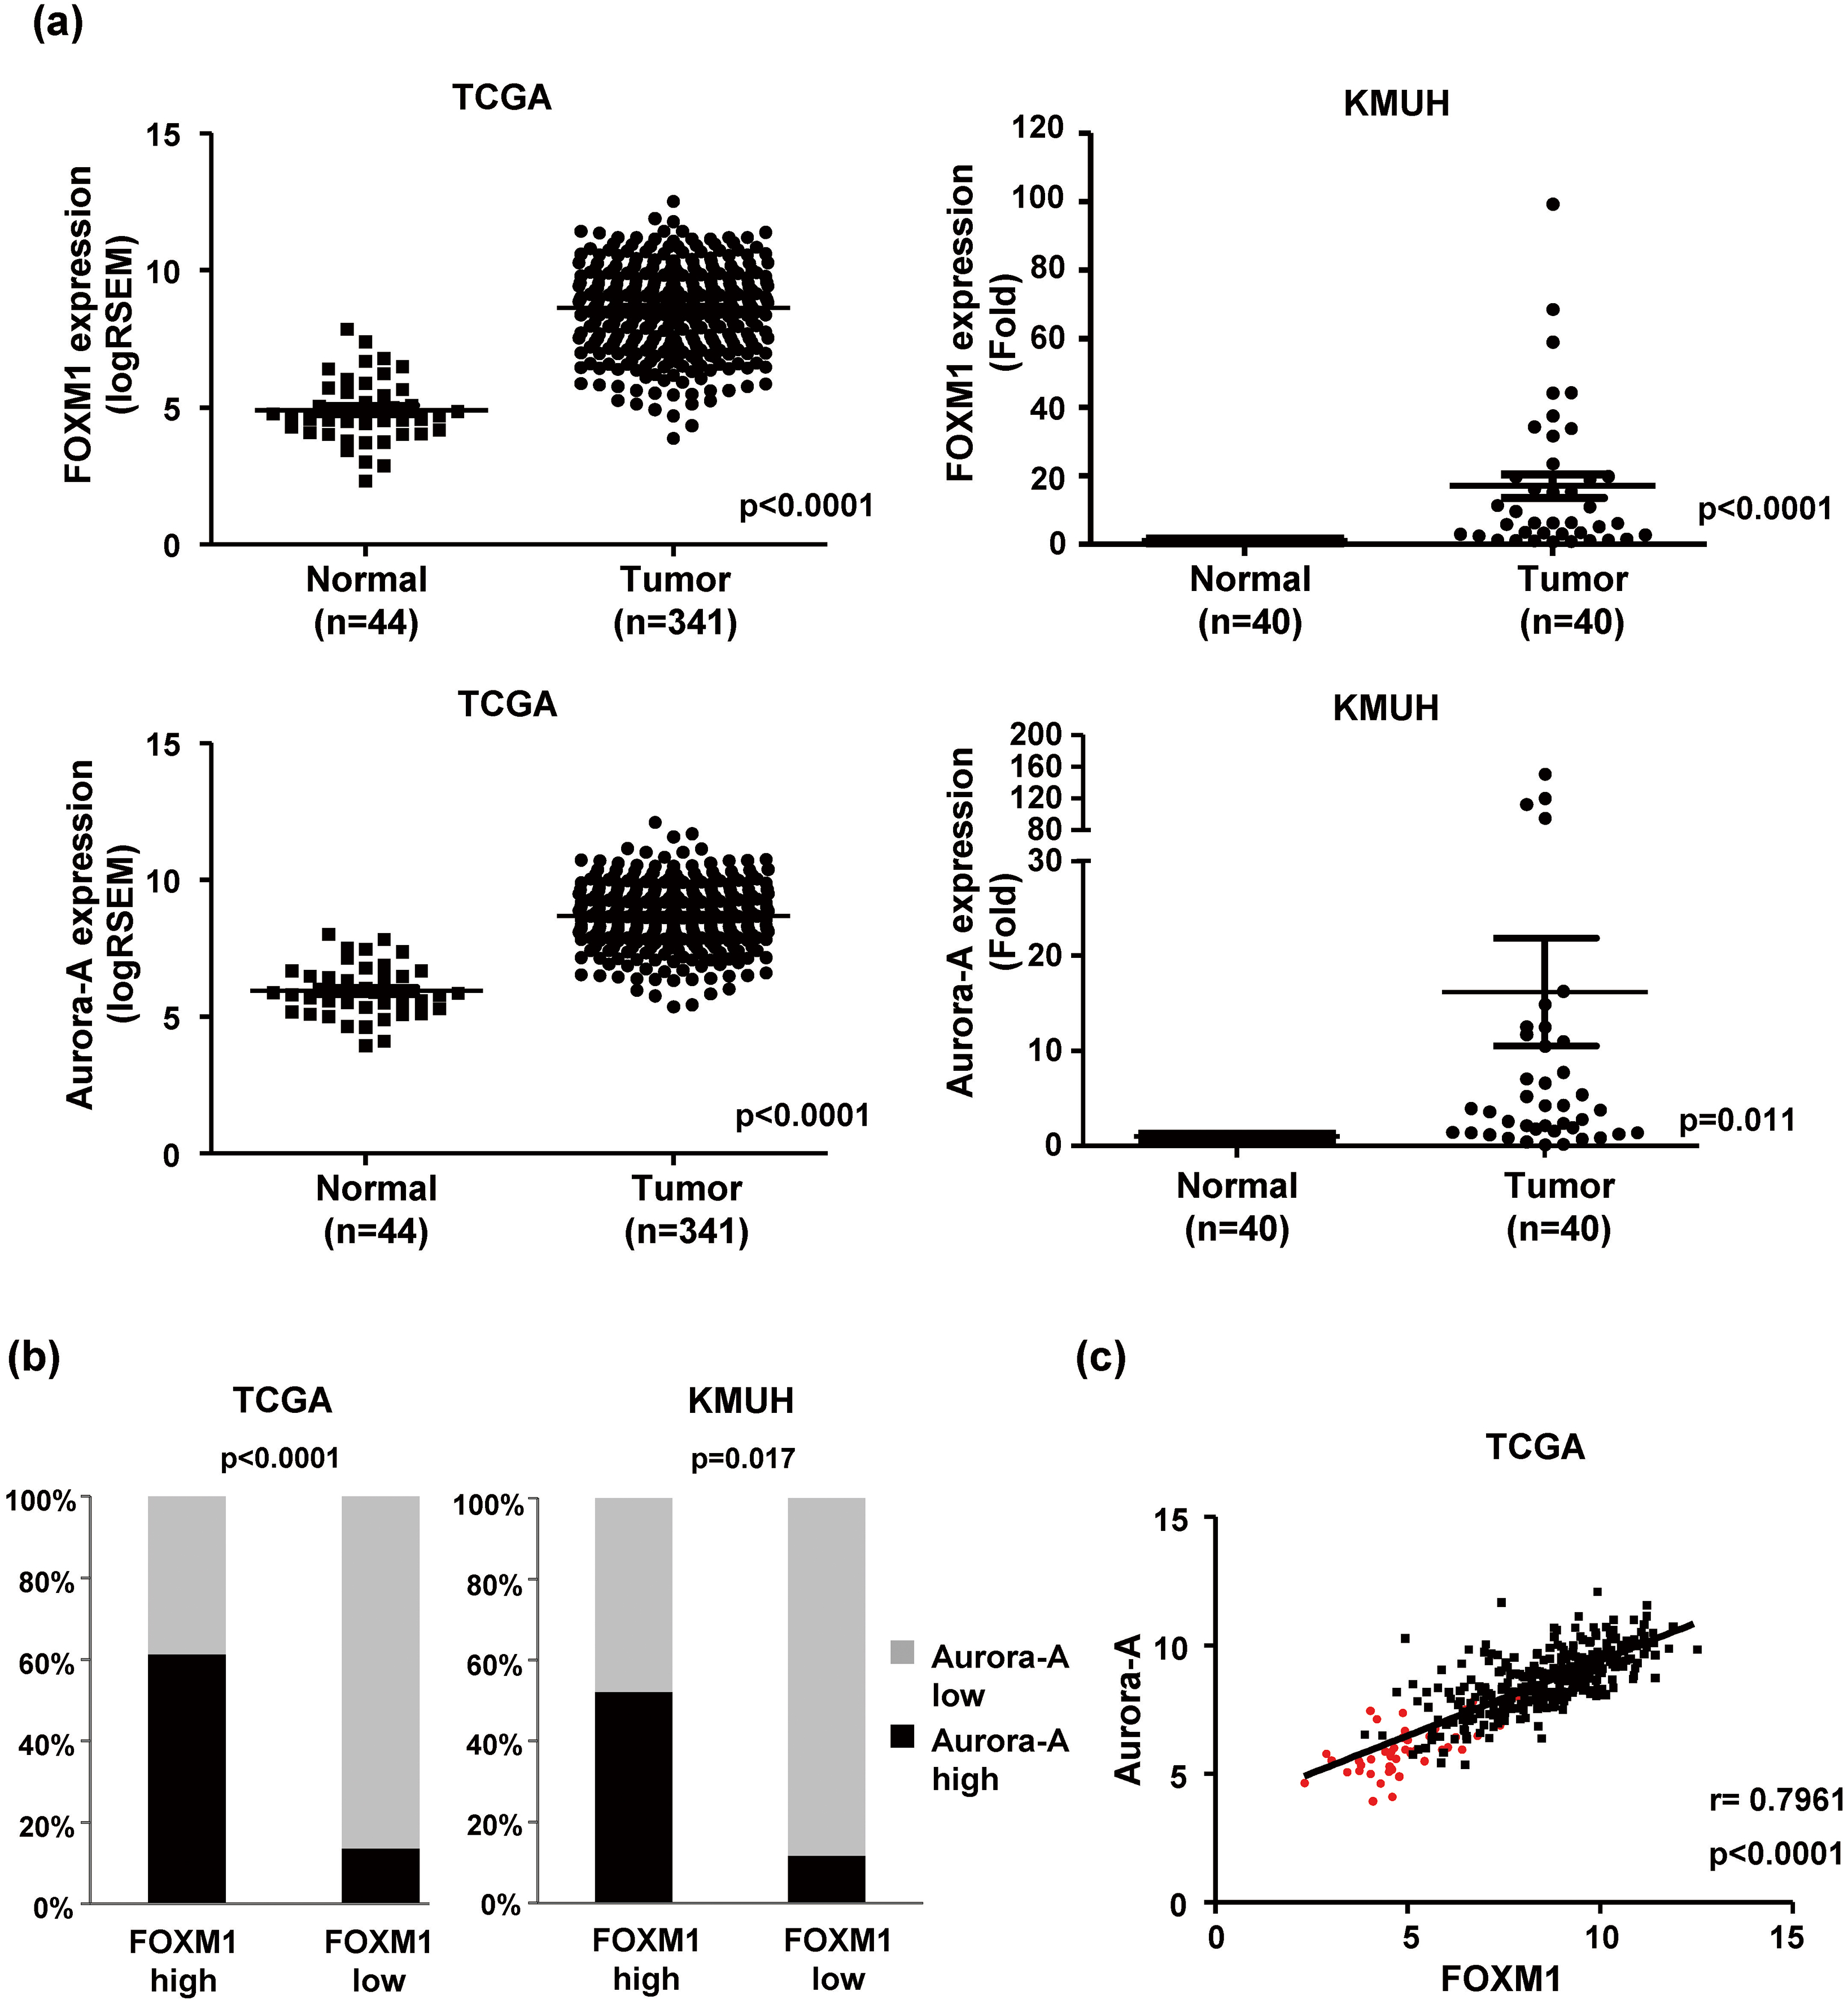
Overexpression of FOXM1 and Aurora-A are associated with poor prognosis in HCC. KaplanMeier curves of OS (Left) and RFS (Right) were estimated with different FOXM1 and Aurora-A expression status in the TCGA (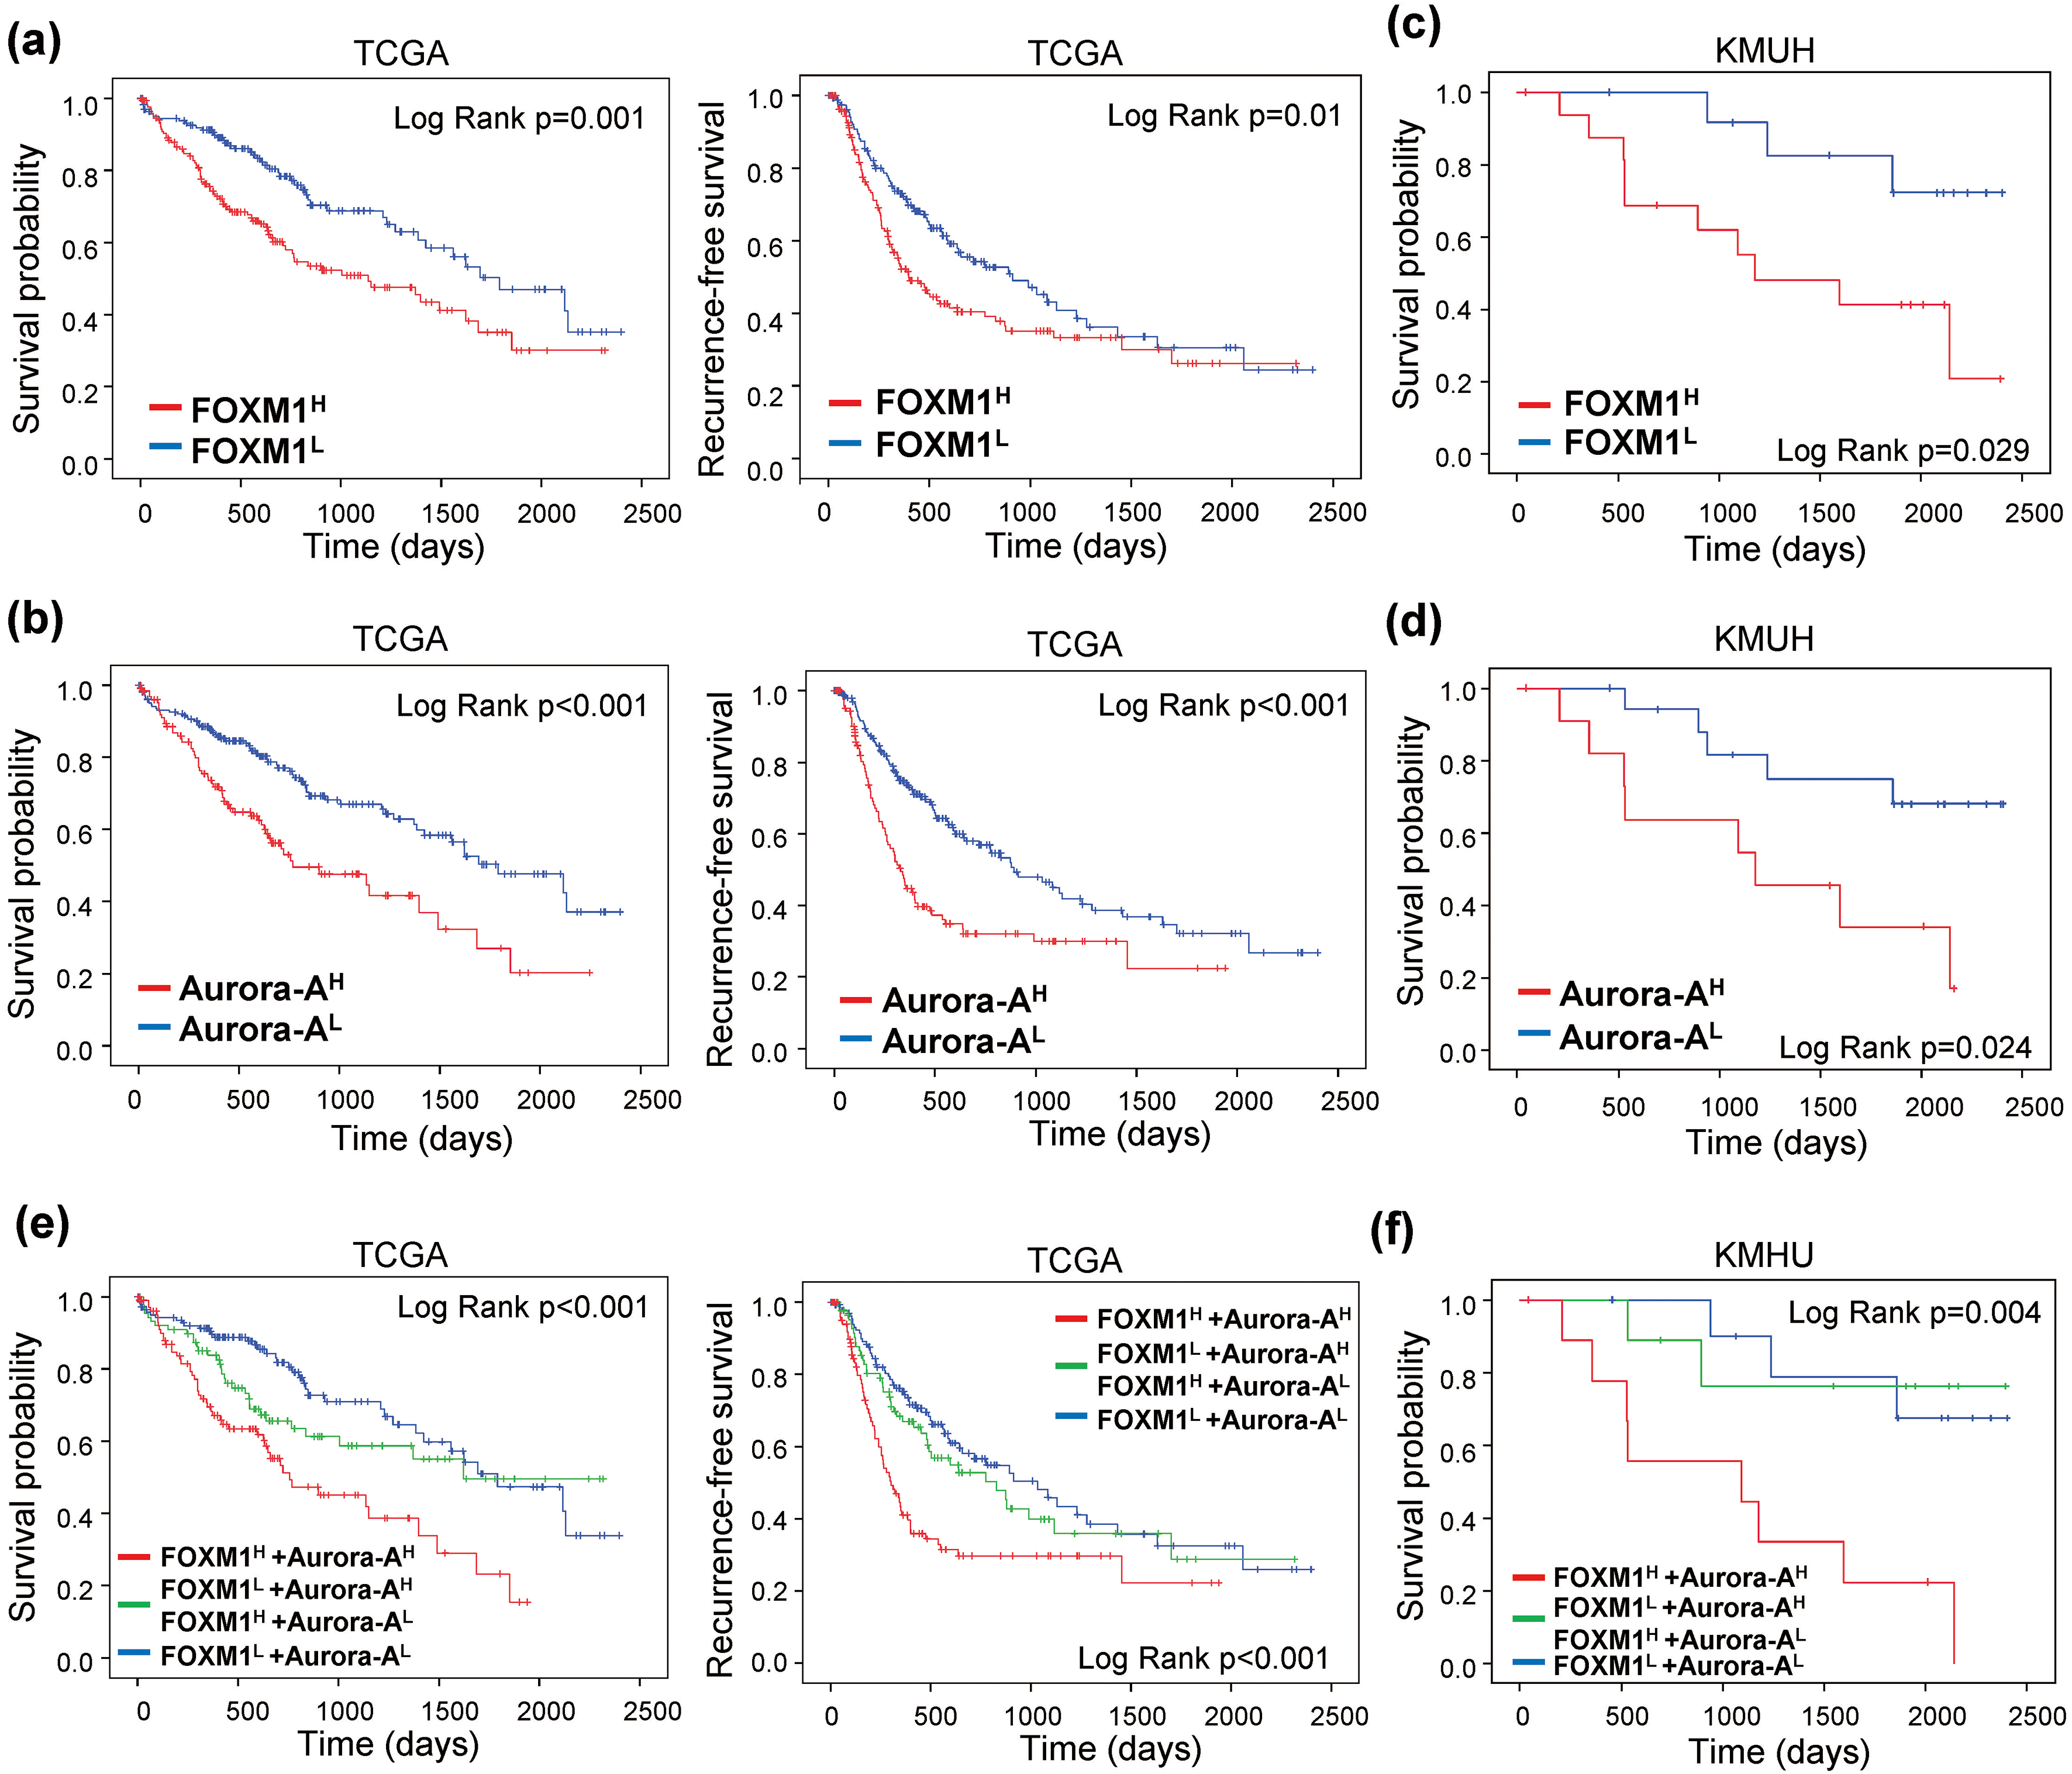
The correlation between clinical variables and FOXM1 and Aurora-A expression in HCC patients obtained from the TCGA dataset
Univariate and multivariate Cox regression analysis of variables associated with overall survival and recurrence-free survival in HCC from the TCGA dataset
Total RNA was isolated from fresh-frozen tissues derived from HCC patients using Trizol reagent (Invitrogen) according to the manufacturer’s instructions. Reverse transcription was performed using a High-Capacity cDNA Reverse Transcription Kit (Applied BioSystems). Diluted cDNA (10 ng) was used as a template, and the relative expression of each mRNA was evaluated using the StepOne Real-Time PCR Systems (Applied BioSystems). GAPDH mRNA was used as an internal control. The following primer sequences were used: for FOXM1, forward, 5’-ATACGTGGATTGAGG ACCACT-3’, and reverse, 5’-TCCAATGTCAAGTAGC GGTTG-3’; Aurora-A, forward, 5’-GCTGGAGAGCTT AAAATTGCAG-3’ and reverse, 5’-TTTTGTAGGTCT CTTGGTATGTG-3’; GAPDH, forward, 5’-AGCCACA TCGCTCAGACAC-3’, and reverse, 5’-GCCCAATAC GACCAAATCC-3’
siRNA and transfection
The FOXM1 siRNA was purchased from Santa Cruz (sc-43769), and siRNAs were transfected into cells by jetPRIME
Western blot analysis
Western blot analysis was performed as we previously described [15]. The used antibodies are listed below. FOXM1 (sc-376471) and p21 (sc-6246) were purchased from Santa Cruz. Aurora-A (610404), Aurora-B (611083), BubR1 (612502) were purchased from BD Biosciences. Survivin (GTX100052) was purchased from GENETEX. Actin (A2228) was purchased from Sigma-Aldrich.
Statistical analysis
All statistical analyses were performed using GraphPad Prism 5 (GraphPad Software, La Jolla, CA, USA) and SPSS 20.0 software (IBM, Chicago, USA). The two-tailed
Results
FOXM1 overexpression is correlated with Aurora-A upregulation in human HCC
We analyzed the expression pattern of FOXM1-related pathways in HCC from the TCGA dataset using the Gene Set Enrichment Analysis (GSEA). A total of 341 HCC and 44 normal tissues were included in the TCGA dataset. Eight FOXM1-related Gene Ontology (GO) biological process gene sets were significantly enriched in malignant HCC tissues (Table 2). Six of eight FOXM1-related gene sets were associated with cell cycle and DNA damage regulation. Knockdown of FOXM1 by siRNA decreased the expression of cell cycle-regulating proteins (Supplementary Fig. 1). This result showed that that FOXM1 is a critical cell cycle regulator. We found that Aurora-A (AURKA), a mitotic serine/threonine kinase, was involved in five FOXM1-related gene sets and showed significantly high enrichment in HCC than normal tissues. Overexpression of Aurora-A has been reported in a variety of solid tumors, including breast [16], colon [15], lung [17], and pancreas cancer [18]. The deregulation of Aurora-A may result in chromosomal instability and thus be related to tumorigenesis. Furthermore, Aurora-A has been identified as a target of FOXM1 in melanoma [19] and breast cancer [20]. Thus, we speculate that the level of FOXM1 may be increased in parallel with Aurora-A expression. We found that the relative expression of both the FOXM1 and Aurora-A mRNAs were significantly higher in HCC tissues than in adjacent liver tissues from the TCGA RNA-seq dataset. Consistently, the results of RT-qPCR indicated that the expression of FOXM1 and Aurora-A mRNAs were highly expressed in HCC tissues in the KMUH dataset (Fig. 1a). It was showed that 50.7% (173/341) and 37.8% (129/341) of patients with high FOXM1 and Aurora-A expression tissues from the TCGA dataset, respectively. The proportion of high FOXM1 and Aurora-A expression tissues in the KMUH dataset was 57.5% (23/40) and 35.0% (14/40), respectively. High Aurora-A expression was observed more frequently detected in high FOXM1 than in low FOXM1 tissues (61.3% vs. 13.7%, TCGA; 52.2% vs. 11.8%, KMUH) (Fig. 1b). We also found a positive linear correlation between FOXM1 and Aurora-A expression in HCC tissues (
Coordinated overexpression of FOXM1 and Aurora-A are associated with poor prognosis of HCC patients
To investigate the prognostic values of FOXM1 and Aurora-A expression in HCC, we separated the HCC patients into low- and high-expression groups. Patients with high FOXM1 expression (FOXM1
Moreover, F
We further confirm the association of FOXM1 and Aurora-A expression with OS and RFS by Cox regression analysis. Univariate Cox regression analysis demonstrated that T classification, M classification, stage, and FOXM1 and/or Aurora-A expression were all significantly associated with OS. T classification, stage, vascular invasion, and FOXM1 and/or Aurora-A expression were correlated with RFS. Subsequently, the significant characteristics factors from the univariate analyses were included for multivariate Cox regression analysis. The results showed that F
FOXM1 and Aurora-A expression predict the prognosis of sorafenib-treated patients in HCC. KaplanMeier curves of overall survival probability were estimated with different FOXM1 (a), Aurora-A (b), and FOXM1/Aurora-A (c) expression status in sorafenib-treated patients obtained from the TCGA dataset (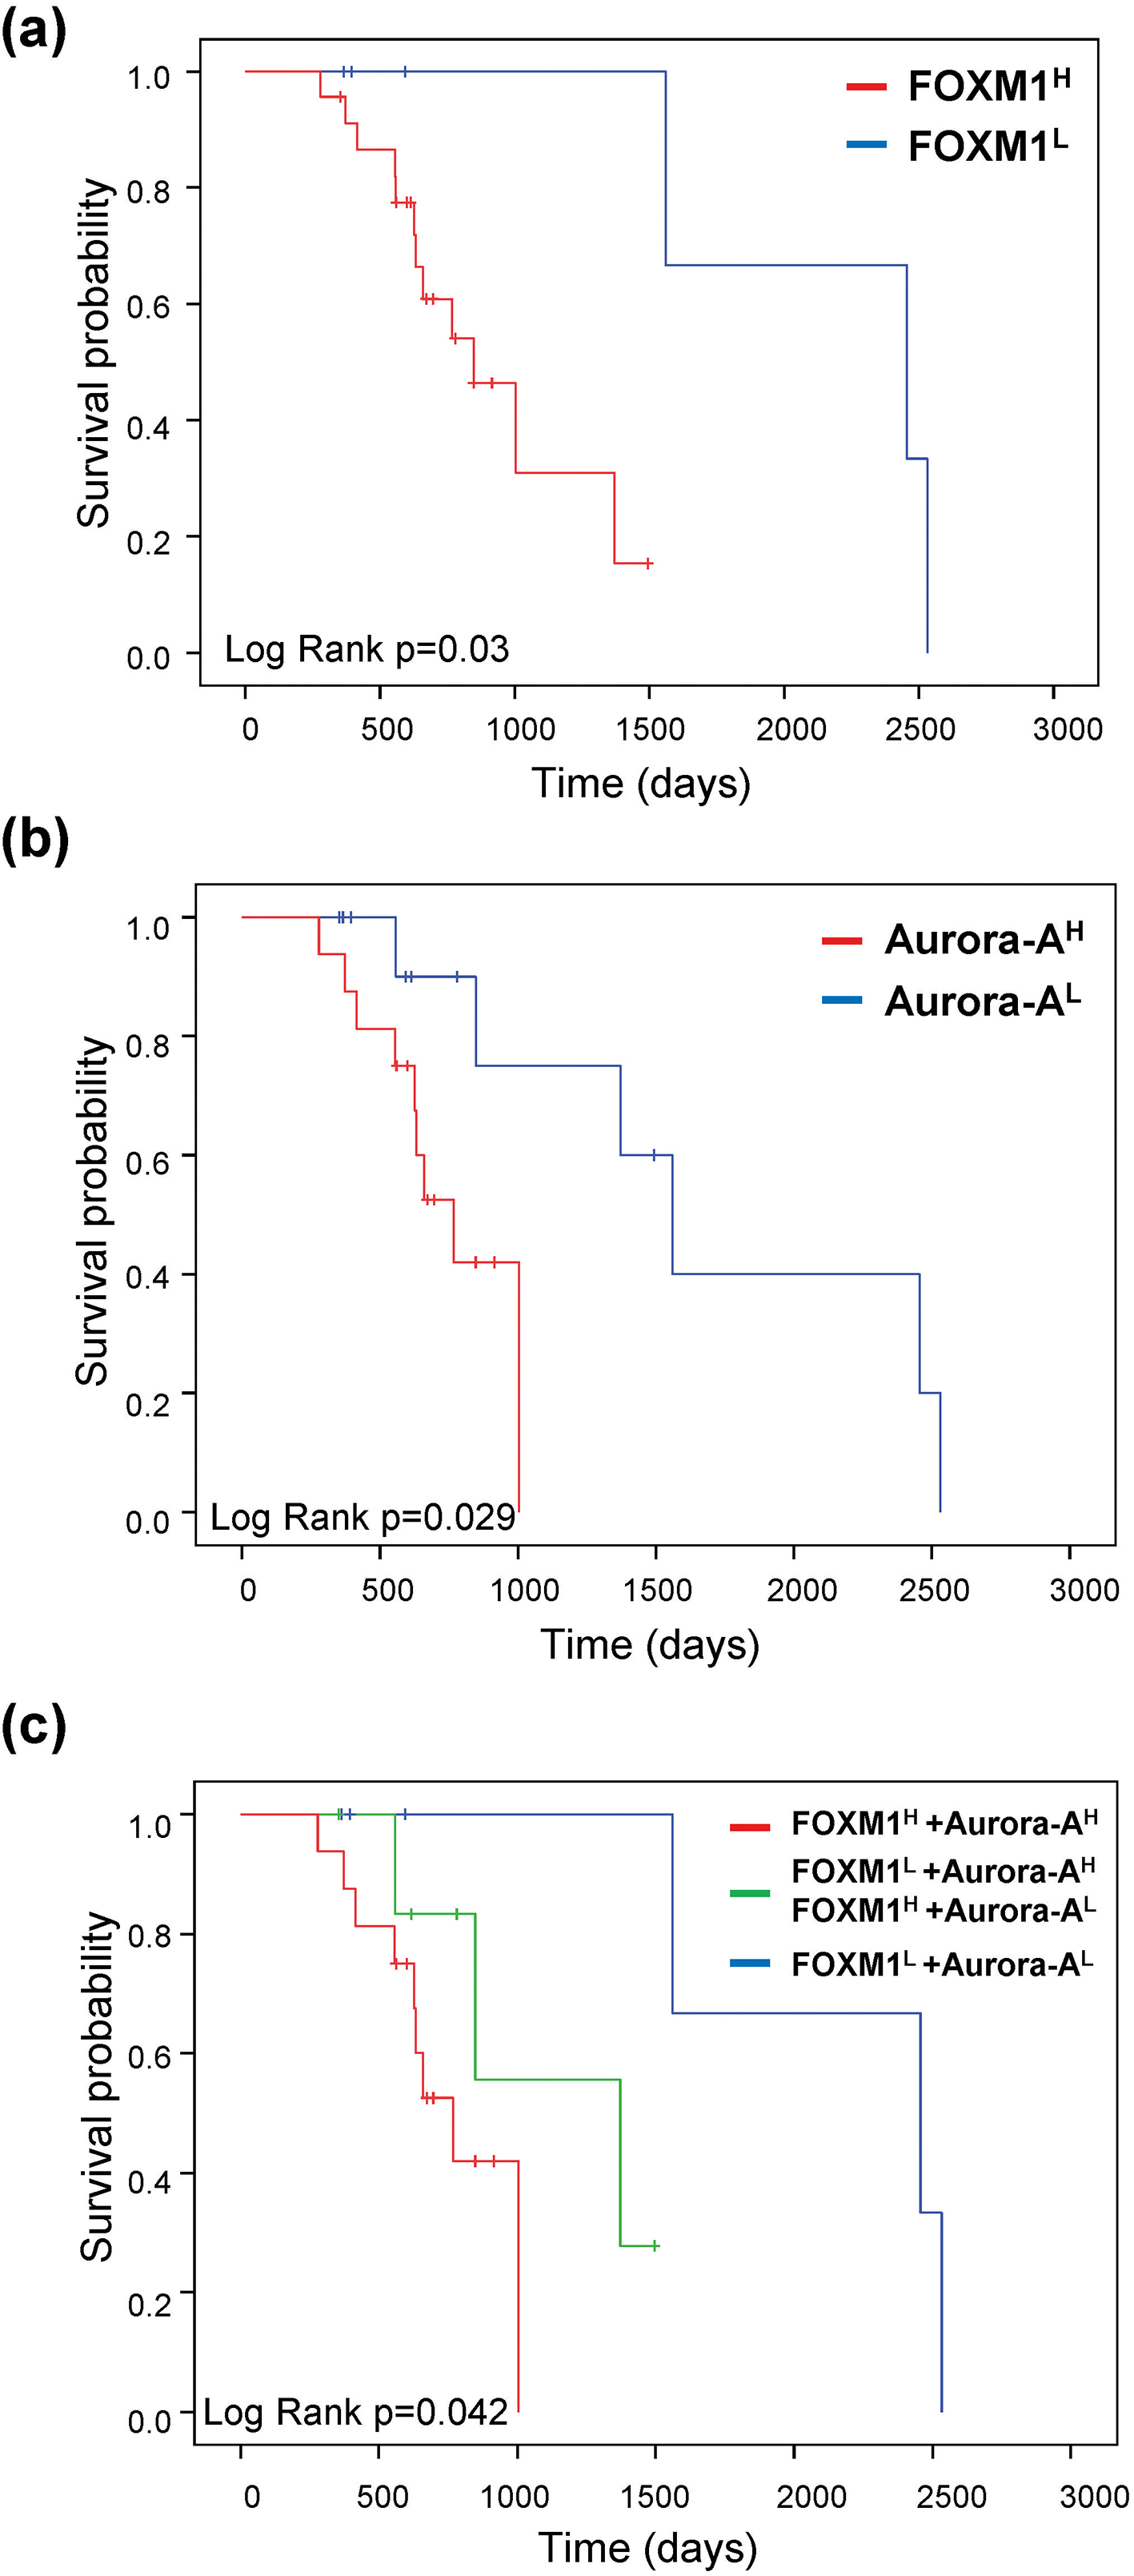
In a subsequent analysis, we found that the F
Discussion
Valid and precise biomarkers for identifying patients who have a poor prognosis are urgently needed to optimize their individual therapy. The development of powerful target-therapeutic drugs for HCC is also critical for this aggressive cancer. FOXM1 is a critical regulator in the G1/S and G2/M transitions of the cell cycle through regulating downstream targets such as centromere protein (CENP) F, cyclin B1, kinesin family member (KIF), p27
In this study, we determined the relationship of FOXM1 and Aurora-A expression and analyzed the significance of their expression on the prognosis of HCC. There was 31.1% (106/341) of patients with F
F
In univariate Cox regression analysis, F
Unlike other malignancies, such as breast [28] and lung cancer [29], which have reliable biomarkers for treatment decisions in clinical practice, there is no biomarker for selecting HCC patients who could benefit most from sorafenib. Previous studies showed that FOXM1 and Aurora-A are related to TKI resistance in lung cancer [11, 30]. The level of FOXM1 was correlated with sorafenib resistance in HCC cells. High FOXM1 expression was found in sorafenib-resistant cells, whereas low levels were observed in the comparatively sorafenib-sensitive cells [31, 32]. Furthermore, Aurora-A has been suggested to be a critical therapeutic target combine with sorafenib to improve the HCC patient’s drug resistance and prolong survival [33]. According to the above experimental results, we suppose that different levels of FOXM1 and Aurora-A react differently when exposed to sorafenib. In our pilot analysis of HCC specimens prove that the F
In conclusion, we found that the expression of FOXM1 was positively associated with the levels of Aurora-A in HCC. F
Footnotes
Acknowledgments
This work was supported by MOST grants (MOST 106-2320-B-037-001-MY3; MOST 107-2314-B-037-026) and KMUH grant (KMUH105-5R29).
Conflict of interest
The authors declare that they have no conflicts of interest.