
Abstract
BACKGROUND:
No tumor biomarker (TM) is available for de novo metastatic lung adenocarcinoma.
OBJECTIVE:
To examine the serum levels of carcinoembryonic antigen (CEA), cytokeratin-19 fragments (CYFRA21-1), neuron-specific enolase (NSE), carbohydrate antigen (CA) 19-9, CA125, tissue polypeptide antigen (TPA), tissue polypeptide specific antigen (TPS), and lactate dehydrogenase (LDH) to predict de novo metastatic lung adenocarcinoma.
METHODS:
This was a retrospective study of geriatric (
RESULTS:
The positive rates of LDH and TMs were higher in the metastatic group (all
CONCLUSIONS:
Abnormal level of LDH and TMs, alone or in combination, had predictive value for metastasis in geriatric patients with lung adenocarcinoma; these indicators were also associated with the metastatic site.
Introduction
Lung cancer is the leading cause of cancer-related mortality in the world [25]. Non-small cell lung cancer (NSCLC) accounts for
Imaging examinations like computed tomography (CT), ultrasound, and magnetic resonance imaging (MRI) provide information about local and distant metastases, but pathological examination remains the gold standard for the diagnosis of metastasis. Traditional imaging cannot detect lesions
Therefore, to explore single or combinations of biomarkers for the prediction and diagnosis of metastatic lung adenocarcinoma is an urgent problem to be solved. The aim of the present study was to examine the serum levels of CEA, CYFRA21-1, NSE, carbohydrate antigen (CA) 19-9, CA125, tissue polypeptide antigen (TPA), tissue polypeptide specific antigen (TPS), and LDH in elderly patients with lung adenocarcinoma and to investigate the sensitivity and specificity of those biomarkers to predict and diagnose de novo distant metastasis.
Materials and methods
Study design and patients
This was a retrospective study of geriatric (
The inclusion criteria were: 1) diagnosis of NSCLC; and 2)
Data collection
All patients underwent percutaneous lung biopsy, lung resection, and biopsy at the metastatic site. Pathological diagnosis was performed by at least two pathologists. Pathological diagnosis is the gold standard for the diagnosis of lung cancer.
The patients were divided into the metastatic (
LDH and tumor markers
Fasting blood samples were taken before the patients had received any cancer treatment. Fasting blood samples were centrifuged (3000 rpm) for 10 min to obtain the serum. CEA, CYFRA21-1, CA199, NSE, CA125, TPA, and TPS were detected by enzyme-linked immunosorbent assay (ELISA) using TECAN and reagent kits (IDL Biltech, Sweden). LDH was detected by LDH kit (diasys, shanghai, China). The normal values of these TMs were previously established by our hospital and according to the literature [8]: CEA
Study flowchart.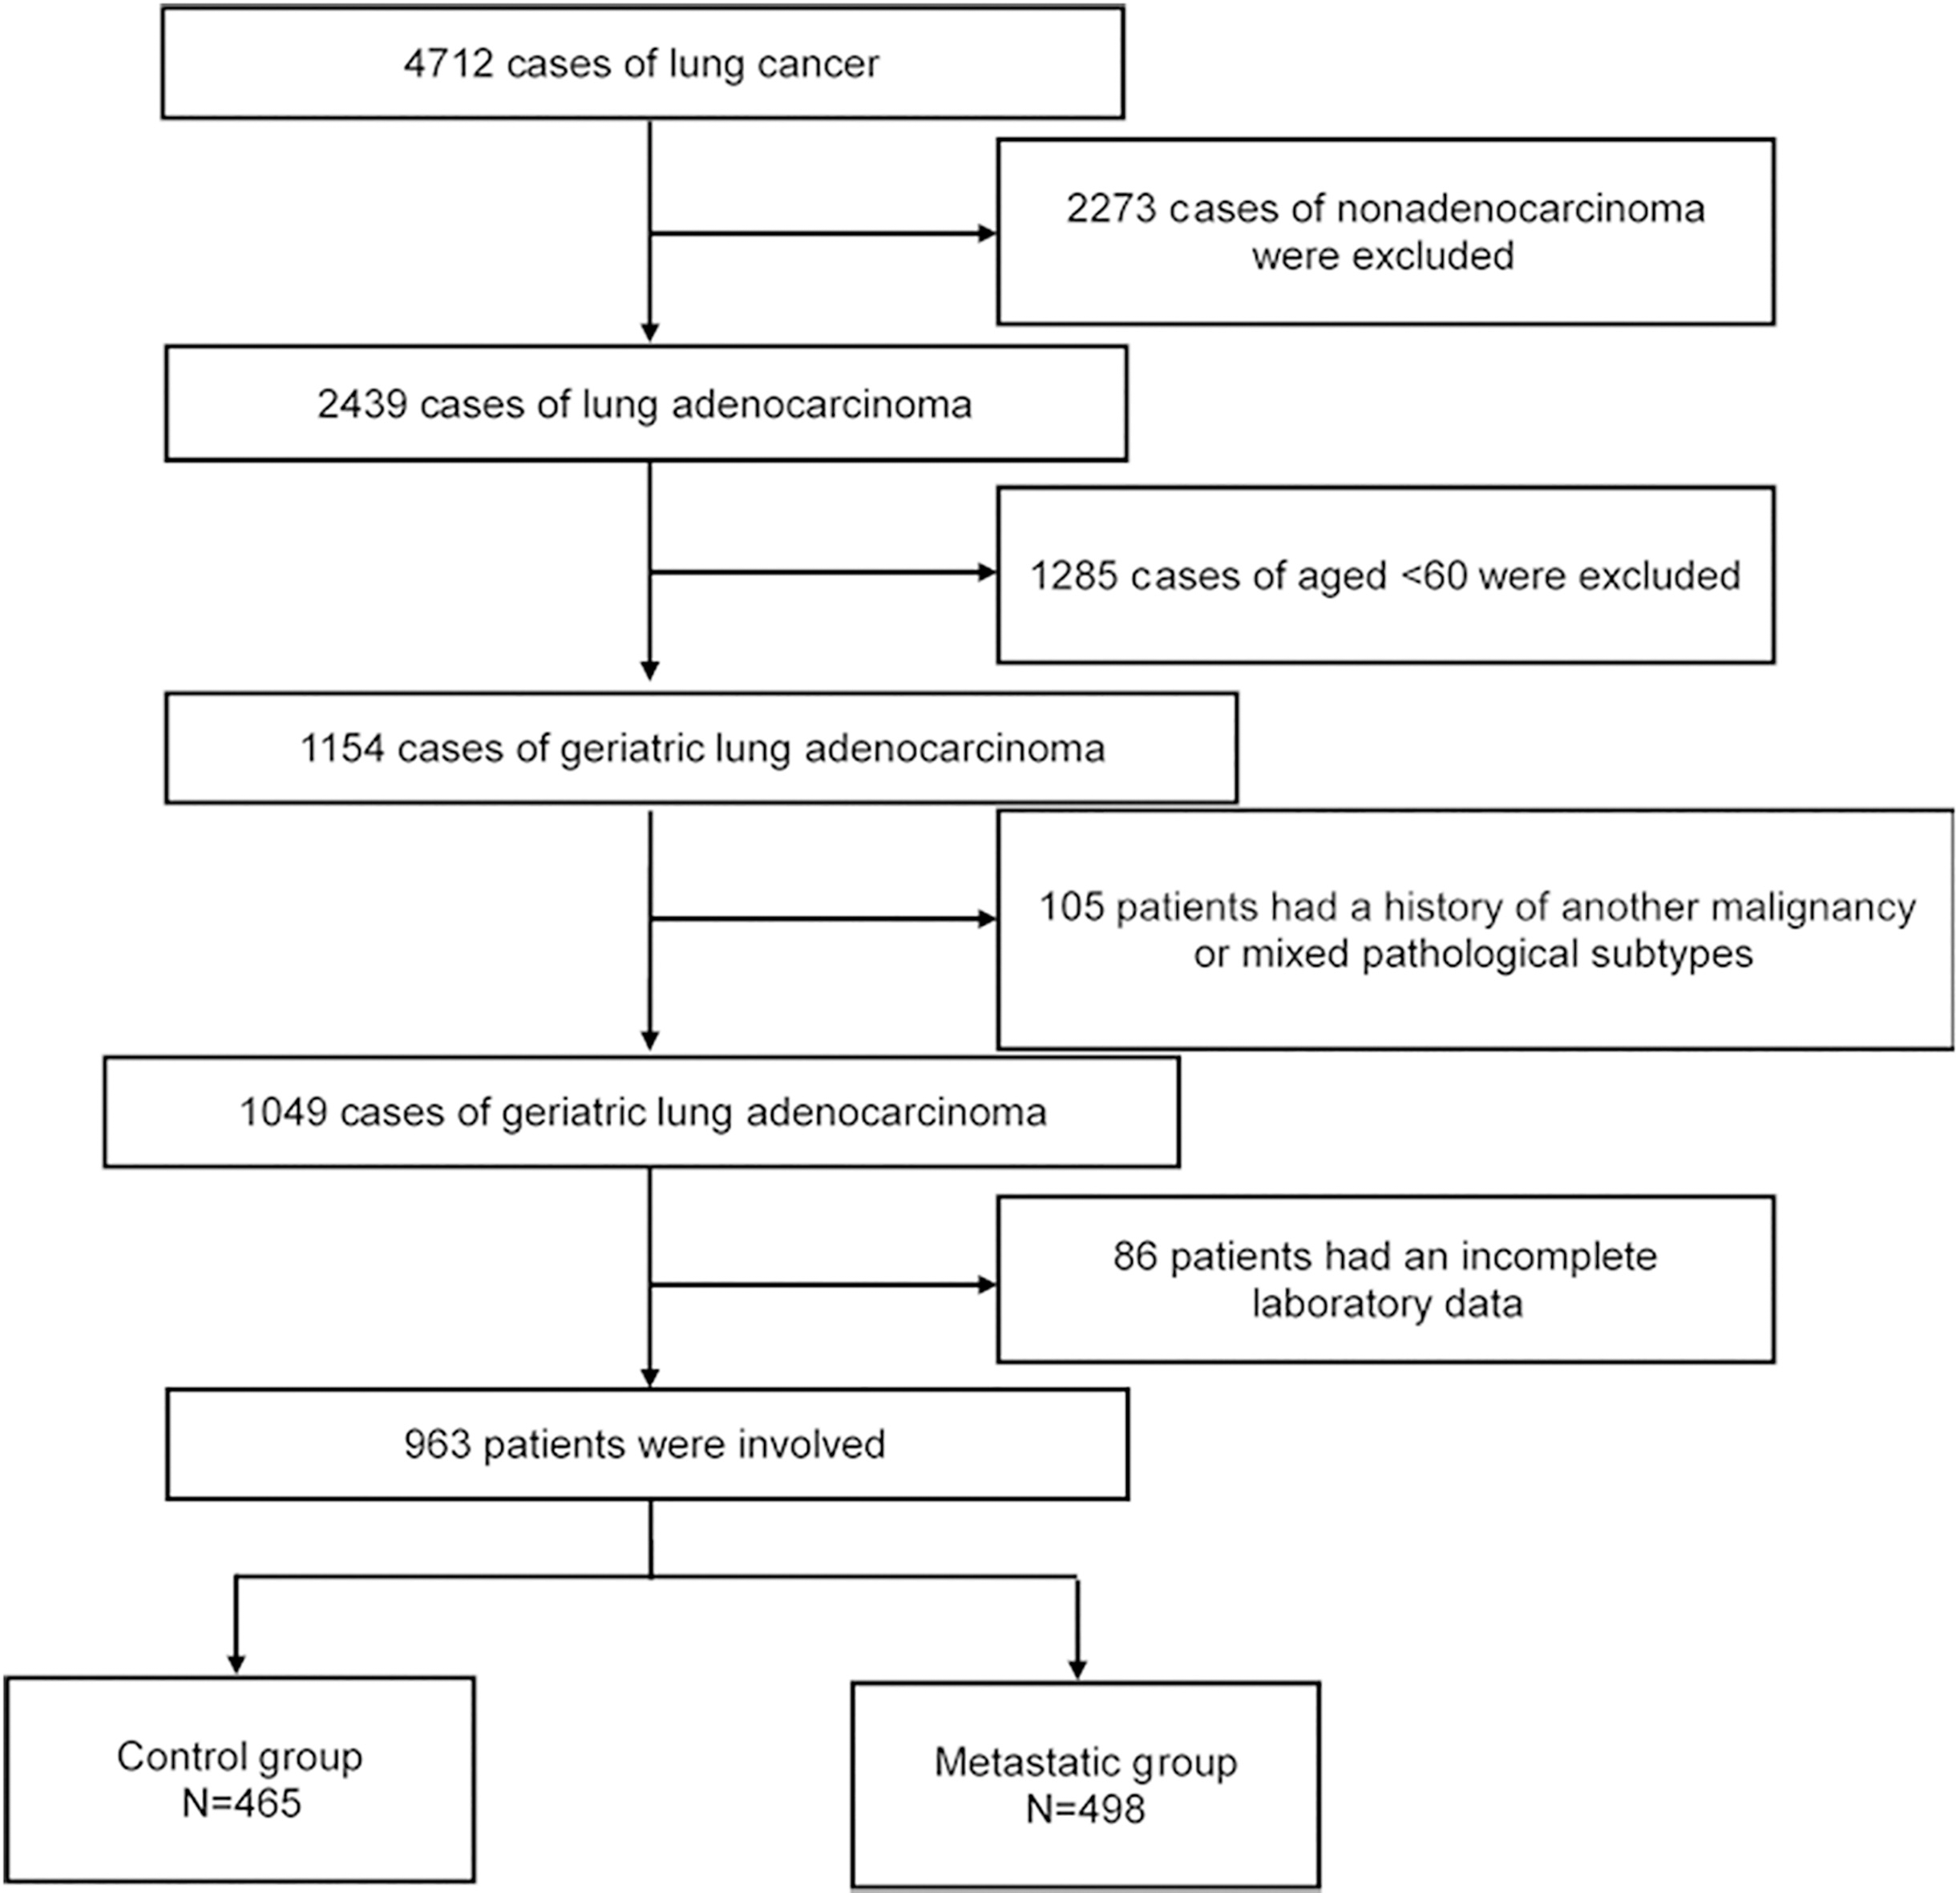
All data were analyzed using SPSS 22.0 for windows (IBM, Armonk, NY, USA). Continuous data were tested for normal distribution using the Kolmogorov-Smirnov test. Normally distributed continuous data are presented as means
Characteristics of the elderly patients with lung adenocarcinoma
Characteristics of the elderly patients with lung adenocarcinoma
Patients and tumor characteristics
Figure 1 presents the study flowchart. Among the 963 geriatric patients with lung adenocarcinoma and with available TMs between February 2012 and December 2017, 498 were metastatic and 465 were non-metastatic (Fig. 1). Table 1 presents the characteristics of the patients. The 963 patients were 60 to 88 years old (mean of 67.4
Comparison of the tumor markers according to lung adenocarcinoma metastasis in elderly patients
Comparison of the tumor markers according to lung adenocarcinoma metastasis in elderly patients
LDH
The serum levels and positive rate of LDH and serum TMs such as CEA, CYFRA21-1, CA199, NSE, CA125, TPA, and TPS in the metastatic group were all higher than in the control group (
Univariable and multivariable analyses of the associations of various tumor markers with lung adenocarcinoma metastasis in elderly patients
Univariable and multivariable analyses of the associations of various tumor markers with lung adenocarcinoma metastasis in elderly patients
LDH
ROC curve analysis of different markers to predict the metastatic status. (A) Individual tumor markers. (B) Combinations of tumor markers.
The highest AUC of single TM was achieved by CA125 (AUC
The areas under the ROC curves of the different indicators
The areas under the ROC curves of the different indicators
LDH
The best sensitivity and specificity of single TM were achieved with CYFRA21-1 (70.5%) and CA199 (92.0%), respectively. The highest and lowest Youden’s index of single TM were 38.4% and 12.3% respectively. Furthermore, when using any combination of LDH and another TM to predict the metastatic status, the highest sensitivity and specificity were achieved for CYFRA21-1
Diagnostic value of different indicators for metastatic lung adenocarcinoma
LDH
The 498 metastatic patients were further analyzed for the associations of the TMs with various metastatic sites (Table S1). High LDH status (OR
Discussion
No TM has been examined for the diagnosis of de novo metastatic lung adenocarcinoma. Therefore, this study aimed to examine the serum levels of CEA, CYFRA21-1, NSE, CA19-9, CA125, TPA, TPS, and LDH in elderly patients with lung adenocarcinoma to predict de novo metastatic disease. The results suggest that abnormal level of LDH and TMs, alone or in combination, had predictive value for metastasis in geriatric patients with lung adenocarcinoma; these indicators were also associated with the metastatic site.
LDH is a key enzyme in glycolysis and is related to the survival and proliferation of cancer-initiating cells [29]. Abnormally high levels of LDH are associated with distant metastasis and indicate a poor prognosis in lung cancer [5, 9, 12, 13]. LDH levels at presentation of stage IV NSCLC have been shown to be independently associated with the metastatic burden of NSCLC [12]. Increased levels of TMs like CEA, CYFRA21-1, NSE, and CA125 are commonly used in the diagnosis, treatment decisions, response evaluation, and prognosis [3, 4, 10, 15, 16, 19, 21]. In the present study, the results were consistent with the above studies. Beside these indicators, CA199, TPA, and TPS were included in this study to clarify their predictive value for metastasis. Primarily, the levels and the abnormal rates of LDH and TMs in the metastatic group were obviously higher than in the control group. In the present study, when using only one TM to diagnose metastasis, CA125 was the best one with 65.5% sensitivity and 72.9% specificity. The sensitivity of CA125 was the highest, while the best specificity was CA199 (92.0%). Furthermore, a combination of any two TMs was also used. The combination of CYFRA21-1 and TPA had the highest sensitivity, with 77.1%, and the best specificity was CA199 and NSE or TPA, with 84.1%. The CYFRA21-1 and CA125 combination had the highest Youden’s index with 41.1%. Molina et al. [16] found that the sensitivity and specificity of a panel of TMs (CA153, SCC, CEA, CYFRA21-1, pro-GRP, and NSE) reached 88.5% and 82% to diagnosed lung cancer. Maybe due to the selection of participants, the sensitivity was not so high in the present study.
The metastasis of different sites may accompanied by the elevation of different indicators. The most frequently metastatic site of adenocarcinoma are lung, bone, and brain when not including pleural metastasis [18]. In the present study, pleural metastasis had a high incidence (51.7%). The occurrences of brain, liver, bone, adrenal, and lung were 31.5%, 9.8%, 20.3%, 11.8%, and 26.7%, respectively. High serum levels of CEA are considered to be an independent risk factor for brain metastasis development in lung adenocarcinoma [2]. In addition, Lee et al. [11] reported that CEA levels were related to brain, bone, and lung metastasis, but not pleura in advanced NSCLC. The present study showed that serum CEA levels were associated with brain metastasis in geriatric patients with lung adenocarcinoma, but not pleura, bone, liver, adrenal and lung metastasis. In advanced NSCLC, the levels of CYFRA21-1 were reported to have a relationship with metastatic occurrence in brain, bone, liver, lung, and pleura. The NSE levels only correlate with brain and bone metastasis [32]. Nevertheless, CYFRA21-1 was relevant to brain, bone, and lung metastasis in lung adenocarcinoma, but not liver, adrenal, and pleura in the present study. The discrepancies may due to the different subtypes of lung cancer.
The serum levels of LDH and TMs investigated here were inclined and prone to abnormality in the metastatic group. The assessment of these indicators could be clinically helpful for determining whether lung adenocarcinoma has a high likelihood of being metastatic at presentation. In previous studies, more attention had been paid to differentiate between malignant and benign lung lesions [31]. Nevertheless, identifying the presence of distant metastasis is equally important for the proper management of the patients [22]. The present study strongly suggests that the proper use of LDH and TMs can indicate metastasis and the site of metastasis. Taken together, negative CA199 singly has higher specificity and the combination of CYFRA21-1 and CA125 has higher value to predict metastasis in elderly patients with lung adenocarcinoma.
The present study has limitations. The patients were from a single center and were selected. Only adenocarcinoma was studied and the other types of lung cancer should also be explored. In addition, the retrospective nature of the study limits the analysis to the available data, Further studies are needed to validate the results in multiple centers and the predictive value of TMs should be determined in non-elderly patients.
In conclusion, abnormal level of LDH and TMs, alone or in combination, had predictive value for metastasis in geriatric patients with lung adenocarcinoma; these indicators were also associated with the metastatic site.
Footnotes
Conflict of interest
The authors declare that they have no conflict of interest.
Supplementary Table
Univariable and multivariable analyses of the predictive indicators for the site of metastasis in elderly lung adenocarcinoma
Characteristics
Univariable analysis OR (95% CI)
Multivariable analysis OR (95% CI)
Brain
LDH
0.019
Negative
Reference
Reference
Positive
2.238 (1.561–3.207)
1.592 (1.079–2.349)
CEA
Negative
Reference
Reference
Positive
2.899 (1.942–4.328)
2.321 (1.535–3.511)
CYFRA21-1
0.001
Negative
Reference
Reference
Positive
2.735 (1.931–3.874)
1.899 (1.293–2.787)
CA199
0.023
0.921
Negative
Reference
–
Positive
1.493 (1.057–2.110)
–
NSE
0.001
0.346
Negative
Reference
–
Positive
2.590 (1.478–4.539)
–
CA125
0.022
Negative
Reference
Reference
Positive
2.306 (1.630–3.262)
1.549 (1.066–2.253)
TPA
0.100
Negative
Reference
–
Positive
2.260 (1.595–3.204)
–
TPS
0.406
Negative
Reference
–
Positive
1.932 (1.368–2.730)
–
Bone
LDH
0.021
Negative
Reference
Reference
Positive
2.218 (1.447–3.400)
1.704 (1.086–2.674)
CEA
0.387
Negative
Reference
Positive
1.206 (0.789–1.844)
CYFRA21-1
Negative
Reference
Reference
Positive
2.699 (1.777–4.099)
2.329 (1.502–3.610)
CA199
0.067
Negative
Reference
Positive
1.474 (0.973–2.234)
NSE
0.066
Negative
Reference
Positive
1.904 (0.959–3.780)
CA125
0.028
Negative
Reference
Reference
Positive
1.596 (1.050–2.425)
3.590 (2.613–4.931)
TPA
0.064
Negative
Reference
Positive
2.373 (1.564–3.600)
TPS
0.088
Negative
Reference
Positive
1.439 (0.948–2.184)
Liver
LDH
Negative
Reference
Reference
Positive
4.309 (2.398–7.742)
3.795 (2.093–6.879)
Table S1, continued
Characteristics
Univariable analysis OR (95% CI)
Multivariable analysis OR (95% CI)
CEA
0.313
Negative
Reference
Positive
1.364 (0.746–2.492)
CYFRA21-1
0.099
Negative
Reference
–
Positive
2.982 (1.660–5.360)
–
CA199
0.042
0.317
Negative
Reference
–
Positive
1.817 (1.022–3.233)
–
NSE
0.056
Negative
Reference
–
Positive
4.165 (1.971–8.801)
–
CA125
0.001
0.007
Negative
Reference
Reference
Positive
2.770 (1.547–4.959)
2.280 (1.256–4.136)
TPA
0.003
0.175
Negative
Reference
–
Positive
2.395 (1.344–4.268)
–
TPS
0.025
0.513
Negative
Reference
–
Positive
1.934 (1.087–3.441)
–
Adrenal
LDH
0.099
Negative
Reference
–
Positive
2.877 (1.688–4.904)
–
CEA
0.332
Negative
Reference
Positive
1.312 (0.758–2.272)
CYFRA21-1
0.003
0.984
Negative
Reference
–
Positive
2.263 (1.333–3.842)
–
CA199
0.260
Negative
Reference
Positive
1.357 (0.798–2.310)
NSE
Negative
Reference
Reference
Positive
6.080 (3.161–11.694)
4.151 (2.086–8.258)
CA125
0.002
0.050
Negative
Reference
–
Positive
2.297 (1.353–3.901)
–
TPA
0.001
Negative
Reference
Reference
Positive
3.479 (2.030–5.963)
2.715 (1.541–4.785)
TPS
0.472
Negative
Reference
–
Positive
2.794 (1.633–4.782)
–
Pleural
LDH
0.007
0.148
Negative
Reference
–
Positive
1.553 (1.128–2.139)
–
CEA
0.001
0.146
Negative
Reference
–
Positive
1.709 (1.259–2.319)
–
CYFRA21-1
0.001
0.348
Negative
Reference
–
Positive
1.665 (1.235–2.244)
–
CA199
0.023
0.696
Negative
Reference
–
Positive
1.410 (1.049–1.895)
–
LDH
Table S1, continued
Characteristics
Univariable analysis OR (95% CI)
Multivariable analysis OR (95% CI)
NSE
0.556
Negative
Reference
Positive
1.186 (0.673–2.091)
CA125
Negative
Reference
Reference
Positive
4.129 (3.045–5.599)
4.223 (3.107–5.739)
TPA
0.075
Negative
Reference
Positive
1.320 (0.972–1.793)
TPS
0.265
Negative
Reference
Positive
1.186 (0.879–1.599)
Lung
LDH
Negative
Reference
Reference
Positive
3.191 (2.326–4.377)
2.616 (1.750–3.911)
CEA
0.090
Negative
Reference
–
Positive
2.043 (1.575–2.651)
–
CYFRA21-1
0.001
Negative
Reference
Reference
Positive
3.214 (2.419–4.270)
2.057 (1.357–3.117)
CA199
0.001
0.881
Negative
Reference
–
Positive
1.562 (1.199–2.034)
–
NSE
0.316
Negative
Reference
–
Positive
3.880 (2.079–7.243)
–
CA125
0.008
Negative
Reference
Reference
Positive
4.660 (3.459–6.279)
1.721 (1.155–2.565)
TPA
0.638
Negative
Reference
–
Positive
2.339 (1.763–3.104)
–
TPS
0.192
Negative
Reference
Positive
1.655 (1.267–2.161)
–